National Action Plan
For Youth Employment in Cyprus
(2014-2017)
(11December 2014)

National Action Plan for Youth Employment 2014-2017
ii
Table of contents
Contents PART I – SITUATION ANALYSIS ................................................................................................... 1
1. Overview of the social and economic context .............................................................. 1
2. Analysis of the labour market ....................................................................................... 3
2.1. Demographic trends .............................................................................................. 3
2.2. Trends in education ............................................................................................... 3
2.3. The youth labour market ....................................................................................... 5
3. Policies affecting youth employment .......................................................................... 19
3.1. Macroeconomic and sectoral policies ................................................................. 19
3.2. Education and training policy .............................................................................. 20
3.3. Labour market policies and institutions .............................................................. 22
PART II ‐ PRIORITY POLICIES .................................................................................................... 26
1. Problem identification ................................................................................................. 26
2. Policy priorities ............................................................................................................ 29
Priority 1: Preventing early school leaving and easing the transition from school to work
......................................................................................................................................... 30
Priority 2: Establishing activation strategies through targeted labour market policies .. 30
Priority 3: Introducing the National Youth Guarantee …………………………………………………31
Priority 4: Boosting labour demand through sectoral growth, promotion of micro‐ and
small enterprises and entrepreneurship development .................................................. 31
Priority 5: Plan outreach strategies to increase labour market integration of young
people .............................................................................................................................. 32
Priority 6: Enhancing the effectiveness and impact of employment services and labour
market policies ................................................................................................................ 33
Priority 7: Establishing a Monitoring and Evaluation System……………………………………….33
PART III ACTION PLANNING ..................................................................................................... 34
1. Goal .............................................................................................................................. 34
2. Specific youth employment objectives and targets .................................................... 34
3. Outcomes and indicatorsbased on the 7 Policy Priorities ........................................... 37
Policy Priority 1: Timely intervention for early school leavers and easing the transition
from school to work ........................................................................................................ 37
Policy Priority 2: To reform the design and implementation of labour market policies
targeting youth (15‐29) ................................................................................................... 41
National Action Plan for Youth Employment 2014-2017
iii
Policy Priority 3: Implementing a National Youth Guarantee………………………………….44
Policy Priority 4: Promote Entrepreneurship as a career path ‐ Boosting labour demand
through sectoral growth, promotion of micro‐ and small enterprises and
entrepreneurship development ...................................................................................... 53
Policy Priority 5: Reducing youth labour market detachment through outreach activities
......................................................................................................................................... 54
Policy Priority 6: Enhancing the Effectiveness and impact of employment services and
labour market policies…………………………………………………………………………………………………………56
Policy Priority 7: Monitoring and evaluation of labour market policies ......................... 59
4. Resources .................................................................................................................... 63
Annexes
Annex 1 ‐ Operational Planning Matrix.......................................................................68
National Action Plan for Youth Employment 2014-2017
iv
List of tables, figures and boxes
Table 1. Key macroeconomic indicators and projections, Cyprus (2008‐2016).........................1
Table 2. Population estimates and projections,1990‐2050.......................................................3
Table 3 Youth (15‐24) activity, employment and unemployment rates by educational attainment, (2012).........................................................................................................................................4
Table 4. Education and occupation mismatch as a function of ISCO and ISCED, 2012, (thousands)..............................................................................................................................12
Table 5: Structure of youth employment, 2001‐2012 (%).......................................................13
Table 6. PES staff and ratios staff‐to‐registered unemployed................................................24
Table 7: Process and outcome indicators of labour market policies.......................................53
Figure 1: Early school leavers in Cyprus and the European Union, 2003‐2012 (%)...................4
Figure 2: Projections of youth and adult unemployment rates (%)...........................................5
Figure 3. Projections of employment‐to‐population ratio, by age group (%)............................6
Figure 4: Labour force participation of youth (15‐24) by sex, 2000‐2012.................................7
Figure 5: Changes in employment, youth and adults, Cyprus and EU27, 2008‐2012 (percentage points)....................................................................................................................8
Figure 6.Sectoral contribution to total and youth employment, 2012 (%)...............................9
Figure 7. Job vacancies as a share of wage employment, NACE 1‐digit sector (%)..................10
Figure 8. Employment by occupation, average share in total employment (%)......................11
Figure 9: Young workers in temporary work, by sex , 2007‐2012, (%)....................................13
Figure 10: Mean monthly earnings by economic sectors, working age population and youth, 2010 (€)....................................................................................................................................15
Figure 11: Youth unemployment rate, by sex, 2000‐2013, (%)................................................16
Figure 12: Changes in unemployment rates, youth and adults, 2008‐2012 (percentage points)16
Figure 13: Administrative and survey‐based unemployment, 2007‐2013...............................23
Figure 14: Sequencing of measures of the Cyprus Youth Guarantee......................................45
Box 1: Main youth employment challenges..............................................................................27
National Action Plan for Youth Employment 2014-2017
1
PART I – SITUATION ANALYSIS
1. Overview of the social and economic context
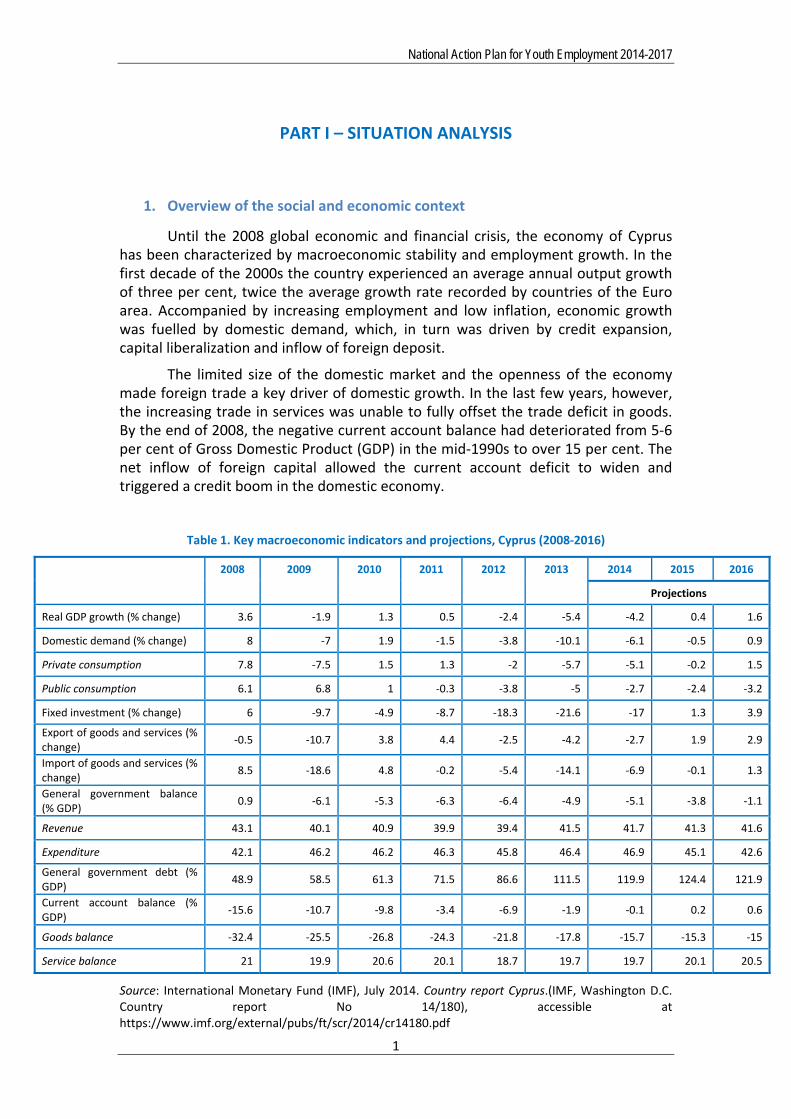
Until the 2008 global economic and financial crisis, the economy of Cyprus has been characterized by macroeconomic stability and employment growth. In the first decade of the 2000s the country experienced an average annual output growth of three per cent, twice the average growth rate recorded by countries of the Euro area. Accompanied by increasing employment and low inflation, economic growth was fuelled by domestic demand, which, in turn was driven by credit expansion, capital liberalization and inflow of foreign deposit.
The limited size of the domestic market and the openness of the economy made foreign trade a key driver of domestic growth. In the last few years, however, the increasing trade in services was unable to fully offset the trade deficit in goods. By the end of 2008, the negative current account balance had deteriorated from 5‐6 per cent of Gross Domestic Product (GDP) in the mid‐1990s to over 15 per cent. The net inflow of foreign capital allowed the current account deficit to widen and triggered a credit boom in the domestic economy.
Table 1. Key macroeconomic indicators and projections, Cyprus (2008‐2016)
2008 2009 2010 2011 2012 2013 2014 2015 2016
Projections
Real GDP growth (% change) 3.6 ‐1.9 1.3 0.5 ‐2.4 ‐5.4 ‐4.2 0.4 1.6
Domestic demand (% change) 8 ‐7 1.9 ‐1.5 ‐3.8 ‐10.1 ‐6.1 ‐0.5 0.9
Private consumption 7.8 ‐7.5 1.5 1.3 ‐2 ‐5.7 ‐5.1 ‐0.2 1.5
Public consumption 6.1 6.8 1 ‐0.3 ‐3.8 ‐5 ‐2.7 ‐2.4 ‐3.2
Fixed investment (% change) 6 ‐9.7 ‐4.9 ‐8.7 ‐18.3 ‐21.6 ‐17 1.3 3.9
Export of goods and services (% change)
‐0.5 ‐10.7 3.8 4.4 ‐2.5 ‐4.2 ‐2.7 1.9 2.9
Import of goods and services (% change)
8.5 ‐18.6 4.8 ‐0.2 ‐5.4 ‐14.1 ‐6.9 ‐0.1 1.3
General government balance (% GDP)
0.9 ‐6.1 ‐5.3 ‐6.3 ‐6.4 ‐4.9 ‐5.1 ‐3.8 ‐1.1
Revenue 43.1 40.1 40.9 39.9 39.4 41.5 41.7 41.3 41.6
Expenditure 42.1 46.2 46.2 46.3 45.8 46.4 46.9 45.1 42.6
General government debt (% GDP)
48.9 58.5 61.3 71.5 86.6 111.5 119.9 124.4 121.9
Current account balance (% GDP)
‐15.6 ‐10.7 ‐9.8 ‐3.4 ‐6.9 ‐1.9 ‐0.1 0.2 0.6
Goods balance ‐32.4 ‐25.5 ‐26.8 ‐24.3 ‐21.8 ‐17.8 ‐15.7 ‐15.3 ‐15
Service balance 21 19.9 20.6 20.1 18.7 19.7 19.7 20.1 20.5
Source: International Monetary Fund (IMF), July 2014. Country report Cyprus.(IMF, Washington D.C. Country report No 14/180), accessible at https://www.imf.org/external/pubs/ft/scr/2014/cr14180.pdf
National Action Plan for Youth Employment 2014-2017
2
The budgetary position of the country improved in the years of EU accession and adoption of the Euro (from a deficit of seven per cent of GDP in 2003 to a surplus of three per cent in 2007), driven by increasing tax revenues. Public finances started to deteriorate in 2009, and more markedly in 2010 and 2011, as a result of higher public expenditure and a fall in tax revenues (Table 1).
Large foreign capitals inflows created excess liquidity, which was steered towards foreign loan operations and investments. The banking sector started to accumulate liabilities and experience severe losses due to rising non‐performing loans. The under‐capitalization of the two largest banks in the country (the Popular Bank and the Bank of Cyprus), triggered a full blown financial and economic crisis which abruptly halted the modest economy recovery recorded in 2010 and 2011.
The adjustment measures introduced by the government in 2012 failed to reduce the budget deficit, which remained above five per cent of GDP due to stagnating revenues and higher than expected expenditures. Economic activity started to slide in 2012 and further declined in 2013 (‐5.5 per cent of GDP) due to the contraction of consumption (26 per cent).
Small and medium‐sized enterprises (SMEs) in Cyprus represent the near totality of enterprises (99.8 per cent). Micro‐enterprises (e.g. firms with less than 10 workers) account for more than 92 per cent of the total and account for more than one third of total employment (38.7 per cent).1Small and medium‐size enterprises contribute to 76 per cent of value added, which is well above the average of 58 per cent found in other European Union (EU) countries. The sectoral distribution resembles that found in Europe, where a significant share of SMEs operatesin the trade and service sectors.
Over 27 per centof the Cypriot population is estimated to be at risk of poverty or social exclusion. Older persons (aged 55 and over), women, children, young people, retired individuals, unemployed persons and those with low educational attainment are more at risk of poverty and social exclusion compared to the national average.
1European Commission, 2012.Small Business Act (SBA): Fact sheet Cyprus, (Brussels, European Commission), at http://ec.europa.eu/enterprise/policies/sme/facts-figures-analysis/performance-review/files/countries-sheets/2012/cyprus_en.pdf
National Action Plan for Youth Employment 2014-2017
3
2. Analysis of the labour market
2.1. Demographic trends
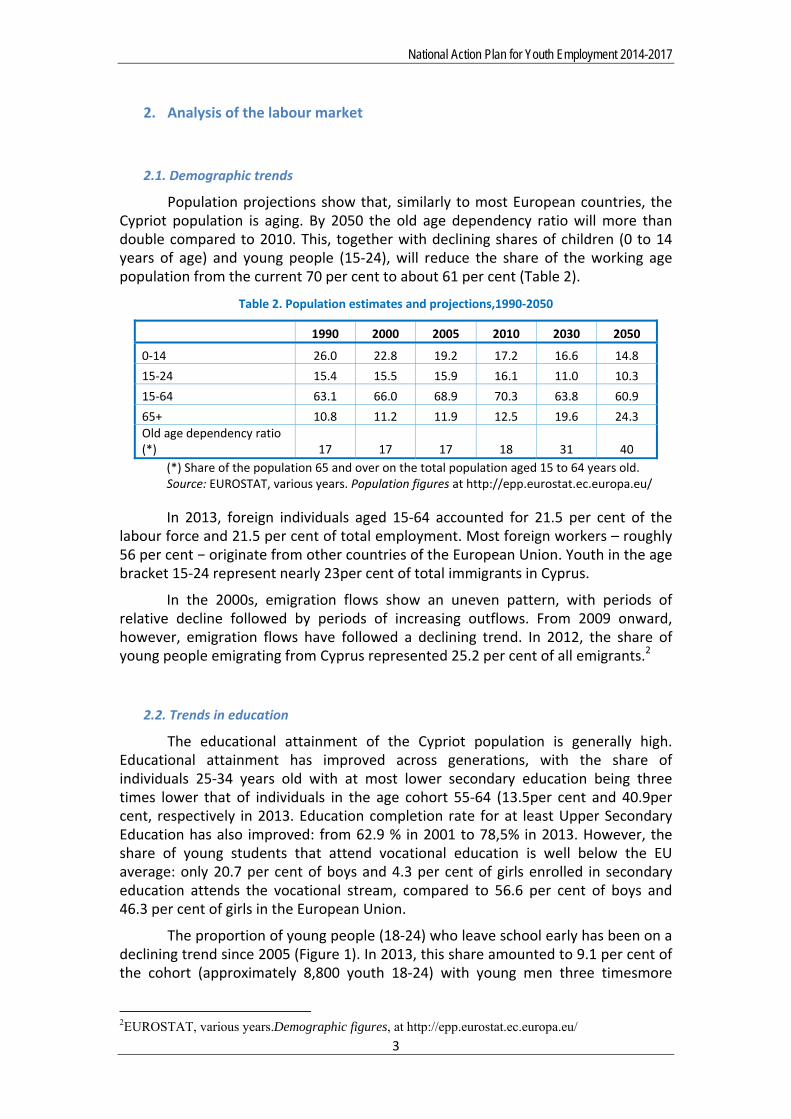
Population projections show that, similarly to most European countries, the Cypriot population is aging. By 2050 the old age dependency ratio will more than double compared to 2010. This, together with declining shares of children (0 to 14 years of age) and young people (15‐24), will reduce the share of the working age population from the current 70 per cent to about 61 per cent (Table 2).
Table 2. Population estimates and projections,1990‐2050
1990 2000 2005 2010 2030 2050
0‐14 26.0 22.8 19.2 17.2 16.6 14.8
15‐24 15.4 15.5 15.9 16.1 11.0 10.3
15‐64 63.1 66.0 68.9 70.3 63.8 60.9
65+ 10.8 11.2 11.9 12.5 19.6 24.3 Old age dependency ratio (*) 17 17 17 18 31 40
(*) Share of the population 65 and over on the total population aged 15 to 64 years old. Source: EUROSTAT, various years. Population figures at http://epp.eurostat.ec.europa.eu/
In 2013, foreign individuals aged 15‐64 accounted for 21.5 per cent of the labour force and 21.5 per cent of total employment. Most foreign workers – roughly 56 per cent − originate from other countries of the European Union. Youth in the age bracket 15‐24 represent nearly 23per cent of total immigrants in Cyprus.
In the 2000s, emigration flows show an uneven pattern, with periods of relative decline followed by periods of increasing outflows. From 2009 onward, however, emigration flows have followed a declining trend. In 2012, the share of young people emigrating from Cyprus represented 25.2 per cent of all emigrants.2
2.2. Trends in education
The educational attainment of the Cypriot population is generally high. Educational attainment has improved across generations, with the share of individuals 25‐34 years old with at most lower secondary education being three times lower that of individuals in the age cohort 55‐64 (13.5per cent and 40.9per cent, respectively in 2013. Education completion rate for at least Upper Secondary Education has also improved: from 62.9 % in 2001 to 78,5% in 2013. However, the share of young students that attend vocational education is well below the EU average: only 20.7 per cent of boys and 4.3 per cent of girls enrolled in secondary education attends the vocational stream, compared to 56.6 per cent of boys and 46.3 per cent of girls in the European Union.
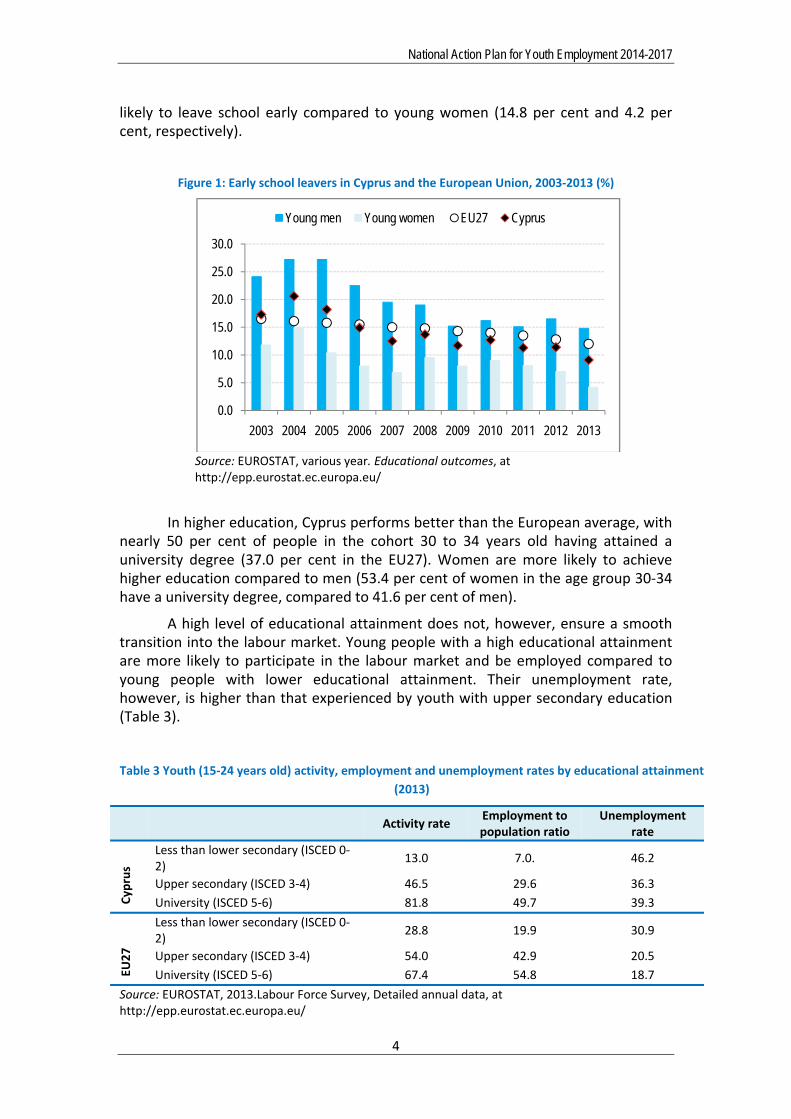
The proportion of young people (18‐24) who leave school early has been on a declining trend since 2005 (Figure 1). In 2013, this share amounted to 9.1 per cent of the cohort (approximately 8,800 youth 18‐24) with young men three timesmore
2EUROSTAT, various years.Demographic figures, at http://epp.eurostat.ec.europa.eu/
National Action Plan for Youth Employment 2014-2017
4
likely to leave school early compared to young women (14.8 per cent and 4.2 per cent, respectively).
Figure 1: Early school leavers in Cyprus and the European Union, 2003‐2013 (%)
Source: EUROSTAT, various year. Educational outcomes, at http://epp.eurostat.ec.europa.eu/
In higher education, Cyprus performs better than the European average, with nearly 50 per cent of people in the cohort 30 to 34 years old having attained a university degree (37.0 per cent in the EU27). Women are more likely to achieve higher education compared to men (53.4 per cent of women in the age group 30‐34 have a university degree, compared to 41.6 per cent of men).
A high level of educational attainment does not, however, ensure a smooth transition into the labour market. Young people with a high educational attainment are more likely to participate in the labour market and be employed compared to young people with lower educational attainment. Their unemployment rate, however, is higher than that experienced by youth with upper secondary education (Table 3).
Table 3 Youth (15‐24 years old) activity, employment and unemployment rates by educational attainment
(2013)
Activity rate
Employment to population ratio
Unemployment rate
Cyprus
Less than lower secondary (ISCED 0‐2)
13.0 7.0. 46.2
Upper secondary (ISCED 3‐4) 46.5 29.6 36.3
University (ISCED 5‐6) 81.8 49.7 39.3
EU27
Less than lower secondary (ISCED 0‐2)
28.8 19.9 30.9
Upper secondary (ISCED 3‐4) 54.0 42.9 20.5
University (ISCED 5‐6) 67.4 54.8 18.7
Source: EUROSTAT, 2013.Labour Force Survey, Detailed annual data, at http://epp.eurostat.ec.europa.eu/
0.0
5.0
10.0
15.0
20.0
25.0
30.0
2003 2004 2005 2006 2007 2008 2009 2010 2011 2012 2013
Young men Young women EU27 Cyprus
National Action Plan for Youth Employment 2014-2017
5
Ahigher level of education helps find the first job. Tertiary education graduates find their first job within approximately five months of job search, while the period for young people with secondary education is 14 months and nearly 16 months for those with at most lower secondary attainment. The employment outcomes five years after completing formal education are also higher for tertiary educated youth (83 per cent) compared to young individuals with secondary (80 per cent) and primary education (70 per cent).3
Young people less than 25 years old are three times more likely to engage in lifelong learning activities compared to the overall population (38.1 per cent and 10.9 per cent, respectively). As it occurs in other countries of the European Union, highly educated individuals are more likely to engage in this type of learning.
2.3. The youth labour market
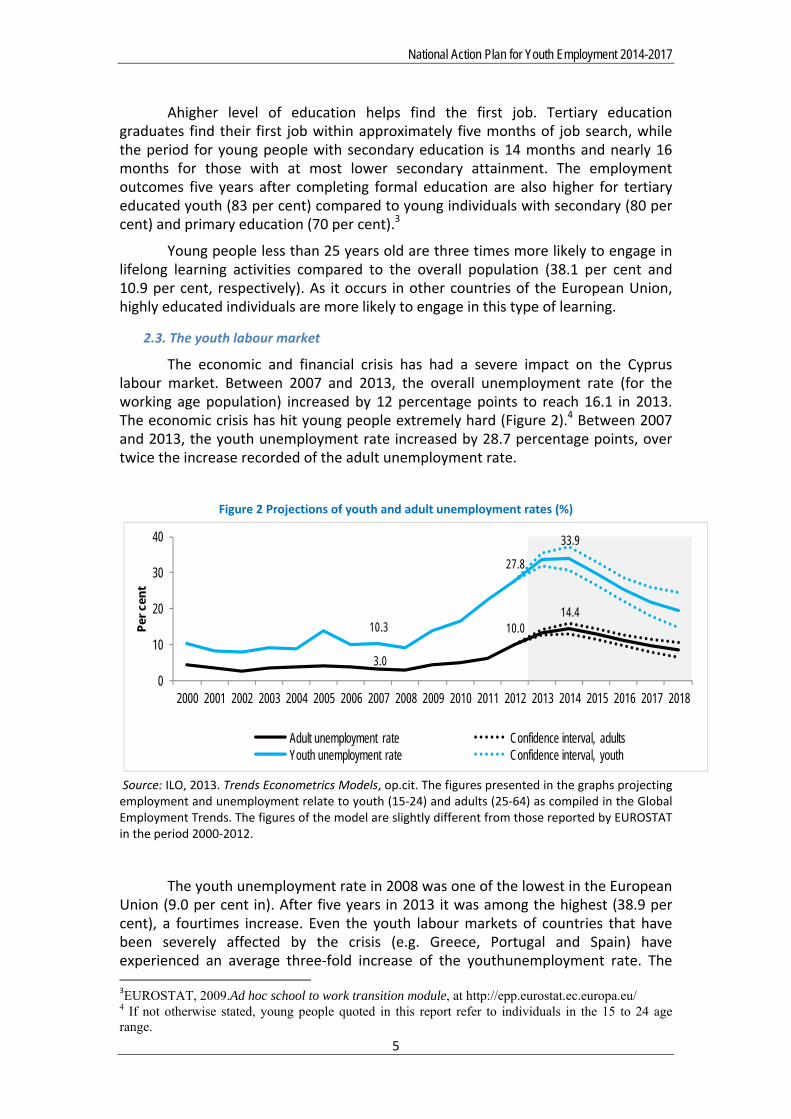
The economic and financial crisis has had a severe impact on the Cyprus labour market. Between 2007 and 2013, the overall unemployment rate (for the working age population) increased by 12 percentage points to reach 16.1 in 2013. The economic crisis has hit young people extremely hard (Figure 2).4 Between 2007 and 2013, the youth unemployment rate increased by 28.7 percentage points, over twice the increase recorded of the adult unemployment rate.
Figure 2 Projections of youth and adult unemployment rates (%)
3.0
14.410.3
33.9
10.0
27.8
0
10
20
30
40
2000 2001 2002 2003 2004 2005 2006 2007 2008 2009 2010 2011 2012 2013 2014 2015 2016 2017 2018
Per
cen
t
Adult unemployment rate Confidence interval, adultsYouth unemployment rate Confidence interval, youth
Source: ILO, 2013. Trends Econometrics Models, op.cit. The figures presented in the graphs projecting employment and unemployment relate to youth (15‐24) and adults (25‐64) as compiled in the Global Employment Trends. The figures of the model are slightly different from those reported by EUROSTAT in the period 2000‐2012.
The youth unemployment rate in 2008 was one of the lowest in the European Union (9.0 per cent in). After five years in 2013 it was among the highest (38.9 per cent), a fourtimes increase. Even the youth labour markets of countries that have been severely affected by the crisis (e.g. Greece, Portugal and Spain) have experienced an average three‐fold increase of the youthunemployment rate. The 3EUROSTAT, 2009.Ad hoc school to work transition module, at http://epp.eurostat.ec.europa.eu/ 4 If not otherwise stated, young people quoted in this report refer to individuals in the 15 to 24 age range.
National Action Plan for Youth Employment 2014-2017
6
unemployment rate for both young and adult workers is projected to remain above pre‐crisis levels well into 2018.
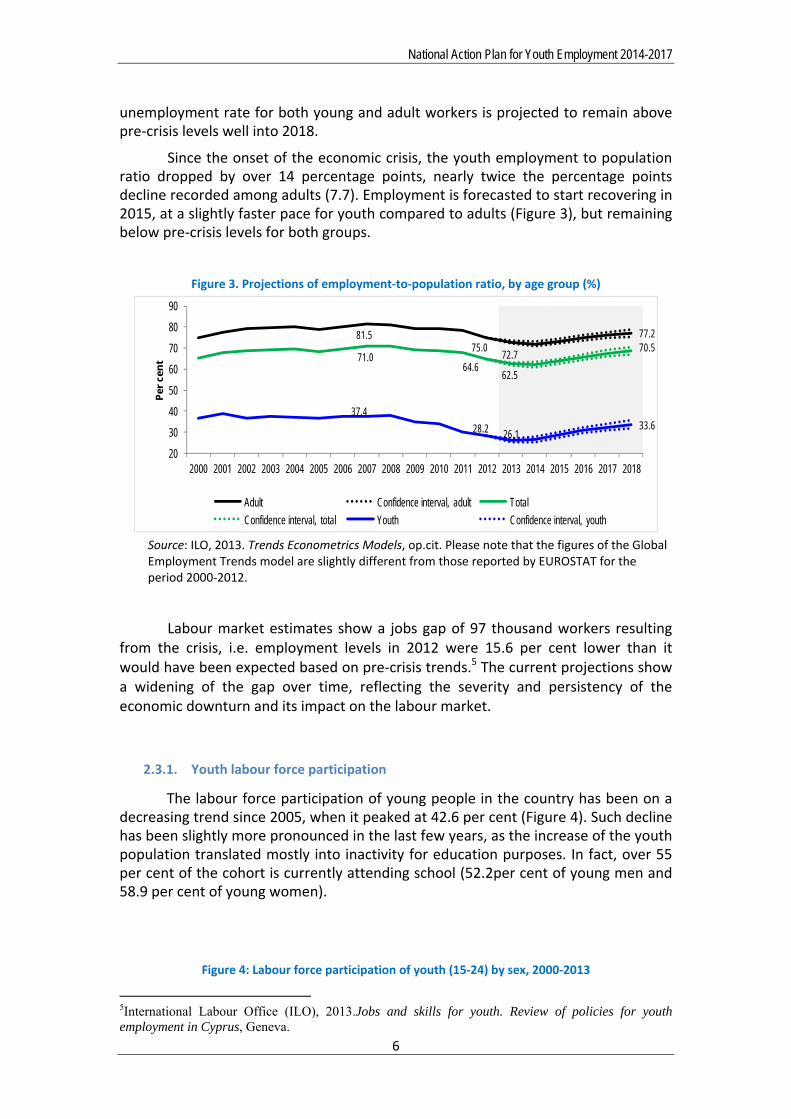
Since the onset of the economic crisis, the youth employment to population ratio dropped by over 14 percentage points, nearly twice the percentage points decline recorded among adults (7.7). Employment is forecasted to start recovering in 2015, at a slightly faster pace for youth compared to adults (Figure 3), but remaining below pre‐crisis levels for both groups.
Figure 3. Projections of employment‐to‐population ratio, by age group (%)
81.575.0
72.7
77.2
71.064.6
62.5
37.4
28.2 26.133.6
70.5
20
30
40
50
60
70
80
90
2000 2001 2002 2003 2004 2005 2006 2007 2008 2009 2010 2011 2012 2013 2014 2015 2016 2017 2018
Per
cen
t
Adult Confidence interval, adult Total
Confidence interval, total Youth Confidence interval, youth
Source: ILO, 2013. Trends Econometrics Models, op.cit. Please note that the figures of the Global Employment Trends model are slightly different from those reported by EUROSTAT for the period 2000‐2012.
Labour market estimates show a jobs gap of 97 thousand workers resulting from the crisis, i.e. employment levels in 2012 were 15.6 per cent lower than it would have been expected based on pre‐crisis trends.5 The current projections show a widening of the gap over time, reflecting the severity and persistency of the economic downturn and its impact on the labour market.
2.3.1. Youth labour force participation
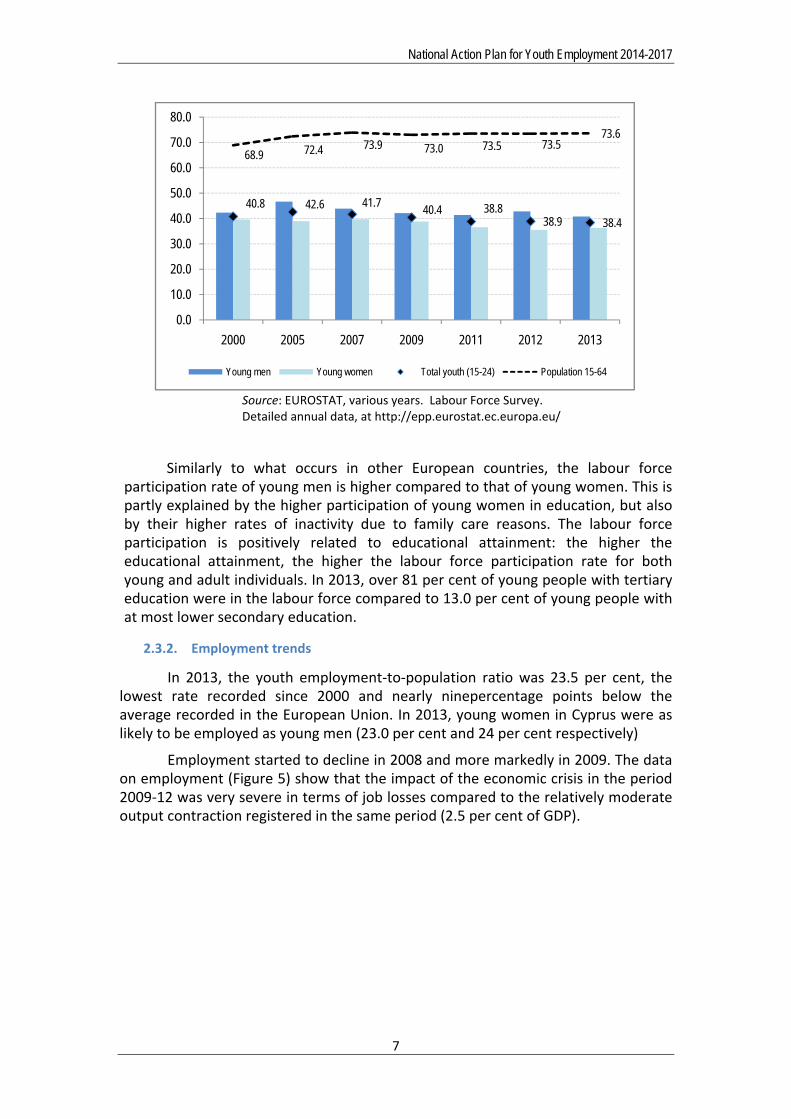
The labour force participation of young people in the country has been on a decreasing trend since 2005, when it peaked at 42.6 per cent (Figure 4). Such decline has been slightly more pronounced in the last few years, as the increase of the youth population translated mostly into inactivity for education purposes. In fact, over 55 per cent of the cohort is currently attending school (52.2per cent of young men and 58.9 per cent of young women).
Figure 4: Labour force participation of youth (15‐24) by sex, 2000‐2013
5International Labour Office (ILO), 2013.Jobs and skills for youth. Review of policies for youth employment in Cyprus, Geneva.
National Action Plan for Youth Employment 2014-2017
7
Source: EUROSTAT, various years. Labour Force Survey. Detailed annual data, at http://epp.eurostat.ec.europa.eu/
Similarly to what occurs in other European countries, the labour force participation rate of young men is higher compared to that of young women. This is partly explained by the higher participation of young women in education, but also by their higher rates of inactivity due to family care reasons. The labour force participation is positively related to educational attainment: the higher the educational attainment, the higher the labour force participation rate for both young and adult individuals. In 2013, over 81 per cent of young people with tertiary education were in the labour force compared to 13.0 per cent of young people with at most lower secondary education.
2.3.2. Employment trends
In 2013, the youth employment‐to‐population ratio was 23.5 per cent, the lowest rate recorded since 2000 and nearly ninepercentage points below the average recorded in the European Union. In 2013, young women in Cyprus were as likely to be employed as young men (23.0 per cent and 24 per cent respectively)
Employment started to decline in 2008 and more markedly in 2009. The data on employment (Figure 5) show that the impact of the economic crisis in the period 2009‐12 was very severe in terms of job losses compared to the relatively moderate output contraction registered in the same period (2.5 per cent of GDP).
40.8 42.6 41.740.4 38.8
38.9 38.4
68.9 72.4 73.9 73.0 73.5 73.573.6
0.0
10.0
20.0
30.0
40.0
50.0
60.0
70.0
80.0
2000 2005 2007 2009 2011 2012 2013
Young men Young women Total youth (15-24) Population 15-64
National Action Plan for Youth Employment 2014-2017
8
Figure 5: Changes in employment, youth and adults, Cyprus and EU27, 2008‐2013 (percentage points)
Source: EUROSTAT, various years. Labour Force Survey, detailed annual data at http://epp.eurostat.ec.europa.eu
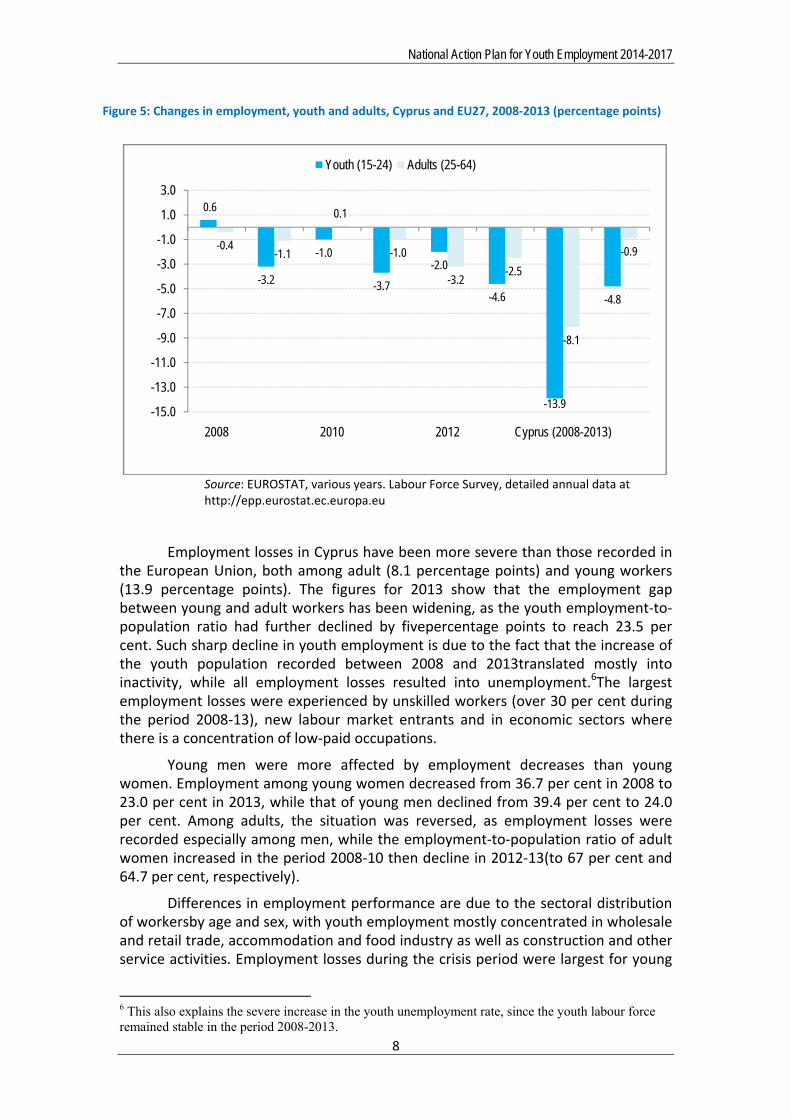
Employment losses in Cyprus have been more severe than those recorded in the European Union, both among adult (8.1 percentage points) and young workers (13.9 percentage points). The figures for 2013 show that the employment gap between young and adult workers has been widening, as the youth employment‐to‐population ratio had further declined by fivepercentage points to reach 23.5 per cent. Such sharp decline in youth employment is due to the fact that the increase of the youth population recorded between 2008 and 2013translated mostly into inactivity, while all employment losses resulted into unemployment.6The largest employment losses were experienced by unskilled workers (over 30 per cent during the period 2008‐13), new labour market entrants and in economic sectors where there is a concentration of low‐paid occupations.
Young men were more affected by employment decreases than young women. Employment among young women decreased from 36.7 per cent in 2008 to 23.0 per cent in 2013, while that of young men declined from 39.4 per cent to 24.0 per cent. Among adults, the situation was reversed, as employment losses were recorded especially among men, while the employment‐to‐population ratio of adult women increased in the period 2008‐10 then decline in 2012‐13(to 67 per cent and 64.7 per cent, respectively).
Differences in employment performance are due to the sectoral distribution of workersby age and sex, with youth employment mostly concentrated in wholesale and retail trade, accommodation and food industry as well as construction and other service activities. Employment losses during the crisis period were largest for young
6 This also explains the severe increase in the youth unemployment rate, since the youth labour force remained stable in the period 2008-2013.
0.6
-3.2
-1.0
-3.7
-2.0
-4.6
-13.9
-4.8
-0.4-1.1
0.1
-1.0
-3.2-2.5
-8.1
-0.9
-15.0
-13.0
-11.0
-9.0
-7.0
-5.0
-3.0
-1.0
1.0
3.0
2008 2010 2012 Cyprus (2008-2013)
Youth (15-24) Adults (25-64)
National Action Plan for Youth Employment 2014-2017
9
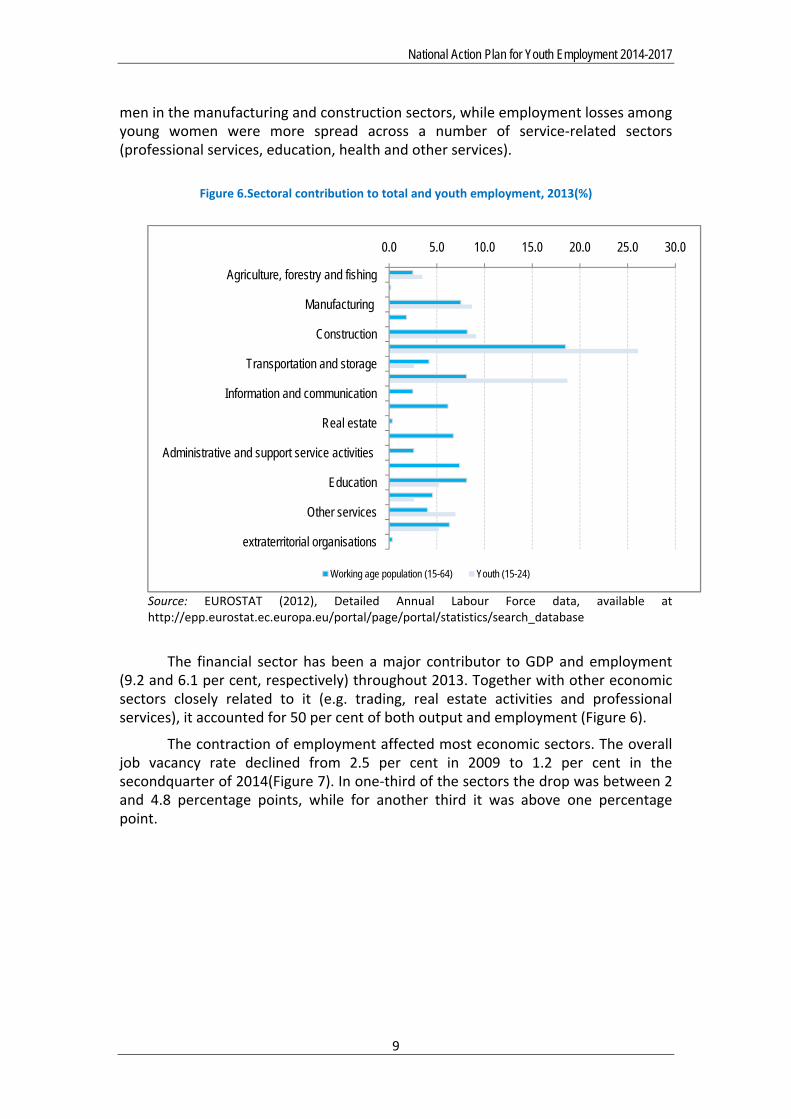
men in the manufacturing and construction sectors, while employment losses among young women were more spread across a number of service‐related sectors (professional services, education, health and other services).
Figure 6.Sectoral contribution to total and youth employment, 2013(%)
Source: EUROSTAT (2012), Detailed Annual Labour Force data, available at http://epp.eurostat.ec.europa.eu/portal/page/portal/statistics/search_database
The financial sector has been a major contributor to GDP and employment (9.2 and 6.1 per cent, respectively) throughout 2013. Together with other economic sectors closely related to it (e.g. trading, real estate activities and professional services), it accounted for 50 per cent of both output and employment (Figure 6).
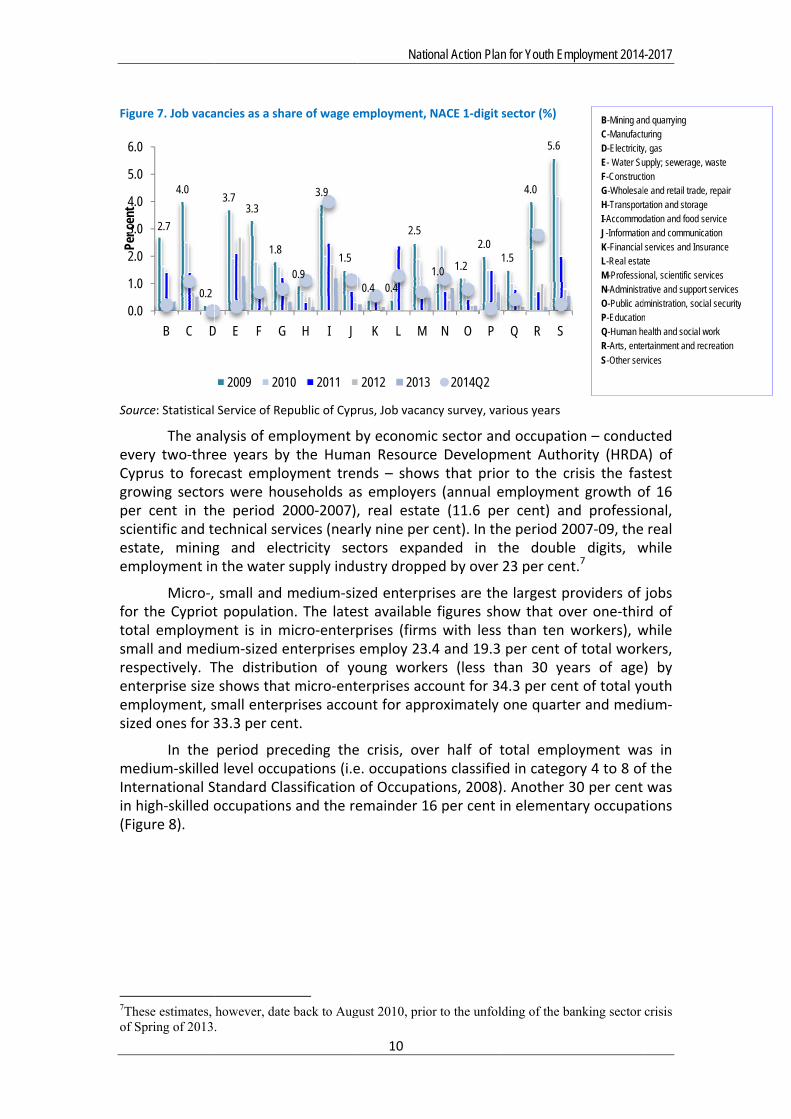
The contraction of employment affected most economic sectors. The overall job vacancy rate declined from 2.5 per cent in 2009 to 1.2 per cent in the secondquarter of 2014(Figure 7). In one‐third of the sectors the drop was between 2 and 4.8 percentage points, while for another third it was above one percentage point.
0.0 5.0 10.0 15.0 20.0 25.0 30.0
Agriculture, forestry and fishing
Manufacturing
Construction
Transportation and storage
Information and communication
Real estate
Administrative and support service activities
Education
Other services
extraterritorial organisations
Working age population (15-64) Youth (15-24)
Figu
Sour
eveCypgrowper scieestaemp
for totasmarespenteempsize
medIntein h(Fig
7Theof Sp
0.0
1.0
2.0
3.0
4.0
5.0
6.0Pe
r cen
tre 7. Job vaca
rce: Statistical
The anary two‐threprus to forewing sectorcent in th
entific and tate, miningployment in
Micro‐, the Cypriotal employmall and medpectively. Terprise sizeployment, sd ones for 3
In the dium‐skilledernational Sigh‐skilled oure 8).
ese estimates, pring of 2013
2.7
4.0
0.2
B C D
ancies as a sha
Service of Re
alysis of emee years byecast emplors were hohe period 2echnical seg and elen the water
small and t populatio
ment is in mium‐sized eThe distribu shows thatsmall enterp33.3 per ce
period pred level occuStandard Claoccupations
however, date.
3.73.3
1.8
D E F G
2009 201
are of wage e
epublic of Cyp
mployment by the Humaoyment trenuseholds as2000‐2007),rvices (nearctricity secsupply indu
medium‐sizn. The latemicro‐enterpenterprises ution of yot micro‐entprises account.
eceding theupations (i.eassification s and the re
e back to Aug
0.9
3.9
1.5
H I J
10 2011
Natio
10
employment,
rus, Job vacan
by economian Resourcnds – shows employer, real estatrly nine perctors expaustry dropp
zed enterprst availableprises (firmemploy 23oung workterprises accunt for app
e crisis, ovee. occupatioof Occupatemainder 1
gust 2010, prio
0.4 0.4
2.5
K L M
2012 2013
onal Action Pla
NACE 1‐digit
ncy survey, va
ic sector ane Developmws that priors (annual ete (11.6 pe cent). In thanded in tped by over
rises are the figures shms with less.4 and 19.3ers (less thcount for 3roximately
er half of tons classifietions, 2008)6 per cent i
or to the unfol
1.0 1.2
2.0
N O P
3 2014Q2
n for Youth Em
sector (%)
arious years
nd occupatioment Authoor to the cremploymener cent) anhe period 20the double23 per cent
e largest prow that ovs than ten w per cent ohan 30 yea4.3 per cenone quarte
total emploed in catego). Another 3in elementa
lding of the ba
1.5
4.0
5.6
Q R S
mployment 2014
on – conduority (HRDArisis the fasnt growth ond professio007‐09, thee digits, wt.7
roviders of ver one‐thirworkers), wf total workars of agent of total yoer and med
oyment waory 4 to 8 of30 per cent ary occupat
anking sector
B-Mining anC-ManufactD-ElectricityE- Water SuF-ConstructG-WholesalH-TransportI-AccommodJ-InformatioK-Financial L-Real estaM-ProfessioN-AdministrO-Public adP-EducationQ-Human hR-Arts, ente
S-Other serv
4-2017
cted A) of stest of 16 onal, real while
jobs rd of while kers, ) by outh ium‐
as in f the was tions
crisis
nd quarrying uring
y, gas upply; sewerage, wation e and retail trade, retation and storage dation and food servon and communicatio services and Insurate
onal, scientific servicrative and support seministration, social s
n ealth and social wor
ertainment and recre
vices
aste
epair
vice on ance
ces ervices security
rk eation
National Action Plan for Youth Employment 2014-2017
11
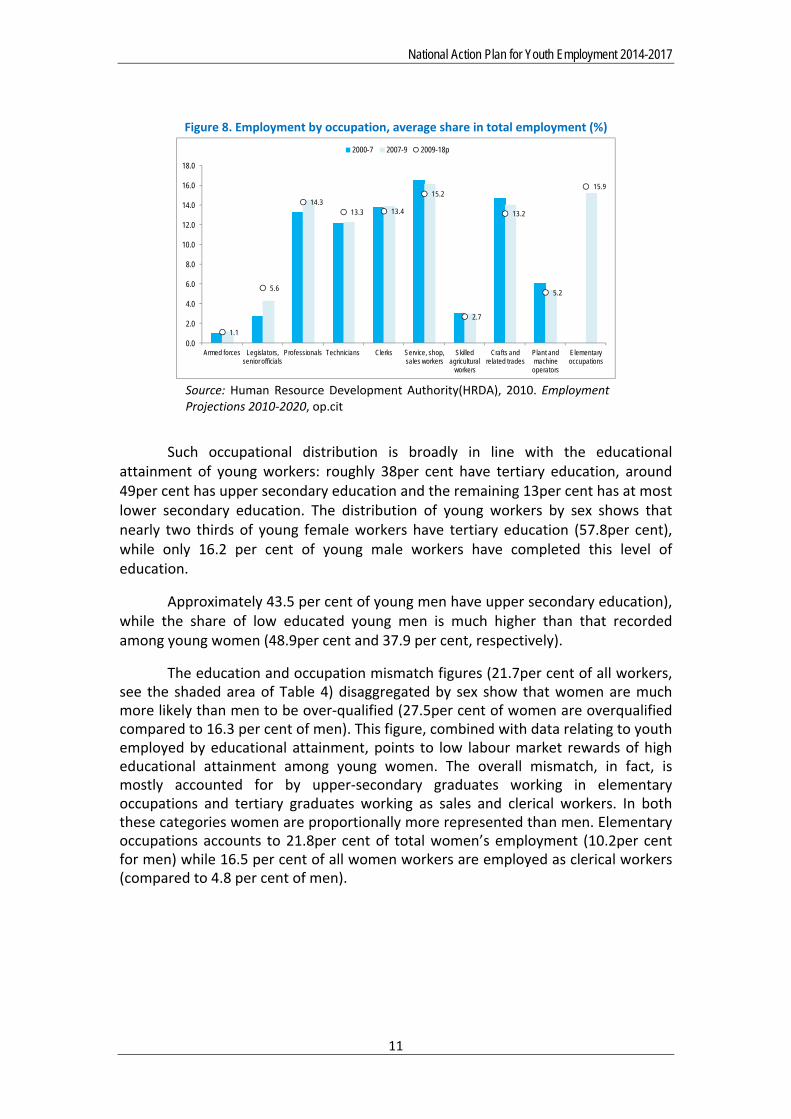
Figure 8. Employment by occupation, average share in total employment (%)
1.1
5.6
14.313.3 13.4
15.2
2.7
13.2
5.2
15.9
0.0
2.0
4.0
6.0
8.0
10.0
12.0
14.0
16.0
18.0
Armed forces Legislators, senior officials
Professionals Technicians Clerks Service, shop, sales workers
Skilled agricultural
workers
Crafts and related trades
Plant and machine
operators
Elementary occupations
2000-7 2007-9 2009-18p
Source: Human Resource Development Authority(HRDA), 2010. Employment Projections 2010‐2020, op.cit
Such occupational distribution is broadly in line with the educational
attainment of young workers: roughly 38per cent have tertiary education, around 49per cent has upper secondary education and the remaining 13per cent has at most lower secondary education. The distribution of young workers by sex shows that nearly two thirds of young female workers have tertiary education (57.8per cent), while only 16.2 per cent of young male workers have completed this level of education.
Approximately 43.5 per cent of young men have upper secondary education), while the share of low educated young men is much higher than that recorded among young women (48.9per cent and 37.9 per cent, respectively).
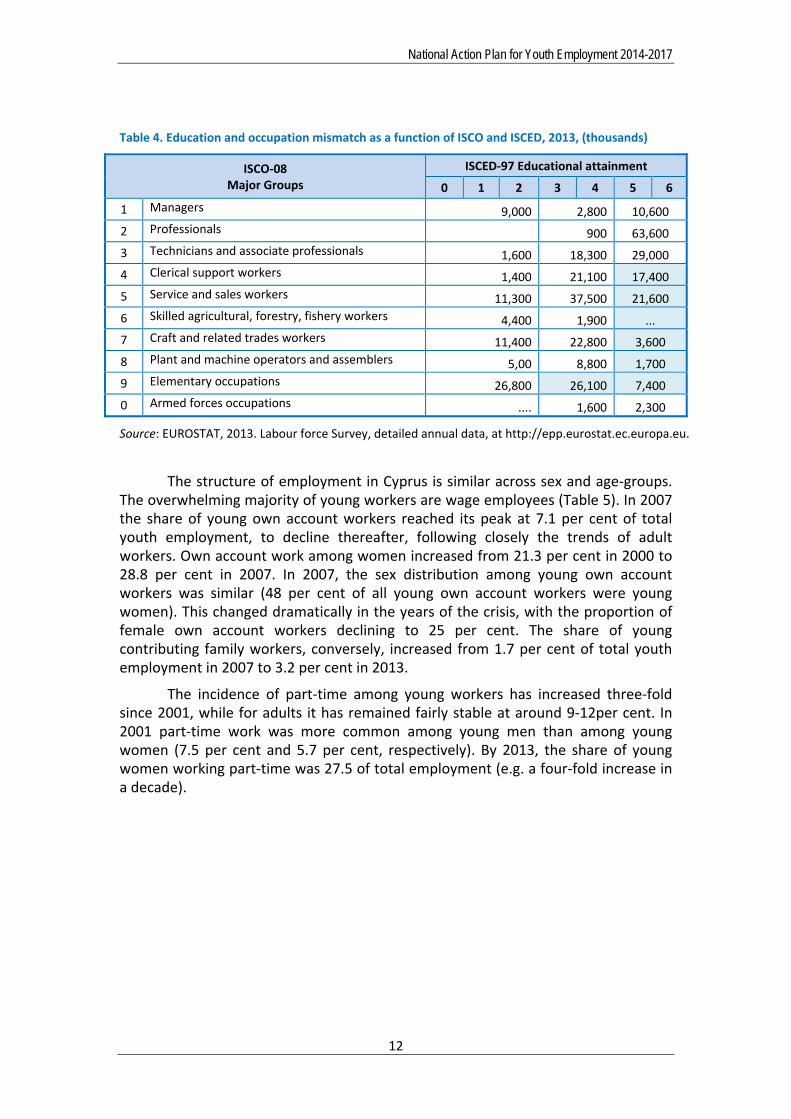
The education and occupation mismatch figures (21.7per cent of all workers, see the shaded area of Table 4) disaggregated by sex show that women are much more likely than men to be over‐qualified (27.5per cent of women are overqualified compared to 16.3 per cent of men). This figure, combined with data relating to youth employed by educational attainment, points to low labour market rewards of high educational attainment among young women. The overall mismatch, in fact, is mostly accounted for by upper‐secondary graduates working in elementary occupations and tertiary graduates working as sales and clerical workers. In both these categories women are proportionally more represented than men. Elementary occupations accounts to 21.8per cent of total women’s employment (10.2per cent for men) while 16.5 per cent of all women workers are employed as clerical workers (compared to 4.8 per cent of men).
National Action Plan for Youth Employment 2014-2017
12
Table 4. Education and occupation mismatch as a function of ISCO and ISCED, 2013, (thousands)
ISCO‐08 Major Groups
ISCED‐97 Educational attainment
0 1 2 3 4 5 6
1 Managers 9,000 2,800 10,600
2 Professionals 900 63,600
3 Technicians and associate professionals 1,600 18,300 29,000
4 Clerical support workers 1,400 21,100 17,400
5 Service and sales workers 11,300 37,500 21,600
6 Skilled agricultural, forestry, fishery workers 4,400 1,900 ...
7 Craft and related trades workers 11,400 22,800 3,600
8 Plant and machine operators and assemblers 5,00 8,800 1,700
9 Elementary occupations 26,800 26,100 7,400
0 Armed forces occupations .... 1,600 2,300
Source: EUROSTAT, 2013. Labour force Survey, detailed annual data, at http://epp.eurostat.ec.europa.eu.
The structure of employment in Cyprus is similar across sex and age‐groups.
The overwhelming majority of young workers are wage employees (Table 5). In 2007 the share of young own account workers reached its peak at 7.1 per cent of total youth employment, to decline thereafter, following closely the trends of adult workers. Own account work among women increased from 21.3 per cent in 2000 to 28.8 per cent in 2007. In 2007, the sex distribution among young own account workers was similar (48 per cent of all young own account workers were young women). This changed dramatically in the years of the crisis, with the proportion of female own account workers declining to 25 per cent. The share of young contributing family workers, conversely, increased from 1.7 per cent of total youth employment in 2007 to 3.2 per cent in 2013.
The incidence of part‐time among young workers has increased three‐fold since 2001, while for adults it has remained fairly stable at around 9‐12per cent. In 2001 part‐time work was more common among young men than among young women (7.5 per cent and 5.7 per cent, respectively). By 2013, the share of young women working part‐time was 27.5 of total employment (e.g. a four‐fold increase in a decade).

National Action Plan for Youth Employment 2014-2017
13
The employment figures by type of contract points to a growing trend of youth involuntary part‐time. In 2001, the share of involuntary young part‐timers was slightly over one third of total part‐time work; by 2013, it was around 60 per cent
A similar trend can be discerned also among adults: the fraction of involuntary part time increased from 19.3 per cent in 2001 to 55.0 per cent in 2013.
Table 5: Structure of youth employment, 2001‐2013 (%)
2001 2007 2012 2013
Status in employment
Employees 92.6 91.1 93.6 91.9
Employers ... ... ...
Self‐employed workers 4.5 7.1 4 4.9
Contributing family b
3 1.7 2.3 3.2
Type of contract
Full‐time 93.5 90 80.9 76.5
Part‐time 6.5 10.3 18.7 23.5
Involuntary part‐time 31.6 37.8 56.4 60.7
Permanent contract 85.3 76.7 81.3 73.9
Fixed‐term contract 14.7 23.3 18.7 26.1 Involuntary fixed‐ 52.5 65.6 78.3 81.8
Source: EUROSTAT, various years. Labour Force Survey, detailed annual data at http://epp.eurostat.ec.europa.eu.
Temporary work increased steadily over the last few years (from 10.8 per cent in 2001 to 17.5 per cent in 2013) and especially for youth and women. Figure 9: Young workers in temporary work, by sex , 2007‐2013, (%)
Source: EUROSTAT, various years. Labour Force Survey, detailed annual
data
Temporary work among young women increased from 17.4 per cent in 2001 to 28.9 per cent in 2007, while for young men it increased from 11.6 to 17.2 per cent. Since 2008, the trend in youth temporary work followed closely overall youth employment, with noticeable decreases in the years when youth employment losses were accelerating (e.g. in 2009 and 2011 (Figure 9).
This confirms the situation recorded in other countries of the European Union, where young temporary workers were the first to lose their jobs at the onset of the downturn. The upward trend in the share of youth involuntary temporary also points the increasing difficulties in finding a stable job.
0.0
5.0
10.0
15.0
20.0
25.0
30.0
2007 2008 2009 2010 2011 2012 2013
Young men Young women Total youth 15-24 Total (15-64)
National Action Plan for Youth Employment 2014-2017
14
Available estimates on the extent of informal employment put its size at over 28 per cent of GDP and on an increasing trend since the early 2000s.8 The figures of the Labour Inspectorate, however, show a decrease in the share of undeclared work between 2010 and 2012 (from 8 per cent to 5 per cent).9Informal work arrangements are more common among workers coming from outside the European Union (60 per cent of all workers inspected), compared to European migrants (32 per cent) and national workers (13.5 per cent). By April 2013, the share of undeclared workers among third‐country nationals had decreased to 39 per cent, while the respective shares for EU migrant workers and Cypriots had declined only slightly (to 30 and 10 per cent, respectively). The economic sectors more exposed to informal work arrangements are the accommodation and food industry (nearly 37 per cent of all workers inspected) and construction (19 per cent of all workers inspected).10
2.3.3. Wages and other conditions of work
Between 2005 and 2013 (2nd quarter), average monthly earnings increased in nominal terms by approximately 16 per cent (from €1,560 to €1,807). Since 2008, however, earnings started to decline and by 2012 the increase recorded amounted to just one per cent. In comparison with the second quarter of 2013, a decrease of 3.9% was recorded in the average monthly earnings of employees (males ‐4.4% and females ‐3.2%). The corresponding percentage change observed during the second quarter of 2013 was ‐1.6%. In comparison with the first quarter of 2014 (seasonally adjusted data) there was a decrease of 1.3% in the average monthly earnings of employees (males ‐1.4% and females ‐1.0%). The corresponding percentage change observed during the second quarter of 2013 was ‐0.9%.
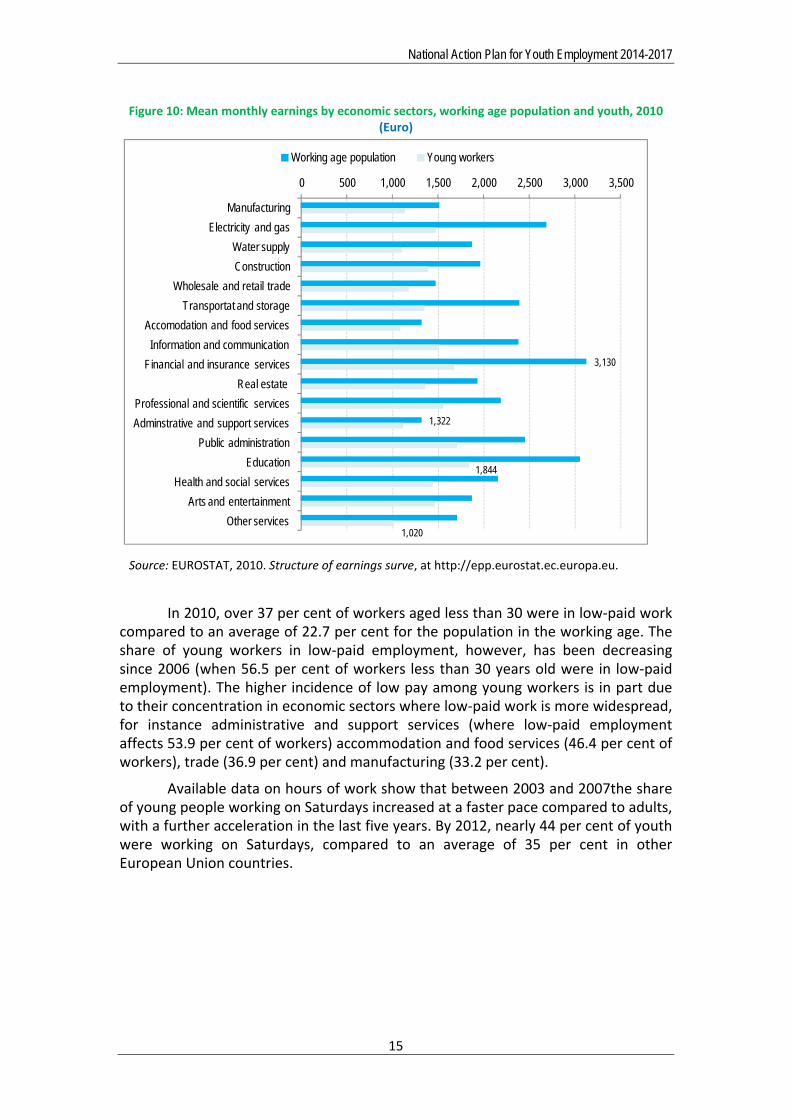
The latest available figures disaggregated by age‐group (2010) show that the earnings gap for individuals less than 30 years old was 34 per cent, while the gender gap among this group of young workers was twice lower than the average gender gap (7.5 per cent and 18.7 per cent, respectively).11 Figure 10 below shows that earnings differences across economic sectors were less pronounced for young workers compared to the total working age population. The wage gap across mean earnings between the lowest (administrative and support services) and the highest‐paying sectors (financial and insurance services) was over 86 per cent for adults, while for youth the gap between lowest (other services) and the highest‐paying sector (education) was 59.7 per cent.
8Schneider F., Buehn A., Montenegro C.E. 2010.Shadow economies all over the world: New estimates for 162 countries from 1999 to 2007 (Washington D.C., World Bank) at http://www.econ.jku.at/members/Schneider/files/publications/LatestResearch2010/SHADOWECONOMIES_June8_2010_FinalVersion.pdf 9 These figures are similar to the difference found between individuals contributing to the Social Insurance system (369 thousands) and those detected as employed by the Labour Force Survey (394 thousands) in 2011 (e.g. roughly 6 per cent of total employment is not registered). See Statistical Service of the Republic of Cyprus, Labour Statistics 2011 and EUROSTAT, Annual labour force surveys, 2011. 10 Information provided by the Labour Inspectorate. 11Available at the EUROSTAT portal, Structure of Earnings Survey. The figures are available disaggregated for the group aged 30 years or less.
National Action Plan for Youth Employment 2014-2017
15
Figure 10: Mean monthly earnings by economic sectors, working age population and youth, 2010 (Euro)
3,130
1,322
1,844
1,020
0 500 1,000 1,500 2,000 2,500 3,000 3,500
Manufacturing
Electricity and gas
Water supply
Construction
Wholesale and retail trade
Transportat and storage
Accomodation and food services
Information and communication
Financial and insurance services
Real estate
Professional and scientific services
Adminstrative and support services
Public administration
Education
Health and social services
Arts and entertainment
Other services
Working age population Young workers
Source: EUROSTAT, 2010. Structure of earnings surve, at http://epp.eurostat.ec.europa.eu.
In 2010, over 37 per cent of workers aged less than 30 were in low‐paid work
compared to an average of 22.7 per cent for the population in the working age. The share of young workers in low‐paid employment, however, has been decreasing since 2006 (when 56.5 per cent of workers less than 30 years old were in low‐paid employment). The higher incidence of low pay among young workers is in part due to their concentration in economic sectors where low‐paid work is more widespread, for instance administrative and support services (where low‐paid employment affects 53.9 per cent of workers) accommodation and food services (46.4 per cent of workers), trade (36.9 per cent) and manufacturing (33.2 per cent).
Available data on hours of work show that between 2003 and 2007the share of young people working on Saturdays increased at a faster pace compared to adults, with a further acceleration in the last five years. By 2012, nearly 44 per cent of youth were working on Saturdays, compared to an average of 35 per cent in other European Union countries.
National Action Plan for Youth Employment 2014-2017
16
2.3.4. Youth unemployment
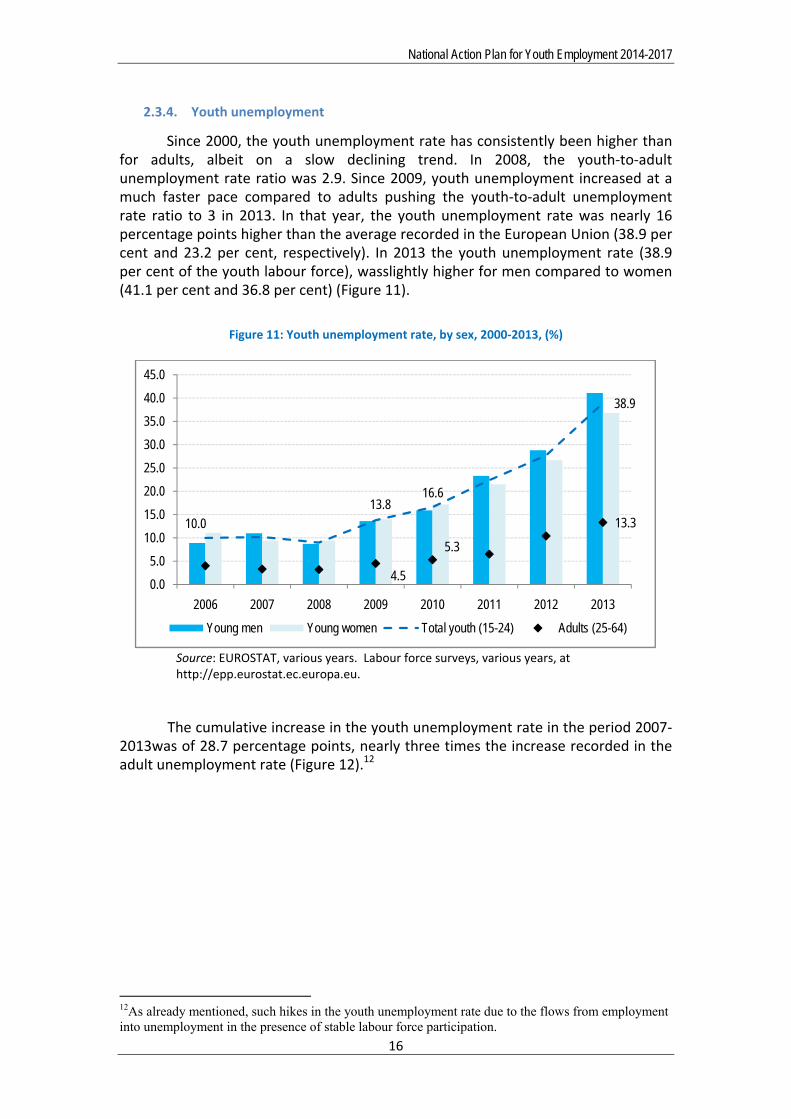
Since 2000, the youth unemployment rate has consistently been higher than for adults, albeit on a slow declining trend. In 2008, the youth‐to‐adult unemployment rate ratio was 2.9. Since 2009, youth unemployment increased at a much faster pace compared to adults pushing the youth‐to‐adult unemployment rate ratio to 3 in 2013. In that year, the youth unemployment rate was nearly 16 percentage points higher than the average recorded in the European Union (38.9 per cent and 23.2 per cent, respectively). In 2013 the youth unemployment rate (38.9 per cent of the youth labour force), wasslightly higher for men compared to women (41.1 per cent and 36.8 per cent) (Figure 11).
Figure 11: Youth unemployment rate, by sex, 2000‐2013, (%)
Source: EUROSTAT, various years. Labour force surveys, various years, at http://epp.eurostat.ec.europa.eu.
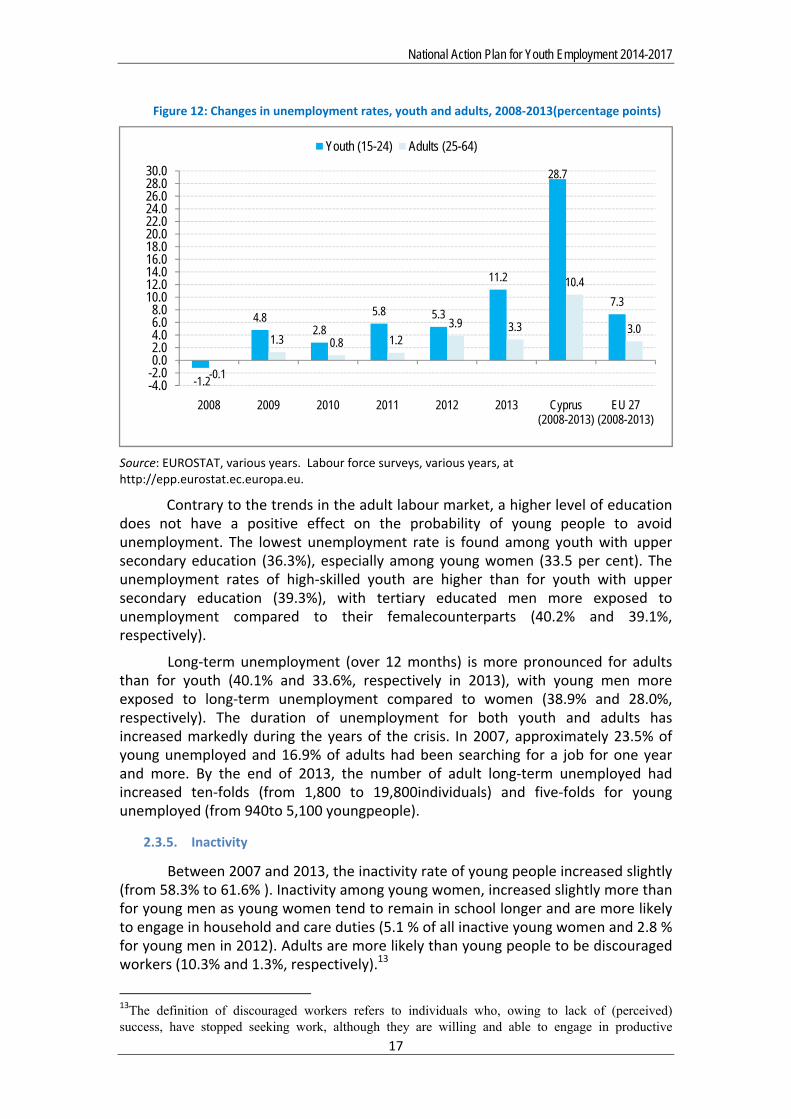
The cumulative increase in the youth unemployment rate in the period 2007‐2013was of 28.7 percentage points, nearly three times the increase recorded in the adult unemployment rate (Figure 12).12
12As already mentioned, such hikes in the youth unemployment rate due to the flows from employment into unemployment in the presence of stable labour force participation.
10.013.8
16.6
38.9
4.5
5.3
13.3
0.0
5.0
10.0
15.0
20.0
25.0
30.0
35.0
40.0
45.0
2006 2007 2008 2009 2010 2011 2012 2013
Young men Young women Total youth (15-24) Adults (25-64)
National Action Plan for Youth Employment 2014-2017
17
Figure 12: Changes in unemployment rates, youth and adults, 2008‐2013(percentage points)
Source: EUROSTAT, various years. Labour force surveys, various years, at http://epp.eurostat.ec.europa.eu.
Contrary to the trends in the adult labour market, a higher level of education does not have a positive effect on the probability of young people to avoid unemployment. The lowest unemployment rate is found among youth with upper secondary education (36.3%), especially among young women (33.5 per cent). The unemployment rates of high‐skilled youth are higher than for youth with upper secondary education (39.3%), with tertiary educated men more exposed to unemployment compared to their femalecounterparts (40.2% and 39.1%, respectively).
Long‐term unemployment (over 12 months) is more pronounced for adults than for youth (40.1% and 33.6%, respectively in 2013), with young men more exposed to long‐term unemployment compared to women (38.9% and 28.0%, respectively). The duration of unemployment for both youth and adults has increased markedly during the years of the crisis. In 2007, approximately 23.5% of young unemployed and 16.9% of adults had been searching for a job for one year and more. By the end of 2013, the number of adult long‐term unemployed had increased ten‐folds (from 1,800 to 19,800individuals) and five‐folds for young unemployed (from 940to 5,100 youngpeople).
2.3.5. Inactivity
Between 2007 and 2013, the inactivity rate of young people increased slightly (from 58.3% to 61.6% ). Inactivity among young women, increased slightly more than for young men as young women tend to remain in school longer and are more likely to engage in household and care duties (5.1 % of all inactive young women and 2.8 % for young men in 2012). Adults are more likely than young people to be discouraged workers (10.3% and 1.3%, respectively).13
13The definition of discouraged workers refers to individuals who, owing to lack of (perceived) success, have stopped seeking work, although they are willing and able to engage in productive
-1.2
4.82.8
5.8 5.3
11.2
28.7
7.3
-0.1
1.3 0.8 1.23.9 3.3
10.4
3.0
-4.0-2.00.02.04.06.08.0
10.012.014.016.018.020.022.024.026.028.030.0
2008 2009 2010 2011 2012 2013 Cyprus (2008-2013)
EU 27 (2008-2013)
Youth (15-24) Adults (25-64)
National Action Plan for Youth Employment 2014-2017
18
In 2013, the share of young people neither in employment nor in education and training (NEETs) represented 18.7% of the total youth population (i.e. more than 19,800 young men and women), twice the share recorded in 2007 (9%).
The largest increase in the number of youth not in employment, education or training was recorded between 2010 and 2011 (25 %) and especially among young men. Such an increase was mostly due to the raising shares of young people becoming unemployed (from 5.5 % of the youth population in 2009 to 10.8 % in 2012) and remaining inactive for education and training purposes. In the span of just five years, the rate of “idleness” shifted from below the average recorded in the EU27 (9.8 % in Cyprus and 10.3 % in the EU) to over 6 percentage points higher than in the EU27.
activities. See Rosas, G. and Rossignotti, G., Starting the millennium right: Decent work for young people, in International Labour Review, Vol. 144 (2005), Geneva.
National Action Plan for Youth Employment 2014-2017
19
3. Policies affecting youth employment
Although the impact of the economic and financial crisis in the period 2009‐2012 was mild in terms of output contraction (2.5 per cent of GDP cumulatively), it was very severe in terms of job losses, especially for young workers. Available employment projections show that the labour market situation has further deteriorated in 2013 and 2014, with a tepid recovery starting only in 2015.
The labour market data indicate that Cyprus faces both quantitative and qualitative challenges in addressing the youth employment crisis. Government policies and institutions have a key role to play in mitigating the impact of the economic downturn on the labour market and in easing the transition of young people to decent work. The labour market data presented in the previous chapter point to three policy areas that have an impact on youth employment:
macroeconomic and sectoral policies and their impact on overall job creation;
education and training policies and their relevance to labour market requirements; and
labour market policies that bridge labour supply and demand gaps.
3.1. Macroeconomic and sectoral policies
The youth employment crisis cannot be overcome without stronger employment growth. This requires economic and fiscal policies aimed at supporting aggregate demand, increasing productive investment and improvingenterprises’ access to finance.
The Economic Adjustment Programme − agreed with the European Commission, the European Central Bank and the International Monetary Fund – aims to restore the stability of the financial sector, strengthen the sustainability of public finances and implement the structural reforms needed to set the foundations of sustainable long‐term growth. For the period 2013‐2015, the Programme envisages fiscal consolidation measures amounting to five per cent of GDP to be achieved through a combination of tax increases and lower public spending.
The size and composition of the adjustment effort and the restructuring of the banking sector are expected to further depress aggregate demand, with negative output growth persisting till 2015. Such fiscal adjustment, however, is to be accompanied by structural reforms that will enhance the effectiveness of the revenue and spending system, which in turn will free some fiscal space for the formulation of policies to promote growth and job creation. The reform of the tax administrationwill improve compliance, reduce the extent of the informal economy and expand the tax base, while those planned in the health, pension and social welfare systems will allow to rationalize resources, improve targeting and reduce leakages, as well as steer resources towards productive spending (especially investment and research and development).
Economic diversification, the promotion of small and medium size enterprises and sectoraldevelopment will be the drivers of growth and job creation.
National Action Plan for Youth Employment 2014-2017
20
Micro‐, small‐ and medium‐sized enterprises (SMEs) represent the overwhelming majority of Cypriot enterprises and account for 83 per cent of all jobs. In the last few years, Cyprus has been losing ground in the global competiveness index, especially with regard to the effectiveness of the institutional framework, infrastructure development, market efficiency, technology absorption, innovation and investment on research and development.
The cost of starting a business in Cyprus is still twice that ofthe European Union and access to finance remains one of the major obstacles for enterprises. Pooraccess to credit reduces investment and the capacity of enterprises to expand and recruit young workers. Other barriers relate to technology constraints (deferral of the high level of investments needed to compete in technologically advanced markets); as well as working capital shortages (e.g. the limited availability of financial instruments to finance working capital for micro and small enterprises).
The measures to be taken to address these challenges include:
i) promoting value‐added activities, mainly in the service industries (including information and communication technology, tourism, health, education and the green economy);
ii) easing the requirements for business start‐up and expansion; iii) Increasing investment in research and development (R&D); and iv) expanding existing credit facilities for small and medium size
enterprises (the Entrepreneurship Fund, the Joint European Resources for Small and Medium‐sized Enterprises and the SME competitiveness grant scheme).
Initiatives are already in the pipeline to promote the development of the natural gas and the tourism sectors that, together with measures for the greening of the economy, are considered tobekey drivers for growth and employment, especially for the younger generation.14
3.2. Education and training policy
One of the key findings of the analysis of the youth labour market is the relationship between young people’s educational attainment and skills level and labour market outcomes.
The increase in the public resources invested in education (from 5.6 per cent of GDP in 2000 to 7.9 per cent in 2010) succeeded in raising enrolment at all levels. Quality and relevance, however, proved more difficult to achieve. In this regard, the current reform of the education system envisages the upgrading and modernization of school curricula − to assure the acquisition of skills, knowledge and competences demanded by the labour market− and enhanced teachers’ training (both initial and continuing). One of the objectives of the education reform is to reduce the share of early school leavers by establishing a system for the early identification of learning difficulties, developing integration programmes for students of immigrant background and promoting the uptake of vocational education programmes. 14 For the identification of skills required in the green economy and in the gas industry see HRDA, 2010. Identification of green skills needs in the Cyprus economy 2010 - 2013 (Nicosia, Department of Research and Planning) and from the same Authority, 2012. Early identification of employment and training needs for the effective utilisation of natural gas in Cyprus, (Nicosia, HRDA).
National Action Plan for Youth Employment 2014-2017
21
The reform also aims at increasing the share of students attending scientific and technological programmes (currently at 15 per cent of all upper secondary schools and 18.5 per cent of upper secondary public schools)and improving the cooperation between school and industry to provide students with the opportunity to practice their skills and increase the relevance of learning for the labour market.
Together with the measures planned on labour demand −i.e. increase in innovation, business sophistication and technological readiness – the reform of the education system will allow to maximize the potential of high‐skilled youth and reduce the gap between the skills and qualifications required by enterprises and those delivered by the education system.
Labour market figures point to higher rewards in terms of employment outcomes for young people who complete the vocational stream. The on‐going reform of vocational education and training, therefore, is geared toincrease even more the attractiveness of the system by upgrading the curricula to focus on key competencies andreducing the number of specializations to respond to the needs of emerging economic sectors.
The initiatives highlighted above are expected to increase even more the share of secondary students choosing vocational education from 15 per cent (23.5 per cent boys and 6.2% per cent girls, school year 2013‐2014andimprove school leavers’ labour market outcomes. However, to become an effective instrument to ease the transition of young people to work, this reform would also need to address a number of additional policy issues.
First, to ensure that vocational education and training graduates have the skills to perform on the job and are able to respond to changing requirements, curricula need to envisage more enterprise‐based learning opportunities. Adding work‐experience through collaborative arrangements with industry would allow employers to get to know young students and, at the same time, reduce the cost rigidities related to the establishment of workshops or simulated work environments in schools. More importantly, it would help a young person connect with prospective employers, which gives a premium in the Cypriot labour market.
Second, the New Modern Apprenticeship (NMA) Programme includes two levels: i) preparatory, for youth not having completed lower secondary education, and ii) core, through which a Skilled Craftsperson qualification is awarded. Since it targets mainly school dropouts, this Apprenticeship Programme may reinforce the perception of a remedial programme, rather than a pathway to employment via enhanced work practice. The detachment of the preparatory level, to be offered instead as a second chance programme, would improve the attractiveness of the core qualification.
Third, for the post‐secondary, non‐tertiary vocational programmes to be effective in channelling secondary graduates into this stream, their intake capacity should be expanded.
Lastly, the improvement of career education services would ensure that students are informed about the different educational paths that are available and their labour market rewards, and are helped to match their aspirations with education and labour market opportunities.
National Action Plan for Youth Employment 2014-2017
22
3.3. Labour market policies and institutions
The minimum wage, non‐wage labour costs and employment protection legislation do not represent a barrier to the labour market integration of young people.
Although the minimum wage is applicable to occupations that account for roughly 20 per cent of total youth employment – e.g. clerks, healthcare workers, sales persons and cleaners – its level is estimated in 2013 to 54,8% upon recruitment and reaches 58,3% after 6 months working at the same employer of the median earnings.. Moreover, its level is relatively high, since most European countries maintained the Kaitz index between 30% ‐ 50% in July 2014. 15
The latest available figures show a tax wedge of 13.9 per cent for workers earning at the average wage and 11.9 per cent for low‐paid workers, much below the average recorded in the EU 27 (43.7 per cent for workers earning at the average wage and 40 per cent for low‐paid workers). The introduction of a three per cent contribution on gross earnings of government employees to the pension schemes and the increase in the social security contribution rate (from 15 to 17 per cent) did not increase the weight of labour taxes to such an extent to represent a barrier to youth employment.
In 2013, the overall index of employment protection legislation (EPL) in the country was 2.4, similar to the index of most European countries. However, the dismissal of young workers is easier than for more experienced workers since notice requirements and compensation for unfair dismissals do not apply for the first 26 weeks of employment and there is no severance pay for workers with less than nine months of tenure.
Furthermore, temporary work among young people has increased substantially in the years leading to the crisis and the rate of transition from temporary jobs to permanent employment remains low (only 24.6 per cent of temporary workers move to permanent employment on an annual basis). Workers on temporary contracts are also more exposed to in‐work poverty than their counterparts of other EU countries (23 per cent and 13.2 per cent, respectively).
3.3.1. Active labour market policies
Since 2006, the Public Employment Service (PES) of Cyprushas been undergoing a modernization process focused on:
i) increasing the number of local offices to ease the access of jobseekers and employers to available services;
ii) the training of staff, especially employment counsellors, to provide individualized counselling services and employment planning to the unemployed with a view of delivering quality recruitment services to both jobseekers and enterprises; and
iii) improving the collaboration with other agencies to increase the effectiveness of referral to training and employment incentive programmes. Such reform process, however, has been shelved in the last two years since all available human resources have been re‐
15 See EUROSTAT, Monthly minimum wage as a proportion of the mean value of average monthly earnings (earn_mw_avgr2).
National Action Plan for Youth Employment 2014-2017
23
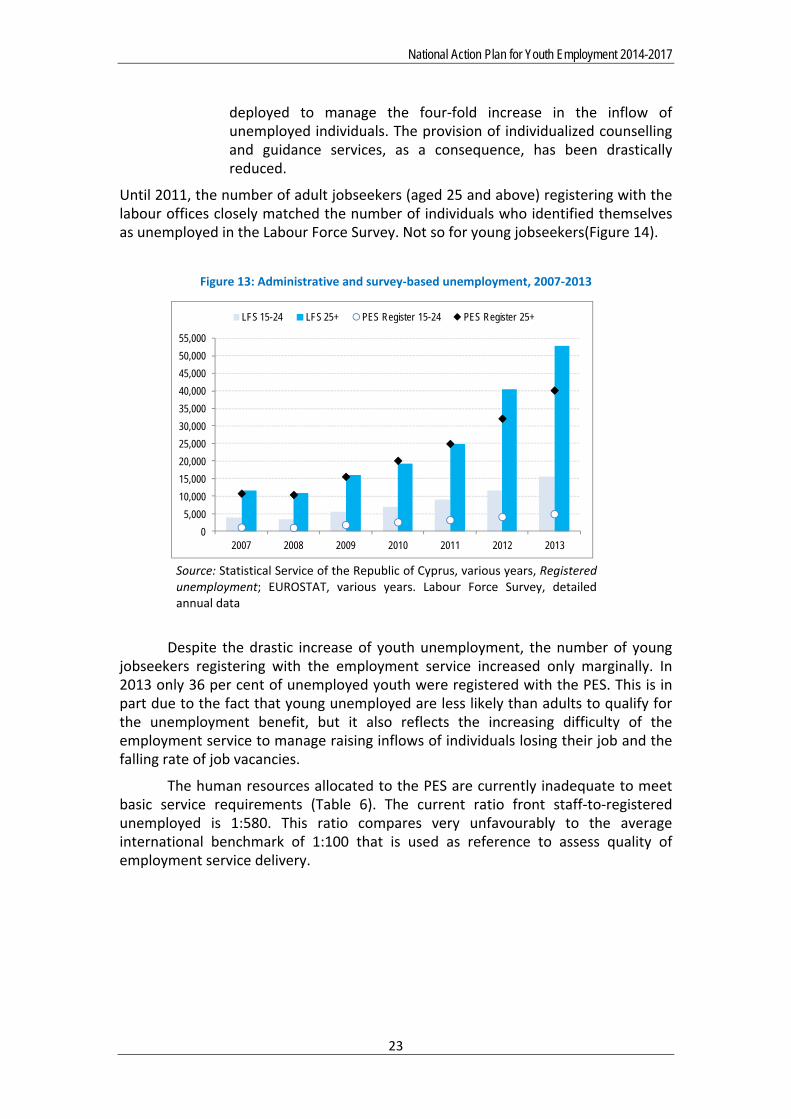
deployed to manage the four‐fold increase in the inflow of unemployed individuals. The provision of individualized counselling and guidance services, as a consequence, has been drastically reduced.
Until 2011, the number of adult jobseekers (aged 25 and above) registering with the labour offices closely matched the number of individuals who identified themselves as unemployed in the Labour Force Survey. Not so for young jobseekers(Figure 14).
Figure 13: Administrative and survey‐based unemployment, 2007‐2013
0
5,000
10,000
15,000
20,000
25,000
30,000
35,000
40,000
45,000
50,000
55,000
2007 2008 2009 2010 2011 2012 2013
LFS 15-24 LFS 25+ PES Register 15-24 PES Register 25+
Source: Statistical Service of the Republic of Cyprus, various years, Registered unemployment; EUROSTAT, various years. Labour Force Survey, detailed annual data
Despite the drastic increase of youth unemployment, the number of young jobseekers registering with the employment service increased only marginally. In 2013 only 36 per cent of unemployed youth were registered with the PES. This is in part due to the fact that young unemployed are less likely than adults to qualify for the unemployment benefit, but it also reflects the increasing difficulty of the employment service to manage raising inflows of individuals losing their job and the falling rate of job vacancies.
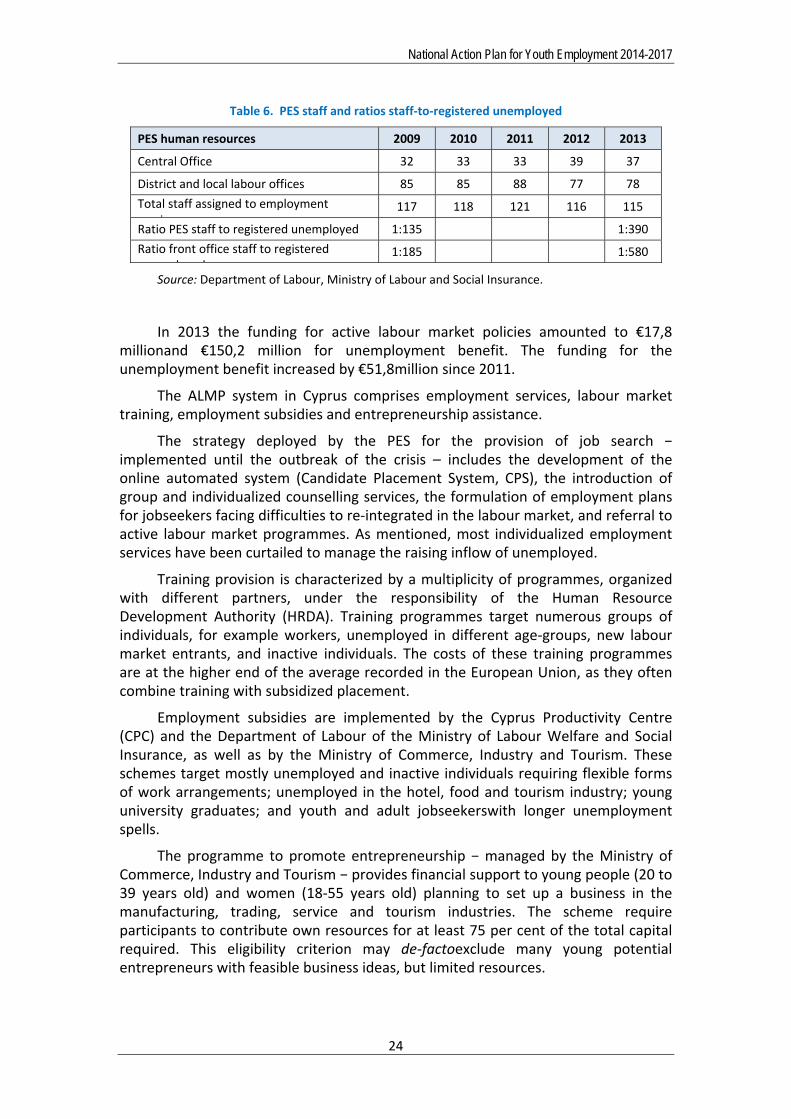
The human resources allocated to the PES are currently inadequate to meet basic service requirements (Table 6). The current ratio front staff‐to‐registered unemployed is 1:580. This ratio compares very unfavourably to the average international benchmark of 1:100 that is used as reference to assess quality of employment service delivery.
National Action Plan for Youth Employment 2014-2017
24
Table 6. PES staff and ratios staff‐to‐registered unemployed
PES human resources 2009 2010 2011 2012 2013
Central Office 32 33 33 39 37
District and local labour offices 85 85 88 77 78
Total staff assigned to employment i
117 118 121 116 115
Ratio PES staff to registered unemployed 1:135 1:390
Ratio front office staff to registered l d
1:185 1:580
Source: Department of Labour, Ministry of Labour and Social Insurance.
In 2013 the funding for active labour market policies amounted to €17,8 millionand €150,2 million for unemployment benefit. The funding for the unemployment benefit increased by €51,8million since 2011.
The ALMP system in Cyprus comprises employment services, labour market training, employment subsidies and entrepreneurship assistance.
The strategy deployed by the PES for the provision of job search − implemented until the outbreak of the crisis – includes the development of the online automated system (Candidate Placement System, CPS), the introduction of group and individualized counselling services, the formulation of employment plans for jobseekers facing difficulties to re‐integrated in the labour market, and referral to active labour market programmes. As mentioned, most individualized employment services have been curtailed to manage the raising inflow of unemployed.
Training provision is characterized by a multiplicity of programmes, organized with different partners, under the responsibility of the Human Resource Development Authority (HRDA). Training programmes target numerous groups of individuals, for example workers, unemployed in different age‐groups, new labour market entrants, and inactive individuals. The costs of these training programmes are at the higher end of the average recorded in the European Union, as they often combine training with subsidized placement.
Employment subsidies are implemented by the Cyprus Productivity Centre (CPC) and the Department of Labour of the Ministry of Labour Welfare and Social Insurance, as well as by the Ministry of Commerce, Industry and Tourism. These schemes target mostly unemployed and inactive individuals requiring flexible forms of work arrangements; unemployed in the hotel, food and tourism industry; young university graduates; and youth and adult jobseekerswith longer unemployment spells.
The programme to promote entrepreneurship − managed by the Ministry of Commerce, Industry and Tourism − provides financial support to young people (20 to 39 years old) and women (18‐55 years old) planning to set up a business in the manufacturing, trading, service and tourism industries. The scheme require participants to contribute own resources for at least 75 per cent of the total capital required. This eligibility criterion may de‐factoexclude many young potential entrepreneurs with feasible business ideas, but limited resources.
National Action Plan for Youth Employment 2014-2017
25
Finally, there is no unique monitoring and evaluation system to measure the performance and assess the impact of active labour market policies on the employment and earnings prospects of participants.
3.3.2. Passive labour market policies
The social protection system in Cyprus consists of a multiplicity of programmes managed by various government institutions and agencies. The two main types of passive labour market policies in Cyprus are the unemployment benefit and the Guaranteed Minimum Income (GMI).
In 2013 €150,2 million was given to individuals for unemployment benefit. The funding for the unemployment benefit increased by €51,8million since 2011. Many young workers are ineligible for the unemployment benefit, given their short employment history.
The GMI programme provides income replacement to households who do not earn enough to meet their minimum needs. This includes the unemployed as well as the working poor. Beneficiaries are required to actively search for work and participate to labour market re‐integration measures. A system of in‐work incentives is included for all beneficiaries so as to increase available income of the household when they enter the labour market. The recent reform of the social protection system centres on improving the system effectiveness and decreasing leakages. This is to be achieved by:
i) streamlining the existing benefits and improving their delivery by placing all social benefits under one administrative framework;
ii) improving targeting so as to free resources to protect the most vulnerable population groups; and
iii) avoid welfare dependency traps, by balancing protection with incentives to remain or return to work.
National Action Plan for Youth Employment 2014-2017
26
PART II ‐ PRIORITY POLICIES
1. Problem identification
In the period 2008 ‐ 2013 the economy of Cyprus experienced two separate, but inter‐related crises.The first shock in 2008‐2009 was external and its impact on economic and employment growth was not as severe as that experienced by other European Union countries.By the end of 2009 output had declined by less than two per cent of GDP and the unemployment rate had increased to 5.5. per cent of the working age population (from 3.8 per cent in 2008), well below the nine per cent average recorded in the European Union.
The second crisis, specific to Cyprus, was triggered by the over‐exposure of the banking and financial sector in foreign markets and increasing shares of non‐performing loans. The restructuring of the banking sector and the extensive fiscal consolidation pursued to restore public finances caused a contraction of the real economy and a severe deterioration of the labour market. By the second quarter of 2013 the overall unemployment rate had reached 15.7 per cent, while for young people (15‐24) in the labour force it had skyrocketed to 40.3 per cent. Job losses affected mostly young workers with low educational attainment, young women, young workers in the manufacturing and construction sectors, young people on temporary, casual and seasonal jobs and new labour market entrants.
The unprecedented increase in unemployment so far has been mostly cyclical and determined by the deep economic recession and the drastic fall in job vacancies. However, the time required to find a job is becoming longer and longer and long‐term unemployment is increasing. There are strong risks that unemployment and youth unemployment becomes structural, due to negative economic growth and the sectoral reallocation of the labour force.
The fiscal consolidation effort undertaken to restore the soundness of public finances is severely limiting the policy space available to support aggregate demand, expand productive investment and promote job creation.
Throughout the first decade of 2000, the financial sector has been the major contributor to economic and employment growth, while little attention was paid to other economic sectors with value‐adding potential. The current circumstances call for a change in the development model to be pursued, with a focus on sectoral development as a key driver.
The private sector is characterized by micro (often family‐owned) and small enterprises, mostly active in the trading sector and often unable to absorb high‐skilled labour. In the last few years, Cyprus has been losing ground in competiveness, especially with regard to government services for entrepreneurship development, infrastructure upgrading, market efficiency, technological absorption and innovation. A major obstacle for doing business in Cyprus is the cost of starting a business (twice the amount recorded in the European Union) and access to finance, which causes working capital shortages especially among small enterprises.
Educational attainment in the country is generally high. In 2013, theshareof early school leaving amounted to 9.1 per cent of the cohort, which is below the EU
National Action Plan for Youth Employment 2014-2017
27
average. Educational attainment is positively related to labour market outcomes. Having a tertiary education attainment pays a wage premium and shortens the period required to gain the first job. Such returns, however, are undermined by large education and occupation mismatches and the prevalence of employment in economic sectors exposed to high job turnover, temporary work arrangements and lower wage levels (elementary occupations and clerical, services and sales jobs). The linkages between the education system and industry are still under‐developed, with little opportunities for students to practice the skills they have learnt in a work environment. The vocational education system, despite paying a premium in the labour market, still suffers from weak links with enterprises.
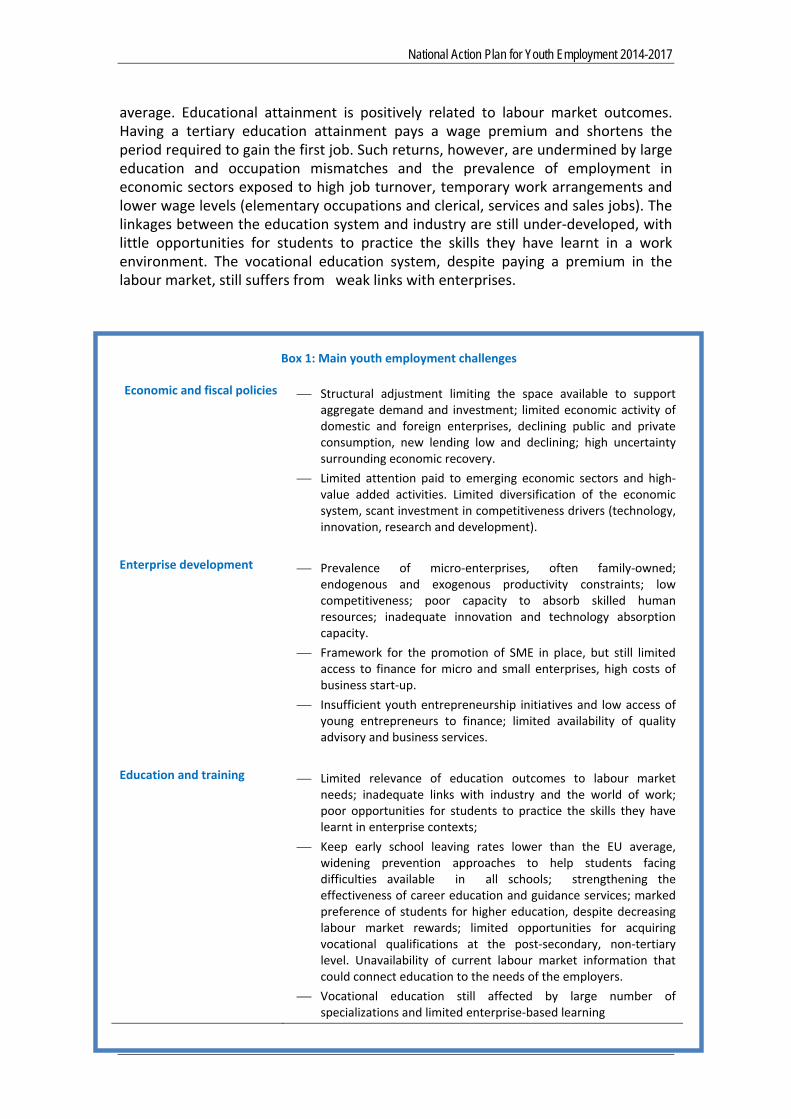
Box 1: Main youth employment challenges
Economic and fiscal policies Structural adjustment limiting the space available to support aggregate demand and investment; limited economic activity of domestic and foreign enterprises, declining public and private consumption, new lending low and declining; high uncertainty surrounding economic recovery.
Limited attention paid to emerging economic sectors and high‐value added activities. Limited diversification of the economic system, scant investment in competitiveness drivers (technology, innovation, research and development).
Enterprise development Prevalence of micro‐enterprises, often family‐owned; endogenous and exogenous productivity constraints; low competitiveness; poor capacity to absorb skilled human resources; inadequate innovation and technology absorption capacity.
Framework for the promotion of SME in place, but still limited access to finance for micro and small enterprises, high costs of business start‐up.
Insufficient youth entrepreneurship initiatives and low access of young entrepreneurs to finance; limited availability of quality advisory and business services.
Education and training
Limited relevance of education outcomes to labour market needs; inadequate links with industry and the world of work; poor opportunities for students to practice the skills they have learnt in enterprise contexts;
Keep early school leaving rates lower than the EU average, widening prevention approaches to help students facing difficulties available in all schools; strengthening the effectiveness of career education and guidance services; marked preference of students for higher education, despite decreasing labour market rewards; limited opportunities for acquiring vocational qualifications at the post‐secondary, non‐tertiary level. Unavailability of current labour market information that could connect education to the needs of the employers.
Vocational education still affected by large number of specializations and limited enterprise‐based learning
National Action Plan for Youth Employment 2014-2017
28
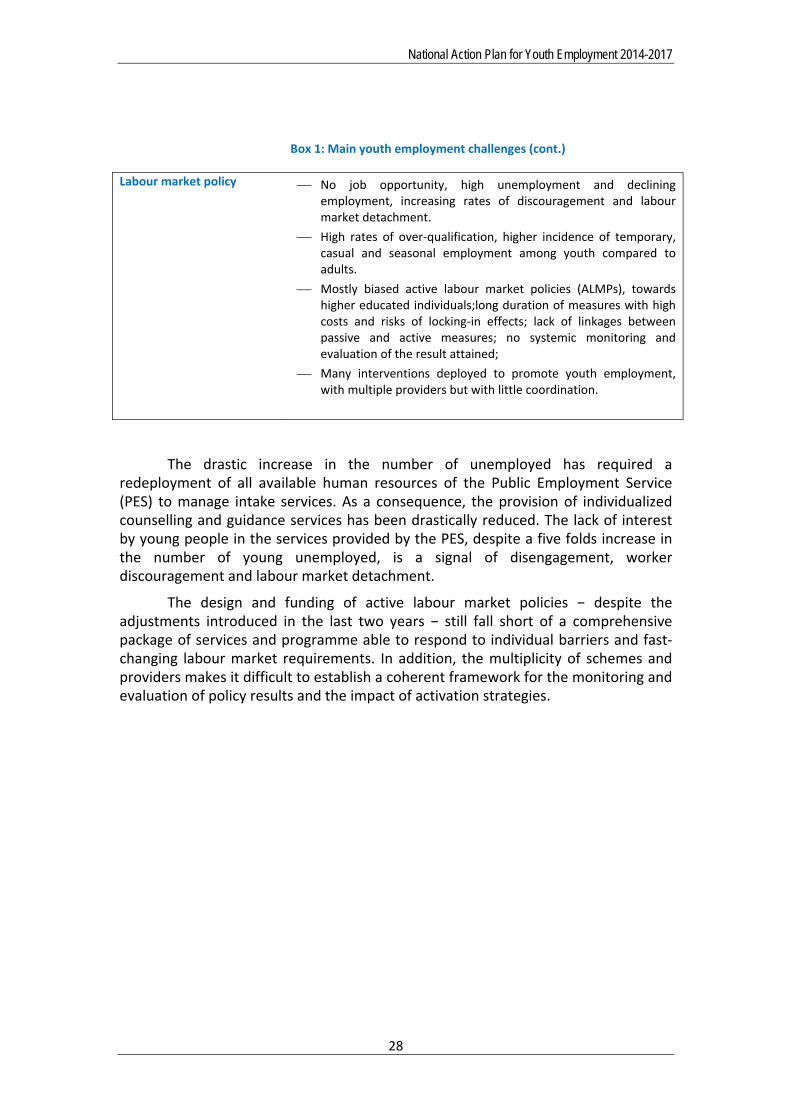
Box 1: Main youth employment challenges (cont.)
Labour market policy
No job opportunity, high unemployment and declining employment, increasing rates of discouragement and labour market detachment.
High rates of over‐qualification, higher incidence of temporary, casual and seasonal employment among youth compared to adults.
Mostly biased active labour market policies (ALMPs), towards higher educated individuals;long duration of measures with high costs and risks of locking‐in effects; lack of linkages between passive and active measures; no systemic monitoring and evaluation of the result attained;
Many interventions deployed to promote youth employment, with multiple providers but with little coordination.
The drastic increase in the number of unemployed has required a redeployment of all available human resources of the Public Employment Service (PES) to manage intake services. As a consequence, the provision of individualized counselling and guidance services has been drastically reduced. The lack of interest by young people in the services provided by the PES, despite a five folds increase in the number of young unemployed, is a signal of disengagement, worker discouragement and labour market detachment.
The design and funding of active labour market policies − despite the adjustments introduced in the last two years − still fall short of a comprehensive package of services and programme able to respond to individual barriers and fast‐changing labour market requirements. In addition, the multiplicity of schemes and providers makes it difficult to establish a coherent framework for the monitoring and evaluation of policy results and the impact of activation strategies.
National Action Plan for Youth Employment 2014-2017
29
2. Policy priorities
The policy space available for the identification of youth employment policy options is determined by the Economic Adjustment Programme (2013‐2016) and the priorities established in the 2012 National Reform Programme for smart, sustainable and inclusive growth.
The fiscal consolidation measuresagreed by the Government of Cyprus within the Economic Adjustment Programme for the period 2013‐2016are aimed atachieving a primary budget balance of 1.2 per cent of GDP in 2016 and four per cent in 2018. Such consolidation effort centres mainly on a combination of tax increases and spending cuts. The negative output growth recorded in 2013 (5.5 per cent of GDP) is projected to decelerate in 2014 and turn positive in 2015 (one per cent of GDP). Overall unemployment is estimated to reach its negative peak in 2014, due to still fast‐raising youth unemployment rates. The labour market is projected to start recovering at a modest pace in 2015, with declining unemployment and increasing employment.
This negative trends severely constraint the policy space available and the resources that can be put forward to support aggregate demand and growth. The primary objective, therefore, is to mitigate the impact of fiscal consolidation on the labour market in the short run and set the conditions for employment recovery in the medium to long term.
Against this backdrop, the priorities to improve youth employment prospects focus on:
(i) Preventing early school leaving and easing the transition from school to work;
(ii) establishing activation strategies through targeted labour market policies for the disadvantaged youth 15‐29, including
(iii) The implementation of a National Youth Guarantee; (iv) Boosting labour demand through sectoral growth, promotion of
micro‐ and small‐enterprises and entrepreneurship development; (v) Formulate outreach strategies and increase labour market integration
of youth (vi) Enhancing effectiveness and impact of employment services and
labour market policies. (vii) Establishing a monitoring and evaluation system
The strategy underpinning such policy interventions combines preventative approaches – to ensure a smoother transition of young people to the world to work− and remedial measures to address the multiple barriers certain groups of young people face in gaining a foothold in the labour market. It addresses both structural and cyclical issues that are affecting the youth labour market.
The medium‐term effect of the combination of these policy options on youth employment is presented in the following paragraphs. For each area, the analysis and evaluation of policy options takes into account the existing policy context and fiscal space, and elaborates on the reforms that are necessary to maximize youth employment outcomes.
National Action Plan for Youth Employment 2014-2017
30
Priority 1: Preventing early school leaving and easing the transition from school to work
Investments in human capital and both quality and relevance of the education and training system are at the core of an innovative and competitive economy that creates decent jobs. Education and training pays a premium in the Cypriot labour market and has a positive impact on the duration of the school‐to‐work transition, but does not protect young people against unemployment and education and occupation mismatch. Unemployment among youth is concentrated at both ends of the educational scale, with low‐ and high‐educated young people being more exposed to unemployment than those with middle‐level education. This situation reflects a misalignment of educational outcomes and the requirements of the labour market as well as the lack of opportunities for students to practice what they learnt in school and acquire work experience.
The on‐going reform of the secondary education system is already addressing some of these challenges through: i) the modernization of curricula to assure the acquisition of the skills and knowledge demanded by the labour market; ii) the improvement of teachers’ training; and iii) early identification of learning difficulties and the development of integration programmes (School Priority Actions). The reform of the vocational education and training system includes measures to: improve the alignment of vocational education outcomes to the needs of the labour market; upgrade the curricula; and reduce the number of specializations.
Also the co‐financing measures implemented by the HRDA are easing the transition from school to work and are addressing to some extend the issue of acquiring work experience.
The additional policy options that are deemed instrumental to shape a comprehensive prevention strategy aimed at smoothing the transition of young people (15‐29) from school to work centre on:
− the inclusion in the vocational secondary and post‐secondary curricula of enterprise‐based learning and work experience opportunities;
− the establishment of a qualitytraineeship system for university students;
− thedevelopment of an early interventionstrategy targeting students at risk of dropout and of early school leaving centred on the timely identification of these cases to the PES for the relevant intervention. ; and
− the strengthening of career education and guidance services to help young people make informed career choices and navigate a rapidly changing labour market.
Priority 2: Establishing activation strategies through targeted labour market policies
The economic crisis has hit young people harder than other age groups. This is being felt mainly in terms of unemployment and longer job search periods. Long unemployment spell early in life leads to skills erosion, loss of employability and

National Action Plan for Youth Employment 2014-2017
31
labour market detachment. For young people, entering the labour market in an economic slowdown lowers earnings and raises career instability.
The design and funding of Cypriot labour market policies was adequate in a situation ofsustained economic and employment growth. Tackling the current youth employment crisis, however, requires to shift emphasis on policies that are targeted to the most disadvantaged youth, are aligned to labour market requirements and simultaneously address labour demand and supply constraints.
This calls for the deployment of a strategy that combines measures targeting young individuals aged 15 to 29 that face multiple barriers to labour market integration and are exposed to longer unemployment spells, with an early intervention approach in the form of a Youth Guarantee to avoid that school leavers and newly unemployed individuals in the younger cohort (15‐24) fall into long‐term unemployment and inactivity traps.
The policy options that are deemed instrumental to help young people gain a foothold in the labour market are:
− The reform of labour market policies– which will benefit all unemployed individuals but specifically young people 15 to 29 years old. This includes:
i)a new design of active labour market policies (employment services, training, acquiring work experience and job creation schemes), and
ii) the reinforcement of activation strategies and better coordination of active and passive labour market policies. Such policy priorities will be accompanied by the introduction of a monitoring and evaluation system to measure the results achieved (Priority 7).
Priority 3: Introducing the National Youth Guarantee
The introduction of a National Youth Guarantee aimed at offering school leavers and newly unemployed youth (15‐24) with an opportunity for education, training, work experience or employment within four months from leaving school or becoming unemployed. The delivery of the Youth Guarantee is organized around an integrated service delivery model that includes:
i) employment services (information on vacancies, group counsellingand job search assistance);
ii) individualized counselling and guidance assistance for those unable to gain a foothold in the labour market within the first four months; and
iii) intensive support, including referral to active labour market/return to education schemes.
Priority 4: Boosting labour demand through sectoral growth, promotion of micro‐ and small enterprises and entrepreneurship development
In order to increase the competitiveness and job creation potential of the private sector, the government is already pursuing − within the framework of the National Reform Programme − a set of measures to:
i) promote value‐added activities with the highest potential for growth and job creation (including information and communication
National Action Plan for Youth Employment 2014-2017
32
technologies, tourism, health, education, Energy including renewable energy and gas industry; and the green and blue economy);
ii) increase investment in research, technological development and innovation; and
iii) facilitate the access of micro‐ and small enterprises to finance; and iv) ease the requirements for business entry and expansion. Such
measures are complemented by the promotion of the tourism sector and the natural gas industry, both of which have a high job creation potential.
The additional policy options that are deemed feasible and desirable to improve employment opportunities for young people include the development of youth entrepreneurship through:
− the National Entrepreneurship Schemeby the promotion of youth‐led enterprises and
− The Social Enterprises Scheme through subsidising, the provision of training to interested youth groups on social economy as well as the preparation and distribution of tools to assist/help then in setting up and managing a social enterprise.
− the setting up of an EntrepreneurshipDevelopment Program provided by the Cyprus Youth Board to provide information, training, advisory and mentoring services for youth up to 29, interested to establish youth‐led enterprises, including social enterprises. The Program includes specific programmes for supporting young entrepreneurs by promoting and enhancing entrepreneurial culture and mind‐set. An effective support mechanism should be established throughout Cyprus to enable more young people with limited resources to start successful small and growing businesses and create decent employment for themselves and others. This holistic support will focus on the personal development of the young entrepreneur as much as the business, long‐term; pre and post‐launch support, mentoring; harnessing the wisdom, experience and support of the local business community
Priority 5: Plan outreach strategies to increase labour market integration of young people
Since 2011 there has been a widening gap between the number of unemployed registering with the labour offices and those identified as unemployed by the Labour Force Survey. This reflects the increasing difficulty of the employment service to manage raising inflows of unemployed individuals and a gradual loss of confidence towards the support this institution can provide. The low level of registrationof young people with the employment service is a signal of disengagement, worker discouragement and labour market detachment.As young discouraged workers and inactive youth in need of support are often invisible to public services, it is necessary to resort to a variety of instruments to reach them.
The policy options that are deemed most relevant to attract young people towards labour market integration services are:
− The implementation of a national informationcampaign to raise awareness on the measures available for the Youth and the support provided by labour market
National Action Plan for Youth Employment 2014-2017
33
institutions is included in the National Youth Guarantee Plan. The outreach plan includes the establishment ofpartnerships with a wide range of institutions, agencies and organizations – including local governments, employers’ organizations, trade unions and youth organizations – to guide youth leaving school and those facing difficulties in the labour market towards the support available in the Public Employment Services;
Priority 6: Enhancing the effectiveness and impact of employment services and labour market policies
The unprecedented increase in the number of jobseekers, the drop of job vacancies and the freeze of hiring in the public administration has seriously undermined the capacity of the Public Employment Service (PES) to respond effectively to labour market challenges. Employment counsellors’ caseload has increased manifolds leaving little time to the screening of the unemployed and individualized services for those most at risk in the labour market.
In order to ensure that the reform of labour market policies and the introduction of a National Youth Guarantee achieve the expected results, it is of the essence to have an effective employment service able to manage clients’ inflows, provide individualized support to those most in need and effectively implement labour market interventions. To ensure transparency, accountability and cost‐effectiveness, the performance of the services and programme implemented need to be constantly monitored and regularly evaluated.
In light of the above, the policy options that are considered instrumental to the delivery of effective labour market policies and the implementation of activation strategies will focus onexpanding the capacity of the PES by:
i) upgrading its information system to reduce the administrative burden and devote more time to clients;
ii) deploy additional staff through the restructuring of public administration the mobility scheme (as foreseen in the MOU) and/or hire the services of a number of counsellors to manage the workload and re‐instate the provision of individualized counsellingand guidance services;
iii) implementing a staff development programme to ensure quality of service delivery; and
iv) expanding the range of services available to employers and improve the canvassing of vacancies.
Priority 7: Establishing a monitoring and evaluation system
Establishing a monitoring and evaluation system to:
i) measure the policy outcomes achieved, ii) determine what works, for whom and why; and iii) provideevidence for policy formulation and resource allocation.
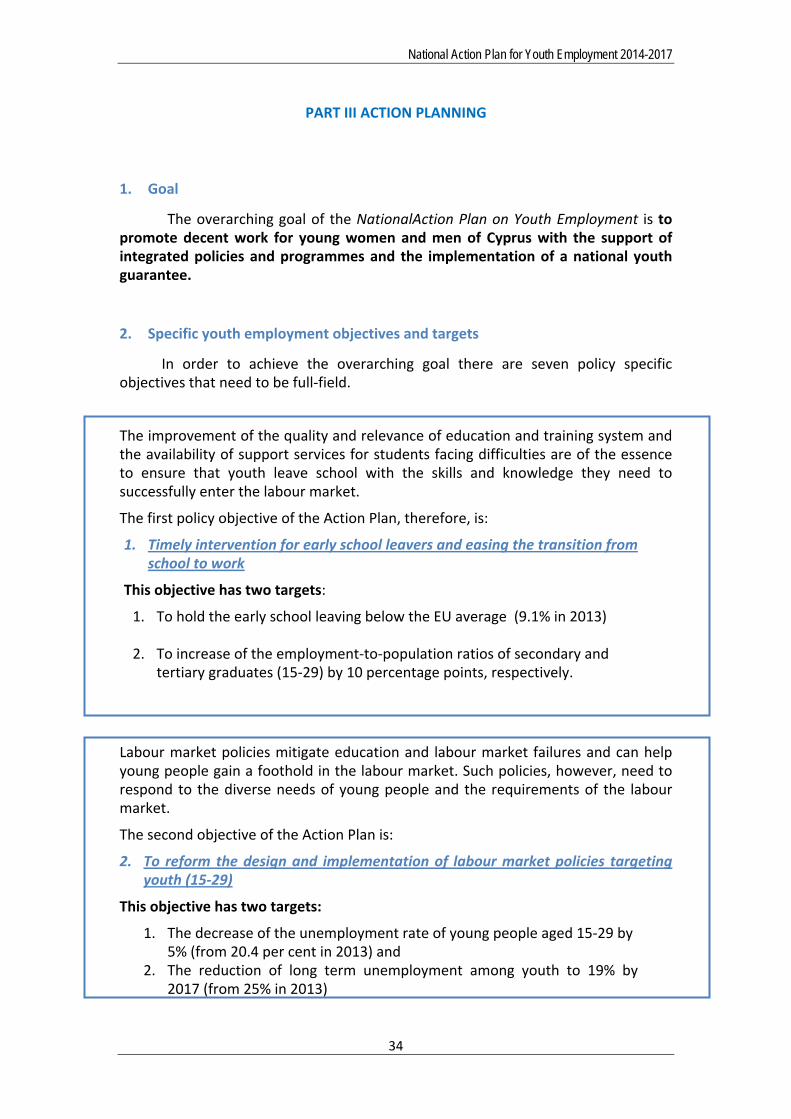
National Action Plan for Youth Employment 2014-2017
34
PART III ACTION PLANNING
1. Goal
The overarching goal of the NationalAction Plan on Youth Employment is to promote decent work for young women and men of Cyprus with the support of integrated policies and programmes and the implementation of a national youth guarantee.
2. Specific youth employment objectives and targets
In order to achieve the overarching goal there are seven policy specific objectives that need to be full‐field.
The improvement of the quality and relevance of education and training system and the availability of support services for students facing difficulties are of the essence to ensure that youth leave school with the skills and knowledge they need to successfully enter the labour market.
The first policy objective of the Action Plan, therefore, is:
1. Timely intervention for early school leavers and easing the transition from school to work
This objective has two targets:
1. To hold the early school leaving below the EU average (9.1% in 2013)
2. To increase of the employment‐to‐population ratios of secondary and tertiary graduates (15‐29) by 10 percentage points, respectively.
Labour market policies mitigate education and labour market failures and can help young people gain a foothold in the labour market. Such policies, however, need to respond to the diverse needs of young people and the requirements of the labour market.
The second objective of the Action Plan is:
2. To reform the design and implementation of labour market policies targeting youth (15‐29)
This objective has two targets:
1. The decrease of the unemployment rate of young people aged 15‐29 by 5% (from 20.4 per cent in 2013) and
2. The reduction of long term unemployment among youth to 19% by 2017 (from 25% in 2013)
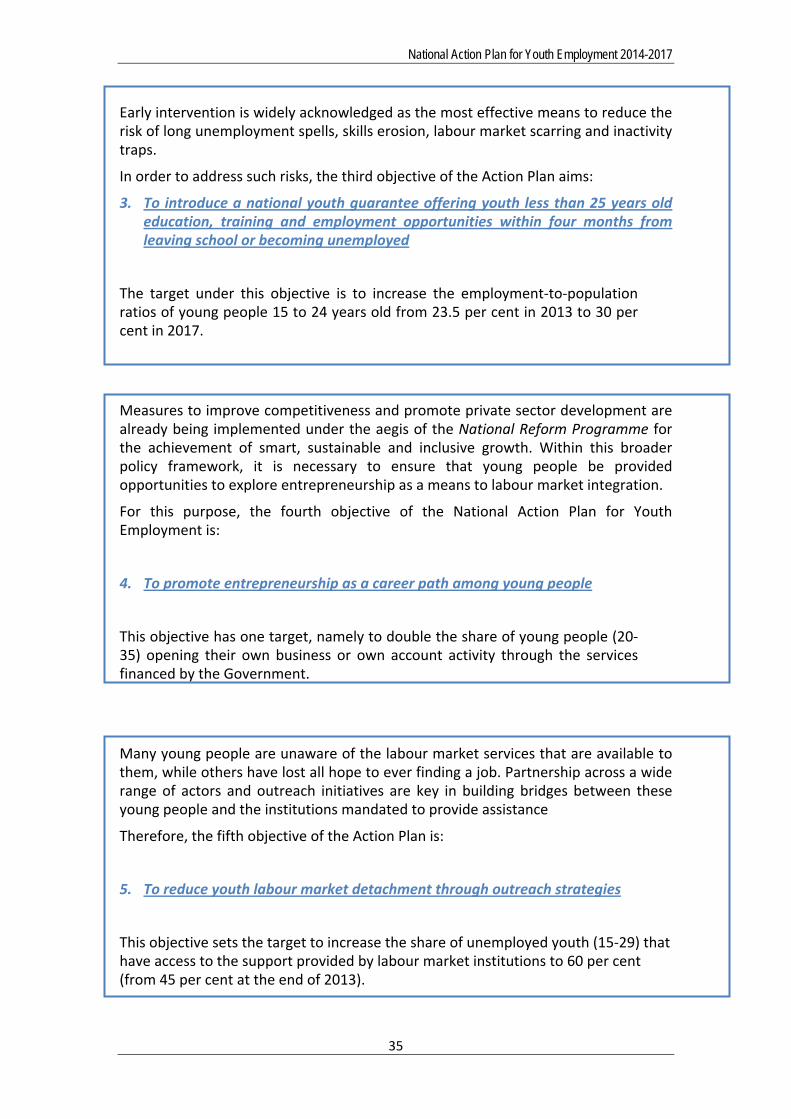
National Action Plan for Youth Employment 2014-2017
35
Early intervention is widely acknowledged as the most effective means to reduce the risk of long unemployment spells, skills erosion, labour market scarring and inactivity traps.
In order to address such risks, the third objective of the Action Plan aims:
3. To introduce a national youth guarantee offering youth less than 25 years old education, training and employment opportunities within four months from leaving school or becoming unemployed
The target under this objective is to increase the employment‐to‐population ratios of young people 15 to 24 years old from 23.5 per cent in 2013 to 30 per cent in 2017.
Measures to improve competitiveness and promote private sector development are already being implemented under the aegis of the National Reform Programme for the achievement of smart, sustainable and inclusive growth. Within this broader policy framework, it is necessary to ensure that young people be provided opportunities to explore entrepreneurship as a means to labour market integration.
For this purpose, the fourth objective of the National Action Plan for Youth Employment is:
4. To promote entrepreneurship as a career path among young people
This objective has one target, namely to double the share of young people (20‐35) opening their own business or own account activity through the services financed by the Government.
Many young people are unaware of the labour market services that are available to them, while others have lost all hope to ever finding a job. Partnership across a wide range of actors and outreach initiatives are key in building bridges between these young people and the institutions mandated to provide assistance
Therefore, the fifth objective of the Action Plan is:
5. To reduce youth labour market detachment through outreach strategies
This objective sets the target to increase the share of unemployed youth (15‐29) that have access to the support provided by labour market institutions to 60 per cent (from 45 per cent at the end of 2013).
National Action Plan for Youth Employment 2014-2017
36
The availability of a wide range of services and programmes to support the integration of young people in the labour market requires a well‐functioning and adequately staffed Public Employment Service able to respond to the diverse needs of youth population groups and the requirements of a fast‐changing labour market.
Thus, the sixth objective of this Action Plan is:
6. To enhance the capacity of the Public Employment Service (PES) for the provision of effective youth employment services
The target under this objective is
1. To increase the placement rate of registered youth (15‐29) by 20% per cent.
2. Increase the number of job vacancies captured by PES by 20%.
The design of services and programmes that respond to the needs of young people and a more rational use of the available human and financial resources requires the availability of reliable information on which programmes work, for whom and why.
Hence, the final objective of the Action Plan is:
7. To establish a monitoring and evaluation (M&E) system to verify the achievement of policy outcomes
The target under this objective is the availability and use of performance information on labour market policies for decision‐making purposes.
The timeframe of the Action Plan for Youth Employment is three years, from 2015 to 2017, although two of the proposed measures, namely the placement of young graduates and young secondary school leavers up to the age of 25, have started to be implemented since March and February of 2014 respectively.
Such timeframe allows the alignment of the Action Plan to the budgetary planning framework of the country and the objectives of the NationalReform Programme. The total number of young people targeted is approximately 35,000, namely 20 per cent of the total population estimated to be in that age group in 2017.
National Action Plan for Youth Employment 2014-2017
37
3. Outcomes and indicatorsbased on the 7 Policy Objectives
Policy Objective 1: Timely intervention for early school leavers and easing the transition from school to work
The objective to ease the transition of young people from school to work builds on:
i) improving the relevance of secondary vocational education; ii) the inclusion of work experience schemes in school and university
curricula; iii) the establishment of a system to monitor students’ performance for early
intervention purposes; and iv) thestrengthening of career education and guidance services to help
young people make career choices.. v)
Outcome1.1. The secondary and post‐secondary vocational education curricula are aligned to labour market requirements and include work experience in enterprises.
Share of secondary and post‐secondary vocational students attending the reformed programmes (over total secondary vocational education students);
Share of graduates under the reformed programmes who are employed (to be measured through the data of the Labour Force Survey).
Baseline: In 2013, the share of young people (15‐24) with upper secondary educational attainment who were employed was 35.5 per cent, i.e. roughly 39,700 young men and women. Of the over 62,700 students enrolled in public and private secondary institutions, less than 8,000 attended the vocational stream.
Also, in 2013 the employment‐to‐population ratio of youth (15‐24) was 23.5 per cent and 38.7 per cent for the cohort 15‐29 years old.
The intervention is aimed at upgrading the secondary and post‐secondary technical education, so as to strengthen the links with the labour market and the needs of the real economy.
The number of vocational and technical specializations offered at secondary and post‐secondary level will be reduced and aligned to the requirements of the labour market. These new programmes will reflect the broad qualifications developed by the Human Resource Development Authority and become integral part of the National Qualification Framework. The curricula reform will be grounded on learning modules aimed at providing learners with the knowledge, skills and abilities required to perform an occupation (ECVET), embed core employability skills (working in a team, using technology, problem‐solving, critical thinking and career management, among others) and foreign languages to increase students’ mobility. Close links among education institutions, the Public Employment Services and industry will be established to provide students with opportunities to practice their skills in an enterprise and to learn on‐the‐job from industry experts.
National Action Plan for Youth Employment 2014-2017
38
Implementing Body: Ministry of Education and Culture
Budget: 700.000€
Target:
Outcome 1.2. A framework for quality traineeship is established to provide tertiary education students with relevant learning experiences in enterprises
Share of tertiary education students undertaking internship periods (over total tertiary education students enrolled nationally, annual basis);
Share of tertiary education students participating to internship programmes who are employed at the end of their studies;
Increase in the employment‐to‐population ratio of tertiary graduates (15‐29) by 10 percentiles.
Baseline: In the first quarter of 2013 the employment‐to‐population ratio of young people (15‐24) with tertiary educational attainment was 56.4 per cent (or slightly over 11,000 young men and women). The work experience programmes implemented to date in the country targeted 2,400 university graduates and yielded a placement rate at follow‐up of 82 per cent.
The organization of internship periods for tertiary education students – practice initiated during the prior programming period by public and private universities though the Enterprise Liaison Offices − will be further expanded and improved. The measure is aimed at the exploitation of infrastructures and methodological tools/information tools developed at public and private universities during the programming period 2007‐2013.
During off periods, students will be placed by their institutions in partner enterprises to advance their learning and gain work experience in their chosen field. The new traineeship framework will: i) offer a structured learning experience with clear objectives; ii) provide opportunities to apply classroom knowledge to a professional environment and refine skills that are transferable to different enterprise contexts, and iii) be based on a written agreement specifying working conditions (hours of work, remuneration/compensation, social security regime applicable). Young trainees will be provided with a description of the position with clearly defined learning objectives and will be closely supervised and mentored by a professional with expertise in the relevant field.
Traineeship schemes will be mainly supported in priority economic sectors (information and communication technologies, tourism, health, education, renewable energy; gas industry; and the green and blue economy) and in areas where there is stronger demand, as determined by the forecasts of the Employment Observatory and the Centre for Economic Studies of Cyprus University. Progressively, the internship framework will provide university students with credits towards their award and become part of the curricula of the university degrees.
National Action Plan for Youth Employment 2014-2017
39
Implementing Body: State and Private Universities operating in the Government
controlled area of the Republic of Cyprus
Budget: 2.500.000€
Target:150 students per year
Outcome 1.3: Providing regular information on school leavers and dropouts for early intervention
Keep the share of early school leavers (youth 18‐24 leaving school with at most ISCED 2 level) below the EU Average at 9%.
Baseline:In 2013 the share of early school leavers was 9.1 per cent of the youth population 18‐24 years old
A Notification System will be establishedbetween the Schools, the Ministry of Education and Culture and the Public Employment Servicesto record all drop out cases and notify to the Public Employment Service information on the young dropouts for early intervention and labour market assistance.
PES counsellors will invite young people for providing support, guidance and assistance through individualised services, aiming at their return back into education or participating in ALMPs to facilitate their entry into the labour market.
Additionally, the School Priority Action (SPA), aims at promoting educational actions, in order for the school unit to offer all students the necessary skills for integration into society, information about the labour market and employment, and/or higher education choices. These actions are a continuation of the good practice of the “School Priority Zones (SPA)” Program, which operate in specific areas (currently in operation eight SPA). The most important change for the programmingperiod 2014‐2020 relates to the provision of integrated services, not on the basis of geographical criteria, but on criteria at school level.
School educational priority actions include:
Personal evaluation, counselling,social supportand Advisory support of the student.
Learning, psychological and social support with additional teaching support activities
Application of a mentor‐teacher and mentor‐ classmate (peer mentor, learning mentor) program.
Preparation for integration into the labour market or into Technical Institutions of higher education, with emphasis on to career issues and general information forstudentsabout lifelong continued learning
Cooperation with the Advisory services of the PES aiming to organise information sessions to inform young people about the labour market and forecasts for the future needs of the labour market in human resources.

National Action Plan for Youth Employment 2014-2017
40
Implementing Body: Ministry of Education and Culture
Budget: 4,000,000€
Target: 50% of the students 15‐18
Outcome 1.4: The career education system is improved and provides students with reliable labour market information and advice on career choices
80 per cent of the total secondary school students receiving career education services (annual basis);
Increase in the employment‐to‐population ratio of youth aged 15‐24to 30per cent and that of the cohort 15‐29 to 45per cent.
Baseline: The number of interventions performed each year by the School Counsellors providing students and the general public (parents, University and College students, and other graduates) with career education services is 38,000 on an annual basis. Part of the 38,000 represents 73 per cent of the secondary school student population of the academic year 2013/2014.18.5 per cent of the total number of students participating in career educationtakedifferent career guidance tests available to the Career Education and Counselling Service of the Ministry of Education and Culture(CCES). In 2013, the employment‐to‐population ratio of youth (15‐24) was 23.5 per cent and 38.7 per cent for the cohort 15‐29 years old.
The services offered by the Career Education and Counselling Service of the Ministry of Education and Culture will be diversified and enriched by continuously‐updated information on emerging labour market needsprovided by the Public Employment Service.
The intervention relates to:
‐ The widening of the career counseling services offered to students and the
general public.
‐ The hiring of a number of new school Counselors
‐ The re‐training of existing School Counselors
‐ PES Counselors sharinginformation with the School Counselors about the
emerging needs and the prospects of the labor market.
‐ Provision of information from the School Counselors to PES Counselors
regarding guidance, knowledge and skills that the educational system offers.
‐ The diversification of the vocational guidance services of the Ministry of
Education and Culture to better support the vocational choices of the
students, in close cooperation with the Secondary Vocational Education and
Training stream and PES.
‐ The continuous updating of the knowledge and skills of the Educational
counsellors to provide labour related support and advice to students.
National Action Plan for Youth Employment 2014-2017
41
Existing tools, used by Career counselors, will be used and there will be training on related issues, including VET issues, while there will be decongestion from activities not directly related to the subject of their work (mostly administrative work
The referral system between career counsellors and education psychologists will continue to enhance the services offered to help students face difficulties that they may have at school or in their personal life. Such a mechanism has been recently introduced (September 2014) and will be instrumental in addressing individual risk factors before they lead to poor school performance, dropout and early school leaving.
Implementing Body: Ministry of Education and Culture
Budget: 1,200,000€
Target:60,000 interventions per year
75% of the students 15‐18
POLICY Objective 2: To reform the design and implementation of labour market policies targeting youth (15‐29)
The design of labour market policies will be reformed with a view to offer a comprehensive package of services and programmes (employment services, training, and job creation schemes) to help young unemployed back in jobs. Such reform will include a new design of active labour market programmes, the reinforcement of activation strategies linking benefits to job search and a monitoring and evaluation system to assess the results achieved.
Such reform will be instrumental to the introduction of an activation strategy targeting young people (15‐24) in the form of a National Youth Guarantee, and the implementation of interventions targeting youth (15‐29) facing multiple barriers to labour market integration and exposed to long‐term unemployment.
Outcome 2.1. The design and implementation of labour market policies is improved to effectively address the multiple disadvantages faced by young people
30 per cent of unemployed youth (15‐29) registered with the PES referred to the various service lines available (employment services, individual employment planning, training, job creation programmes and work experience schemes).
Decrease in the share of long‐term unemployed youth (15‐24) to19%by 2017.
Baseline: In 2013, approximately1,500 youth (15‐29) registered with the PES received employment services and were referred to active labour market programmes. This represented roughly 11 per cent of the average number of 15‐29 years old registered with the PES. In 2013, the share of unemployed youth (15‐24) experiencing long term unemployment spells was 25 per cent.
National Action Plan for Youth Employment 2014-2017
42
Labour market policies will be re‐designed with a view to offer a package of services and programmes to ease the transition of young peopleto decent work and include an activation strategy in the form of a Youth Guarantee.
The effectiveness of labour market measures will beenhanced through the provision of employment services for all youth 15‐29 registering with the Public Employment Services (through self‐service, group counselling and job search training) andmore intensive and targeted assistance for those who are “hard‐to‐place”. The various service packagesto support youth labour market integration are grouped intoa single Youth EmploymentNational Programme, with various strands and options to better respond to individual needs and labour market circumstances. The National Programme includes:
− Employment services: labour market information,group counselling andjob search training will be offered by the Public Employment Services (directly or through outsourcing) to young people who register. Tailored counselling and guidance services and individual employment planning approaches will be made available to those facing barriers to labour market integration. Advertising, partnership and outreach strategies will ensure that young people become aware of the labour market support that is provided to them by labour market institutions.
− Second chance schemes will offer early school leavers and low‐skilled youth (15‐29) the opportunity to gain a formal education qualification. This strand of the National Programme comprises four options: (i) preparatory vocational training to provide young people who left school early with the basic vocational and core employability skills to enter the labour market or progress to vocational/technical education; (ii) evening courses organized in technical schools and leading to a formal certificate; (iii) supported return to full‐time, regular education programmes; and (iv) alternating vocational training that combines school learning with enterprise‐based training.
− Skills enhancement: this strand of the National Programme will target young people aged 15 to 24 who lack the skills to gain a foothold in the labour market. The options available include: (i) vocational training offered by post‐secondary vocational education institutions; (ii) alternating vocational training, (available to youth less than 25 years old with no prior work experience); (iii) vocational training organized in partnership with public and private technical education and vocational training institutions. The combination of these programme options is instrumental to increase the training places available to unemployed youth and expand the range of occupations for which training is available. Training courses will mainly be provided in those occupations for which vocational standards have already been developed by the Human Resource Development Authority.
Employment subsidy: this strand of the National Programme provides incentives to enterprises to recruit young unemployed facing particular barriers in finding and retaining a job (low‐skilled youth, social protection beneficiaries, unemployed at risk of long‐term unemployment). The subsidy will cover part of the wage of the subsidized young worker for a period of six months (with an obligation to retain the worker for an additional periodafter the end of the subsidised period). An additional incentive may be provided to enterprises
National Action Plan for Youth Employment 2014-2017
43
operating in priority economic sectors (ICT, tourism, education, health, green and blue economy, Energy including gas industry and renewable sources).
Traineeship: This scheme will offer young university graduates (up to 29 years old) and secondary school leavers under the age of 25 a six month sponsored traineeship in an enterprise operating in an area related to their field of study. Trainees will receive in writing a clear description of the post, the learning objectives to be achieved, the compensation/remuneration conditions applicable and social security arrangements.
− Mobility programme: Training and internship opportunities (up to six month duration) will be organized through the PES‐EURES network in other EU member states in priority economic sectors and occupations that are most demanded by the national labour market. The target groups are young secondary and tertiary education graduates (up to 29 years of age) who are unemployed.
Implementing Body: Ministry of LabourWelfare and Social Insurance
Budget: 0,0€ ‐ The total budget available for all ALM for the target group 15‐29
has been calculated in outcomes 3.2 ‐3.7 which include the Youth Guarantee
Schemes
Target: 50% eligible youth 15‐29
Outcome 2.2: Targeting mechanisms are introduced in labour market policy formulation and implementation to reach‐out to disadvantaged youth
At least 50 per cent of unemployed youth (15‐29) identified at high risk are referred by the PES to individualized counselling and guidance and labour market programmes.
Decrease in the share of youth (15‐24) who are long term unemployed to 19% per cent by 2017
Baseline: The share of young long‐term unemployed in 2013 was 25 per cent.
Targeting approaches to differentiated labour market assistance among youth population groups will focus on: i) the identification of those factors that place a young person at risk of remaining unemployed for more than six months and ii) the development of approaches for caseworkers to assign individuals at risk to the range of employment services and programmes made available. The major tool used by the PES is group and individualised counselling.
The factors that will be taken into consideration for screening individuals at risks will include age bracket (15‐19; 20‐24 and 25‐29); sex, educational attainment and stream, occupational qualification, social protection status, national origin, unemployment duration and geographical location. Young unemployed facing multiple risk factors will be referred to caseworkers who will identify the most appropriate sequence of services and programme options that are available at a given time.
National Action Plan for Youth Employment 2014-2017
44
Implementing Body: Ministry of LabourWelfareand Social Insurance
Budget: 0.0
Target: all eligible youth 15‐24
Policy Objective 3: Implementing a National Youth Guarantee
The National Youth Guarantee will offer school leavers and newly unemployed youth (15‐24) with an opportunity for education, training, work experience or employment within four months from leaving school or becoming unemployed.
The implementation strategy of the Youth Guarantee includes:
i) an integrated service delivery model (from low‐ tohigh‐intensity services);
ii) a range of employment services (labour market information, group counselling, individualized assistance and individual employment planning); and
iii) a portfolio of measures designed to ease the return to school, acquire the skills demanded by the labour market, gain the work experience prized by employers, get a subsidized job or enter self‐employment.
The National Youth Guarantee is accompanied by outreach strategies, information campaign and partnership agreements to direct young people towards the support that is available(Objective5); the strengthening of the capacity of the Public Employment Service to provide effective services and implement labour market policies(Objective 6)and a monitoring and evaluation system to measure medium and long‐term outcomes (Objective 7).
Outcome 3.1. An integrated service delivery model is introduced for the implementation of the Youth Guarantee
35% of school leavers and newly unemployed youth (15‐24) participating to the services and programmes made available under the Guarantee;
70% of progression of young beneficiaries across the service lines included in the guarantee
Baseline:There is no baseline for these indicators, as the integrated service delivery model will be introduced under the reform of the labour market policy system and for managing the intake of young people under the Guarantee.
The National Youth Guarantee is organized around an integrated service delivery model as shown in the following figure.
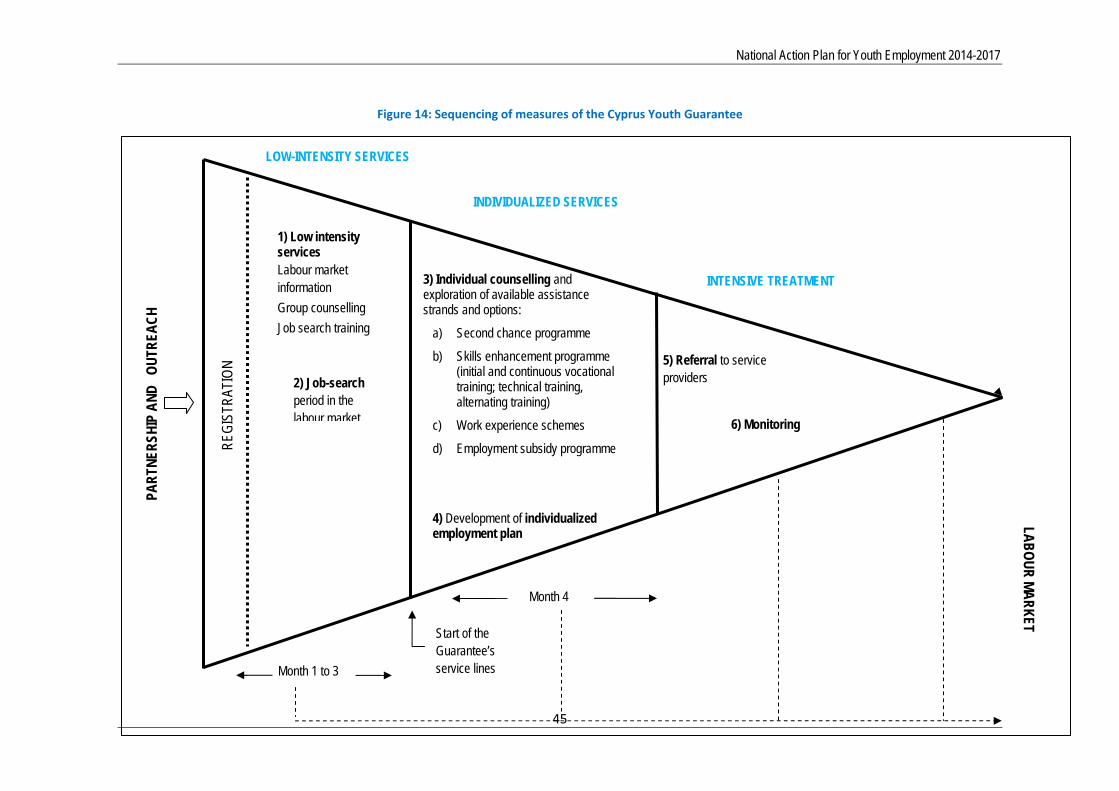
National Action Plan for Youth Employment 2014-2017
45
Figure 14: Sequencing of measures of the Cyprus Youth Guarantee
LOW-INTENSITY SERVICES
INDIVIDUALIZED SERVICES
INTENSIVE TREATMENT
Month 1 to 3
3) Individual counselling and exploration of available assistance strands and options:
a) Second chance programme
b) Skills enhancement programme (initial and continuous vocational training; technical training, alternating training)
c) Work experience schemes
d) Employment subsidy programme
4) Development of individualized employment plan
LAB
OU
R M
AR
KET Start of the
Guarantee’s service lines
1) Low intensity services Labour market information
Group counselling
Job search training
5) Referral to service providers
6) Monitoring
Month 4
2) Job-search period in the labour market
REG
ISTR
ATIO
N
PAR
TNER
SHIP
AN
D
OU
TREA
CH
46
Partnerships, outreach strategies and information campaigns will raise awareness among young people about the Youth Guarantee and the support that is available through the Public Employment Services (Outcomes 5.1 and 5.2). The‐identification system and early intervention approaches implemented in schools (Outcome 1.3) will allow the PES to reach‐out to young dropouts and early school leavers and offer the assistance available under the Guarantee.
Registration with the PES will be the entry point for youth (individuals aged 15 to 24 leaving school or newly unemployed) into the Guarantee. The registration requirement will allow the PES to collect the information necessary for planning service delivery, allocate resources, monitor individual progression and evaluate policy outcomes.
At the low‐intensity service stage, young individualswill be informed about the services available, what they may expect from the guarantee and the specific requirements that apply. This stage of assistance provides young people with labour market information, group counselling and job search training to enable them to search for work independentlyfor a period of three months.
If by the end of the assisted job search period the young beneficiary still has no concrete job prospects, she/he is referred to individualized counselling and guidance. This second tier of assistance will allow to:
i) identify the specific barrier(s) faced by the young individual in entering the labour market (risk factors), and
ii) select the most effective mix of services and programmes to lead to a job or back to education. The intervention strategy agreed upon by the casework and the young person will become the core feature of the Individual Employment Plan (IEP).
The development of an individual employment plan (IEP)–listing the actions that are expected to lead to a job in the labour market or a return to school − marks the beginning of the third tier of assistance, which includes referral to active labour market/return to school programmes, mutual obligations, and monitoring of individual progression towards the achievement of the employment/education objectives expressed in the IEP.Beneficiaries of the Guaranteed Minimum Income (GMI)will be referred to individualized counselling and job search assistance (second tier assistance) as a mandatory requirement for the continuation of the benefit payment. These young individuals will also have the option to attend core employability skills training (communicating with others, working in a team, problem‐solving, self‐assertiveness coaching). For non‐recipient youth, the obligation will trigger at the moment of the signature of the Individual Employment Plan.
The National Youth Guarantee will offer young people referred to higher‐intensity services a number of education and labour market integration options outlined in below (Objectives 3.2 to 3.7).
47
Outcome 3.2.Labour market information, group counselling and jobs search services are provided to school leavers and newly unemployed youthas part of the Youth Guarantee
35% of school leavers and newly unemployed youth (15‐24) receiving employment services;
20% of beneficiaries of employment services finding employment within four months and 30% share of beneficiaries progressing to individualized services
Baseline:None, as the sequence and type of services to be offered through the Youth Guarantee are of new design.
Employment services are widely acknowledged as the most cost‐effective means to ease the transition to work, especially for those young people who are more job ready or possess the skills required by the labour market.
After registration with the Public Employment Service, young people will be guided towards available resources on economic sectors and enterprises that are creating jobs, information on current vacancies, assistance in writing curriculum vitae and in preparing for job interviews. All eligible youth will be required to undertake a period of independent job search in the open labour market (three months). This period will:
i) help young people acquire the job search skills needed to navigate a rapidly changing labour market; and
ii) allow the PES to progressively move to individual counselling sessions, job‐search monitoring, and identification of labour market barriers.
Case management approaches will allow to monitor the progress of individuals through the portfolio of services and programmes that are part of the Guarantee, ensure compliance with the mutual obligation requirements and feed information into the monitoring and evaluation system.
Implementing Body: Ministry of LabourWelfareand Social Insurance
Budget: 500,000 € (70% of the budget and the target to be allocated for the age
group 15‐24)
Target: 50 % all eligible youth 15‐29
4500 eligible youth
Outcome 3.3 A second chance programme is available and provides early school leavers and unemployed youth with the qualifications needed by the labour market and pathways to re‐enter education
35 %of eligible youth (15‐19) referred to second chance programmes; 35 % of young beneficiaries (15‐19) gaining a formal qualification (by
programme option)
Baseline:None, as the return‐to‐school schemes to be provided under the Youth Guarantee have newly designed features.
48
The second chance programme will target primarily young people (15‐19) who left school early and will offer them an opportunity to gain a formal qualification or return to full‐time formal education. The programme options available include:
(i) Evening courses in technical and secondary schoolswill be made available bypublic eveningtechnical or general education schools and will lead to a formal qualification. With respect to Vocational Education, Priority will be given to courses equipping youth with the technical skills that are demanded by the labour market;
(ii) Alternating training(Modern Apprenticeship Scheme ‐NMA). This optionwill offer young beneficiaries the possibility of acquiring a formal vocational qualification by combing periods of learning in schools with periods of enterprise‐based training;
(iii) Basic Skills Programme. This optionprovides early school leavers with the basic vocational and core employability skills to enter the labour market or progress to vocational/technical education.
Provision of Evening Courses:
Implementing Body: Ministry of Education and Culture
Budget: €1,800,000
Target: 800 youth (15‐24) per year
Provision of Alternate Training (NMA) and Basic Skills training programs
Implementing Body: Cyprus Productivity Center
Budget: €5,000,000
Target: Total of 500 graduates (15‐24)
Outcome 3.4. Training programmesare made available and provide young people with skills required by the labour market and by occupations that are in demand
25percent of eligible youth (15‐24) referred to training programmes (by option);
55percent of young beneficiaries completing the training programmes and employed 12 months after participation
Baseline: None, as some of the training options available are of new design
Training schemes will be offered within the Skills Enhancement strand of the National Programmeto equip young beneficiaries with the skills required by the labour market and for occupations that are in‐demand. The project will use existing training infrastructure in general. Creating new training infrastructure is not attractive because of the high cost in relation to the small size of the economy. The aim of the training programs offered will promote the adoption of System of Vocational Qualifications developed by the Human Resource Development Authority (HRDA).

49
A basic condition for participation in the trainings offered will be the candidate's record in the PES which will act as a central point for evaluation and placement of the unemployed in training programmes through the outcome of the advisory process.The options available include:
(i) ThePost‐secondary vocational training. This option, provided by public post‐secondary education institutions, will offer two‐year courses to acquire or upgrade the competencies required to perform an occupation.
(ii) Skills Enhancement through traineeship periods. This optionwill offer young beneficiaries the possibility of acquiring a formal vocational qualification (or follow a path leading to one) by combing periods of learning in school based environments with periods of enterprise‐based training
(iii) Participation in skill enhancement programs offered in partnership with private training institutes. This will engage young beneficiaries to attend technical training courses and receive a certificate. It will be organized in partnership with private education institutions.
Provision of Post‐Secondary Vocational Training:
Ministry of Education and Culture
Budget: €1,700,000
Target: 600 youth (15‐24) per year
Skills Enhancement through alternate traineeship periods
Implementing Body: Cyprus Productivity Center
Budget: €500,000
Target: 100 youth (15‐24)
Skills Enhancement through programs offered in partnership with private
institutions
Implementing Body: Public Employment Services
Budget: €700,000
Target: 150 youth (15‐24)
Outcome 3.5a.In‐Company placements for acquiring work‐experience are provided to ease the transition of young secondary education graduates to the world of work and improve enterprise competitiveness
30 percent of eligible youth (15‐24) referred to traineeship schemes;
55percent of young beneficiaries employed after participating to a traineeship scheme
Baseline: None, as the traineeship scheme to be offered under the Youth Guarantee include new features as recommended by the European Union for quality traineeships.
50
This programme will build on the experience already gained and will offer young secondary education graduates (up to 24 years old) with a six month placement in an enterprise according to their qualifications.
The trainees will receive a clear description of the position, the learning objectives to be achieved, the compensation/remuneration conditions applicable and social security arrangements. They will be closely monitored and mentored by trainers within the enterprises.
The unemployed will be guided and supervised by a suitable mentor employee of the company/organization. The jobseeker will be provided with a monthly allowance up to 500 euros/month for the duration of the placement (up to 6 months). Target group: Young secondary school or technical school graduates, aged 18‐24 years old, with no previous experience.
Implementing Body: Human Resources Development Authority
Budget: 8,500,000 €
Target: 2500 eligible youth 15‐24
Implementing Body: Human Resources Development Authority
Budget: 700,000 €
Target: 175 eligible youth 15‐24
Outcome 3.5b.Work experience schemes are provided to ease the transition of youngtertiary graduates to the world of work and improve enterprise competitiveness
30percentof eligible youth (15‐24) referred to work experience schemes;
55percentof young beneficiaries employed after participating to a work experience scheme
Baseline: None, as the work experience scheme to be offered under the Youth Guarantee is new.
This programme will build on the experience already gained and will offer young persons a six month placement in an enterprise operating in an area related to their qualifications in order to acquire work experience.Under this action, the unemployed person will be placed for a specific period of time (6 months) in a company/organisation with the purpose of obtaining work experience in the field of its study. The unemployed will be guided and supervised by a suitable mentor employee of the host company/organization
A monthly allowance of up to €500/month willbe provided to the trainee for the duration of the placement. Target group: Unemployed young tertiary graduates up
51
to35 years of age, without prior experience in their subject of study beyond 3 months.
Implementing Body: Human Resources Development Authority
Budget: 8,500,000 €
Target: 2500 eligible youth 15‐35
(30% of the budget and target is expected to service the 15‐24 group)
Implementing Body: Human Resources Development Authority
Budget: 400,000 €
Target: 100 eligible youth 15‐24
Outcome 3.5c: Mobility programme for acquiring work experience in another EU Member state:
Training and internship opportunities (up to six month duration) will be organized through the PES‐EURES network in other EU member states in priority economic sectors and occupations that are most demanded by the national labour market. The target groups are young secondary and tertiary education graduates (up to 29 years of age) who are unemployed. Target group: Unemployed young tertiary or secondary schoolgraduates under 29 years of age, without prior experience in their subject of study beyond 3 months.
Baseline: None, as the design of the mobility programme to be offered under the Youth Guarantee is new.
Implementing Body: Public Employment Services
Budget: 300,000 €
Target: 80 eligible youth 15‐29
(50% of the budget and target to be allocated to the 15‐24 age group)
Outcome 3.6 Incentives to recruit youth are provided to private sector enterprises with emphasis on priority and growing sectors
600eligible youth (15‐24) will be referred to the employment programme;
At least 60 per cent of young subsidized workers will still be employed 12 months after the end of the programme
Baseline: None, as the design of the employment subsidy programme to be offered under the Youth Guarantee is of new design.
The Scheme will be flexible and its main purpose will be to provide incentives to employers in order to hire unemployed persons. The Scheme will offer additional (to the basic) incentives to employers in priority sectors of the economy (information
52
and communications technology, health, tourism, energy and social, green and blue economy) which have prospects for growth.
The subsidy will cover part of the wage of the subsidized young worker for a period of six months (with an obligation to retain the worker for an additional periodafter the end of the subsidised period).
The scheme will also target high‐growth sectors of the economy Priority areas are defined as the areas of information technology and communications, health, education, tourism, social economy and green and blue economy. An additional incentive will be offered to companies operating in the above mentioned sectors.
Implementing Body: Public Employment Services
Budget: 2,000,000 €
Target: 600eligible youth (15‐24)
Outcome 3.7: Activation ofGuaranteed Minimum Income (GMI) recipients.
At least 20% of young benefit recipients are in employment or education 18 months after their placement Baseline: None. This programme will provide young people (18‐29) who are difficult to be employed to be placed for 6 months in Local Authorities or NGOs and to be engaged in either public works or communityl work aiming to activate them, improve their skills and the services provided to the public. Their participation will be incentivised by providing a monthly allowance of up to 150 per month (additional to GMI) for covering additional costs including travelling.
The target of this scheme is to place 600 of young benefit recipients (GMI) in subsidized jobs related to public and social work, providing them the opportunity to enhance their social skills and help them to integrate into the society and the regular work force.
Implementing Body: Welfare Benefits Administration Service
Budget: 480,000€
Target: 600eligible youth (15‐29)
50% of the budget and target to be allocated to the 15‐24 age group
53
POLICY Objective 4: Promote Entrepreneurship as a career path ‐ Boosting labour demand through sectoral growth, promotion of micro‐ and small enterprises and entrepreneurship development
The strategy to promote youth entrepreneurship as a viable career option for young Cypriots builds on the access to finance, with a focus on those economic sectors that have been identified as key for the development of the country.
The attainment of the youth entrepreneurship development objective is grounded on two interlinked outcomes: 1) the Youth Entrepreneurship Scheme, and 2) the Social Enterprise programme, 3) the provision of training and advisory services for young people wishing to set up their own account activity.
Outcome 4.1.The Youth Entrepreneurship Schemeandthe Social EnterpriseProgram is available to young people (20‐35) to set up their own enterprise.
70 new enterprises will be created by young people through support from the National Entrepreneurship Scheme. Is expected that additional 1,500 new jobs will have been created.
At least 60 per cent of youth setting up a business through the services of the National Entrepreneurship Scheme will still be in business 24 months after participation.
Promoting social economy by providing funding for the establishment of 20 social enterprises (no age limit for eligible applicants)
At least 60% of social enterprises set up and funded by the Social Enterprise programme will still be in business 24 months after the funding ends
Baseline: By 2013, the National Entrepreneurship Scheme had supported 384 business ventures set up by young entrepreneurs (20 to 35 years old). After 36 months, 60 per cent of supported businesses were still in operation.
The Youth Entrepreneurship Scheme provides financial support to young entrepreneurs 20 to 35 years old. Ventures that exploit new technologies, introduce new methods for the production and distribution of goods and services, or operate in the environment protection field (green economy) will receive priority attention.
The purpose of this action is to provide incentives in the form of financial aid and training for the creation of new and sustainable small / micro‐enterprises. Special emphasis is given to the exploitation of new technologies, to use innovative production methods and promotion of products and services, the development of entrepreneurship in the field of the environment and in general in the promotion of modern business with the aim of creating dynamic, progressive and competitive businesses.
54
The Youth Entrepreneurship Scheme
Implementing Body: Ministry of Commerce, Industry and Tourism
Budget: 3,150,000€
Target: 70new SMEcreated by young people up to 29
The potential of social businesses, as an additional means to achieve smart and inclusive growth particularly at the local level, will also be explored. This outcome will be realized through a partnership between the Ministry of Labour Welfareand Social Insurance and the Ministry of Commerce.
The aim of this action is the integration into the labour market young people who either encounter difficulties due to the economic situation or they lack relevant qualifications and skills needed to engage into the labour market. The integration of the youth (20‐29) will be attempted through the creation of cooperatives and other social enterprise initiatives.
The main scope of these social economy organizations will be the provision of goods and services (including employment) to members or their community and pursue activities that benefit the wider society.
Priority will be given to sectors of the economy that show growth prospects (information technology, energy, green economy, health, education, and tourism). The focus of social enterprises will be associated with services that each local community highlights as a priority.
The Social Enterprise Program
Implementing Body: Ministry of LabourWelfareand Social Insurance
Budget: 1,200,000€
Target: 40new SME created from young people up to 29
Outcome 4.2.The development of an Entrepreneurship Development Program (EDP) promoting entrepreneurship as a career option for young people and sustaining their entrepreneurial path
At least 50 per cent of young individuals who set up a business or own account activity using the services of the EDP are still in business/own account work after 24 months.
At least 300 secondary and tertiary education graduates (18‐29) have access to the services provided by the EDPon an annual basis.
Baseline: None, as the Entrepreneurship Development Program is being established with this Plan.
The EDPwill be set up by the Youth Boardof Cyprus through its already established network, in partnership with the Public Employment Services. The
55
services that will be offered will implement a comprehensive programme to support unemployed youth (mainly university and secondary education graduates) in realising their entrepreneurial potential. An effective support mechanism will be established nation‐wide to enable young people with limited resources to start successful small and growing businesses and create decent employment for themselves and others.
More specifically, the Program will: (i) organize information campaigns to establish an entrepreneurship culture among young unemployed people (18‐29); (ii) offering business skills training (business planning, start‐up procedures, management, marketing, sale techniques) targeting young unemployed, including the youth (20‐29) participating in entrepreneurial Schemes funded from the structural funds; (iii) provide mentoring and business advisory services; and (iv) offer assistance to manage the administrative procedures related to business start up.
These latter services, in particular, will rely on a web‐based platform providing information and advice and the establishment of a one‐stop‐shop for dealing with start‐up procedures.
The Program will be provided at the Multifunctional Youth Centres or the Youth Information Centres of the Youth Board of Cyprus. In these youth friendly structures a young person will find different counselling services depending on what he/she needs to embark in its entrepreneurship pathway, information on national and European opportunities, different workshops and educational sessions.
The Entrepreneurship Development Program
Implementing Body: Youth Organisationof Cyprus
Budget: 300,000€
Target: 300 youth (18‐29) have access to the servicesannually
PRIORITY Objective 5: Reducing youth labour market detachment through outreach activities
As young discouraged workers and inactive youth are often invisible to public services, it is necessary to resort to a variety of instruments to reach them. Comprehensive outreach strategies arekey in building bridges between these individuals and available services.
Outcome 5.1: A national information campaign is implemented to raise awareness on decent work for young people and the support provided by labour market institutions, including through the National Youth Guarantee
Over 10,000 youth (15‐29) aware of the support provided by labour market institutions, the Youth Guarantee and the National Action Plan for Youth Employment;
56
Increase in the share of young people (15‐24) registering with the PES to 45 per cent of the young unemployed estimated by the Labour Force Survey.
Baseline:In 2013, the share of young people (15‐24) registered with the PES (4,600 individuals) over the total number of unemployed youth (15,746 individuals) was 29 per cent.
Information and advertisement campaigns with the active involvement of the young themselves and in partnership with their organisations will be organized to inform young people, stakeholders and the general public about the National Action Plan for Youth Employment, the National Youth Guarantee and the support that is made available by labour market institutions.
Such advertising effort will include social media campaigns, newspapers, electronic media television and radio, workshops and other events. The main target groups will include students, jobseekers, inactive youth and young men in mandatory military service; local government authorities; employers’ and workers’ organizations; professional associations; education and training institutions; and youth organizations.
TheMedia Strategy to promote the National Action Plan for Youth Employment and the Youth Guarantee programme combines a range of comprehensive information, publicity and public consultation activities with an aim to raise awareness for target audience of available support offered by labour market institutions and active labour market initiatives and programmes. Indicative publicity and awareness raising actions include:
Promotional activities through traditional, electronic and web based media to disseminate Youth Employment Initiative and Youth Guarantee programme announcements, calls and reporting on progress and results of employment policies.
Reach out campaigns to targeted audience by organising workshops, conferences, media events, and public consultation sessions to invite stockholders to inform interested parties of the benefits to participate in the active labour initiatives offered by PES and other public agencies
Below the line publicity actions attracting the interest of the media to create media reports, articles, special talk shows, commentary etc
Organizing various workshops, conferences and media events for activation purposes
Publicity and promotion actions cover the whole period of implementation of the Strategy.
The communication plan is structured in three distinct phases:
1. The inauguration of the National Strategy for the Youth: focusing on informing potential beneficiaries and the possibilities for integrating them in
57
opportunities offered to the youth such as training programs, work experience programs and entrepreneurship opportunities. The campaign has to focus on eligibility criteria in order not to create over expectations.
2. The establishment of partnerships with a wide range of institutions, agencies and organizations – including local governments, employers’ organizations, trade unions and youth organizations – to guide youth leaving school and those facing difficulties in the labour market towards the support available in the Public Employment Services;
3. During the development and implementation: focusing on informing the
main target audience, and basically the eligible target group for the implementation of the measures, customizing the information campaign. The campaign will also aim at the public acknowledgement of how the programmes and projects are developing and start disseminating any available results.
4. With the completion of the implementation the information campaign will focus on the total results
Implementing Body: Public Employment Services
Budget: 400,000 €
Target: all relevant target groups
PRIORITY Objective 6: Enhancing the effectiveness and impact of employment services and labour market policies
The reform of labour market policies and the introduction of the Youth Guarantee will provide the Public Employment Service (PES) with a comprehensive range of policy instruments to ease the integration of young people in the labour market. However, the PES needs to have the resources and the tools to effectively manage labour market integration schemes. To this end, the reform of the PES − shelved in the last two years to manage the increasing inflows of unemployed − will be revived and expanded.
More specifically, the objective to strengthen the capacity of the PES to effectively implement labour market integration measures builds on the following outcomes: i) the upgrade of the information system ii) the increase of PES service delivery capacity and the deployment of a staff training plan to ensure quality services to clients (jobseekers and employers).
Outcome 6.1.The information system of the PES is upgradedand becomes an effective tool to design and monitor youth employment services and programmes
Range of administrative data generated by the PES informationsystem and used to inform service and programme delivery
58
Baseline:None, as the current information system is designed primarily to match the unemployed by broad vacancy features.
The PES Candidate Placement System (CPS) will be upgraded/‐ to: i) introduce a fully relational database management system with standard codification protocols, ii) expand the range of information stored on registered unemployed, job vacancies and service and programme delivery; iii) produce more reliable labour market information, and iv) improve the range of service available through self‐ and e‐services.
Such an upgrading is expected to yield a number of results. First, the introduction of a database management system that is fully relational will allow warehousing the information stored by the PES with that of other database maintained by the public administration(social security, pension, social welfare, GMI Unit) with a view to track clients’ outcomes and measure the effectiveness of labour market policies. Second, a wider range of information will be collected on clients (unemployed individuals and employers), services rendered and programmes implemented.
This will allow refining profiling and targeting approaches, improving the matching of unemployed with available vacancies and measuring the efficiency of service delivery. Third, the upgrading of the information system will serve to introduce new web‐based tools that will ease the spreading of employment services to remote locations and improve self‐ and e‐services.
Implementing Body: Public Employment Services
Budget: 500,000 €
Target: all youth in the target group (15‐29)
Outcome 6.2. Enhance the Service Capacity of the PES and providing training on topics relating to the Youth Guarantee Implementation
The PES staff/registered unemployed ratio decreased to 1:350 At least 50 per cent of young unemployed (15‐29) registered with the PES
receivebasic employment services and 30per cent are referred to individualized employment assistance.
Increase in the share of young people (15‐24) registering with the PES to 45per cent of total youth unemployment.
Baseline:In October 2013 the staff‐registered unemployed ratio was 1:580. In 2013, approximately 11 per cent of youth were referred to higher‐intensity services.
The drastic increase in the number of unemployed individuals has strained the
capacity of the PES staff to deliver services beyond basic registration. The current
understaffing will be addressed through: i) the redeployment of employees currently
assigned to other institutions and agencies of the public administration (requirement
59
by the MOU), ii) the expansion of self‐ and e‐services; iii) the contracting out of some
basic services (group counselling and job search training) and iv) the implementation
of an intensive staff development programme to train re‐deployed human resources
in the provision of basic employment services. Through the redeployment scheme
experienced counsellors can focus on the delivery of individualized counselling and
guidance, employment planning, referral to labour market programmes and monitor
on individual progression. The capacity building of the PES will be addressed under
an ESF initiative planned for the period 2014‐2020.
Implementing Body: Public Employment Services
Budget: 2,000,000 €
Target: 50% of all registered youth with the PES (15‐29) to receive relevant services
Outcome 6.3: Enhance the staff capacity of PES to provide better services to employers and jobseekers through staff training
The share of job vacancies filled by the PES increases by 20 per cent. Increase the number of job vacancies captured by PES by 20%.
Baseline: Available data for the national number of vacancies filled is not accurate
The PES will develop a comprehensive strategy aimed at improving the range and qualities of services provided to employers and improve market penetration. Such a strategy includes theredeployment and training of additional staff and the development of services such as jobs and tasks analysis, drafting of job description, workers’ recruitment procedures, workforce training needs analysis and design of workforce development programmes.
Implementing Body: Public Employment Services
Budget: 100,000 €
Target: All Employment Counselors
POLICY Objective 7: Monitoring and evaluation of labour market policies
A result‐based management system will be established by the Ministry of Labour, Welfare and Social Insurance to regularly assess the quality of service delivery and the outcomes achieved by labour market policies. Such a system will:
(i) identify in measurable terms the results being sought and a roadmap for their achievement;
(ii) set targets and indicators (to judge performance);
60
(iii) develop a method for the regular collection of data to compare the results achieved against the targets;
(iv) integrate evaluations to gather information not available through monitoring; and
(v) usemonitoring and evaluation information for decision‐making, accountability and strategic planning.
A comprehensive Monitoring and Evaluation System has already been developed which incorporates the outcomes of the EMCO Indicators Group and all indicators for monitoring and evaluating of the implementation of the Youth Guarantee.
Monitoring and evaluation will be overseen by the Working Group which has been established for the development of the National Action Plan for Youth Employment. This working group includes representatives from all implementing bodies, social partners and youth organisations
Outcome 7.1.A performance measurement system is established toregularly monitor policy implementation
Number of progress and outcome indicators developed and used to track the results of labour market policies;
Range of information collected through the data warehousing system;
Number of performance measurement cycles conducted through data warehousing and surveys
Baseline:None. A performance monitoring exercise was carried in early 2013 on the measures implemented under the Special Prevention Scheme (2009‐2012), but it covered only a fraction of all labour market interventions implemented in the country.
The performance monitoring systemwill deploy data warehousing tools topool:
i) Informationon individuals recorded in administrative registers (employment and social protection services);
ii) data on labour market service and programme delivery (to track individuals through the services and programmes available as well as keep tab of the human and financial resources deployed); and
iii) records of the social security and administration of payroll tax. Such a system requires that the registers of the various administrations operating under the Ministry of Labour, Welfare and Social Insurance be upgraded or re‐designedto become relational database management systems (RDBMS) with standard codification protocols.
Thedata warehousing system will provide information to determine compliance with service and programme implementation rules (targeting); inputs (e.g. human and financial resources, infrastructure); expected outputs (e.g. participation, completion and progression rates of eligible youth); and short‐term outcome measures (e.g. employment and earnings of young participants the programmes’ end).The labour market outcomes of individual beneficiaries will be also measured through
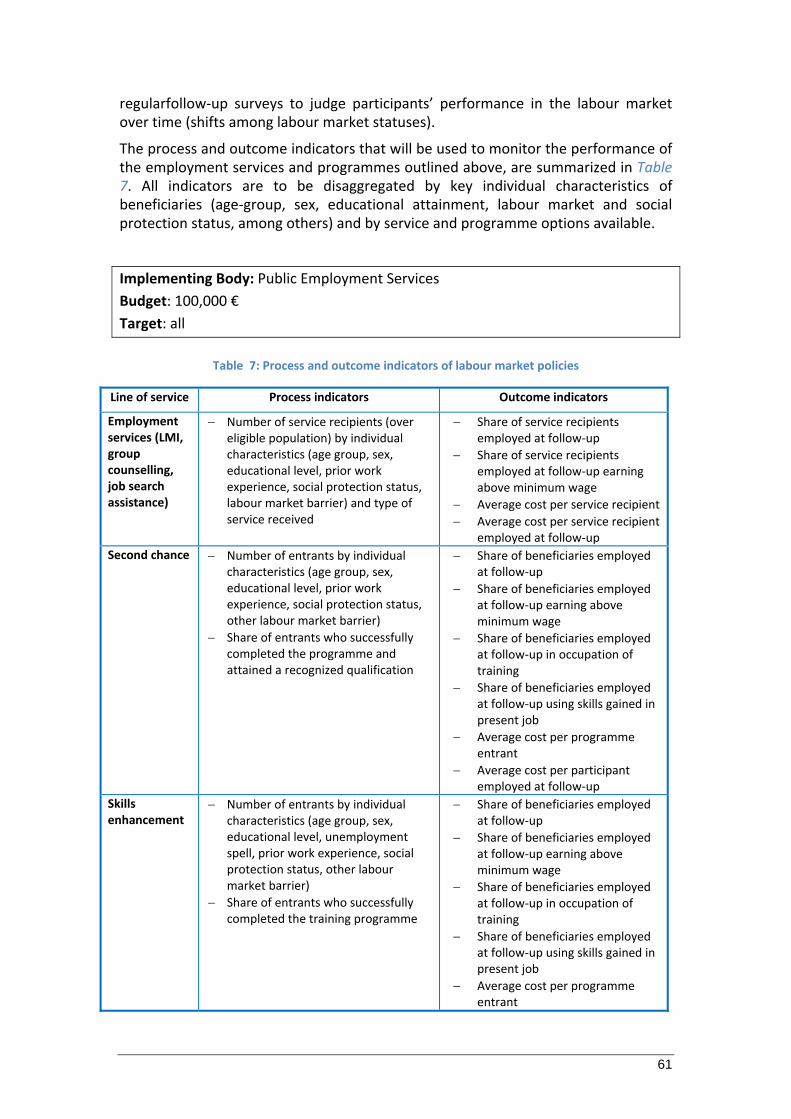
61
regularfollow‐up surveys to judge participants’ performance in the labour market over time (shifts among labour market statuses).
The process and outcome indicators that will be used to monitor the performance of the employment services and programmes outlined above, are summarized in Table 7. All indicators are to be disaggregated by key individual characteristics of beneficiaries (age‐group, sex, educational attainment, labour market and social protection status, among others) and by service and programme options available.
Implementing Body: Public Employment Services
Budget: 100,000 €
Target: all
Table 7: Process and outcome indicators of labour market policies
Line of service Process indicators Outcome indicators
Employment services (LMI, group counselling, job search assistance)
Number of service recipients (over eligible population) by individual characteristics (age group, sex, educational level, prior work experience, social protection status, labour market barrier) and type of service received
Share of service recipients employed at follow‐up
Share of service recipients employed at follow‐up earning above minimum wage
Average cost per service recipient
Average cost per service recipient employed at follow‐up
Second chance Number of entrants by individual characteristics (age group, sex, educational level, prior work experience, social protection status, other labour market barrier)
Share of entrants who successfully completed the programme and attained a recognized qualification
Share of beneficiaries employed at follow‐up
Share of beneficiaries employed at follow‐up earning above minimum wage
Share of beneficiaries employed at follow‐up in occupation of training
Share of beneficiaries employed at follow‐up using skills gained in present job
Average cost per programme entrant
Average cost per participant employed at follow‐up
Skills enhancement
Number of entrants by individual characteristics (age group, sex, educational level, unemployment spell, prior work experience, social protection status, other labour market barrier)
Share of entrants who successfully completed the training programme
Share of beneficiaries employed at follow‐up
Share of beneficiaries employed at follow‐up earning above minimum wage
Share of beneficiaries employed at follow‐up in occupation of training
Share of beneficiaries employed at follow‐up using skills gained in present job
Average cost per programme entrant
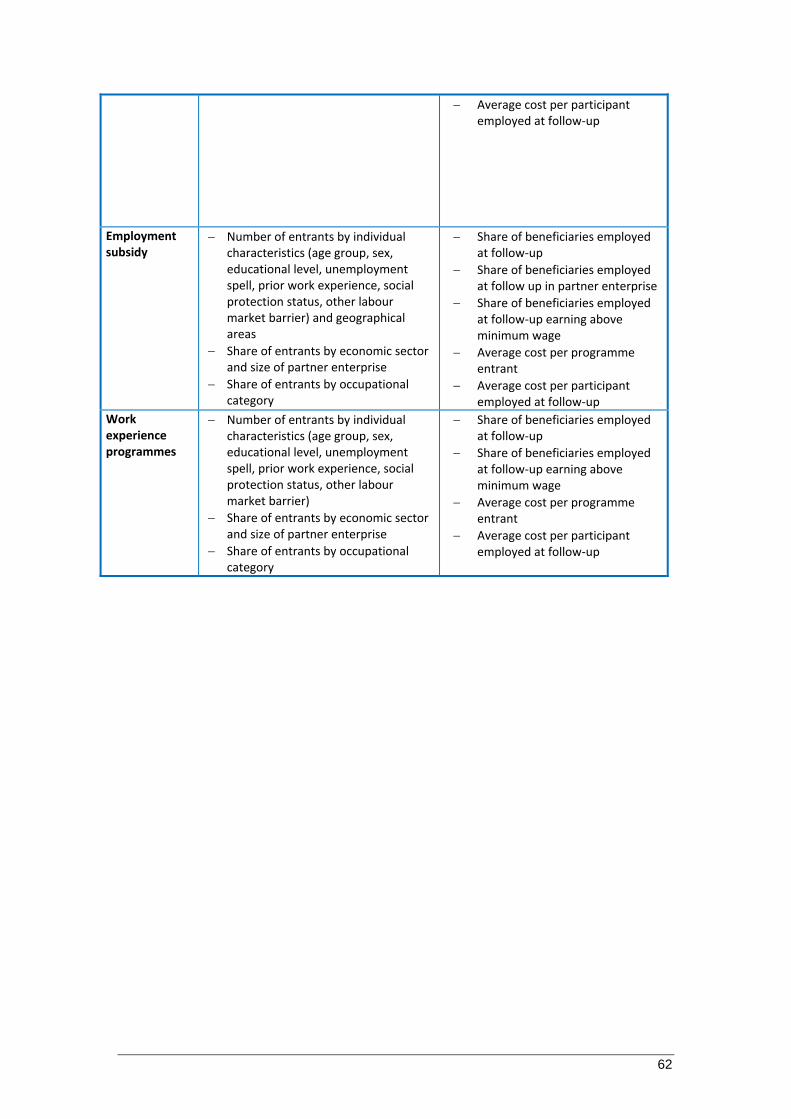
62
Average cost per participant employed at follow‐up
Employment subsidy
Number of entrants by individual characteristics (age group, sex, educational level, unemployment spell, prior work experience, social protection status, other labour market barrier) and geographical areas
Share of entrants by economic sector and size of partner enterprise
Share of entrants by occupational category
Share of beneficiaries employed at follow‐up
Share of beneficiaries employed at follow up in partner enterprise
Share of beneficiaries employed at follow‐up earning above minimum wage
Average cost per programme entrant
Average cost per participant employed at follow‐up
Work experience programmes
Number of entrants by individual characteristics (age group, sex, educational level, unemployment spell, prior work experience, social protection status, other labour market barrier)
Share of entrants by economic sector and size of partner enterprise
Share of entrants by occupational category
Share of beneficiaries employed at follow‐up
Share of beneficiaries employed at follow‐up earning above minimum wage
Average cost per programme entrant
Average cost per participant employed at follow‐up

63
4. Resources
Outcome 1.1. The secondary and post‐secondary vocational education curricula are aligned to labour market requirements and include work experience in enterprises.(€ 700,000)
This outcome is under the mandate of the Ministry of Education and Culture. The amount required (€700,000 million for the period 2015‐17) has already been pledged for the targeting of young students 15 to 19 years oldunder Axis 4 of the National Operational Plan of the ESF.
Outcome 1.2. A framework for quality traineeship is established to provide tertiary education students with relevant learning experiences in enterprises (€ 2,500,000)
This outcome is under the responsibility of the Ministry of Education and Culture and public and private Universities. The funding envelope of €2.5 million (for the period 2015‐17) will allow the targeting of approximately 150 university students per year. It has already been pledged under Axis 4 of the National Operation Plan of the ESF.
Outcome 1.3 Providing regular information on school leavers and dropouts for early intervention (€4,000,000.)
This outcome is under the responsibility of the Ministry of Education and Culture. €4.0 mill is already planned for the extension of the School Priority Action (SPA) services in all schools (underAxis 4 of the National Operational Plan of the ESF). Its target is for 50% of all students 15‐18 to receive services provided through the SPA system, identify those in need and proceed with individualised counselling. This outcome includes also (with zero budget) the establishment of an early notification system of the early school leavers/drop‐outs between the Ministry of Education and the PES.
Outcome 1.4 The career education system is improved and provides students with reliable labour market information and advice on career choices (€ 1,200,000)
The achievement of this outcome is under the responsibility of the Career Education and Counselling Service of the Ministry of Education and Culture. The resources necessary to diversify the career education services are estimated at €1.2 for the provision of career education to 75 per cent of secondary education students, translated in 60,000 interventions per year.
Outcome 2.1. The design and implementation of labour market policies is improved to effectively address the multiple disadvantages faced by young people (€ 0)
The achievement of this outcome falls within the responsibility of the Department of Labour of the Ministry of Labour Welfare and Social Insurance and incorporated all actions and schemes that will be available for the Youth. The total budget of all

64
ALMPs is the total of the outcomes 3.2‐3.7, including the budget available for the implementation of the Youth Guarantee.
Outcome 2.2. Targeting mechanisms are introduced in labour market policy formulation and implementation to reach‐out to disadvantaged youth (€ 0)
This outcome is under the responsibility of the Department of Labour and the Public Employment services and will be implemented through the provision of individualised and group counselling services.
Outcome 3.1. An integrated service delivery model is introduced for the implementation of the Youth Guarantee
The achievement of this outcome will be the responsibility of the Department of Labour and the PES. Costing is provided in Outcomes 3.2‐3.7 and is a fraction of the total spending available since some actions include youth up to the age of 29.
Outcome 3.2. Labour market information, group counselling and jobs search services are provided to school leavers and newly unemployed (€500,000)
Actions under this outcome are under the responsibility of the Department of Labour and the PES. A total of 4500 (over three years) young people will participate in group counselling programmes of 20 hour duration (15 young/programme @ 100 programmes/year @3years) + 100 euros per participant for travelling or participation allowance). The estimated cost for the provision of employment services to the young beneficiaries (15‐29) estimated at € 500,000for the period 2015‐2017. 70% 0f the budget is allocated to the age group 15‐24.
Outcome 3.3 A second chance programme is available and provides early school leavers and unemployed youth with the qualifications needed by the labour market and pathways to re‐enter education (€6,700,000)
This outcome is under the joint responsibility of the Ministry of Education and Culture and the Cyprus Productivity Centre) The overall funding envelope needed to provide second chance programmes to young people (15‐24) under the Guarantee is estimated at €1,700,000 for the operation of the evening schools by MOEC and €5,000,000 for the implementation of the New Modern Apprenticeship by CPS and the basic skills programme for the period 2015‐2017 (included in the Axis 4 of the National Operational Plan of ESF). Under this outcome it is expected that up to 1000youth per year will be benefited. Such programmes include:
The operation of evening technical schools (MOEC)
The operation of evening secondary schools (MOEC)
Basic skills training programs for school leavers (MOEC)
Alternate Training (New Modern Apprenticeship Scheme‐CPC) 100% of the budget is allocated to the age group 15‐24
65
Outcome 3.4: Training programmes are made available and provide young people with skills required by the labour market and by occupations that are in demand (€ 2,900,000)
This outcome is under the responsibility of the Ministry of Education and Culture, the Cyprus Productivity Centreand the PES. The overall amount of €2,900,000 will be required to offer training to young beneficiaries of the National Youth Guarantee and the National Action Plan for Youth Employment Initiative in the period 2015‐2017. Total of 700beneficiaries per year.Training programmes will be offered through:
Post‐SecondaryVocational EducationCenters (MOEC)
Skills Enhancement through alternate trainingprograms (CPC)
Skills Enhancement through programs offered in partnership with private
institutions (PES)
100% of the budget is allocated for the age group 15‐24
Outcome 3.5.In company traineeship schemes are provided to ease the transition of youth to the world of work and improve enterprise competitiveness (€18,400,000)
This outcome falls within the mandate of the Human Resource Development Authority and the Ministry of LabourWelfare and Social Insurance. This funding envelope will be required to offer work experience opportunities to young graduates under the Youth Guarantee and the National Action Plan for Youth Employment Initiative in the period 2015‐2017. Enterprise/Organisation placement schemes to ease transition from school to work will be offered to:
Tertiaryeducation graduates up to the age of 29
Secondary education graduatesup to the age of 25
International placements offered to youth (20‐29)
A total of 5480 youth to be benefited from this action.45% of the budget is allocated for the age group 15‐24
Outcome 3.6 Incentives to recruit disadvantaged youth are provided to private sector enterprises (€2,000,000)
This outcome is under the responsibility of the Department of Labour and the PES. The amount of € 2,000,000 will target a total of 600young beneficiaries aged up to 25 in the period 2015‐17.
100% of the budget is allocated for the age group 15‐24
Outcome 3.7. Activation of GMI recipients (€ 480,000)
This outcome is under the responsibility of the Ministry of Labour Welfare and Social Insurance. The scheme will give the possibility to 600 GMI young recipients (15‐29) who are difficult to be employed, to place them in Local Authorities and NGOs for 6 months to be engaged in public and/orcommunity work. Participation will be
66
incentivised by providing a monthly allowance up to €150 per month to cover additional costs including travelling.
50% of the budget is allocated for the age group 15‐24
Outcome 4.1. A comprehensive package of support services (National Entrepreneurship Scheme & Social Enterprise Program) is available to young people (20‐35) to set up their own enterprise (€4.300.000)
The responsibility of this outcome as it pertains to the National Enterprise Scheme falls under the mandate of the Ministry of Commerce. The funds necessary to achieve this outcome amount to €900,000 for the age group 18‐24 for the period 2015‐2017 (this amount has already been calculated into the Youth Guarantee Plan). For the age group 24‐29 another € 2.250.000 will be allocated (approximately €45,000 per individual business).
The responsibility of the outcome as it pertains to the Social Enterprise Programme falls under the responsibility of the Ministry of Labour, Welfare and Social insurance. Approximately €530,000 will be allocated for youth (15‐24) participating in the social enterprises and another €670,000 for the age group 25‐29
33% of the budget is allocated for the age group 15‐24
Outcome 4.2. The development of an Entrepreneurship Development Program (EDP) promoting entrepreneurship as a career option for young people and sustaining their entrepreneurial path
The EDPwill be set up by the Cyprus Youth Board through its already established network, in partnership with the Public Employment Services. The funds needed to set up this program using already existing structures and facilities of the Youth Board of Cyprus amount to 300,000 euros. The services that will be offered include the organisation of trainings, group and individual counselling, mentoring, coaching and monitoring of activities related to a business plan. The Service will be offered to unemployed youth (18‐29), interested to become entrepreneurs. Thedevelopment of a special web portal for young entrepreneurs is also planned. It is envisaged that 300 youth aged 18‐29 will benefit from the Program annually.
40% of the budget is allocated to the age group 18‐24.
Outcome 5.1. A national information campaign is implemented to raise awareness on decent work for young people and the support provided by labour market institutions, including through the National Youth Guarantee (€400,000)
This outcome is under the responsibility of the Department of Labour. The amount necessary to carry out nation‐wide information and awareness raising campaign have been estimated at € 400,000 for the period 2015‐2017.
67
Outcome 6.1. The information system of the PES is upgraded and becomes an effective tool to design and monitor youth employment services and programmes (€ 500.000)
The achievement of this outcome is under the responsibility of the Department of Labour and the PES. The overall amount required to upgrade the PES information system with the basic features required for profiling, matching and monitoring is approximately € 0,5 million and includes the training costs for PES staff to use the new system and maintenance and support for three years.
Outcome 6.2. The PES has expanded the number of clients and the range of services available to young people (€ 2,000,000)
This outcome is under the mandate of the Labour Department and the PES. The services of about 30 Employment counsellors will be outsourced for enhancing the provision of individualized employment assistance and ensure the proper implementation of active labour market policies and the National Youth Guarantee. The total amount needed, including training of new and existing staff, is € 2.0 million for the period 2015‐2017.
Outcome 6.3 The market penetration of the PES is increased through more and better services to employers and jobseekers (€ 100,000)
The achievement of this outcome is under the responsibility of the Labour department and the PES. The resources necessary to train existing and new staff on offering better services to employers and jobseekers is €100,000 for the period 2015‐2017
Outcome 7.1. A performance measurement system and evaluation is established to regularly monitor policy implementation (€ 100,000)
The outcome falls within the mandate of the Ministry of Labour Welfareand Social Insurance. The budgeted amount will be used for outsourcing the implementation of the monitoring and evaluating system (collection, analysing or data and reporting).
4. Institutional coordination mechanism
In order to maximize the impact of the Action Plan on Youth Employment, it is crucial to ensure its integration with the national strategies currently being implemented and its alignment with the budgetary process. Due to the overall youth employment situation, it is critical to ensure that the interventions planned move to implementation in a rapid manner, taking into consideration sequencing and prioritization.
The Department of Labour will have primary responsibility to steer the implementation of the policies and measures set forth in the Action Plan and present regular progress reports to the Government. Each partner in the Action Plan will develop detailed implementation roadmaps to ease implementation and promote
68
accountability. The Labour Department will also work closely with the European Social Fund Unit, line ministries and national agencies, the social partners and organizations representing the interests of young people. The Coordination Committee which has been established and worked for the development of this Action Plan will continue its coordinating role for the implementation of it. The general responsibilities of the implementing partners are provided in the matrix appended as Annex 1.
5. Monitoring and evaluation
The monitoring of the Action Plan will comprise the regular examination of the inputs, outputs and outcomes of policy interventions. It will be based on the already developed system which includes information gathering and analysis of the performance indicators highlighted under each policy outcome. The Labour Department of the Ministry of Labour Welfareand Social Insurance will have the responsibility to systematize the monitoring information generated by other line ministries and partner agencies in the National Action Plan for Youth Employment for presentation to the Government.
Each partner will design annual work plans that translate outcomes into operational activities. These workplans will detail inputs, the activities to be conducted and the expected results as well as indicate schedules and persons and/or institutions responsible. The matrix appended as Annex 1 provides the general frame for monitoring the results achieved.
The evaluation system will be integrated into the policy/programme cycle. Two evaluation exercises will be conducted under the coordination of the Labour Department: 1) an interim evaluation at the end of 2015 and 2) a summative evaluation at the end of 2018.
The mid‐term evaluation will analyse the level of achievement of results, financial management, the quality of the monitoring system and its implementation. By comparison with the baseline situation, it will highlight changes in the general context and judge whether the objectives remain relevant. This evaluation will also examine whether the evolution of national priorities and policies poses a problem of coherence. The mid‐term evaluation will rely on information drawn from the performance monitoring system and from the overall context and its evolution into feedback into the management of action planning.
The summative evaluation will judge at the end of 2018 the entire Action Plan performance. It will account for the use of resources and will report on the effectiveness and efficiency of interventions and the extent to which expected outcomes were achieved. The primary evaluative and research questions will revolve around:
Relevance: the extent to which the Action Plan objectives responded to national requirements and priorities;
Effectiveness: the extent to which the objectives were achieved; whether the interventions and means used yielded the expected results; and whether more could have been obtained by using different means;

69
Efficiency: whether the objectives were achieved at the lowest possible cost;
Sustainability: the extent to which the results, including institutional changes, are durable over time.
The summative evaluation will use a combination of methods to measure results: performance monitoring findings, stakeholders’ and beneficiaries’ surveys and cost‐effectiveness analyses. Evaluation details will also be gathered through the use of primary data collected from the individuals involved in the intervention, secondary data and qualitative techniques.
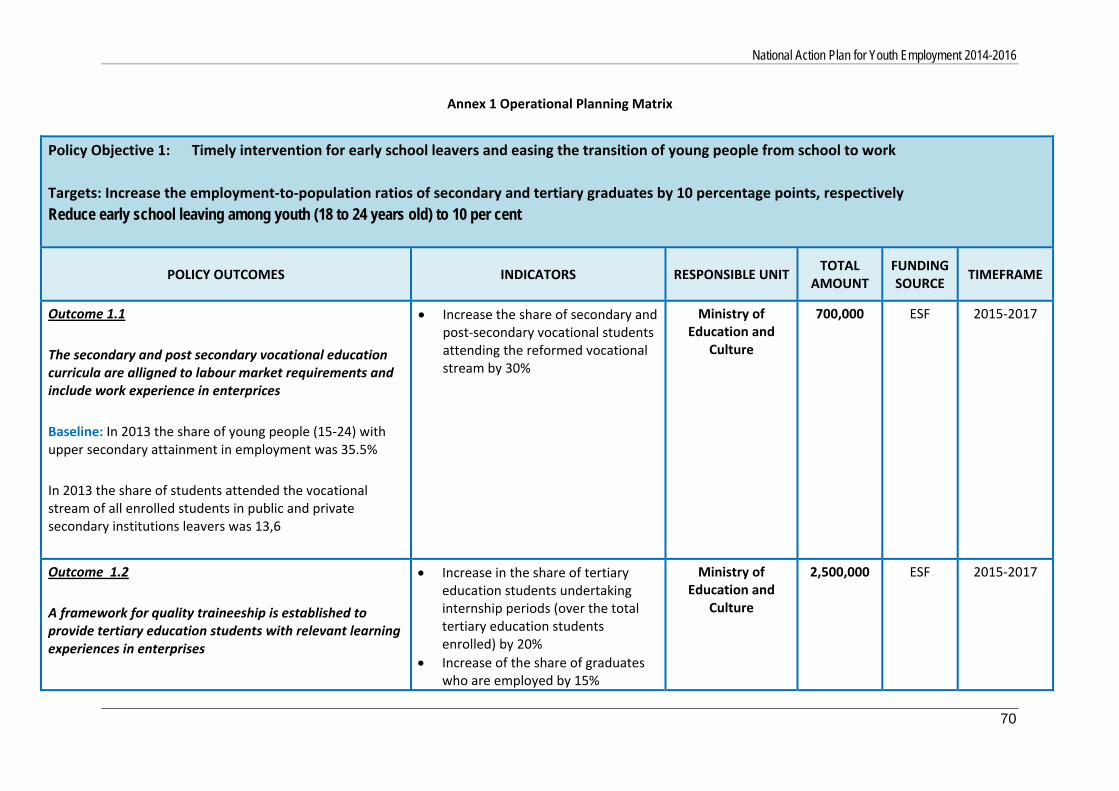
National Action Plan for Youth Employment 2014-2016
70
Annex 1 Operational Planning Matrix
Policy Objective 1: Timely intervention for early school leavers and easing the transition of young people from school to work
Targets: Increase the employment‐to‐population ratios of secondary and tertiary graduates by 10 percentage points, respectively
Reduce early school leaving among youth (18 to 24 years old) to 10 per cent
POLICY OUTCOMES INDICATORS RESPONSIBLE UNIT TOTAL
AMOUNT FUNDING SOURCE
TIMEFRAME
Outcome 1.1
The secondary and post secondary vocational education curricula are alligned to labour market requirements and include work experience in enterprices
Baseline: In 2013 the share of young people (15‐24) with upper secondary attainment in employment was 35.5%
In 2013 the share of students attended the vocational stream of all enrolled students in public and private secondary institutions leavers was 13,6
Increase the share of secondary and post‐secondary vocational students attending the reformed vocational stream by 30%
Ministry of Education and
Culture
700,000 ESF 2015‐2017
Outcome 1.2
A framework for quality traineeship is established to provide tertiary education students with relevant learning experiences in enterprises
Increase in the share of tertiary education students undertaking internship periods (over the total tertiary education students enrolled) by 20%
Increase of the share of graduates who are employed by 15%
Ministry of Education and
Culture
2,500,000 ESF 2015‐2017
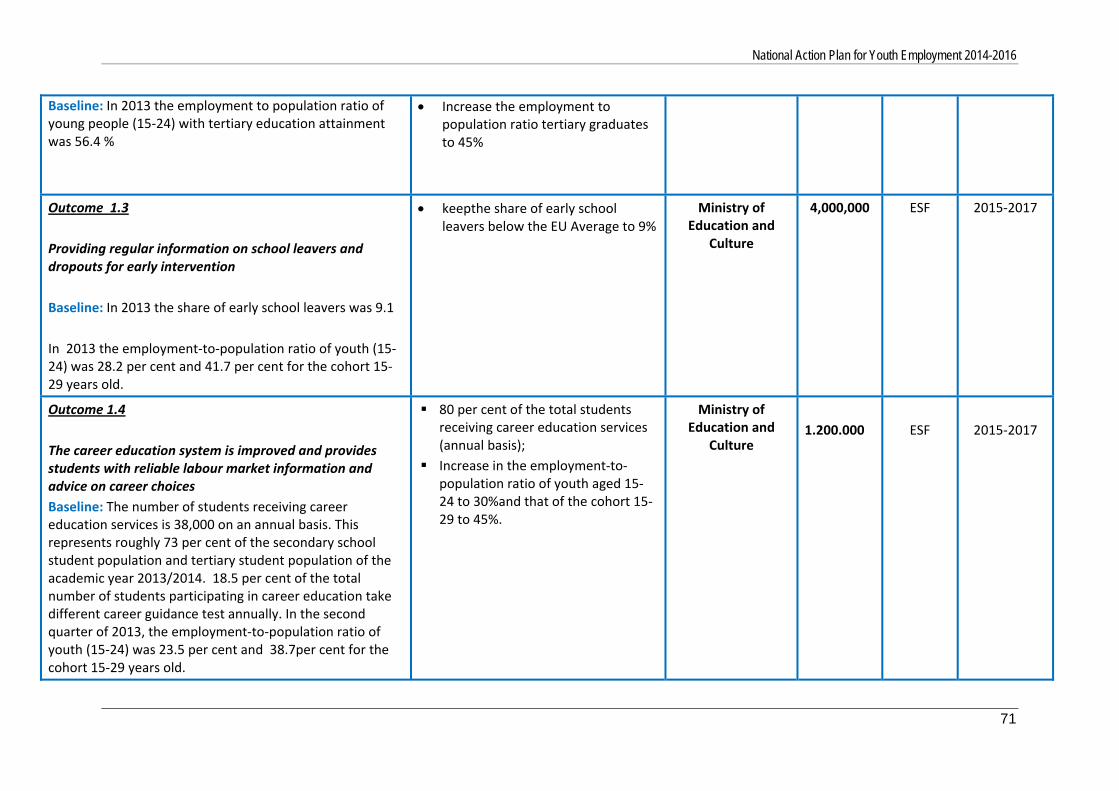
National Action Plan for Youth Employment 2014-2016
71
Baseline: In 2013 the employment to population ratio of young people (15‐24) with tertiary education attainment was 56.4 %
Increase the employment to population ratio tertiary graduates to 45%
Outcome 1.3
Providing regular information on school leavers and dropouts for early intervention
Baseline: In 2013 the share of early school leavers was 9.1
In 2013 the employment‐to‐population ratio of youth (15‐24) was 28.2 per cent and 41.7 per cent for the cohort 15‐29 years old.
keepthe share of early school leavers below the EU Average to 9%
Ministry of Education and
Culture
4,000,000
ESF
2015‐2017
Outcome 1.4
The career education system is improved and provides students with reliable labour market information and advice on career choices
Baseline: The number of students receiving career education services is 38,000 on an annual basis. This represents roughly 73 per cent of the secondary school student population and tertiary student population of the academic year 2013/2014. 18.5 per cent of the total number of students participating in career education take different career guidance test annually. In the second quarter of 2013, the employment‐to‐population ratio of youth (15‐24) was 23.5 per cent and 38.7per cent for the cohort 15‐29 years old.
80 per cent of the total students receiving career education services (annual basis);
Increase in the employment‐to‐population ratio of youth aged 15‐24 to 30%and that of the cohort 15‐29 to 45%.
Ministry of Education and
Culture
1.200.000
ESF
2015‐2017
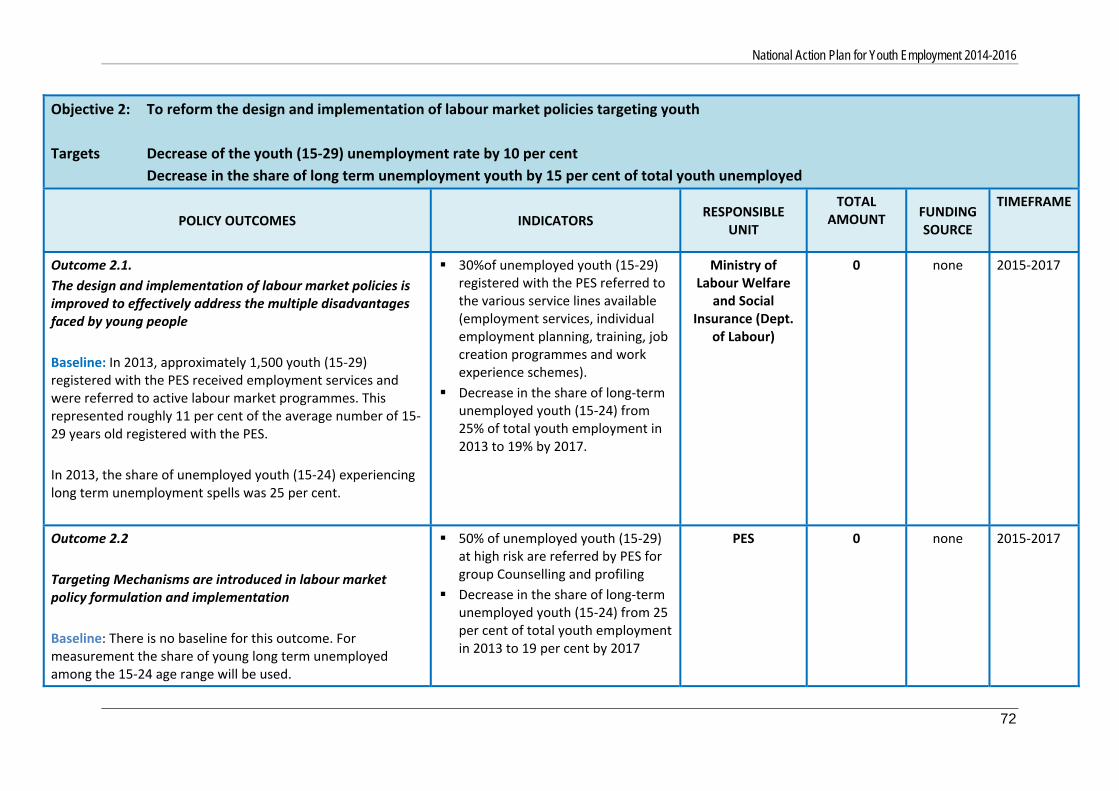
National Action Plan for Youth Employment 2014-2016
72
Objective 2: To reform the design and implementation of labour market policies targeting youth
Targets Decrease of the youth (15‐29) unemployment rate by 10 per cent
Decrease in the share of long term unemployment youth by 15 per cent of total youth unemployed
POLICY OUTCOMES INDICATORS RESPONSIBLE
UNIT
TOTAL AMOUNT
FUNDING SOURCE
TIMEFRAME
Outcome 2.1.
The design and implementation of labour market policies is improved to effectively address the multiple disadvantages faced by young people
Baseline: In 2013, approximately 1,500 youth (15‐29) registered with the PES received employment services and were referred to active labour market programmes. This represented roughly 11 per cent of the average number of 15‐29 years old registered with the PES.
In 2013, the share of unemployed youth (15‐24) experiencing long term unemployment spells was 25 per cent.
30%of unemployed youth (15‐29) registered with the PES referred to the various service lines available (employment services, individual employment planning, training, job creation programmes and work experience schemes).
Decrease in the share of long‐term unemployed youth (15‐24) from 25% of total youth employment in 2013 to 19% by 2017.
Ministry of Labour Welfare
and Social Insurance (Dept.
of Labour)
0 none 2015‐2017
Outcome 2.2
Targeting Mechanisms are introduced in labour market policy formulation and implementation
Baseline: There is no baseline for this outcome. For measurement the share of young long term unemployed among the 15‐24 age range will be used.
50% of unemployed youth (15‐29) at high risk are referred by PES for group Counselling and profiling
Decrease in the share of long‐term unemployed youth (15‐24) from 25 per cent of total youth employment in 2013 to 19 per cent by 2017
PES 0 none 2015‐2017
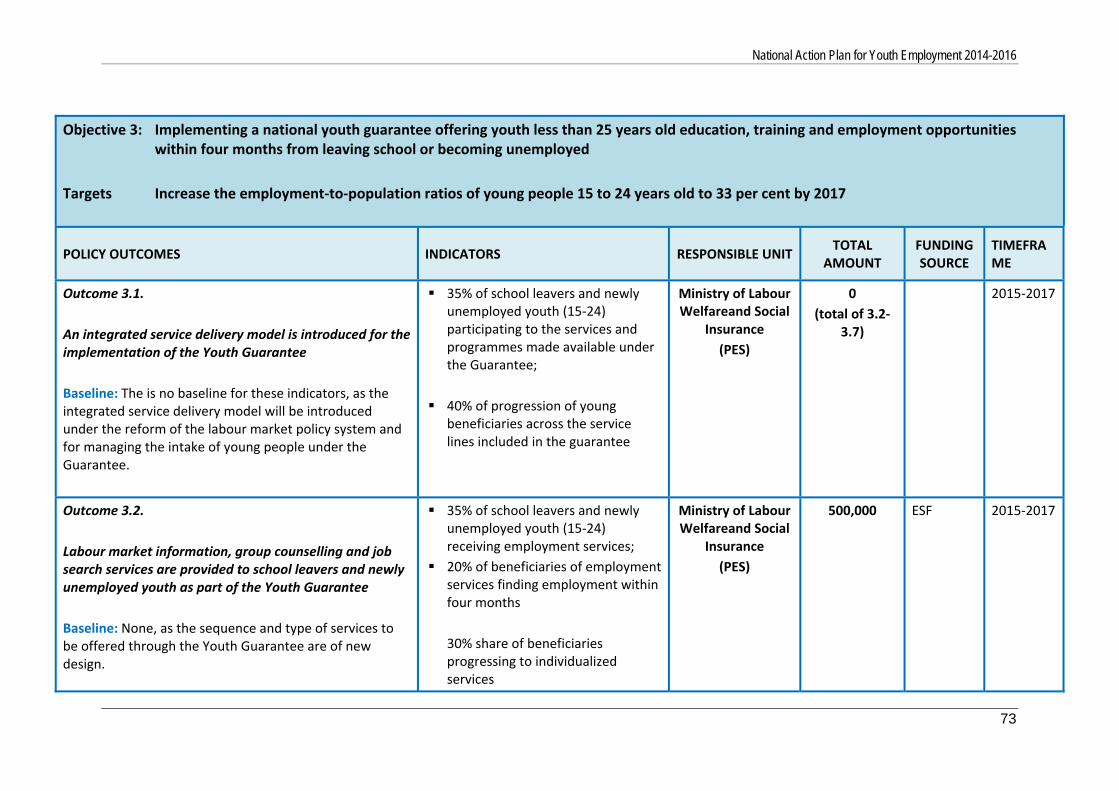
National Action Plan for Youth Employment 2014-2016
73
Objective 3: Implementing a national youth guarantee offering youth less than 25 years old education, training and employment opportunities within four months from leaving school or becoming unemployed
Targets Increase the employment‐to‐population ratios of young people 15 to 24 years old to 33 per cent by 2017
POLICY OUTCOMES INDICATORS RESPONSIBLE UNITTOTAL
AMOUNT FUNDING SOURCE
TIMEFRAME
Outcome 3.1.
An integrated service delivery model is introduced for the implementation of the Youth Guarantee
Baseline: The is no baseline for these indicators, as the integrated service delivery model will be introduced under the reform of the labour market policy system and for managing the intake of young people under the Guarantee.
35% of school leavers and newly unemployed youth (15‐24) participating to the services and programmes made available under the Guarantee;
40% of progression of young beneficiaries across the service lines included in the guarantee
Ministry of Labour Welfareand Social
Insurance
(PES)
0
(total of 3.2‐3.7)
2015‐2017
Outcome 3.2.
Labour market information, group counselling and job search services are provided to school leavers and newly unemployed youth as part of the Youth Guarantee
Baseline: None, as the sequence and type of services to be offered through the Youth Guarantee are of new design.
35% of school leavers and newly unemployed youth (15‐24) receiving employment services;
20% of beneficiaries of employment services finding employment within four months
30% share of beneficiaries progressing to individualized services
Ministry of Labour Welfareand Social
Insurance
(PES)
500,000 ESF 2015‐2017
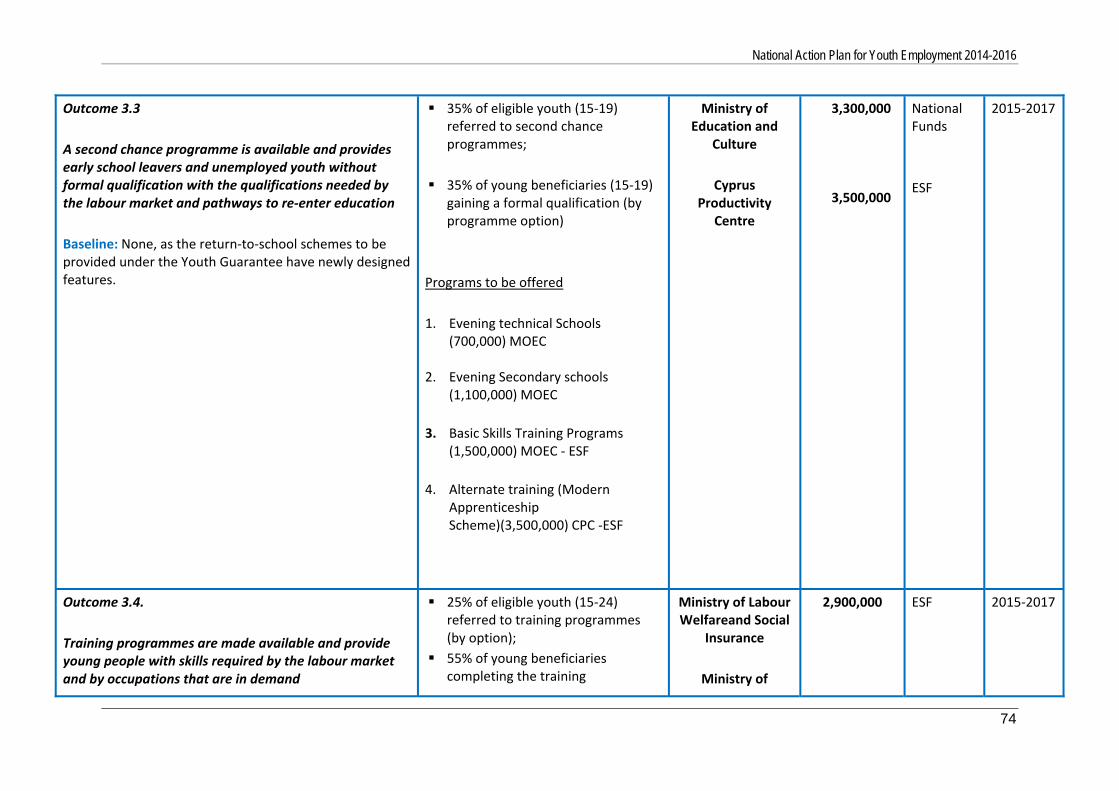
National Action Plan for Youth Employment 2014-2016
74
Outcome 3.3
A second chance programme is available and provides early school leavers and unemployed youth without formal qualification with the qualifications needed by the labour market and pathways to re‐enter education
Baseline: None, as the return‐to‐school schemes to be provided under the Youth Guarantee have newly designed features.
35% of eligible youth (15‐19) referred to second chance programmes;
35% of young beneficiaries (15‐19) gaining a formal qualification (by programme option)
Programs to be offered
1. Evening technical Schools (700,000) MOEC
2. Evening Secondary schools (1,100,000) MOEC
3. Basic Skills Training Programs (1,500,000) MOEC ‐ ESF
4. Alternate training (Modern Apprenticeship Scheme)(3,500,000) CPC ‐ESF
Ministry of Education and
Culture
Cyprus Productivity
Centre
3,300,000 3,500,000
National Funds
ESF
2015‐2017
Outcome 3.4.
Training programmes are made available and provide young people with skills required by the labour market and by occupations that are in demand
25% of eligible youth (15‐24) referred to training programmes (by option);
55% of young beneficiaries completing the training
Ministry of Labour Welfareand Social
Insurance
Ministry of
2,900,000
ESF
2015‐2017
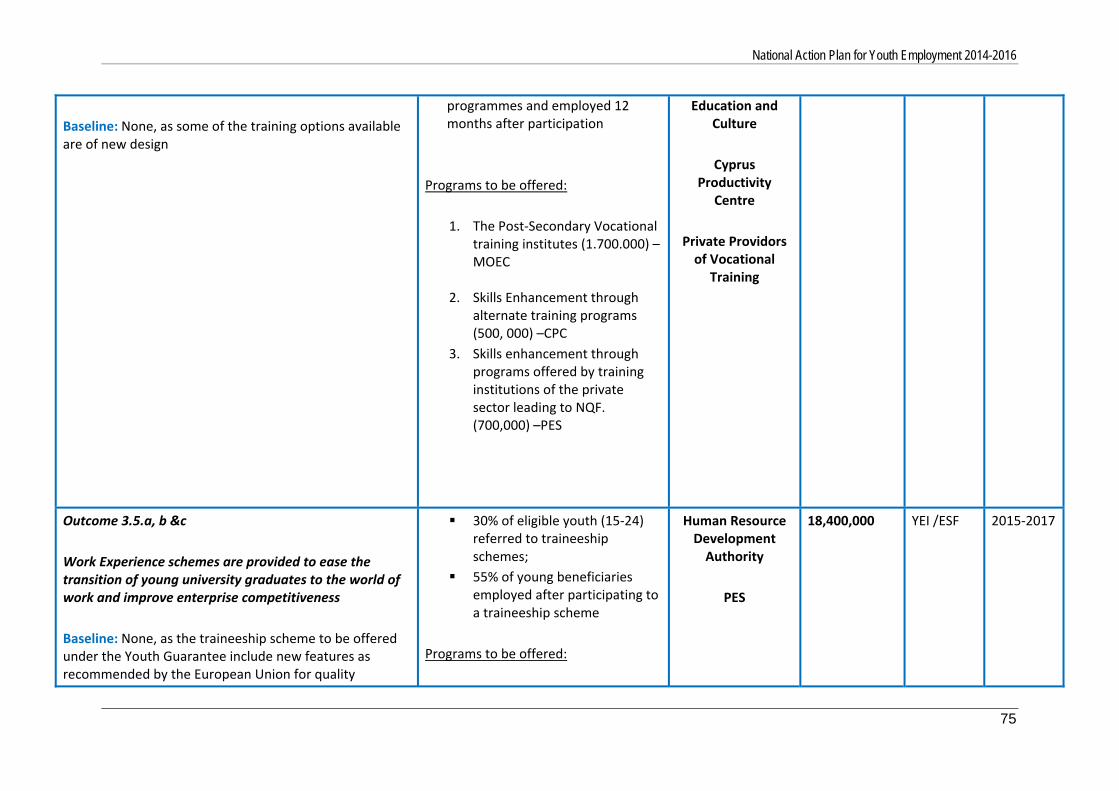
National Action Plan for Youth Employment 2014-2016
75
Baseline: None, as some of the training options available are of new design
programmes and employed 12 months after participation
Programs to be offered:
1. The Post‐Secondary Vocational training institutes (1.700.000) –MOEC
2. Skills Enhancement through alternate training programs (500, 000) –CPC
3. Skills enhancement through programs offered by training institutions of the private sector leading to NQF. (700,000) –PES
Education and Culture
Cyprus Productivity
Centre
Private Providors of Vocational
Training
Outcome 3.5.a, b &c
Work Experience schemes are provided to ease the transition of young university graduates to the world of work and improve enterprise competitiveness
Baseline: None, as the traineeship scheme to be offered under the Youth Guarantee include new features as recommended by the European Union for quality
30% of eligible youth (15‐24) referred to traineeship schemes;
55% of young beneficiaries employed after participating to a traineeship scheme
Programs to be offered:
Human Resource Development Authority
PES
18,400,000
YEI /ESF
2015‐2017
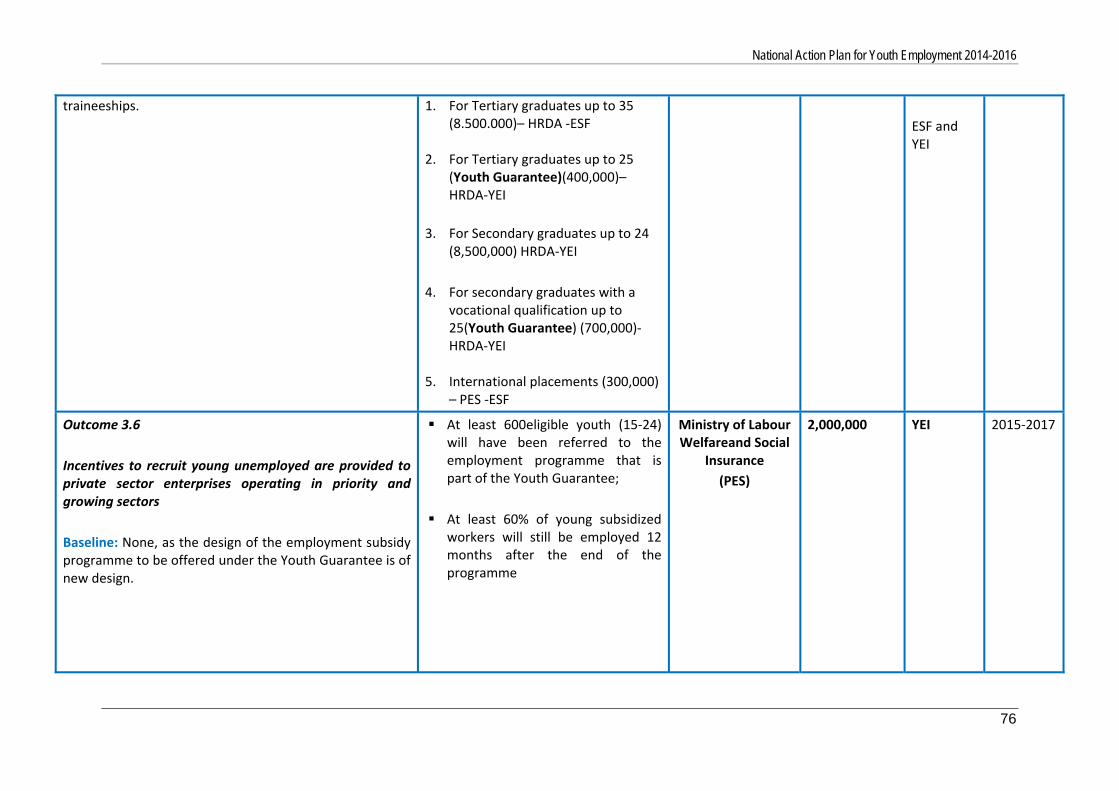
National Action Plan for Youth Employment 2014-2016
76
traineeships.
1. For Tertiary graduates up to 35 (8.500.000)– HRDA ‐ESF
2. For Tertiary graduates up to 25 (Youth Guarantee)(400,000)–HRDA‐YEI
3. For Secondary graduates up to 24 (8,500,000) HRDA‐YEI
4. For secondary graduates with a vocational qualification up to 25(Youth Guarantee) (700,000)‐HRDA‐YEI
5. International placements (300,000) – PES ‐ESF
ESF and YEI
Outcome 3.6
Incentives to recruit young unemployed are provided to private sector enterprises operating in priority and growing sectors
Baseline: None, as the design of the employment subsidy programme to be offered under the Youth Guarantee is of new design.
At least 600eligible youth (15‐24) will have been referred to the employment programme that is part of the Youth Guarantee;
At least 60% of young subsidized workers will still be employed 12 months after the end of the programme
Ministry of Labour Welfareand Social
Insurance
(PES)
2,000,000
YEI 2015‐2017
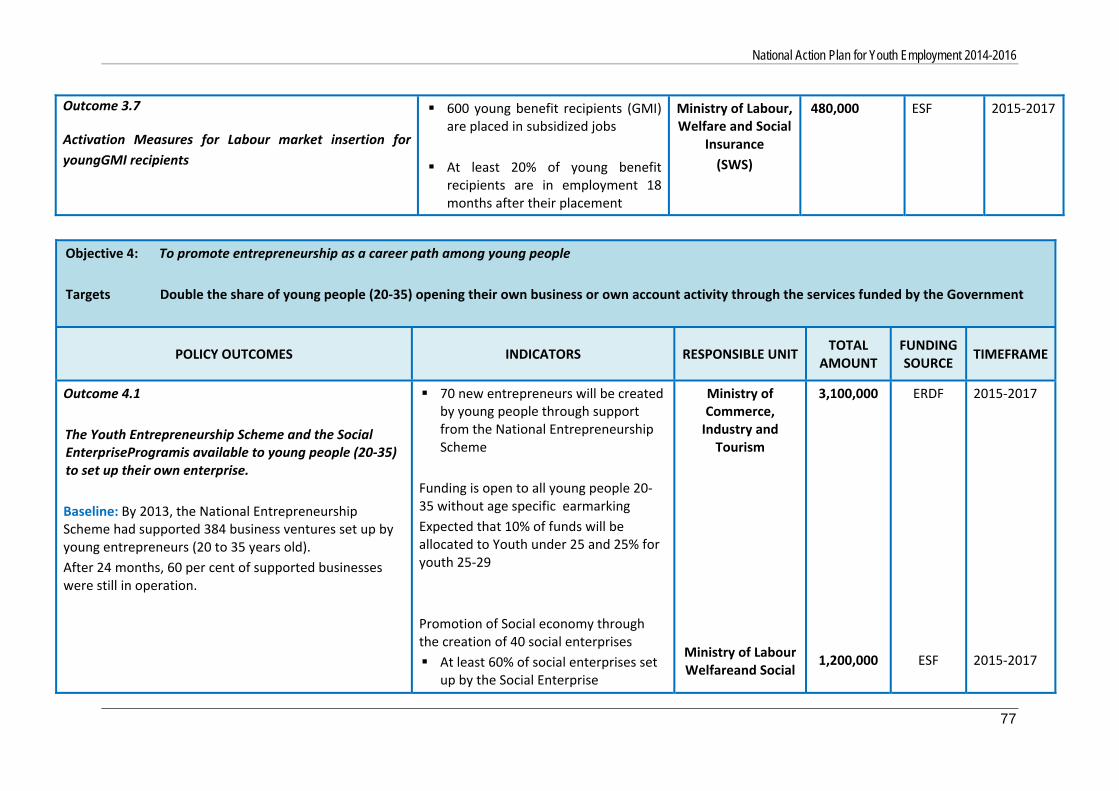
National Action Plan for Youth Employment 2014-2016
77
Outcome 3.7
Activation Measures for Labour market insertion for
youngGMI recipients
600 young benefit recipients (GMI) are placed in subsidized jobs
At least 20% of young benefit recipients are in employment 18 months after their placement
Ministry of Labour, Welfare and Social
Insurance
(SWS)
480,000 ESF 2015‐2017
Objective 4: To promote entrepreneurship as a career path among young people
Targets Double the share of young people (20‐35) opening their own business or own account activity through the services funded by the Government
POLICY OUTCOMES INDICATORS RESPONSIBLE UNITTOTAL
AMOUNT FUNDING SOURCE
TIMEFRAME
Outcome 4.1
The Youth Entrepreneurship Scheme and the Social EnterpriseProgramis available to young people (20‐35) to set up their own enterprise.
Baseline: By 2013, the National Entrepreneurship Scheme had supported 384 business ventures set up by young entrepreneurs (20 to 35 years old).
After 24 months, 60 per cent of supported businesses were still in operation.
70 new entrepreneurs will be created by young people through support from the National Entrepreneurship Scheme
Funding is open to all young people 20‐35 without age specific earmarking
Expected that 10% of funds will be allocated to Youth under 25 and 25% for youth 25‐29
Promotion of Social economy through the creation of 40 social enterprises
At least 60% of social enterprises set up by the Social Enterprise
Ministry of Commerce, Industry and Tourism
Ministry of Labour Welfareand Social
3,100,000
1,200,000
ERDF
ESF
2015‐2017
2015‐2017
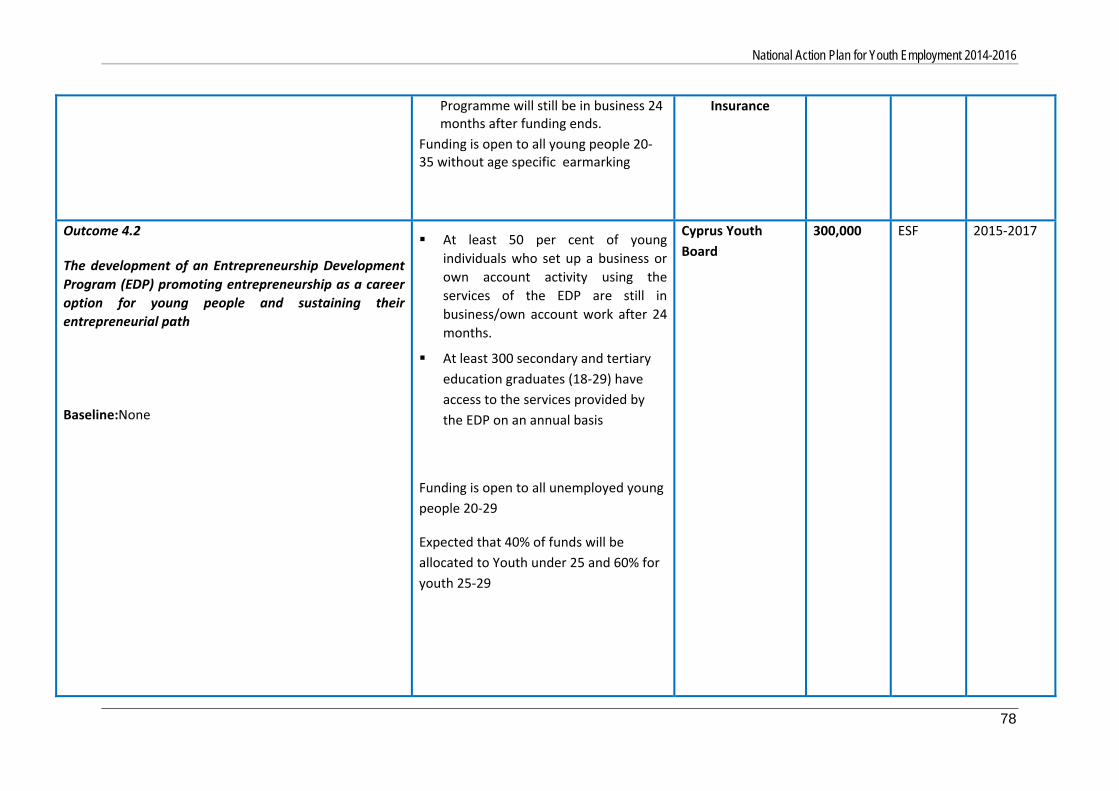
National Action Plan for Youth Employment 2014-2016
78
Programme will still be in business 24 months after funding ends.
Funding is open to all young people 20‐35 without age specific earmarking
Insurance
Outcome 4.2
The development of an Entrepreneurship Development
Program (EDP) promoting entrepreneurship as a career
option for young people and sustaining their
entrepreneurial path
Baseline:None
At least 50 per cent of young
individuals who set up a business or
own account activity using the
services of the EDP are still in
business/own account work after 24
months.
At least 300 secondary and tertiary
education graduates (18‐29) have
access to the services provided by
the EDP on an annual basis
Funding is open to all unemployed young
people 20‐29
Expected that 40% of funds will be
allocated to Youth under 25 and 60% for
youth 25‐29
Cyprus Youth
Board
300,000
ESF
2015‐2017
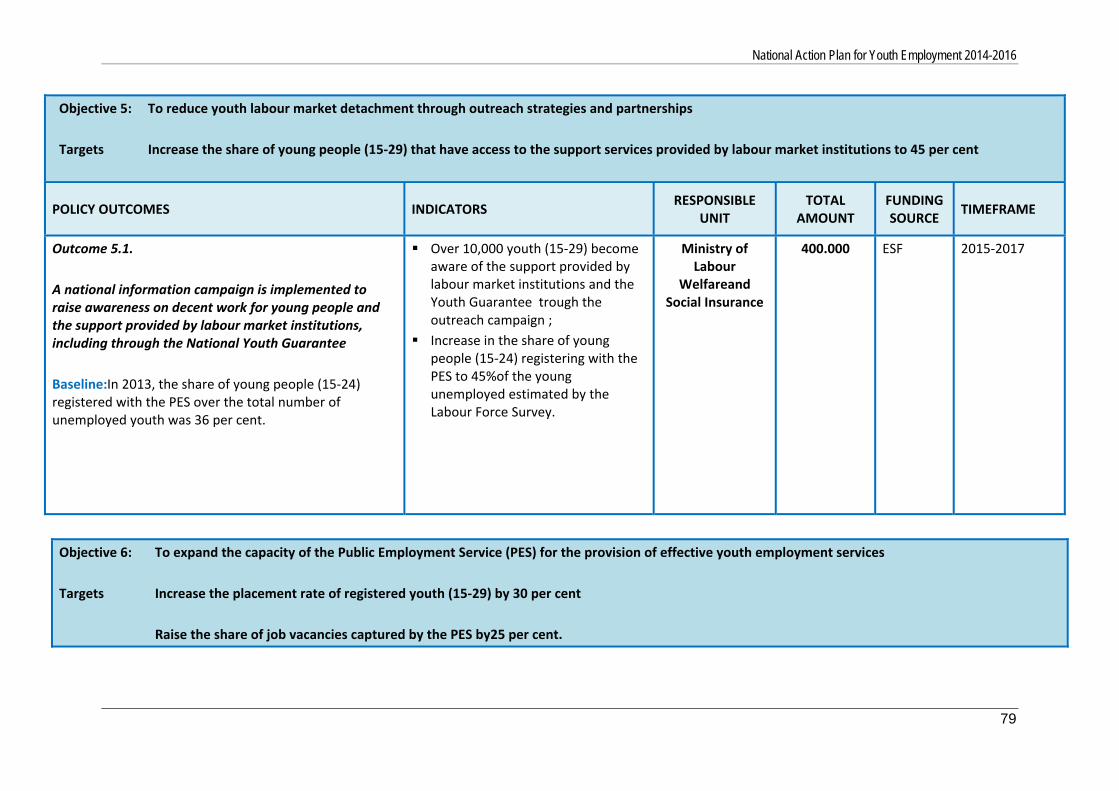
National Action Plan for Youth Employment 2014-2016
79
Objective 5: To reduce youth labour market detachment through outreach strategies and partnerships
Targets Increase the share of young people (15‐29) that have access to the support services provided by labour market institutions to 45 per cent
POLICY OUTCOMES INDICATORS RESPONSIBLE
UNIT TOTAL
AMOUNT FUNDING SOURCE
TIMEFRAME
Outcome 5.1.
A national information campaign is implemented to raise awareness on decent work for young people and the support provided by labour market institutions, including through the National Youth Guarantee
Baseline:In 2013, the share of young people (15‐24) registered with the PES over the total number of unemployed youth was 36 per cent.
Over 10,000 youth (15‐29) become aware of the support provided by labour market institutions and the Youth Guarantee trough the outreach campaign ;
Increase in the share of young people (15‐24) registering with the PES to 45%of the young unemployed estimated by the Labour Force Survey.
Ministry of Labour
Welfareand Social Insurance
400.000
ESF 2015‐2017
Objective 6: To expand the capacity of the Public Employment Service (PES) for the provision of effective youth employment services
Targets Increase the placement rate of registered youth (15‐29) by 30 per cent
Raise the share of job vacancies captured by the PES by25 per cent.
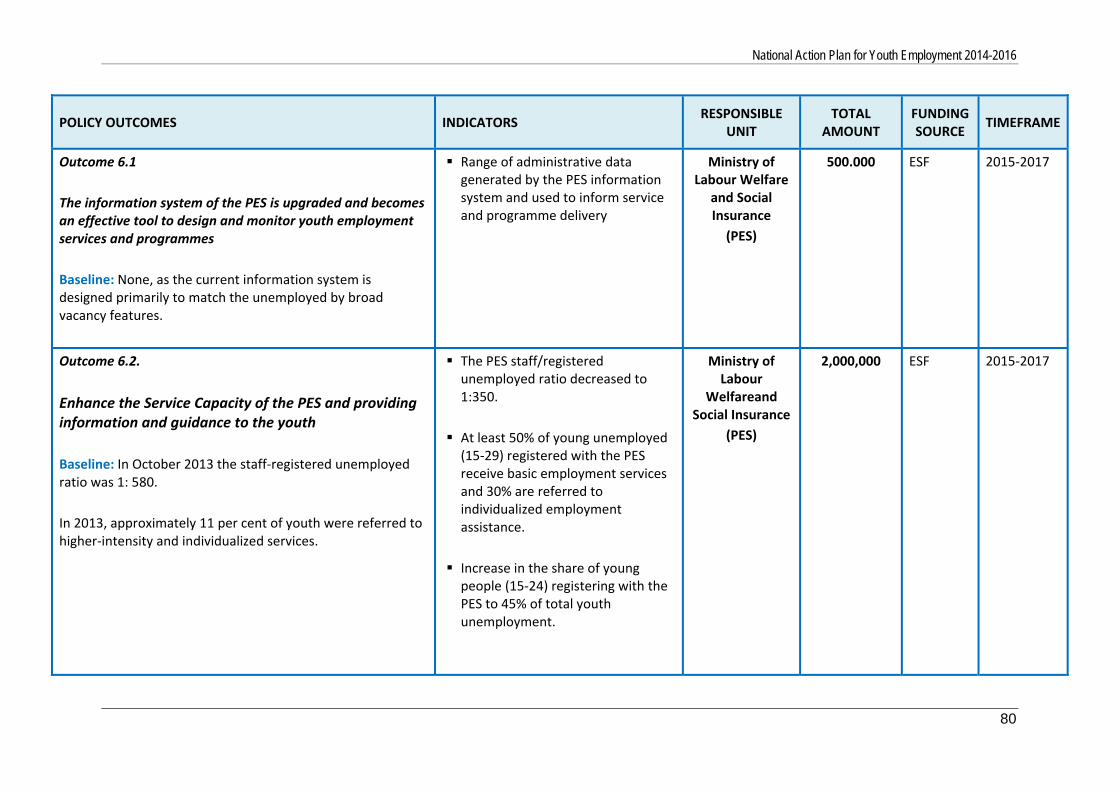
National Action Plan for Youth Employment 2014-2016
80
POLICY OUTCOMES INDICATORS RESPONSIBLE
UNIT TOTAL
AMOUNT FUNDING SOURCE
TIMEFRAME
Outcome 6.1
The information system of the PES is upgraded and becomes an effective tool to design and monitor youth employment services and programmes
Baseline: None, as the current information system is designed primarily to match the unemployed by broad vacancy features.
Range of administrative data generated by the PES information system and used to inform service and programme delivery
Ministry of Labour Welfare
and Social Insurance
(PES)
500.000
ESF 2015‐2017
Outcome 6.2.
Enhance the Service Capacity of the PES and providing information and guidance to the youth
Baseline: In October 2013 the staff‐registered unemployed ratio was 1: 580.
In 2013, approximately 11 per cent of youth were referred to higher‐intensity and individualized services.
The PES staff/registered unemployed ratio decreased to 1:350.
At least 50% of young unemployed (15‐29) registered with the PES receive basic employment services and 30% are referred to individualized employment assistance.
Increase in the share of young people (15‐24) registering with the PES to 45% of total youth unemployment.
Ministry of Labour
Welfareand Social Insurance
(PES)
2,000,000 ESF 2015‐2017
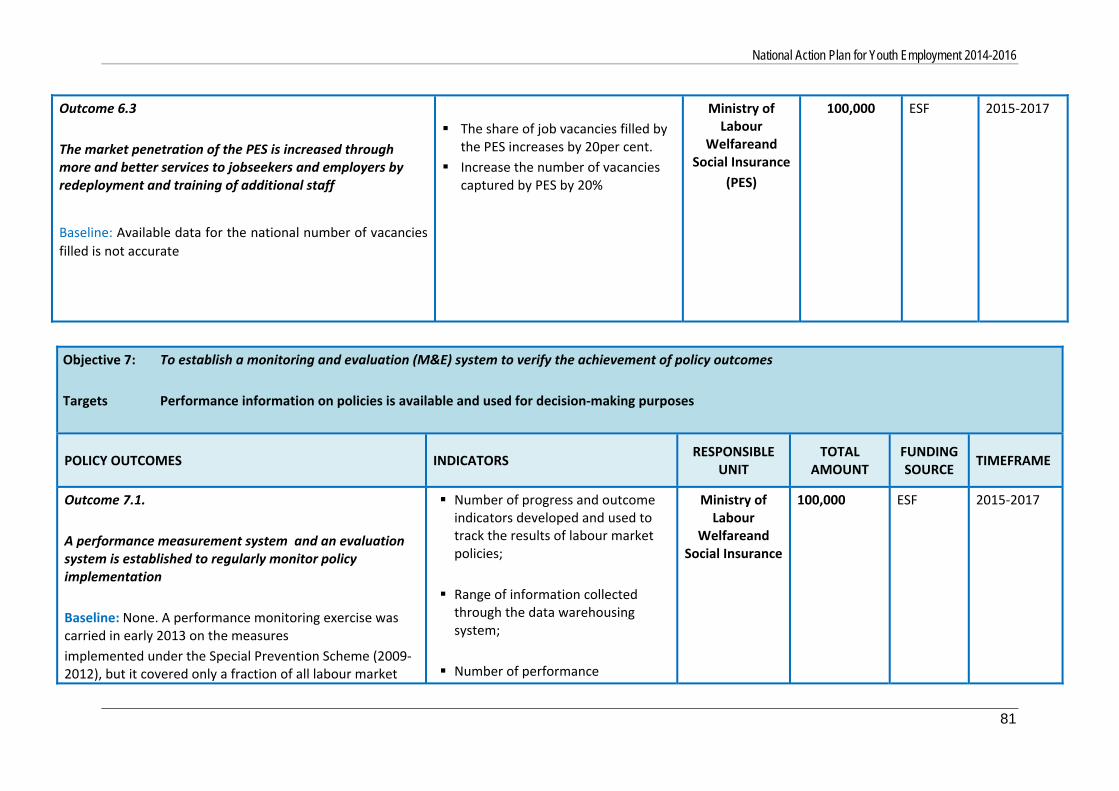
National Action Plan for Youth Employment 2014-2016
81
Outcome 6.3
The market penetration of the PES is increased through more and better services to jobseekers and employers by redeployment and training of additional staff
Baseline: Available data for the national number of vacancies
filled is not accurate
The share of job vacancies filled by the PES increases by 20per cent.
Increase the number of vacancies captured by PES by 20%
Ministry of Labour
Welfareand Social Insurance
(PES)
100,000 ESF 2015‐2017
Objective 7: To establish a monitoring and evaluation (M&E) system to verify the achievement of policy outcomes
Targets Performance information on policies is available and used for decision‐making purposes
POLICY OUTCOMES INDICATORS RESPONSIBLE
UNIT TOTAL
AMOUNT FUNDING SOURCE
TIMEFRAME
Outcome 7.1.
A performance measurement system and an evaluation system is established to regularly monitor policy implementation
Baseline: None. A performance monitoring exercise was carried in early 2013 on the measures
implemented under the Special Prevention Scheme (2009‐2012), but it covered only a fraction of all labour market
Number of progress and outcome indicators developed and used to track the results of labour market policies;
Range of information collected through the data warehousing system;
Number of performance
Ministry of Labour
Welfareand Social Insurance
100,000 ESF 2015‐2017
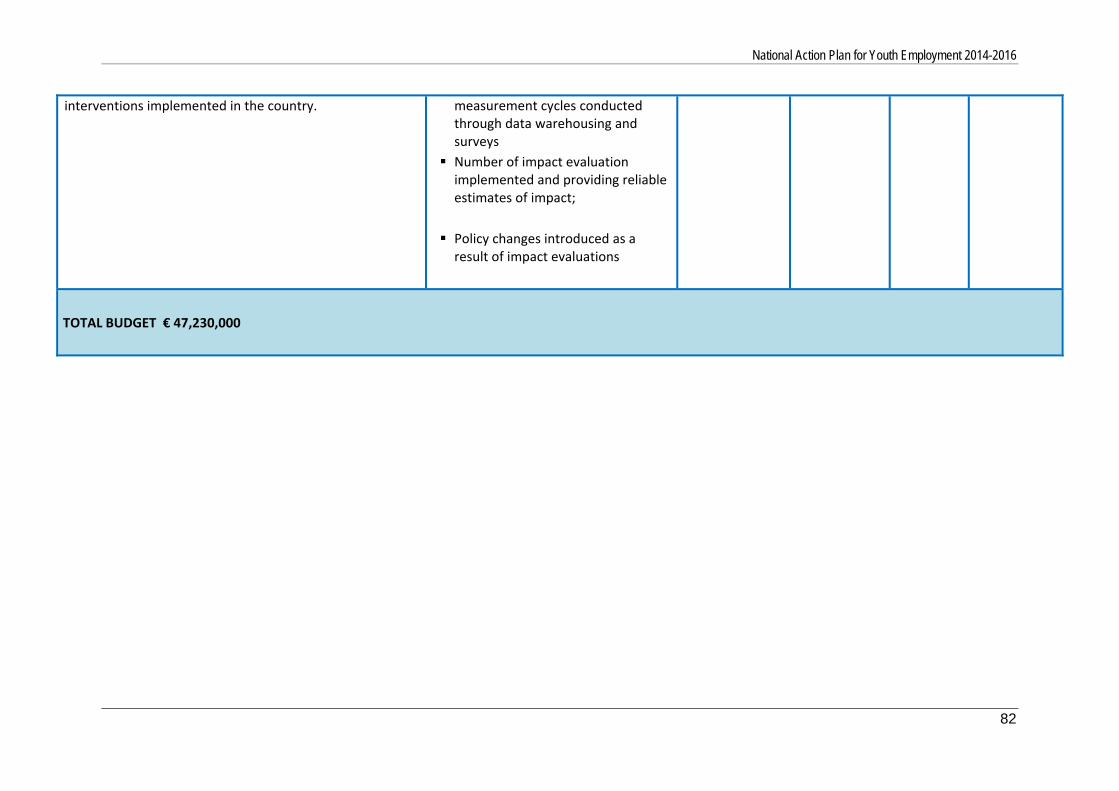
National Action Plan for Youth Employment 2014-2016
82
interventions implemented in the country.
measurement cycles conducted through data warehousing and surveys
Number of impact evaluation implemented and providing reliable estimates of impact;
Policy changes introduced as a result of impact evaluations
TOTAL BUDGET € 47,230,000


