
NATTS Network Assessment, Part 2:
Regi Oommen Eastern Research Group, Inc.
Morrisville, NC National Ambient Air Monitoring Conference
August 2016 1

Acknowledgements
• EPA – Dave Shelow – Laurie Trinca – Madeleine Strum – Greg Noah
• Eastern Research Group, Inc. – Jaime Hauser – Julie Swift – Karla Faught – Heather Perez – Jody Tisano – Dave Dayton
National Ambient Air Monitoring Conference – August 2016 2
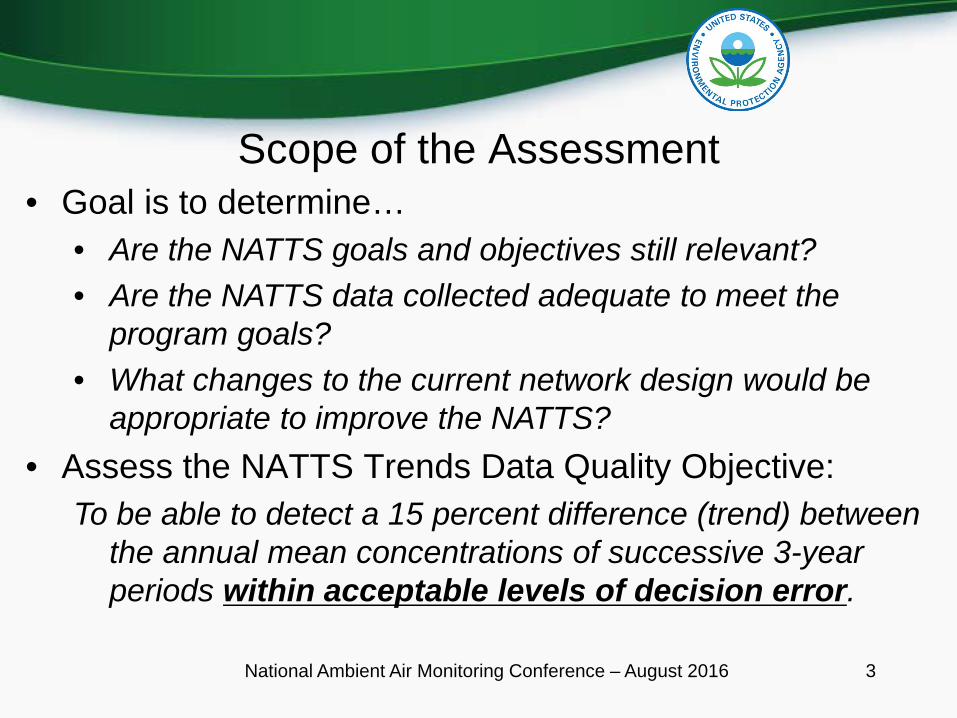
Scope of the Assessment • Goal is to determine…
• Are the NATTS goals and objectives still relevant? • Are the NATTS data collected adequate to meet the
program goals? • What changes to the current network design would be
appropriate to improve the NATTS? • Assess the NATTS Trends Data Quality Objective:
To be able to detect a 15 percent difference (trend) between the annual mean concentrations of successive 3-year periods within acceptable levels of decision error.
National Ambient Air Monitoring Conference – August 2016 3

NATTS Sites and Years
4
6 Rural 21 Urban
National Ambient Air Monitoring Conference – August 2016

First Assessment • Provided Background/History of NATTS Program • Covered measurements from 2003-2010
– Special focus on 2005-2010 (23 sites fully operating) • Evaluated NATTS AQS data reporting • Evaluated MQOs and scored each pollutant dataset
– Completeness
– Sensitivity – Bias – Precision
National Ambient Air Monitoring Conference – August 2016 5
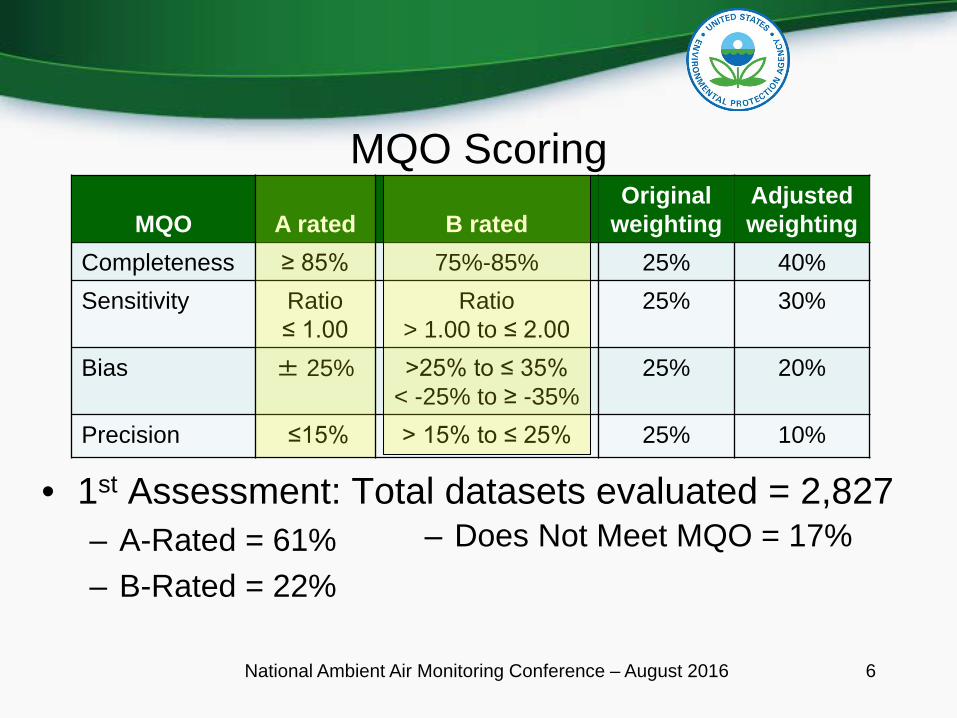
MQO Scoring
MQO A rated B rated Original
weighting Adjusted weighting
Completeness ≥ 85% 75%-85% 25% 40% Sensitivity Ratio
≤ 1.00 Ratio
> 1.00 to ≤ 2.00 25% 30%
Bias ± 25% >25% to ≤ 35% < -25% to ≥ -35%
25% 20%
Precision ≤15% > 15% to ≤ 25% 25% 10%
• 1st Assessment: Total datasets evaluated = 2,827 – A-Rated = 61% – Does Not Meet MQO = 17%
– B-Rated = 22%
National Ambient Air Monitoring Conference – August 2016 6

2nd Assessment Status • Calculated 3-year block averages (316 site-polls)
Pollutant # Sites
# Sites %DIFF
Pollutant # Sites
# Sites %DIFF Chromium VI 12 -37.4 Formaldehyde 12 -18.6 Lead (PM10) 14 -34.6 Manganese (PM10) 13 -14.6 Naphthalene NA NA Nickel (PM10) 12 -32.4 Tetrachloroethylene 14 -42.6 Trichloroethylene 16 -33.5 Vinyl Chloride 13 +15.9
Acetaldehyde 13 -15.9 Arsenic (PM10) 8 -12.2 Benzene 14 -18.2 Benzo(a)pyrene NA NA Beryllium (PM10) 12 -22.2 Butadiene, 1,3 12 -28.3 Cadmium (PM10) 14 -28.6 Carbon Tetrachloride 11 +8.7 Chloroform 16 +16.5
Air Toxics Data Analysis Workshop – October 2015 7

1st Assessment Top 10 Items EPA Action Item EPA Result
1. Review NATTS Pollutant List Chromium6+ made optional 2. Move/Add NATTS Sites Evaluated, but no decision 3. Review NATTS DQO Workgroup convened; DQO slightly revised 4. Refine NATTS MQOs MDL updates 5. NATTS Reporting Oversight Program office reviews data annually 6. Increase PT Sampling Moving towards 2 samples per year for specific
methods 7. Equipment Replacement Provided $ for new equipment 8. Review Sampling Methods Currently reviewing TO-11A and acrolein;
approved new lead (PM10) equivalency method 9. Update TAD Nearly complete 10. Increased communication to NATTS sites
Site-specific mini-reports; NATTS Quarterly Calls; second assessment; training
National Ambient Air Monitoring Conference – August 2016 8

Second Assessment Rationale • Include naphthalene and benzo(a)pyrene –
sampling began in 2007/2008
• Include data from new sites – Los Angeles, CA – Rubidoux, CA – Portland, OR – Richmond, VA
National Ambient Air Monitoring Conference – August 2016 9

Second Assessment Rationale • Include data from original sites
– San Jose, CA (began 1-in-6 day sampling in 2008) – Seattle, WA (data issues in 2005) – Rochester, NY for PM10 metals (began sampling 2007)
• More data to evaluate trends
• NATTS data is being used by several end-users – e.g., NATA; Report to Congress; Enforcement
National Ambient Air Monitoring Conference – August 2016 10

NATTS AQS Data Reporting Update
• NATTS Workplan requires AQS reporting 120 days after calendar quarter. – e.g. 2014 data to be in AQS by 5/1/2015 – EPA initially pulled all NATTS data on 7/1/2015
• Although percent completeness increased, there were still issues: – Missing MQO datasets (e.g., entire 2013 VOCs) – Missing pollutant datasets (e.g., 2012 benzene) – Missing concentrations within a dataset (e.g., 2nd quarter
acetaldehyde) National Ambient Air Monitoring Conference – August 2016 11

NATTS AQS Data Reporting Update Metric Reason
Reporting of Alternative Method Detection Limits (MDLs)
Work Plan requirement
National calendar day sampling Consistency for national trends Reported engineering units Evaluate how sites are reporting data
(e.g. – 15 of 27 sites reporting local conditions for PM10 in 2014)
Reporting of non-detects Work Plan requirement Reporting of under-MDL data Work Plan requirement Miscoding of data elements Consistency for national trends Reporting of Analytical Precision data
Work Plan requirement (7/1/2011)
National Ambient Air Monitoring Conference – August 2016 12

NATTS AQS Data Reporting Update Metric Reason
Use of data qualifiers and null data codes
Work Plan requirement; QA
Reporting of collocated and duplicate data
Work Plan requirement
Reporting of other (non-NATTS MQO Core) HAPs
Informational; QA; Data analysis
Reporting of non-HAPs Informational; QA; Data analysis Reporting of criteria pollutants Informational; Data analysis Reporting of meteorological measurements
Informational; Data analysis
Identification of NATTS monitors within AQS
Informational; QA
13National Ambient Air Monitoring Conference – August 2016

2nd Assessment Status • Assessed TSA Instrument Performance Audits (IPAs) and
schedules • Conducted NATTS Site Operator surveys • Measurements database finalized
– Synchronized with Phase 10 HAP Archive database, plus missing data from subsequent AQS pulls and NATTS Operators
National Ambient Air Monitoring Conference – August 2016 14

Phase X Ambient Monitoring Archive for HAPs
https://www3.epa.gov/ttn/amtic/toxdat.html#data National Ambient Air Monitoring Conference – August 2016
15

2nd Assessment Status • Updated equipment inventory through 2013
– Need input for the 2014 equipment • Calculated summary statistics • Calculated pollutant dataset completeness (MQO 1) • Assessed reported MDLs (MQO 2) • Reviewed PT results (MQO 3) • Calculated precision statistics (MQO 4) • Applied MQO scoring routine
National Ambient Air Monitoring Conference – August 2016 16
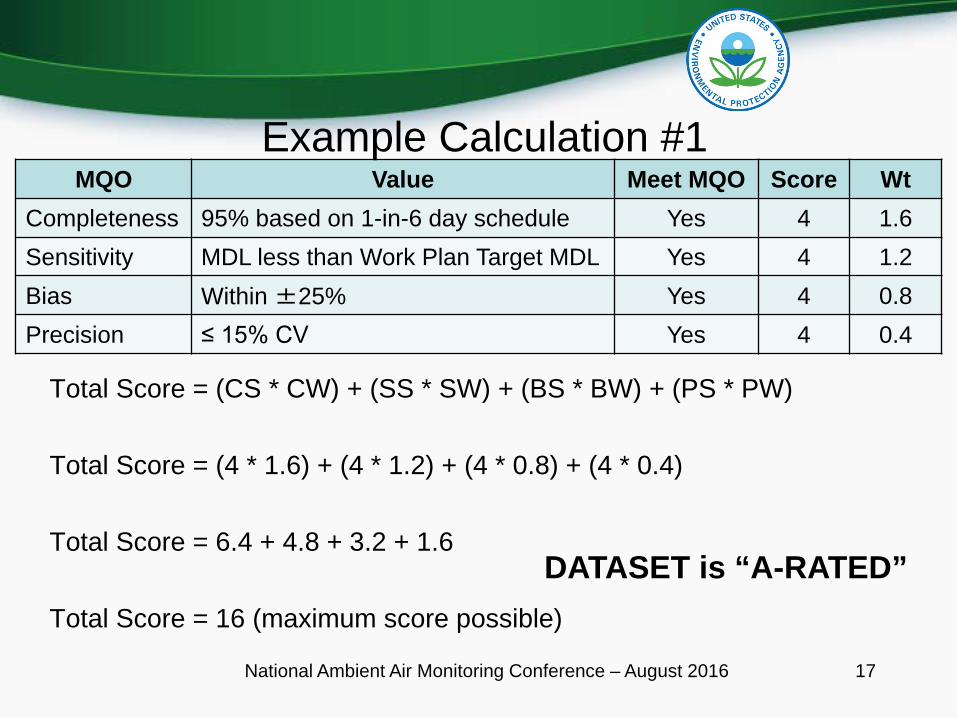
Example Calculation #1 MQO Value Meet MQO Score Wt
Completeness 95% based on 1-in-6 day schedule Yes 4 1.6 Sensitivity MDL less than Work Plan Target MDL Yes 4 1.2 Bias Within ±25% Yes 4 0.8 Precision ≤ 15% CV Yes 4 0.4
Total Score = (CS * CW) + (SS * SW) + (BS * BW) + (PS * PW)
Total Score = (4 * 1.6) + (4 * 1.2) + (4 * 0.8) + (4 * 0.4)
Total Score = 6.4 + 4.8 + 3.2 + 1.6 DATASET is “A-RATED”
Total Score = 16 (maximum score possible)
National Ambient Air Monitoring Conference – August 2016 17

Example Calculation #2 MQO Value Meet MQO Score Wt
Completeness 80% based on 1-in-6 day schedule No 3 1.6 Sensitivity MDL 10% > Work Plan Target MDL No 3 1.2 Bias 30% No 3 0.8 Precision 20% CV No 3 0.4
Total Score = (CS * CW) + (SS * SW) + (BS * BW) + (PS * PW)
Total Score = (3 * 1.6) + (3 * 1.2) + (3 * 0.8) + (3 * 0.4)
Total Score = 4.8 + 3.6 + 2.4 + 1.2 DATASET is “B-RATED”
Total Score = 12 (minimum score to be considered “suitable” for data analysis)
18National Ambient Air Monitoring Conference – August 2016
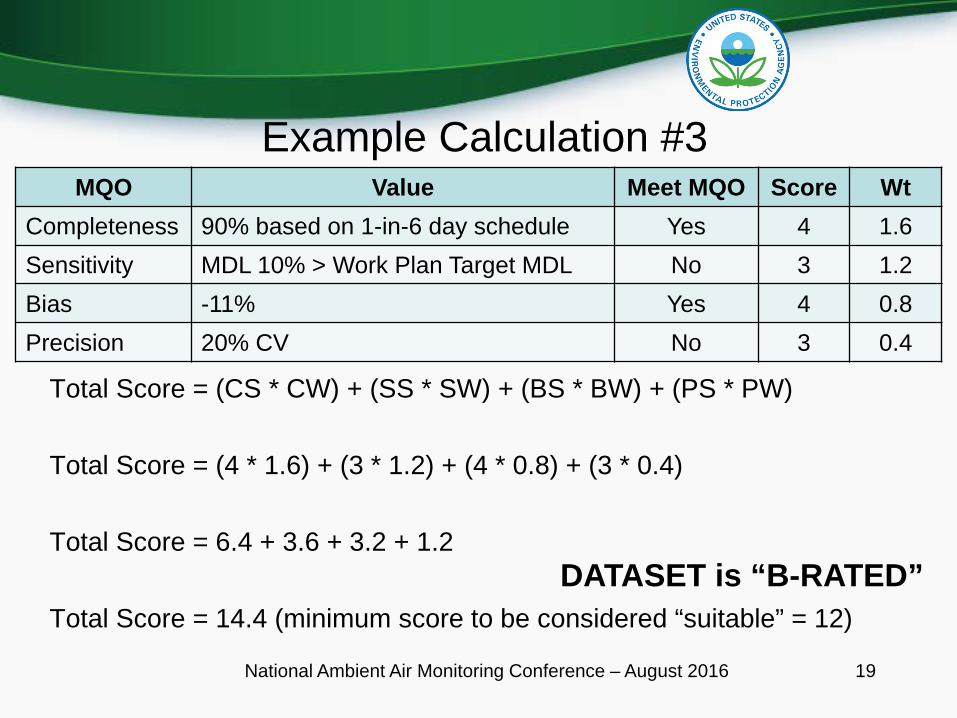
Example Calculation #3 MQO Value Meet MQO Score Wt
Completeness 90% based on 1-in-6 day schedule Yes 4 1.6 Sensitivity MDL 10% > Work Plan Target MDL No 3 1.2 Bias -11% Yes 4 0.8 Precision 20% CV No 3 0.4
Total Score = (CS * CW) + (SS * SW) + (BS * BW) + (PS * PW)
Total Score = (4 * 1.6) + (3 * 1.2) + (4 * 0.8) + (3 * 0.4)
Total Score = 6.4 + 3.6 + 3.2 + 1.2 DATASET is “B-RATED”
Total Score = 14.4 (minimum score to be considered “suitable” = 12)
National Ambient Air Monitoring Conference – August 2016 19

Example Calculation #4 MQO Value Meet MQO Score Wt
Completeness 100% based on 1-in-6 day schedule Yes 4 1.6 Sensitivity No MDL Reported No 0 1.2 Bias 10% Yes 4 0.8 Precision 10% CV Yes 4 0.4
Total Score = (CS * CW) + (SS * SW) + (BS * BW) + (PS * PW)
Total Score = (4 * 1.6) + (0 * 1.2) + (4 * 0.8) + (4 * 0.4)
Total Score = 6.4 + 0.0 + 3.2 + 1.6 DATASET is “DOES NOT MEET”
Total Score = 11.2 (minimum score to be considered “suitable” = 12)
National Ambient Air Monitoring Conference – August 2016 20

Example Calculation #5 MQO Value Meet MQO Score Wt
Completeness 100% based on 1-in-6 day schedule Yes 4 1.6 Sensitivity MDL less than Work Plan Target MDL Yes 4 1.2 Bias 42% No 0 0.8 Precision 37% CV No 0 0.4
Total Score = (CS * CW) + (SS * SW) + (BS * BW) + (PS * PW)
Total Score = (4 * 1.6) + (4 * 1.2) + (0 * 0.8) + (0 * 0.4)
DATASET is “DOES Total Score = 6.4 + 4.8 + 0 + 0 NOT MEET”
Total Score = 11.2 (minimum score to be considered “suitable” = 12)
National Ambient Air Monitoring Conference – August 2016 21

2nd Assessment Status • 2nd Assessment: Total datasets evaluated = 4,786
– A-Rated = 57% – B-Rated = 27% – Does Not Meet = 16%
• By Year: Rating
2003
2004
2005
2006
2007
2008
2009
2010
2011
2012
2013
2014
A-rated 23% 40% 53% 53% 65% 62% 59% 68% 74% 47% 53% 50%
B-rated 17% 31% 24% 18% 18% 23% 28% 20% 18% 43% 36% 36%
Does Not Meet
60% 29% 23% 29% 17% 15% 13% 12% 8% 10% 11% 14%
A-rated and B-rated are considered suitable for trends analysis
22National Ambient Air Monitoring Conference – August 2016

NATTS DQO
• NATTS DQO: % Difference between Block 1 and Block 2 in the six-year Block – Calculate annual average by year – Assign Block ID for each site-annual year within a 6-year
block • Block 1 = Years 1-3 (e.g., 2009, 2010, 2011) • Block 2 = Years 4-6 (e.g., 2012, 2013, 2014)
– Calculate 3-year block averages from annual averages
National Ambient Air Monitoring Conference – August 2016 23
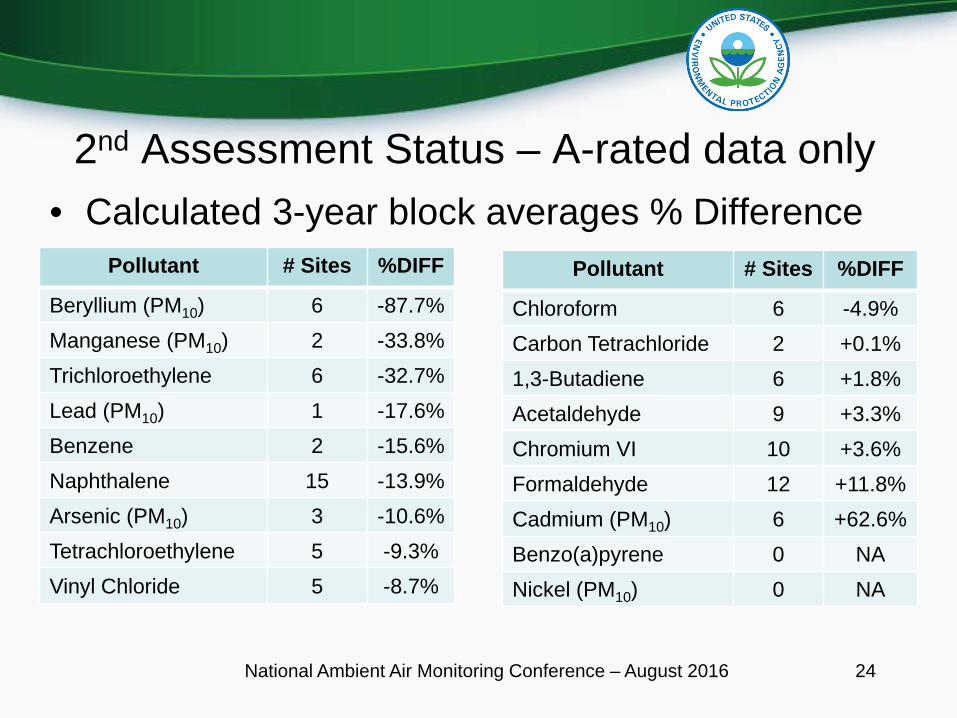
2nd Assessment Status – A-rated data only • Calculated 3-year block averages % Difference
Pollutant # Sites %DIFF Pollutant # Sites %DIFF Beryllium (PM10) 6 -87.7% Chloroform 6 -4.9% Manganese (PM10) 2 -33.8% Carbon Tetrachloride 2 +0.1% Trichloroethylene 6 -32.7% 1,3-Butadiene 6 +1.8% Lead (PM10) 1 -17.6% Acetaldehyde 9 +3.3% Benzene 2 -15.6% Chromium VI 10 +3.6% Naphthalene 15 -13.9% Formaldehyde 12 +11.8% Arsenic (PM10) 3 -10.6% Cadmium (PM10) 6 +62.6% Tetrachloroethylene 5 -9.3% Benzo(a)pyrene 0 NA Vinyl Chloride 5 -8.7% Nickel (PM10) 0 NA
National Ambient Air Monitoring Conference – August 2016 24

2nd Assessment Status – A- and B-Rated Data • Calculated 3-year block averages % Difference
Pollutant # Sites %DIFF
Beryllium (PM10) 22 -42.7% Trichloroethylene 23 -34.2% Benzene 19 -22.1% Lead (PM10) 24 -15.5% Naphthalene 22 -14.7% Manganese (PM10) 24 -10.7% Chromium VI 18 -9.5% Chloroform 23 -8.7% Tetrachloroethylene 16 -8.6%
Pollutant # Sites %DIFF
Nickel (PM10) 23 -4.4% Acetaldehyde 22 -2.6% Carbon Tetrachloride 16 -1.3% 1,3-Butadiene 17 -0.3% Arsenic (PM10) 22 -0.1% Benzo(a)pyrene 22 +0.7% Cadmium (PM10) 24 +0.9% Formaldehyde 25 +4.0% Vinyl Chloride 16 +12.1%
National Ambient Air Monitoring Conference – August 2016 25

2nd Assessment Status • Example Annual Rolling Average
32% decrease since 2003!
National Ambient Air Monitoring Conference – August 2016 26

2nd Assessment NATTS Challenges • Data reporting
– Accuracy and timeliness • Data Review
– Invalidating data years after measurement taken • Staff Turnover
– Need for training; staff redundancy
National Ambient Air Monitoring Conference – August 2016 27

2nd Assessment NATTS Challenges • For at least 1 pollutant….
– Completeness MQO: • In 2014, six sites did not meet this MQO for at least 1 pollutant
– Sensitivity MQO: • In 2014, ten sites did not meet this MQO for at least 1 pollutant
– Bias MQO: • In 2014, twenty-two sites did not meet this MQO for at least 1
pollutant – Precision MQO:
• In 2014, twenty-five sites did not meet this MQO for at least 1 pollutant
National Ambient Air Monitoring Conference – August 2016 28

Upcoming Activities • Update NATTS emission source maps/data
– Include 2011 NEI and 2011-2014 TRI – May include 2014 NEI (if available)
• Update NATTS site windroses • Finalize annual, rolling 3-year, and multi-block
averages. • Prepare/finalize assessment report • Prepare individual site reports
National Ambient Air Monitoring Conference – August 2016 29

THANK YOU! • Regi Oommen
919-468-7829 [email protected]
• Dave Shelow, 919-541-3776, [email protected] • Laurie Trinca, 919-541-0520, [email protected] • Greg Noah, 919-541-2771, [email protected] • Madeleine Strum, 919-541-2383, [email protected]
National Ambient Air Monitoring Conference – August 2016 30


