
NB PRIVATE EQUITY PARTNERS: INVESTOR UPDATEDECEMBER 2018FINANCIAL INFORMATION AS OF 31 OCTOBER 2018 (RE-STATED) UNLESS OTHERWISE NOTED

2
NB PRIVATE EQUITY PARTNERS INVESTOR UPDATE
NB PRIVATE EQUITY PARTNERS (“NBPE”)
OBJECTIVE To provide investors the opportunity for capital appreciation (through share price growth) and current income (through a regular dividend)…
STRATEGY …by investing directly into private-equity backed companies, across the capital structure in the best relative value opportunities…
MANAGER …using the sourcing and due diligence capabilities of Neuberger Berman’s $65 billion1 private equity platform…
1. Since inception through September 2018. Includes commitments still in the process of documentation.
EFFICIENCY …with lower all-in costs to investors than other listed PE vehicles

3
NB PRIVATE EQUITY PARTNERS INVESTOR UPDATE
NBPE’S MANAGER: NEUBERGER BERMANNeuberger Berman manages over $65 billion in Private Equity
1. Committed capital from inception through September 2018, including commitments in the process of documentation.2. Average over the past three years (2015 – 2017).
KEY HIGHLIGHTS
Industry Leadership: 30 years as a private equity investor; committed approximately $7 billion annually(2) to private equity over the past three years
Active Fund Relationships: LP in over 450 active private equity funds
Experienced Investors: Expertise across fund investments, direct investments and income investments
Deep Team: Over 150 dedicated private equity investment professionals with extensive networks
Global Presence: Investment offices in New York, Dallas, Boston, London, Milan, Hong Kong and Bogota
PRIVATE EQUITY PLATFORMOver $65 billion of commitments managed(1)
FUND INVESTMENTS DIRECT INVESTMENTS
Primary Secondary EquityCo-Investments Private Debt Other Yielding
Strategies
NBPE Focus

4
NB PRIVATE EQUITY PARTNERS INVESTOR UPDATE
NBPE KEY PERFORMANCE HIGHLIGHTSKey Performance Highlights
Performance LTM October 2018
10.5% NAV per share total return (USD)1
12.1% Share price total return (GBP)2
Capital Position 31 October 2018$1,014.0 million of Private Equity Fair Value300% Adjusted Commitment Coverage Ratio3
Cash Flows during 2018 YTD$199.9 million of distributions from Investments$178.1 million invested into Investments$25.9 million of dividends paid
Dividend at 31 October 20184.0% annualised dividend yield on share price4
3.1% annualised dividend yield on NAV
Dr. Cr.
Note: NAV data as of 31 October 2018. NBPE share price data based on the London Stock Exchange closing share price of £10.85 on 31 October 2018.1. Based on London Stock Exchange data. Prior to 30 June 2009, NBPE was only listed on the Euronext Amsterdam exchange; the Euronext Amsterdam exchange share price has been substituted for performance calculations prior to this date. All
performance figures assume re-investment of dividends at NAV or closing share price on the ex-dividend date and reflect cumulative returns over the relevant time periods shown and are not annualised returns. 2. USD equivalent share price return on the London Stock Exchange is 5.6% on a LTM basis.3. Unfunded commitments are adjusted for funds past their investment period (except for reserves which may be called) and amounts which NBPE has the right to terminate if it so chooses.4. NBPE most recently paid a $0.28 per Share dividend on 31 August 2018 (£0.22, based on a GBP/USD rate of $1.277).

5
NB PRIVATE EQUITY PARTNERS INVESTOR UPDATE
NBPE NAV UPDATEOctober 2018 NAV per Share of $18.05. Including $0.53 per Share of dividends paid in 2018, NAV per Share was $18.58
SUMMARY BALANCE SHEET
Note: NBPE data as of 31 October 2018. Numbers may not sum due to rounding.1. GBP/USD FX rate of $1.277 on 31 October 2018 and $1.351 on 31 December 2017.
($ in millions, unless otherwise noted)
31 October 2018 (Unaudited)
31 December 2017 (Audited)
Direct Investments
Equity Investments $800.3 $698.6Income Investments 142.6 155.2
Total Direct Investments 942.9 853.8Legacy Fund Investments 71.1 107.6Total Private Equity Fair Value 1,014.0 961.4Private Equity Investment Level 115% 113%Cash and Cash Equivalents 10.3 25.7Credit Facility Borrowings (10.0) (60.0)ZDP Share Liability - 2024 (65.0) - ZDP Share Liability - 2022 (69.4) (71.1) Net Other Assets (Liabilities), including Minority Interest 0.8 (7.5)Net Asset Value $880.7 $848.6Net Asset Value per Share $18.05 $17.45Net Asset Value per Share (GBP)1 14.14£ 12.91£ Net Asset Value Plus Dividends Paid During Financial Period $18.58 -

6
NB PRIVATE EQUITY PARTNERS INVESTOR UPDATE
NBPE PORTFOLIO DIVERSIFICATIONWell diversified portfolio weighted to North American investments
COMPANY SIZE
VINTAGE YEAR
GEOGRAPHY
INDUSTRY
SMALL / MID-CAP75%
LARGE-CAP23%
OTHER2%
BUSINESS SERVICES
13%
COMM/MEDIA6%
CONSUMER DISCR.
14%ENERGY
4%
FINANCIAL SERVICES
9%
HEALTHCARE13%
INDUSTRIALS18%
TECHNOLOGY20%
TRANS.2%
DIV / OTHER1%
2010 & Earlier5%
20112% 2012
2%20134%
201410%
201510%
201616%
201734%
201817%
Note: as of 31 October 2018. Numbers may not sum due to rounding. Please see endnotes for information on diversification calculations.
NORTH AMERICA
80% EUROPE15%
ASIA / ROW5%

7
NB PRIVATE EQUITY PARTNERS INVESTOR UPDATE
NBPE NET ASSET VALUE DEVELOPMENT2018 value appreciation driven by investment gains and yield income
NAV PER SHARE DEVELOPMENT
$0.30$1.31
$17.45
$18.05($0.53)
($0.34)($0.14)
$15.50
$16.00
$16.50
$17.00
$17.50
$18.00
$18.50
$19.00
$19.50
$20.00
Dec. 2017 NAV InvestmentAppreciation (Net
of Tax Exp.)
Yield Income &DividendsReceived
Financing Costs,Incl. FX (ZDPs &
Credit Facility)
Mgmt Fees,Operating
Expenses &Other
Dividends Paid toShareholders
October 2018NAV
USD
Note: As of 31 October 2018. Numbers may not sum due to rounding.

8
NB PRIVATE EQUITY PARTNERS INVESTOR UPDATE
PERFORMANCE OVERVIEW BY INVESTMENT TYPE2018 YTD, LTM, three year, and five year investment performance summary
NBPE PERFORMANCE MEASURED BY GROSS IRR
Note: As of 31 October 2018. Numbers may not sum due to rounding.
INVESTMENT TYPE 31 OCT 2018 ($M) 2018 YTD OCT 18 LTM THREE YEAR FIVE YEAR
DIRECT EQUITY INVESTMENTS $800.3 11.3% 16.8% 19.0% 21.7%
INCOME INVESTMENTS $142.6 6.7% 4.6% 8.3% 9.7%
FUNDS $71.1 1.4% (0.5%) 4.0% 5.3%
TOTAL PORTFOLIO $1,014.0 9.6% 13.0% 13.9% 14.1%
KEY TAKEAWAYS:
DIRECT EQUITY INVESTMENTS HAVE PERFORMED WELL ACROSS TIME PERIODS
LOWER RETURNS IN INCOME INVESTMENTS LARGELY DUE TO AN INVESTMENT WHICH HAS BEEN MARKED DOWN DUE TO AN ONGOING RESTRUCTURING
FUNDS ARE NOW “TAIL-END” AND WINDING DOWN OVER TIME

9
NB PRIVATE EQUITY PARTNERS INVESTOR UPDATE
$56 $43 $55 $39
$136
$171
$49
$225
$78
$69
$33
$53
$79
$81
$108
$64
$232 $129
$144
$108
$0
$50
$100
$150
$200
$250
$300
$350
FUNDS INCOME EQUITY
PORTFOLIO INVESTMENT ACTIVITY & LIQUIDITYAlmost $1.1 billion of distributions from realisations received since 2015
CASH FLOWS
Note: As of 31 October 2018. Numbers may not sum due to rounding.
$ in millions
2015 2016 2018 YTD
$308
$226
$313$331
$159
$253
2017Investments Realisations
$200$178
Investments Realisations Investments Realisations Investments Realisations

10
NB PRIVATE EQUITY PARTNERS INVESTOR UPDATE
x
NBPE DIRECT EQUITY PORTFOLIONBPE has a well diversified direct equity portfolio, giving access to growing companies alongside high quality PE sponsors
Note: As of 31 October 2018. *Undisclosed company.1. Analysis based on 83 private companies, representing 79% of direct equity fair value and excludes public companies, equity invested alongside healthcare credits, financial services companies valued on a multiple of book value or other income
metrics, E&P companies valued on acreage or reserves and escrow value (ie companies valued on metrics other than EBITDA). Revenue and EBITDA of companies denominated in foreign currency are converted to US Dollars at the average US Dollar exchange rate for the 12 month period from 30/6/17 through 30/6/18; leverage and enterprise value is converted to US Dollars at the year end exchange rate. Companies valued on a revenue multiple are excluded from EV/EBITDA metrics. Portfolio company operating and valuation metrics are based on the most recently available (unaudited) financial information for each company. Where necessary, estimates were used, which include pro forma adjusted EBITDA and revenue, annualised quarterly operating metrics and LTM periods as of 30/6/18 and 31/3/18. Data weighted by private equity fair value as of 30 June 2018.
2. Returns are presented on a “gross” basis (i.e. they do not reflect the management fees, carried interest, transaction costs and other expenses that may be paid by investors, which may be significant and may lower returns).
NBPE DIRECT EQUITY INVESTMENTS
101 direct equity investments with $800.3 million of fair value
DIVERSIFIED PORTFOLIO
Diversified by industry, geography, vintage year and sponsor
5.7% LTM Revenue growth / 9.2% LTM EBITDA growth
LTM GROWTH1
VALUATION & LEVERAGE1
10.5x EV / EBITDA & 4.4x Net Debt / EBITDA
TOP TEN INVESTMENTS
2018 EXITS2
5 Full exits generating a 1.9x gross multiple and 26% IRR
Investment Name Vintage Industry FV ($m)
Staples 2017 Consumer $34.6
Material Handling Systems 2017 Business Serv. 30.2
Business Services Company* 2017 Business Serv. 28.1
ProAmpac 2016 Packaging 26.5
USI Insurance 2017 Fin. Serv. 26.0
Engineering 2016 Technology 25.5
Telxius 2017 Telecom 23.4
Q Park 2017 Transportation 22.4
Marquee Brands 2014 Consumer 17.0
Bomgar 2018 Technology 17.0
TOP TEN INVESTMENTS $250.9

11
NB PRIVATE EQUITY PARTNERS INVESTOR UPDATE
EQUITY REALISATIONS AND IPOS IN 2018NBPE has continued to produce strong liquidity from its equity investments in 2018
Note: As of 31 October 2018. *Due to confidentiality provisions, company name cannot be disclosed.
INVESTMENT YEAR OF INVESTMENT DESCRIPTION OUTCOME
2016 • Global financial advisory and investment banking firm • Not disclosed
2015 • Leader in eDiscovery and legal consulting • Sold to GI Partners
2014 • Packaging machinery for consumer goods • Sold to Leonard Green & Partners in March 2018
2014 • Underwriter and administrator of extended warranties • Sold to Assurant (NYSE: AIZ) for $2.5 billion in cash and stock
2014 • Genetic testing and services • Sold to Myriad Genetics for $375 million, in cash and shares, which were subsequently sold
2013 • Mortgage servicing technology and services • IPO (NYSE: BKI) in 2015; partial secondary sale of public shares
2013 • Maker of industrial equipment • IPO (NYSE: GDI) in 2017; partial secondary sale of public shares
2010 • High-end systems engineering / IT for defense, intelligence and civilian markets
• Spin-off of DXC Technology U.S. Public Sector and merger with Vencore to form Perspecta (NYSE: PRSP)
2014 • Japanese mortgage company • IPO in 2017 (TYO: 7198); partial secondary sale of public shares
Financial Services Company*
IPOS DURING 2018
INVESTMENT YEAR OF INVESTMENT DESCRIPTION OUTCOME
2014 • Operator of hospitals, clinics and pharmacies • IPO in February; partial secondary sale
2013 • Commercial landscape and turf maintenance • IPO in June
2013 • Shallow water offshore drilling contractor • IPO in June
2016 • Enterprise-class IT and infrastructure management software • IPO in October

12
NB PRIVATE EQUITY PARTNERS INVESTOR UPDATE
EQUITY EXITS & UPLIFTNBPE has seen strong exits and valuation uplift relative to carrying values
VALUATION UPLIFT ON EXIT2 (ALL EXITS)
1. As of 31 October 2018. Includes full exits only. Excludes partial exits, recapitalisations and IPOs until the stock is fully exited. Year represents the year of final exit. Exit year for public companies determined by the date of the final cash flow. Proceeds include funds that are currently in escrow, but are expected to be received. Returns are presented on a “gross” basis (i.e. they do not reflect the management fees, carried interest, transaction costs and other expenses that may be paid by investors, whichmay be significant and may lower returns).2. As of 31 October 2018. Analysis includes 11 IPOs, two partial exits, and 25 full direct equity investment exits since January 2015. For investments which completed an IPO, the value is based on the closing share price on the IPO date; however NBPE remains subject to customary IPO lockup restrictions. Returns are presented on a “gross” basis (i.e. they do not reflect the management fees, carried interest, transaction costs and other expenses that may be paid by investors, which may be significant and may lower returns).
GROSS MOIC ON EXITS1 (FULL EXITS ONLY)
0.0x
1.0x
2.0x
3.0x
4.0x
5.0x
6.0x
2015 2016 2017 2018
MULTIPLE OF INVESTED CAPITAL
Multiple % Uplift
1.9x
0%
5%
10%
15%
20%
25%
30%
35%
40%
45%
THREE QUARTERSPRIOR
TWO QUARTERSPRIOR
ONE QUARTER PRIOR
% UPLIFT ON REALISATION
2.1x
4.4x 31.7%
21.0%
13.8%1.9x
13
NB PRIVATE EQUITY PARTNERS INVESTOR UPDATE
COMPANY CHARACTERISTICS
• Strong free cashflow
• Sustainable capital structure
• Less cyclical
• Industries with strong secular trends
NAVIGATING THE CURRENT ENVIRONMENT
STRATEGY
• Focus on execution risk over market risk
• Identify opportunities to create value through operational improvements and growth (e.g. margin improvement, geographic expansion, etc.)

14
NB PRIVATE EQUITY PARTNERS INVESTOR UPDATE
INVESTMENT SPONSOR DESCRIPTION THESIS
New Mountain Manufacturer and distributor of high-performance chemistries and materials
Favourable industry fundamentals; large scale company with strong cash flow generation and sticky customer base
Francisco Partners Provider of secure access software for remote device support Leading solution in market, strong management team, cash flow generative with strong organic growth
Cartesian Capital Exclusive master franchise rights for Burger King in mainland China with more than 800 restaurants Large, growing market with established brand and footprint
Pritzker PrivateCapital
Leading food manufacturer serving foodservice, retail, industrial and in-store markets
High quality brands with stable demand across cycles; strong customer relationships
FTV Capital Payment processor focused on small & medium sized customers Strong financial performance and market tailwinds
Lime Rock Partners Energy – mineral and royalty interests Attractive risk-reward profile of mineral interest ownership in partnership with a strong operating team
Hellman & Friedman Provider of automated, personalised investment management services
Leading financial services provider with stable earnings and high retention rates; combination with Financial Engines to drive growth
BC Partners #1 diversified environmental services provider in Canada Strong business platform with favourable service market dynamics; diverse and sticky customers base
Not disclosed Healthcare services company Stable market, large platform to accelerate value creation
Not disclosed Healthcare provider of in home devices Market leader with strong organic growth prospects
Sentinel Capital Automotive performance company Strong product offering; attractive strategic platform combination
NEW EQUITY INVESTMENTS IN 2018 YTD
Note: As of 31 October 2018. Excludes $13.1 million of follow-on investments.*Due to confidentiality provisions, company name cannot be disclosed.
$122.8 million invested in 21 new equity investments and $8.2 million invested in a portfolio of 13 mature Italian middle-marketbuyout companies during 2018 YTD
Healthcare Services Company*Healthcare Company –In-home Devices*

15
NB PRIVATE EQUITY PARTNERS INVESTOR UPDATE
INVESTMENT SPONSOR DESCRIPTION THESIS
Platinum Equity Global provider of engineered plastic injection molding, tooling and systems Market leading provider with high recurring revenue, backlog and base
JLL Partners Contract manufacturer of orthopedic and surgical implants and components
Large, addressable market with secular tailwinds and strong barriers to entry
Gryphon Partners Colour cosmetics brand Strong organic growth prospects
NB Renaissance Portfolio of mature Italian middle-market companies Exposure to Italian middle market companies at attractive valuations
Blue Point Capital Designer and supplier of casual apparel Leading position in segment and multiple growth initiatives
Francisco Partners Educational software provider in K-12 space Well known and leading brand with sticky customer base and strong financial profile
Oak Hill Safety and productivity products for fleet operators and vehicle manufacturers
Stable market with high barriers to entry, competitive market position and sticky, diverse customer base
Not disclosed Consumer technology company Strong growth prospects and market share
Vinci Partners Distance learning education in Brazil Leading distance learning platform with strong brand recognition and positive tailwinds in post secondary education market
Francisco Partners Provider of payment solutions and one of the world’s largest point of sale terminal vendors
Unique asset with significant global install base around the world; opportunity for operational improvements
Silver Lake Leading digital property data and software company Well positioned market leader
NEW EQUITY INVESTMENTS IN 2018 YTD (CONT.)
Note: As of 31 October 2018. Excludes $13.1 million of follow-on investments.*Due to confidentiality provisions, company name cannot be disclosed.
$122.8 million invested in 21 new equity investments and $8.2 million invested in a portfolio of 13 mature Italian middle-marketbuyout companies during 2018 YTD
Undisclosed Consumer Technology Company*

16
NB PRIVATE EQUITY PARTNERS INVESTOR UPDATE
$2.2 $8.8
$44.1
$79.5
$275.1
$155.0
$1.2
$18.2
$23.1$2.4
$144.8
$3.9
$36.7
$5.2
1.1x
0.9x
1.5x
1.1x
1.8x
1.6x
1.3x 1.3x 1.4x
$-
$25
$50
$75
$100
$125
$150
2006 - 2008 2009 - 2011 2012 2013 2014 2015 2016 2017 2018 YTD
$ in millions
0.0x
0.5x
1.0x
1.5x
2.0x
2.5x
3.0x
Multiple
Current Value (NAV - Private) Current Value (NAV - Publics) Carry ing Value Multiple
CURRENT EQUITY PORTFOLIO VALUATION BY YEARThe equity co-investment portfolio is held at a 1.3x multiple of cost
Note: as of 31 October 2018.
EQUITY PORTFOLIO VALUATION BY VINTAGE YEAR
Portfolio Valuation: 1.3x

17
NB PRIVATE EQUITY PARTNERS INVESTOR UPDATE
PUBLIC STOCK EXPOSURE
PUBLIC VS PRIVATE VALUE
Note: As of 31 October 2018.
Public company shares represent approximately $81.3 million or 8% of private equity fair value
Private92%
Public 8%
Investment Industry IPO Date $ in millionsExtraction Oil & Gas (NASDAQ: XOG) Energy Oct 2018 $13.0
Solarwinds (NYSE: SWI) Technology Oct 2016 11.2
Assurant (NYSE: AIZ) Financials NA 10.5
Gardner Denver (NYSE: GDI) Industrials May 2017 10.3
Aruhi (TYO: 7198) Financials Dec 2017 7.2
Brightview (NYSE: BV) Business Svs. June 2018 6.5
Perpsecta (NYSE: PRSP) Technology NA 4.6
Evoqua (NYSE: AQUA) Industrials Nov 2017 4.5
First Data (NYSE: FDC) Financials Oct 2015 3.2
Aster DM Healthcare (NSE: ASTERDM) Healthcare Feb 2018 1.6
All Other Publics 8.7Total Public Value $81.3

18
NB PRIVATE EQUITY PARTNERS INVESTOR UPDATE
Investment Name Industry Cash Yield FV ($m)
Schumacher Group Healthcare 11.1% $9.7
Carestream Dental Healthcare 10.8% 9.4
Dubois Chemical Industrials 10.7% 9.0
ProAmpac Packaging 11.0% 6.0
Central Security Group Consumer 11.9% 5.9
Galco Industrial Industrials 10.1% 5.4
Optiv Technology 10.1% 5.1
OB Hospitalist Healthcare 12.5% 5.1
Epic Insurance Insurance 12.3% 4.9
Blue Nile Consumer 9.5% 4.6
TOP TEN INVESTMENTS $66.7
NBPE INCOME PORTFOLIOThe NBPE income portfolio is well diversified, partially supports the dividend and has a reasonable average level of total leverage
Note: As of 31 October 2018. *Top 10 Investments exclude credit opportunities investments.1. Leverage statistics exclude small business loan programs, credit opportunities and healthcare credit investments. Based on portfolio company data as of 30 September 2018. Small business loan programs are excluded from yield calculations but
are at an interest rate at least at the rate stated above.2. Debt key statistics exclude healthcare credit investments and small business loan portfolios. 3. Companies have a leading market position in their industry or niche based on NB’s due diligence.
NBPE INCOME INVESTMENTS
29 income investments with $142.9 million of fair value
CASH YIELD & LEVERAGE STATISTICS1
– 6.8% cash yield / 13.8% estimated yield to maturity– 5.8x total leverage / 4.2x senior leverage– 60% of fair value in floating rate debt– 36% dividend coverage from portfolio cash yield
– 55% are in asset light companies– 94% are in a market leading position3
– 31% are in companies with a >40% equity cushion– 96% are in companies with a >20% equity cushion– 51% are in companies with a >25% EBITDA margin
KEY STATS2
TOP TEN INVESTMENTS*

19
NB PRIVATE EQUITY PARTNERS INVESTOR UPDATE
HISTORIC PERFORMANCE
CUMULATIVE RETURNS OVER TIME1
Note: NAV data as of 31 October 2018. NBPE share price data based on the London Stock Exchange as of 31 October 2018. Prior to 30 June 2009, NBPE was only listed on the Euronext Amsterdam exchange; the Euronext Amsterdam exchange share price has been substituted for performance calculations prior to this date. GBP share price returns converted at daily GBP/USD close FX rates.1. All performance figures assume re-investment of dividends at NAV or closing share price on the ex-divided date and reflect cumulative returns over the relevant time periods shown and are not annualised returns.
TOTAL RETURN 2018 YTD OCT 2018 LTM THREE YEAR FIVE YEAR SINCE INCEPTION
NET ASSET VALUE USD / GBP 6.6% / 13.0% 10.5% / 14.9% 38.1% / 67.3% 72.4% / 117.0% 120.2% / 253.1%
SHARE PRICE USD / GBP 1.8% / 7.8% 7.8% / 12.1% 39.0% / 68.4% 88.6% / 137.4% 78.4% / 186.1%
Strong NAV and share price performance over the short, medium and long term

20
NB PRIVATE EQUITY PARTNERS INVESTOR UPDATE
DIVIDENDS AND CAPITAL POSITIONDividends strongly covered by cash distributions and yield from the income portfolio
Note: See endnote #2 for important information related to the dividend. Total yield (inclusive of PIK interest) represents the return (IRR) from this reporting period to the maturity of the investment.As of 31 October 2018.1. Unfunded commitments are adjusted for funds past their investment period (except for reserves which may be called) and amounts which NBPE has the right to terminate if it so chooses.2. Based on the company’s most recent dividend and the London Stock Exchange closing share price of £10.85 on 31 October 2018 and the restated 31 October 2018 NAV of $18.05 (£14.14) per share.
DIVIDENDS
$0.00
$1.00
$2.00
$3.00
$4.00
$5.00
$6.00
2017 DISTRIBUTIONS YIELD FROMINCOME PORTFOLIO
ANNUALISEDDIVIDEND
$ per Share
$0.56
CASH POSITION
$150.3 million of cash & available credit facility
UNFUNDED COMMITMENTS
$50.1 million of adjusted unfunded commitments
COMMITMENT COVERAGE
300% adjusted commitment coverage
4.0% YIELD ON SHARE PRICE / 3.1% ON NAV2
CAPITAL POSITION1
$0.20
$5.18

21
NB PRIVATE EQUITY PARTNERS INVESTOR UPDATE
£8.00
£8.50
£9.00
£9.50
£10.00
£10.50
£11.00
£11.50
$8
$10
$12
$14
$16
$18
$20
$22
31-Oct-17 30-Apr-18 31-Oct-18
Share Price (USD) NAV per Share NAV per Share (Including Dividends) Share Price (GBP)
NAV & SHARE PRICE DEVELOPMENT
Note: Based on London Stock Exchange price and volume data. Share data as of 30 November 2018. USD share price based on daily close GBP/USD FX rate.
NBPE NAV & SHARE PRICE DEVELOPMENT AND TRADING VOLUME (OCT 2017 – NOV 2018)
$0.25 Dividend Paid on 28 February 2018
On a total return basis, including dividends, NAV per Share increased 10.5% on an LTM basis as of 31 October 2018
0100200300400Shares (‘000)
$0.28 Dividend Paid on 31 August 2018

22
UPDATE ON STRATEGIC ACTIONS

23
NB PRIVATE EQUITY PARTNERS INVESTOR UPDATE
ONGOING STRATEGIC ACTIONS
De-listing from Euronext announced and expected to take effect on 20 December 2018
Evaluating director candidates and in process to add two new independent directors to the Board
The board continues to have discussions around share buybacks
Secondary sale process of certain fund interests is ongoing

24
APPENDIX
25
NB PRIVATE EQUITY PARTNERS INVESTOR UPDATE
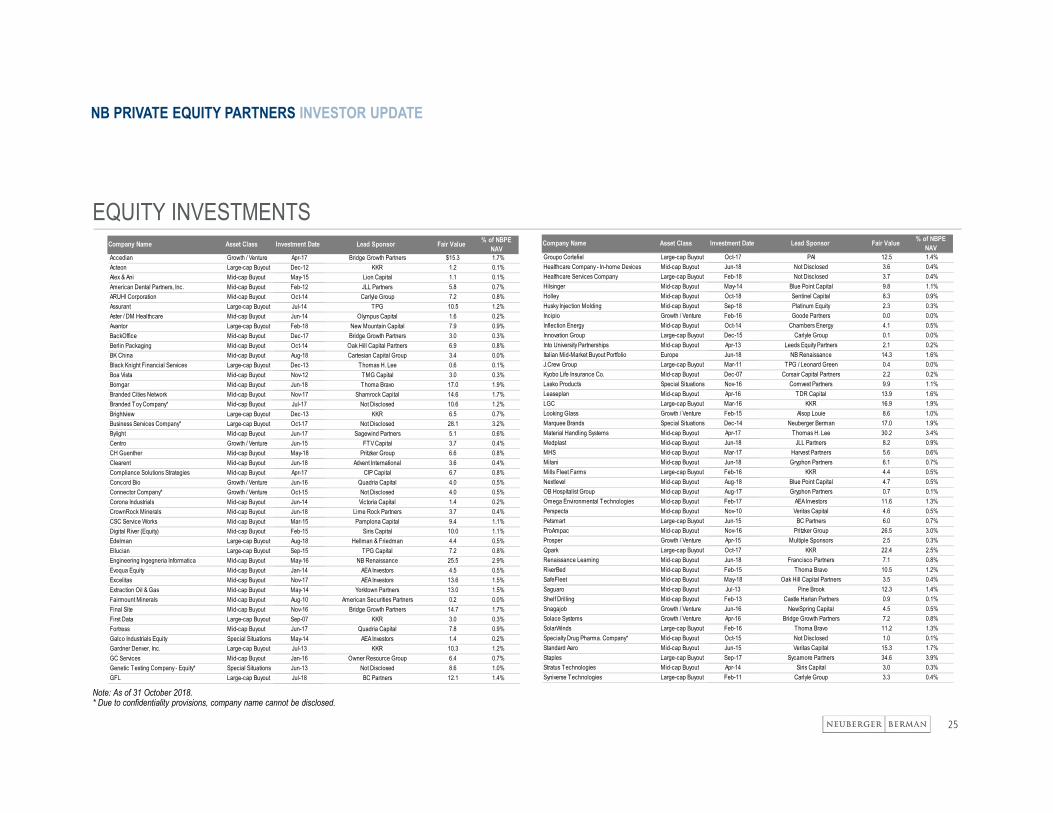
EQUITY INVESTMENTS
Note: As of 31 October 2018.* Due to confidentiality provisions, company name cannot be disclosed.
Company Name Asset Class Investment Date Lead Sponsor Fair Value % of NBPE NAV
Company Name Asset Class Investment Date Lead Sponsor Fair Value % of NBPE NAV
Accedian Growth / Venture Apr-17 Bridge Growth Partners $15.3 1.7%Acteon Large-cap Buyout Dec-12 KKR 1.2 0.1%Alex & Ani Mid-cap Buyout May-15 Lion Capital 1.1 0.1%American Dental Partners, Inc. Mid-cap Buyout Feb-12 JLL Partners 5.8 0.7%ARUHI Corporation Mid-cap Buyout Oct-14 Carlyle Group 7.2 0.8%Assurant Large-cap Buyout Jul-14 TPG 10.5 1.2%Aster / DM Healthcare Mid-cap Buyout Jun-14 Olympus Capital 1.6 0.2%Avantor Large-cap Buyout Feb-18 New Mountain Capital 7.9 0.9%BackOffice Mid-cap Buyout Dec-17 Bridge Growth Partners 3.0 0.3%Berlin Packaging Mid-cap Buyout Oct-14 Oak Hill Capital Partners 6.9 0.8%BK China Mid-cap Buyout Aug-18 Cartesian Capital Group 3.4 0.0%Black Knight Financial Services Large-cap Buyout Dec-13 Thomas H. Lee 0.6 0.1%Boa Vista Mid-cap Buyout Nov-12 TMG Capital 3.0 0.3%Bomgar Mid-cap Buyout Jun-18 Thoma Bravo 17.0 1.9%Branded Cities Network Mid-cap Buyout Nov-17 Shamrock Capital 14.6 1.7%Branded Toy Company* Mid-cap Buyout Jul-17 Not Disclosed 10.6 1.2%Brightview Large-cap Buyout Dec-13 KKR 6.5 0.7%Business Services Company* Large-cap Buyout Oct-17 Not Disclosed 28.1 3.2%Bylight Mid-cap Buyout Jun-17 Sagewind Partners 5.1 0.6%Centro Growth / Venture Jun-15 FTV Capital 3.7 0.4%CH Guenther Mid-cap Buyout May-18 Pritzker Group 6.6 0.8%Clearent Mid-cap Buyout Jun-18 Advent International 3.6 0.4%Compliance Solutions Strategies Mid-cap Buyout Apr-17 CIP Capital 6.7 0.8%Concord Bio Growth / Venture Jun-16 Quadria Capital 4.0 0.5%Connector Company* Growth / Venture Oct-15 Not Disclosed 4.0 0.5%Corona Industrials Mid-cap Buyout Jun-14 Victoria Capital 1.4 0.2%CrownRock Minerals Mid-cap Buyout Jun-18 Lime Rock Partners 3.7 0.4%CSC Service Works Mid-cap Buyout Mar-15 Pamplona Capital 9.4 1.1%Digital River (Equity) Mid-cap Buyout Feb-15 Siris Capital 10.0 1.1%Edelman Large-cap Buyout Aug-18 Hellman & Friedman 4.4 0.5%Ellucian Large-cap Buyout Sep-15 TPG Capital 7.2 0.8%Engineering Ingegneria Informatica Mid-cap Buyout May-16 NB Renaissance 25.5 2.9%Evoqua Equity Mid-cap Buyout Jan-14 AEA Investors 4.5 0.5%Excelitas Mid-cap Buyout Nov-17 AEA Investors 13.6 1.5%Extraction Oil & Gas Mid-cap Buyout May-14 Yorktown Partners 13.0 1.5%Fairmount Minerals Mid-cap Buyout Aug-10 American Securities Partners 0.2 0.0%Final Site Mid-cap Buyout Nov-16 Bridge Growth Partners 14.7 1.7%First Data Large-cap Buyout Sep-07 KKR 3.0 0.3%Fortress Mid-cap Buyout Jun-17 Quadria Capital 7.8 0.9%Galco Industrials Equity Special Situations May-14 AEA Investors 1.4 0.2%Gardner Denver, Inc. Large-cap Buyout Jul-13 KKR 10.3 1.2%GC Services Mid-cap Buyout Jan-16 Owner Resource Group 6.4 0.7%Genetic Testing Company - Equity* Special Situations Jun-13 Not Disclosed 8.6 1.0%GFL Large-cap Buyout Jul-18 BC Partners 12.1 1.4%
Groupo Cortefiel Large-cap Buyout Oct-17 PAI 12.5 1.4%Healthcare Company - In-home Devices Mid-cap Buyout Jun-18 Not Disclosed 3.6 0.4%Healthcare Services Company Large-cap Buyout Feb-18 Not Disclosed 3.7 0.4%Hilsinger Mid-cap Buyout May-14 Blue Point Capital 9.8 1.1%Holley Mid-cap Buyout Oct-18 Sentinel Capital 8.3 0.9%Husky Injection Molding Mid-cap Buyout Sep-18 Platinum Equity 2.3 0.3%Incipio Growth / Venture Feb-16 Goode Partners 0.0 0.0%Inflection Energy Mid-cap Buyout Oct-14 Chambers Energy 4.1 0.5%Innovation Group Large-cap Buyout Dec-15 Carlyle Group 0.1 0.0%Into University Partnerships Mid-cap Buyout Apr-13 Leeds Equity Partners 2.1 0.2%Italian Mid-Market Buyout Portfolio Europe Jun-18 NB Renaissance 14.3 1.6%J.Crew Group Large-cap Buyout Mar-11 TPG / Leonard Green 0.4 0.0%Kyobo Life Insurance Co. Mid-cap Buyout Dec-07 Corsair Capital Partners 2.2 0.2%Lasko Products Special Situations Nov-16 Comvest Partners 9.9 1.1%Leaseplan Mid-cap Buyout Apr-16 TDR Capital 13.9 1.6%LGC Large-cap Buyout Mar-16 KKR 16.9 1.9%Looking Glass Growth / Venture Feb-15 Alsop Louie 8.6 1.0%Marquee Brands Special Situations Dec-14 Neuberger Berman 17.0 1.9%Material Handling Systems Mid-cap Buyout Apr-17 Thomas H. Lee 30.2 3.4%Medplast Mid-cap Buyout Jun-18 JLL Partners 8.2 0.9%MHS Mid-cap Buyout Mar-17 Harvest Partners 5.6 0.6%Milani Mid-cap Buyout Jun-18 Gryphon Partners 6.1 0.7%Mills Fleet Farms Large-cap Buyout Feb-16 KKR 4.4 0.5%Nextlevel Mid-cap Buyout Aug-18 Blue Point Capital 4.7 0.5%OB Hospitalist Group Mid-cap Buyout Aug-17 Gryphon Partners 0.7 0.1%Omega Environmental Technologies Mid-cap Buyout Feb-17 AEA Investors 11.6 1.3%Perspecta Mid-cap Buyout Nov-10 Veritas Capital 4.6 0.5%Petsmart Large-cap Buyout Jun-15 BC Partners 6.0 0.7%ProAmpac Mid-cap Buyout Nov-16 Pritzker Group 26.5 3.0%Prosper Growth / Venture Apr-15 Multiple Sponsors 2.5 0.3%Qpark Large-cap Buyout Oct-17 KKR 22.4 2.5%Renaissance Learning Mid-cap Buyout Jun-18 Francisco Partners 7.1 0.8%RiverBed Mid-cap Buyout Feb-15 Thoma Bravo 10.5 1.2%SafeFleet Mid-cap Buyout May-18 Oak Hill Capital Partners 3.5 0.4%Saguaro Mid-cap Buyout Jul-13 Pine Brook 12.3 1.4%Shelf Drilling Mid-cap Buyout Feb-13 Castle Harlan Partners 0.9 0.1%Snagajob Growth / Venture Jun-16 NewSpring Capital 4.5 0.5%Solace Systems Growth / Venture Apr-16 Bridge Growth Partners 7.2 0.8%SolarWinds Large-cap Buyout Feb-16 Thoma Bravo 11.2 1.3%Specialty Drug Pharma. Company* Mid-cap Buyout Oct-15 Not Disclosed 1.0 0.1%Standard Aero Mid-cap Buyout Jun-15 Veritas Capital 15.3 1.7%Staples Large-cap Buyout Sep-17 Sycamore Partners 34.6 3.9%Stratus Technologies Mid-cap Buyout Apr-14 Siris Capital 3.0 0.3%Syniverse Technologies Large-cap Buyout Feb-11 Carlyle Group 3.3 0.4%

26
NB PRIVATE EQUITY PARTNERS INVESTOR UPDATE
EQUITY INVESTMENTS
Note: As of 31 October 2018.* Due to confidentiality provisions, company name cannot be disclosed.
Company Name Asset Class Investment Date Lead Sponsor Fair Value % of NBPE NAV
Taylor Precision Products Mid-cap Buyout Jul-12 Centre Partners 1.2 0.1%Technology Company (Encryption App)* Growth / Venture Aug-14 Not Disclosed 0.4 0.0%Telxius Large-cap Buyout Oct-17 KKR 23.4 2.7%Undisclosed Consumer Technology Company Growth / Venture Jul-18 Not Disclosed 5.7 0.6%Uniasselvi Mid-cap Buyout Jun-18 Carlyle Group 8.8 1.0%Univar Large-cap Buyout Nov-10 Clayton, Dublier & Rice 0.3 0.0%USI Large-cap Buyout Jun-17 KKR 26.0 3.0%Velocidi Growth / Venture Dec-16 Pilot Growth 2.0 0.2%Verifone Large-cap Buyout Aug-18 Francisco Partners 6.7 0.8%Vertiv Special Situations Nov-16 Platinum Equity 6.7 0.8%West Marine Mid-cap Buyout Sep-17 Monomoy Capital 7.9 0.9%Wind River Environmental Mid-cap Buyout Apr-17 Gryphon Partners 5.9 0.7%ZPG Large-cap Buyout Jul-18 Silver Lake Partners 7.3 0.8%Net Other Assets, incl. Escrow / (Liabilities) ($15.2) n.a.Total Equity Co-investment Portfolio $800.3 92.2%

27
NB PRIVATE EQUITY PARTNERS INVESTOR UPDATE
INCOME INVESTMENTS
Note: As of 31 October 2018.1. See endnote #3 for important information on the income investment portfolio.* Due to confidentiality provisions, company name cannot be disclosed.
Investment Name Security Details Investment Date Maturity Date Fair Value Cash + PIK Coupon
Cash Yield
Total Est. YTM1
Corporate Private Debt Investments2017Epic Insurance Second Lien (L+9.25% Cash, 1% L Floor, 3% OID) Sep-17 Sep-25 3.4 11.8% 12.3% 13.4%Carestream Dental Second Lien (L+8.0% Cash, 1% L Floor, 3% OID) Sep-17 Sep-25 9.3 10.6% 10.8% 11.5%OB Hospitalist Second Lien (L+8.5% Cash, 1% L Floor, 2% OID) Aug-17 Aug-25 3.5 11.1% 12.5% 14.5%Dubois Chemical Second lien (L+8.00% Cash, 1% L Floor, 1% OID) Mar-17 Mar-25 9.0 10.6% 10.7% 11.3%Blue Nile First Lien (L+6.50% Cash, 1% L Floor, 3% OID) Mar-17 Feb-23 3.3 9.1% 9.5% 11.0%Optiv Second Lien (L+7.25%, 1% Floor, 0.5% OID) Feb-17 Feb-25 3.6 9.8% 10.1% 11.0%2016ProAmpac Second Lien (L+8.50%, 1% L Floor) Nov-16 Oct-24 6.1 11.1% 11.0% 11.4%2015Schumacher Group Second lien (L+8.5% Cash, 1.0% L Floor, 1% OID) Oct-15 Oct-23 9.7 11.1% 11.1% 11.9%Digital River Debt First lien (L+5.75% Cash, 1.0% L Floor, 1% OID) Jan-15 Feb-21 1.0 8.3% 8.8% 11.4%Digital River Debt Second lien (L+11.0% Cash, 1.0% L Floor, 1% OID) Jan-15 Feb-22 0.9 13.6% 15.7% 20.8%2014Central Security Group Second lien (L+9.0% Cash, 1% L Floor, 5% OID) Nov-14 Oct-21 5.9 11.6% 11.9% 13.3%Galco Industrial Electronics Sr. sub notes (10.75% Cash, 1.25% PIK, 1.5% OID) May-14 May-21 5.4 12.0% 10.1% 11.8%Total Corporate Private Debt Investments Fair Value $61.1 10.9% 7.9% 12.5%Total Credit Opportunities Investments $77.3 12.1% 5.1% 16.2%Total Small Business Loan Programs $2.7 N/A N/A N/ATotal Healthcare Credit Investments Fair Value $1.5 10.5% 10.4% N/MTotal Income Portfolio Fair Value $142.6 9.2% 6.8% 13.8%

28
NB PRIVATE EQUITY PARTNERS INVESTOR UPDATE
TRADING INFORMATION
Trading Symbol: Class A Ordinary Shares: NBPE
Exchanges: London Stock Exchange& Euronext Amsterdam
Traded Currency: GBP (LSE); USD (Euronext); USD (LSE)
Bloomberg: NBPE NA, NBPE LN, NBPU LN
Reuters: NBPE.AS, NBPE.L, NBPU.L
ISIN: GG00B1ZBD492
COMMON: 030991001
Trading Symbol: 2022 ZDPs: NBPP
Exchange:London Stock Exchange
Base Currency: GBP
Bloomberg: NBPP:LN
ISIN: GG00BD0FRW63
SEDOL: BD0FRW6
Gross Redemption Yield at Issuance: 4.0%
Share Life: 30 September 2022
Final Capital Entitlement: 126.74p
Trading Symbol: 2024 ZDPs: NBPS
Exchange:London Stock Exchange
Base Currency: GBP
Bloomberg: NBPS:LN
ISIN: GG00BD96PR19
SEDOL: BD96PR1
Gross Redemption Yield at Issuance: 4.25%
Share Life: 30 October 2024
Final Capital Entitlement: 130.63p

29
NB PRIVATE EQUITY PARTNERS INVESTOR UPDATE
CONTACT INFORMATIONRegistered Office: NB Private Equity Partners Limited
P.O. Box 225Heritage Hall, Le Marchant StreetSt. Peter Port, Guernsey GY1 4HYChannel IslandsTel: +44.(0).1481.716.000
Investment Manager: NB Alternatives Advisers LLC325 N. Saint Paul StreetSuite 4900Dallas, TX 75201United States of America
Investor Relations: Web: www.nbprivateequitypartners.comEmail: [email protected]: +1.214.647.9593
Media Relations: Kaso Legg CommunicationsCharles GormanTel: +44.20.3137.7823Email: [email protected]
Corporate Brokers: Stifel NicolausNeil WinwardTel: +44.20.7710.7600Jefferies International LimitedGary Gould/Stuart KleinTel: +44.20.7029.8766
Research Analysts: Stifel Nicolaus – Iain ScoullerEmail: [email protected] – Matthew HoseEmail: [email protected]. Morgan Cazenove – Christopher BrownEmail: [email protected] Genuity – Alan BrierleyEmail: [email protected] – Joachim KelmentEmail: [email protected] Capital – Conor FinnEmail: [email protected] – Charles Cade Email: [email protected] – Simon ElliottEmail: [email protected] – Monica TepesEmail: [email protected] Fitzgerald – Markuz JaffeEmail: [email protected] Gordon – Charles MurphyEmail: [email protected]

30
NB PRIVATE EQUITY PARTNERS INVESTOR UPDATE
ENDNOTES
1. The diversification analysis by geography, industry and vintage is based on the fair value of underlying fund investments and direct/co-investments; the diversification analysis for company size is based on the fair value ofthe underlying direct/co-investments and the fair value of funds with a focus on the company size described. Determinations regarding geography, industry, vintage and company size represent the Investment Manager’sestimates. Accordingly, the actual diversification of our investment portfolio and the diversification of our investment portfolio on an ongoing basis may vary from the foregoing information. For the NB Alternatives Direct Co-investment Program and the NB Healthcare Credit Investment Program commitments, total exposure only reflects the funded investments to date. Unfunded amounts and unfunded percentages within each of theseprograms are excluded from the analysis, as capital deployment is opportunistic and cannot be accurately forecast at this time.
2. Guidance regarding NBPE’s future portfolio and performance is a target only and not a profit forecast. There can be no assurance that this target will be met or that the Company will make any future distributionswhatsoever. Any such changes will be notified to shareholders through a regulatory information service. NBPE’s Board of Directors will continue to evaluate the Company’s financial position, annual dividend target and thetiming of future dividends. Future dividend payments will be announced by NBPE after the Board of Directors have completed such evaluation.
3. Yield to maturities represent the return (IRR) from this reporting period to maturity of the investment. Includes a portfolio of small business loans at an interest rate at least at the rate stated above but not included in theyield calculations.
4. Actual unfunded commitments are $253.4 million at 31 October 2018, corresponding to actual over commitment of $103.1 million and an actual commitment coverage ratio of 59.3%. Unfunded commitments are adjustedfor funds past their investment period (except for reserves which may be called) and amounts which NBPE has the right to terminate if it so chooses.

31
NB PRIVATE EQUITY PARTNERS INVESTOR UPDATE
LEGAL DISCLAIMERTHIS DOCUMENT, ANY PRESENTATION MADE IN CONJUNCTION WITH THIS DOCUMENT AND ANY ACCOMPANYING MATERIALS (THE "INVESTOR MATERIALS") ARE STRICTLY CONFIDENTIAL AND MAY NOTBE COPIED, DISTRIBUTED, PUBLISHED OR REPRODUCED IN WHOLE OR IN PART, OR DISCLOSED OR DISTRIBUTED BY RECIPIENTS TO ANY OTHER PERSON. ANY RECIPIENT OF THE INVESTORMATERIALS AGREES TO KEEP PERMANENTLY CONFIDENTIAL ALL INFORMATION THEREIN NOT ALREADY IN THE PUBLIC DOMAIN.The Investor Materials are not for release, publication or distribution (directly or indirectly) in or into the United States, Canada, Australia, Japan, the Republic of South Africa or to any "US person" as defined in Regulation Sunder the United States Securities Act of 1933, as amended (the "Securities Act") or into any other jurisdiction where applicable laws prohibit their release, distribution or publication. They do not constitute an offer of securitiesfor sale anywhere in the world, including in or into the United States, Canada, Australia Japan or the Republic of South Africa. No recipient may distribute, or make available, the Investor Materials(directly or indirectly) to anyother person. Recipients of the Investor Materials should inform themselves about and observe any applicable legal requirements in their jurisdictions. In particular, the distribution of the Investor Materials may in certainjurisdictions be restricted by law. Accordingly, recipients represent that they are able to receive the Investor Materials without contravention of any applicable legal or regulatory restrictions in the jurisdiction in which they resideor conduct business.The Investor Materials have been prepared by NB Private Equity Partners Limited ("NBPE") and NB Alternatives Advisers LLC (the "Investment Manager"). No member of the Neuberger Berman Group nor any of theirrespective directors, officers, employees, advisors, representatives, or other agents makes or has been authorised to make any representation or warranties (express or implied) in relation to NBPE or as to the truth, accuracyor completeness of the Investor Materials, or any other written or oral statement provided, or any information on which the Investor Materials is based (including, without limitation, information obtained from third parties) or anyother information or representations supplied or made in connection with the Investor Materials or as to the reasonableness of any projections which the Investor Materials contain. The aforementioned persons disclaim anyand all responsibility and liability whatsoever, whether arising in tort, contract or otherwise, for any errors, omissions or inaccuracies in such information or opinions or for any loss, cost or damage suffered or incurredhowsoever arising, directly or indirectly, from any use of the Investor Materials or their contents by the recipient or any other person or otherwise in connection with the Investor Materials. Persons receiving or reviewing theInvestor Materials must make all trading and investment decisions in reliance on their own judgement. No statement in the Investor Materials is intended to be nor may be construed as a profit forecast.In particular, no representation or warranty is given as to the achievement or reasonableness of, and no reliance should be placed on any projections, targets, estimates or forecasts contained in the Investor Materials andnothing in the Investor Materials is or should be relied on as a promise or representation as to the future. The name "Neuberger Berman" is used interchangeably throughout these materials for a number of entities that arepart of, or are associated with, the Neuberger Berman Group and when used in this notice includes all such entities.This Investor Materials do not constitute a prospectus or offering memorandum or an offer in respect of any securities and are not intended to provide the basis for any decision in respect of NBPE or other evaluation of anysecurities of NBPE or any other entity and should not be considered as a recommendation that any investor should subscribe for or purchase any such securities or engage in any investment activity (as defined in theFinancial Services and Markets Act 2000 (“FSMA”)) in any jurisdiction nor shall they, or any part of them, or the fact of their distribution in any manner whatsoever form the basis of, or be relied on in connection with, anycontract or investment decision whatsoever, in any jurisdiction. Neither the issue of the Investor Materials nor any part of their contents constitutes an offer to sell or invitation to purchase any securities of NBPE or any otherentity or any persons holding securities of NBPE and no information set out in the Investor Materials or referred to in other written or oral information is intended to form the basis of any contract of sale, investment decision orany decision to purchase any securities referred to in it.The information contained in the Investor Materials is given as at the date of its publication (unless otherwise marked) and is subject to updating, revision and amendment. No reliance may be placed for any purposewhatsoever on the information of opinions contained in the Investor Materials or on their completeness, accuracy or fairness. The contents of the Investor Materials have not been approved by any competent regulatory orsupervisory authority. The Investor Materials are not intended to be complete or to constitute all of the information necessary to adequately evaluate the consequences of investing in NBPE. The contents of the InvestorMaterials have not been verified and the Investor Materials have not been approved (in whole or any part) by any competent regulatory or supervisory authority.The Investor Materials are made available for information purposes only. The Investor Materials, which are not a prospectus or listing particulars or an admission document, do not contain any representations, do notconstitute or form part of any offer or invitation to sell or transfer, or to underwrite, subscribe for or acquire, any shares or other securities, and do not constitute or form any part of any solicitation of any such offer or invitation,nor shall they are or any part of them or the fact of their distribution form the basis of or be relied upon in connection with any contract therefore, and do not constitute a recommendation regarding the securities of NBPE.Neither NBPE nor Neuberger Berman gives any undertaking to provide the recipient with access to any additional information, or to update the Investor Materials or any additional information, or to correct any inaccuracies inthem which may become apparent and the distribution of the Investor Materials shall not be deemed to be any form of commitment on the part of NBPE, the Investment Manager or Neuberger Berman to proceed with anytransaction.

32
NB PRIVATE EQUITY PARTNERS INVESTOR UPDATE
LEGAL DISCLAIMERTHE PROMOTION OF NBPE AND THE DISTRIBUTION OF THE INVESTOR MATERIALS IN THE UNITED KINGDOM IS RESTRICTED BY LAW. ACCORDINGLY, THIS COMMUNICATION IS DIRECTED ONLY AT (I) PERSONS OUTSIDE THE UNITED KINGDOM TO WHOM IT IS LAWFUL TO COMMUNICATE TO, OR (II) PERSONS HAVING PROFESSIONAL EXPERIENCE IN MATTERS RELATING TO INVESTMENTS WHO FALL WITHIN THE DEFINITION OF "INVESTMENT PROFESSIONALS" IN ARTICLE 19(5) OF THE FINANCIAL SERVICES AND MARKETS ACT 2000 (FINANCIAL PROMOTION) ORDER 2005 (AS AMENDED), OR (III) HIGH NET WORTH COMPANIES, UNINCORPORATED ASSOCIATIONS AND PARTNERSHIPS AND TRUSTEES OF HIGH VALUE TRUSTS AS DESCRIBED IN ARTICLE 49(2) OF THE FINANCIAL SERVICES AND MARKETS ACT 2000 (FINANCIAL PROMOTION) ORDER 2005 (AS AMENDED); PROVIDED THAT IN THE CASE OF PERSONS FALLING INTO CATEGORIES (II) OR (III), THE COMMUNICATION IS ONLY DIRECTED AT PERSONS WHO ARE ALSO "QUALIFIED INVESTORS" AS DEFINED IN SECTION 86 OF THE FINANCIAL SERVICES AND MARKETS ACT 2000 (EACH A "RELEVANT PERSON"). ANY INVESTMENT OR INVESTMENT ACTIVITY TO WHICH THIS COMMUNICATION RELATES IS AVAILABLE ONLY TO AND WILL BE ENGAGED IN ONLY WITH SUCH RELEVANT PERSONS. PERSONS WITHIN THE UNITED KINGDOM WHO RECEIVE THIS COMMUNICATION (OTHER THAN PERSONS FALLING WITHIN (II) AND (III) ABOVE) SHOULD NOT RELY ON OR ACT UPON THIS COMMUNICATION. YOU REPRESENT AND AGREE THAT YOU ARE A RELEVANT PERSON.NBPE HAS NOT BEEN, AND HAS NO INTENTION TO BE, REGISTERED UNDER THE U.S. INVESTMENT COMPANY ACT OF 1940, AS AMENDED (THE "INVESTMENT COMPANY ACT") AND INVESTORS ARE NOT AND WILL NOT BE ENTITLED TO THE BENEFITS OF THAT ACT. THE SECURITIES DESCRIBED IN THIS DOCUMENT HAVE NOT BEEN AND WILL NOT BE REGISTERED UNDER THE SECURITIES ACT OR THE LAWS OF ANY STATE OF THE UNITED STATES. CONSEQUENTLY, SUCH SECURITIES MAY NOT BE OFFERED OR SOLD IN THE UNITED STATES OR TO U.S. PERSONS (AS SUCH TERM IS DEFINED IN REGULATION S UNDER THE SECURITIES ACT) UNLESS SUCH SECURITIES ARE REGISTERED UNDER THE SECURITIES ACT OR AN EXEMPTION FROM THE REGISTRATION REQUIREMENT OF THE SECURITIES ACT IS AVAILABLE. NO PUBLIC OFFERING OF THE SECURITIES IS BEING MADE IN THE UNITED STATES.PROSPECTIVE INVESTORS SHOULD TAKE NOTE THAT ANY SECURITIES MAY NOT BE ACQUIRED BY INVESTORS USING ASSETS OF ANY RETIREMENT PLAN OR PENSION PLAN THAT IS SUBJECT TO PART 4 OF SUBTITLE B OF TITLE I OF THE UNITED STATES EMPLOYEE RETIREMENT INCOME SECURITY ACT OF 1974, AS AMENDED ("ERISA") OR SECTION 4975 OF THE UNITED STATES INTERNAL REVENUE CODE OF 1986, AS AMENDED (THE "CODE"), ENTITIES WHOSE UNDERLYING ASSETS ARE CONSIDERED TO INCLUDE "PLAN ASSETS" OF ANY SUCH RETIREMENT PLAN OR PENSION PLAN, OR ANY GOVERNMENTAL PLAN, CHURCH PLAN, NON-U.S. PLAN OR OTHER INVESTOR SUBJECT TO ANY STATE, LOCAL, NON-U.S. OR OTHER LAWS OR REGULATIONS SIMILAR TO TITLE I OR ERISA OR SECTION 4975 OF THE CODE OR THAT WOULD HAVE THE EFFECT OF THE REGULATIONS ISSUED BY THE UNITED STATES DEPARTMENT OF LABOR SET FORTH AT 29 CFR SECTION 2510.3-101, AS MODIFIED BY SECTION 3(42) OF ERISA.THE MERITS OR SUITABILITY OF ANY SECURITIES MUST BE INDEPENDENTLY DETERMINED BY THE RECIPIENT ON THE BASIS OF ITS OWN INVESTIGATION AND EVALUATION OF NBPE, THE INVESTMENT MANAGER, AND NEUBERGER BERMAN. ANY SUCH DETERMINATION SHOULD INVOLVE, AMONG OTHER THINGS, AN ASSESSMENT OF THE LEGAL, TAX, ACCOUNTING, REGULATORY, FINANCIAL, CREDIT AND OTHER RELATED ASPECTS OF THE SECURITIES. RECIPIENTS OF THIS DOCUMENT AND THE PRESENTATION ARE RECOMMENDED TO SEEK THEIR OWN INDEPENDENT LEGAL, TAX, FINANCIAL AND OTHER ADVICE AND SHOULD RELY SOLELY ON THEIR OWN JUDGMENT, REVIEW AND ANALYSIS IN EVALUATING NBPE, THE INVESTMENT MANAGER, AND NEUBERGER BERMAN, AND THEIR BUSINESS AND AFFAIRS.THIS INVESTOR MATERIALS MAY CONTAIN CERTAIN FORWARD-LOOKING STATEMENTS. FORWARD-LOOKING STATEMENTS RELATE TO EXPECTATIONS, BELIEFS, PROJECTIONS, FUTURE PLANS AND STRATEGIES, ANTICIPATED EVENTS OR TRENDS AND SIMILAR EXPRESSIONS CONCERNING MATTERS THAT ARE NOT HISTORICAL FACTS. IN SOME CASES, FORWARD-LOOKING STATEMENTS CAN BE INDENTIFIED BY TERMS SUCH AS "ANTICIPATE", BELIEVE", "COULD", "ESTIMATE", "EXPECT", "INTEND", "MAY", "PLAN", "POTENTIAL", "SHOULD", "WILL", AND "WOULD", OR THE NEGATIVE OF THOSE TERMS OR OTHER COMPARABLE TERMINOLOGY. THE FORWARD- LOOKING STATEMENTS ARE BASED ON NBPE’S AND/OR NEUBERGER BERMAN'S BELIEFS, ASSUMPTIONS AND EXPECTATIONS OF FUTURE PERFORMANCE AND MARKET DEVELOPMENTS, TAKING INTO ACCOUNT ALL INFORMATION CURRENTLY AVAILABLE AND ARE INTENDED ONLY TO ILLUSTRATE HYPOTHETICAL RESULTS UNDER THOSE BELIEFS, ASSUMPTIONS AND EXPECTATIONS (NOT ALL OF WHICH WILL BE SPECIFIED HEREIN), NOT ALL RELEVANT EVENTS OR CONDITIONS MAY HAVE BEEN CONSIDERED IN DEVELOPING SUCH BELIEFS, ASSUMPTIONS AND EXPECTATIONS. THESE BELIEFS, ASSUMPTIONS, AND EXPECTATIONS CAN CHANGE AS A RESULT OF MANY POSSIBLE EVENTS OR FACTORS, NOT ALL OF WHICH ARE KNOWN OR ARE WITHIN NBPE’S OR NEUBERGER BERMAN’S CONTROL. IF A CHANGE OCCURS, NBPE’S BUSINESS, FINANCIAL CONDITION, LIQUIDITY AND RESULTS OF OPERATIONS MAY VARY MATERIALLY FROM THOSE EXPRESSED IN FORWARD-LOOKING STATEMENTS. SOME OF THE FACTORS THAT COULD CAUSE ACTUAL RESULTS TO VARY FROM THOSE EXPRESSED IN FORWARD-LOOKING STATEMENTS, INCLUDE, BUT ARE NOT LIMITED TO: THE FACTORS DESCRIBED IN THE INVESTOR MATERIALS; THE RATE AT WHICH NBPE DEPLOYS ITS CAPITAL IN INVESTMENTS AND ACHIEVES EXPECTED RATES OF RETURN; NBPE’S AND THE INVESTMENT MANAGER’S ABILITY TO EXECUTE NBPE'S INVESTMENT STRATEGY, INCLUDING THROUGH THE IDENTIFICATION OF A SUFFICIENT NUMBER OF APPROPRIATE INVESTMENTS; THE CONTINUATION OF THE INVESTMENT MANAGER AS MANAGER OF NBPE'S INVESTMENTS, THE CONTINUED AFFILIATION WITH NEUBERGER BERMAN OF ITS KEY INVESTMENT PROFESSIONALS; NBPE’S FINANCIAL CONDITION AND LIQUIDITY; CHANGES IN THE VALUES OF OR RETURNS ON INVESTMENTS THAT THE NBPE MAKES; CHANGES IN FINANCIAL MARKETS, INTEREST RATES OR INDUSTRY, GENERAL ECONOMIC OR POLITICAL CONDITIONS; AND THE GENERAL VOLATILITY OF THE CAPITAL MARKETS AND THE MARKET PRICE OF NBPE’S SHARES.BY THEIR NATURE, FORWARD-LOOKING STATEMENTS INVOLVE KNOWN AND UNKNOWN RISKS AND UNCERTAINTIES BECAUSE THEY RELATE TO EVENTS, AND DEPEND ON CIRCUMSTANCES THAT MAY OR MAY NOT OCCUR IN THE FUTURE. FORWARD-LOOKING STATEMENTS ARE NOT GUARANTEES OF FUTURE PERFORMANCE. ANY FORWARD-LOOKING STATEMENTS ARE ONLY MADE AS AT THE DATE OF THE INVESTOR MATERIALS, AND NEITHER NBPE NOR THE INVESTMENT MANAGER ASSUMES ANY OBLIGATION TO UPDATE FORWARD-LOOKING STATEMENTS SET FORTH IN THE INVESTOR MATERIALS WHETHER AS A RESULT OF NEW INFORMATION, FUTURE EVENTS, OR OTHERWISE, EXCEPT AS REQUIRED BY LAW OR OTHER APPLICABLE REGULATION. IN LIGHT OF THESE RISKS, UNCERTAINTIES, AND ASSUMPTIONS, THE EVENTS DESCRIBED BY ANY SUCH FORWARD-LOOKING STATEMENTS MIGHT NOT OCCUR. NBPE QUALIFIES ANY AND ALL OF THEIR FORWARD-LOOKING STATEMENTS BY THESE CAUTIONARY FACTORS. PLEASE KEEP THIS CAUTIONARY NOTE IN MIND WHILE CONSIDERING THE INVESTOR MATERIALS.

33
NB PRIVATE EQUITY PARTNERS INVESTOR UPDATE
LEGAL DISCLAIMER
BY ACCEPTING AND READING THIS DOCUMENT AND/OR ATTENDING THE PRESENTATION TO WHICH THIS DOCUMENT RELATES YOU WILL BE DEEMED TO HAVE REPRESENTED, WARRANTED AND UNDERTAKEN FOR THE BENEFIT OF NBPE, THE INVESTMENT MANAGER, NEUBERGER BERMAN AND OTHERS THAT (A) YOU ARE OUTSIDE OF THE UNITED STATES AND ARE AN "INVESTMENT PROFESSIONAL" (AS DEFINED ABOVE), (B) YOU HAVE READ AND AGREE TO COMPLY WITH THE CONTENTS OF THIS NOTICE, YOU WILL KEEP THE INFORMATION IN THE INVESTOR MATERIALS AND DELIVERED DURING ANY PRESENTATION OR CONTAINTED IN ANY ACCOMPANYING DOCUMENT AND ALL INFORMATION ABOUT NEUBERGER BERMAN CONFIDENTIAL, AND WILL NOT REPRODUCE OR DISTRIBUTE, IN WHOLE OR IN PART, (DIRECTLY OR INDIRECTLY) ANY SUCH INFORMATION, UNTIL SUCH INFORMATION HAS BEEN MADE PUBLICLY AVAILABLE AND TAKE ALL REASONABLE STEPS TO PRESERVE SUCH CONFIDENTIALITY, AND (C) YOU ARE PERMITTED, IN ACCORDANCE WITH APPLICABLE LAWS, TO RECEIVE SUCH INFORMATION.NBPE IS ESTABLISHED AS A CLOSED-END INVESTMENT COMPANY IN GUERNSEY ANDTHE COMPANY IS SUBJECT TO THE NETHERLANDS FINANCIAL SUPERVISION ACT (WET OP HET FINANCIEEL TOEZICHT, "WFT"), AS A LISTED ENTITY (UITGEVENDE INSTELLING) AS DEFINED IN SECTION 1:1 OF THE WFT. ALL INVESTMENTS ARE SUBJECT TO RISK. PAST PERFORMANCE IS NOT INDICATIVE OF, OR A GUARANTEE OF, FUTURE PERFORMANCE. PROSPECTIVE INVESTORS ARE ADVISED TO SEEK EXPERT LEGAL, FINANCIAL, TAX AND OTHER PROFESSIONAL ADVICE BEFORE MAKING ANY INVESTMENT DECISION. THE VALUE OF INVESTMENTS MAY FLUCTUATE. RESULTS ACHIEVED IN THE PAST NOT INDICATIVE OF, OR A GUARANTEE OF, FUTURE RESULTS..ANY OF OUR OPINIONS EXPRESSED HEREIN ARE OUR CURRENT OPINIONS ONLY AND MAY BE SUBJECT TO CHANGE. STATEMENTS MADE HEREIN ARE AS OF THE DATE OF THIS DOCUMENT AND SHOULD NOT BE RELIED UPON AS OF ANY SUBSEQUENT DATE. PAST PERFORMANCE IS NOT INDICATIVE OF, OR A GUARANTEE OF, FUTURE PERFORMANCE.THIS DOCUMENT IS ISSUED BY NBPE WHOSE REGISTERED ADDRESS IS AT HERITAGE HALL, PO BOX 225, LE MARCHANT STREET, ST. PETER PORT, GUERNSEY GY1 4HY. NB ALTERNATIVES ADVISERS LLC IS A REGISTERED INVESTMENT ADVISER IN THE UNITED STATES. NEUBERGER BERMAN IS A REGISTERED TRADEMARK. ALL RIGHTS RESERVED. ©2018 NB ALTERNATIVES ADVISERS LLC.


