1
This report summarises and analyses the NBFC segment presented in RBI’s
“Report on Trends and Progress of Banking in India 2019-20” along with
financial performance of overall NBFC sector in FY20 and H1FY21.
Additionally, we have also analysed Q2FY21 performance of select NBFCs
and HFCs.
We have divided our report into two sections:
A) Performance of NBFC sector, and;
B) Performance of Select NBFCs and HFCs
Summary
The balance sheet size of NBFCs has decelerated due to moderate
growth in loans and advances led by weak demand and risk aversion.
NBFCs balance sheet in aggregate is around 18.8% of total SCBs balance
sheet. Of the total asset size (Rs.33.9 lakh crore) of NBFCs in FY20, 38.6%
is dominated by the government owned NBFCs. As of H1FY21, the
balance sheet of NBFC-ND-SI comprises of 86.1% share, while balance
13.9% is accounted by NBFC-D in total balance sheet size of NBFCs.
As on September 30, 2020 out of the total outstanding borrowing
of NBFC-ND-SI, around 70% is in the form of debentures and banks, while
NBFC-D have around 77.5% of the outstanding borrowings as bank
borrowings and debentures. Debentures alone account for approximately
40.0% of the outstanding borrowings of NBFC-ND-SI and 34.4% for NBFC-
D. The Industry sector has received the highest credit (53.6%) by NBFC
sector, followed by retail segment (23.3%) and services (15.8%). Within
the industrial sector, large industries segment has received 46.4% of the
credit disbursed to industrial sector.
As on August 31, 2020, the overall percentage of NBFC customers
availed the loan moratorium has been comparatively lower than banks,
while the loans outstanding under moratorium were higher as compared
with banks.
The sample set of NBFCs and HFCs has witnessed lower disbursals
and AUM growth in Q2FY21 as compared with Q2FY20 due to a cautious
approach towards fresh disbursements and weak demand compounded
by risk aversion. The rural focused NBFCs have witnessed an almost
normal disbursements and collections (supported by harvest) during
Q2FY21.
January 20, 2021 I BFSI Research
NBFCs and HFCs
witnessed lower
fresh disbursals due
to weak demand
compounded by risk
aversion; collection
efficiency improved
Contact:
Sanjay Agarwal Senior Director [email protected] +91-22- 6754 3582/500 Mob: +91 81080 07676
Saurabh Bhalerao Associate Director [email protected] +91-22-6754 3519 Mob: +91 90049 52514 Pravin Mule Research Analyst – BFSI Research [email protected] +91-22-6754 3553 Mob: +91 98192 80043
Mradul Mishra (Media Contact) [email protected] +91-22-6754 3573
Disclaimer: This report is prepared by CARE Ratings Ltd. CARE Ratings has taken utmost care to ensure accuracy and objectivity while developing this report based on information available in public domain. However, neither the accuracy nor completeness of information contained in this report is guaranteed. CARE Ratings is not responsible for any errors or omissions in analysis/inferences/views or for results obtained from the use of information contained in this report and especially states that CARE Ratings has no financial liability whatsoever to the user of this report.
BFSI Research I NBFCs and HFCs witnessed lower fresh disbursals due to weak demand compounded by risk aversion; collection efficiency improved
2
Introduction
During FY20, the NBFC sector faced headwinds in the aftermath of the IL&FS crisis in the form of erosion of confidence
among investors, rating downgrades and liquidity stress compounded by the COVID-19 pandemic. On an overall basis,
NBFCs were taking corrective actions including reducing business growth, correcting ALM profiles, reducing leverage, etc.
Further, in H1FY21, the Reserve Bank of India continued to take sequential regulatory measures to make available sufficient
liquidity to the NBFC sector. The consolidated balance sheet of NBFCs gained traction in H1FY21 after witnessing a
deceleration in FY20 due to stagnant growth in loans and advances.
RBI classifies NBFCs on the basis of:
1. Liability structure
2. Type of activities undertaken
3. Systematic importance
In the first category, NBFCs are further divided into:
- NBFCs-D - Authorised to accept and hold public deposits.
- NBFCs-ND - Non-deposit taking NBFCs which are authorised to accept public deposits but raise debt from market and banks.
Among the NBFCs-ND, those with an asset size of Rs.500 crore or more are classified as systemically important NBFCs
(NBFCs-ND-SI). There were 64 NBFCs-D and 292 NBFCs-ND-SI as on July 16, 2020 as compared with 88 and 263 as of March
2019.
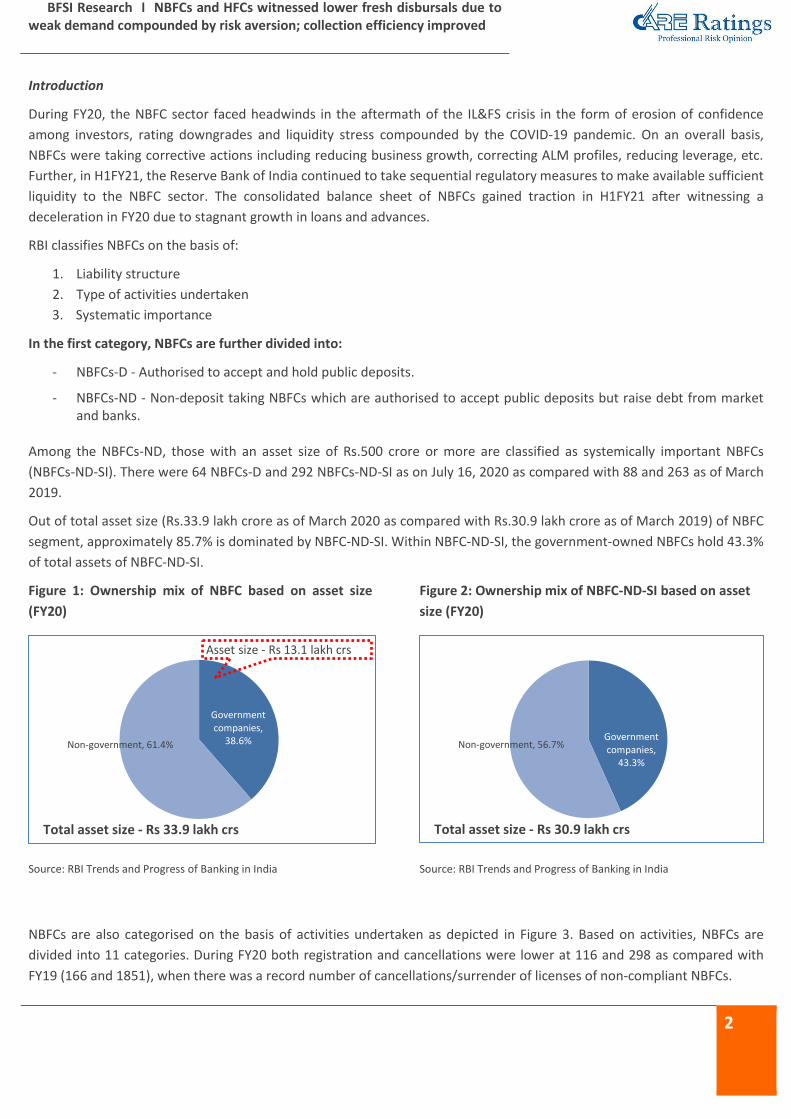
Out of total asset size (Rs.33.9 lakh crore as of March 2020 as compared with Rs.30.9 lakh crore as of March 2019) of NBFC
segment, approximately 85.7% is dominated by NBFC-ND-SI. Within NBFC-ND-SI, the government-owned NBFCs hold 43.3%
of total assets of NBFC-ND-SI.
Figure 1: Ownership mix of NBFC based on asset size
(FY20)
Source: RBI Trends and Progress of Banking in India
Figure 2: Ownership mix of NBFC-ND-SI based on asset
size (FY20)
Source: RBI Trends and Progress of Banking in India
NBFCs are also categorised on the basis of activities undertaken as depicted in Figure 3. Based on activities, NBFCs are
divided into 11 categories. During FY20 both registration and cancellations were lower at 116 and 298 as compared with
FY19 (166 and 1851), when there was a record number of cancellations/surrender of licenses of non-compliant NBFCs.
Government companies,
38.6%
Asset size - Rs 13.1 lakh crs
Total asset size - Rs 33.9 lakh crs
Non-government, 61.4%
Government companies,
43.3%
Total asset size - Rs 30.9 lakh crs
Non-government, 56.7%

BFSI Research I NBFCs and HFCs witnessed lower fresh disbursals due to weak demand compounded by risk aversion; collection efficiency improved
3
Figure 3: Classifications of NBFCs by Activity
Type of NBFC Activity
Investment and Credit Company (ICC) Lending and investment.
NBFC-Infrastructure Finance Company (NBFC-IFC)
Provision of infrastructure loans.
NBFC-Systemically Important Core Investment Company (CIC-ND-SI)
Investment in equity shares, preference shares, debt or loans in group companies.
NBFC-Infrastructure Debt Fund (NBFC-IDF) Facilitation of flow of long-term debt into infrastructure projects.
NBFC-Micro Finance Institution (NBFC-MFI) Credit to economically dis-advantaged groups.
NBFC-Factor Acquisition of receivables of an assignor or extending loans against the security interest of the receivables at a discount.
NBFC-Non-Operative Financial Holding Company (NBFC-NOFHC)
Facilitation of promoters/ promoter groups in setting up new banks.
Mortgage Guarantee Company (MGC) Undertaking of mortgage guarantee business.
NBFC-Account Aggregator (NBFC-AA) Collecting and providing information about a customer’s financial assets in a consolidated, organised and retrievable manner to the customer or others as specified by the customer.
NBFC–Peer to Peer Lending Platform (NBFC-P2P)
Providing an online platform to bring lenders and borrowers together to help mobilise funds.
Housing Finance Companies (HFC) Financing for housing.
Source: RBI Trends and Progress of Banking in India Note: Investment and Credit Company (NBFC-ICC) is a mix of asset finance companies (AFCs), loan companies (LCs) and investment companies (ICs)
Figure 4: Loan Moratorium availed by customers of NBFC sector (As on August 31, 2020)
Source: RBI Trends and Progress of Banking in India
Figure 5: Loan Moratorium availed by customers of NBFC sector (As on April 30, 2020)
Source: RBI’s Financial Stability Report
As on August 31, 2020, the overall percentage of NBFC customers availed the loan moratorium has been comparatively
lower than banks, while the loans outstanding under moratorium were higher as compared with banks. Among the sectors
MSME segment under NBFCs availed the scheme most. ~69.0% of MSME customers have availed the moratorium as of
August 30, 2020 as compared with ~61.0% as of April 30, 2020. Other categories such as individuals, witnessed a reduction
% of total
customers
% of total
outstanding
% of total
customers
% of total
outstanding
% of total
customers
% of total
outstanding
% of total
customers
% of total
outstanding
% of total
customers
% of total
outstanding
NBFCs 42.7 37.2 68.8 67.0 23.1 56.5 50.2 33.2 26.6 44.9
SCBs 18.0 30.4 77.2 68.1 43.7 33.9 35.6 39.1 43.8 37.9
System 31.3 34.3 77.5 69.3 42.6 41.0 45.4 42.1 45.6 40.4
Corporate MSME Individual Others Total
% of total
customers
% of total
outstanding
% of total
customers
% of total
outstanding
% of total
customers
% of total
outstanding
% of total
customers
% of total
outstanding
% of total
customers
% of total
outstanding
NBFCs 39.7 56.2 60.7 61.1 32.5 45.9 37.3 41.4 29.0 49.0
SCBs 24.7 39.1 43.1 65.3 52.1 56.2 45.7 55.7 55.1 50.0
System 30.8 41.9 45.8 65.0 50.4 55.3 45.7 54.6 48.6 50.1
Corporate MSME Individual Others Total
BFSI Research I NBFCs and HFCs witnessed lower fresh disbursals due to weak demand compounded by risk aversion; collection efficiency improved
4
in the share of customers 32.5% as of April 30, 2020 to 23.1% as of August 30, 2020, while, the corporate segment has
registered a fall in outstanding amount of loans under moratorium between April 2020 and August 2020.
Section A – Performance of NBFC sector
The analysis has been divided into the following components:
1. Balance sheet analysis
2. Financial performance
3. Sectoral credit deployment of the NBFC sector
1. Balance Sheet Analysis
Composition of liabilities: During the last two years, liabilities of the NBFC sector grew at CAGR of 13.8%, i.e., from Rs.26.2
lakh crore in FY18 to Rs.33.9 lakh crore in FY20. The growth in liabilities slowed to 5.8% (Rs.35.8 lakh crore) in H1FY21. Post
the NBFC crisis, the focus shifted from growth to stability, liquidity and concentrated on managing their ALM (asset-liability
management). However, larger NBFCs were able to borrow from debt market based on their scale and parentage. Specific
measures taken by RBI and Government (e.g. special liquidity scheme for NBFCs/HFCs) enabled these entities to combat
liquidity constraints and restricted market access.
On the supply side, sources of funds, especially for small and mid-sized NBFCs, were impacted due to reduced risk appetite
of banks for low rated and unrated exposures. On the demand side, the prevailing economic contraction contributed to the
subdued credit offtake.
Figure 6: Liabilities of the NBFC sector (Rs. lakh crore)
Particulars FY18 FY19 FY20 y-o-y growth %
FY19 y-o-y growth %
FY20 H1FY21
YTD growth % (H1FY21 over
FY20)
Share Capital and Reserves 6.1 7.0 7.9 14.1% 13.4% 8.8 12.0%
Public Borrowings 0.3 0.4 0.5 31.7% 24.9% 0.6 11.3%
Total Borrowings 18.1 21.1 16.5 - - 16.5 0.03%
Secured Borrowings 10.0 11.6 7.1 - - 7.3 -
Unsecured Borrowings 8.1 9.5 9.4 - - 9.1 -
Current Liabilities 1.6 2.4 9.0 - - 10.0 -
Total 26.2 30.9 33.9 17.9% 9.8% 35.8 5.8% Source: RBI Trends and Progress of Banking in India
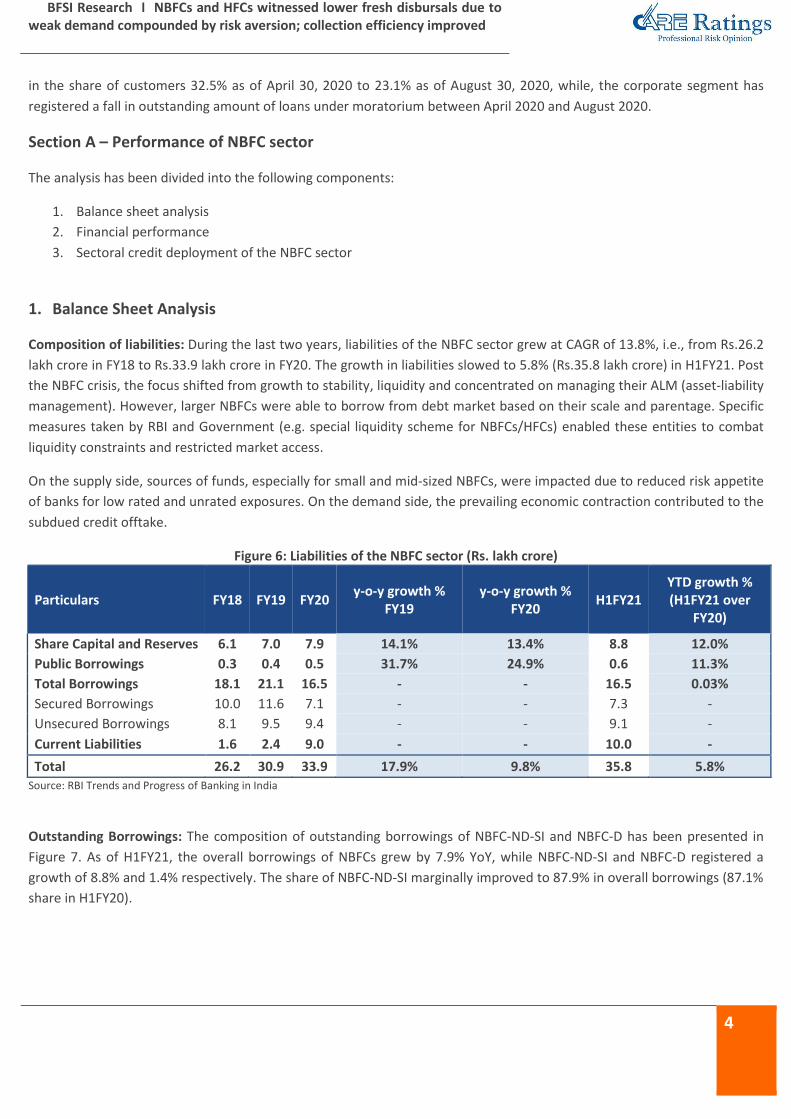
Outstanding Borrowings: The composition of outstanding borrowings of NBFC-ND-SI and NBFC-D has been presented in
Figure 7. As of H1FY21, the overall borrowings of NBFCs grew by 7.9% YoY, while NBFC-ND-SI and NBFC-D registered a
growth of 8.8% and 1.4% respectively. The share of NBFC-ND-SI marginally improved to 87.9% in overall borrowings (87.1%
share in H1FY20).
BFSI Research I NBFCs and HFCs witnessed lower fresh disbursals due to weak demand compounded by risk aversion; collection efficiency improved
5
Figure 7: Composition of outstanding borrowings for NBFCs (Rs. lakh crore, % share)
Source: RBI Trends and Progress of Banking in India; Note: others include public deposit
From the above figure, we can infer that the NBFCs dependence on debentures and CPs reduced, as it has fallen from
57.3% share in FY18 to 48.1% share in FY20 and 42.7% in H1FY21. However, it continues to be their primary source of
funding.
The share of CPs declined for both segments (NBFC-ND-SI and NBFC-D) owing to risk aversion in capital markets and
the movement of NBFCs towards longer term-borrowings for better asset-liability management. Similarly, the share of
CPs declined in FY20 in the borrowing mix of NBFCs and formed nearly 1/3rd of the total CP issuance.
Bank borrowings as a share of total borrowings have increased from 23.2% in FY18 to 31.3% in H1FY21. This indicates
that banks are compensating for the reduced market access for NBFCs (especially for smaller players) amid the
prevailing tight liquidity scenario.
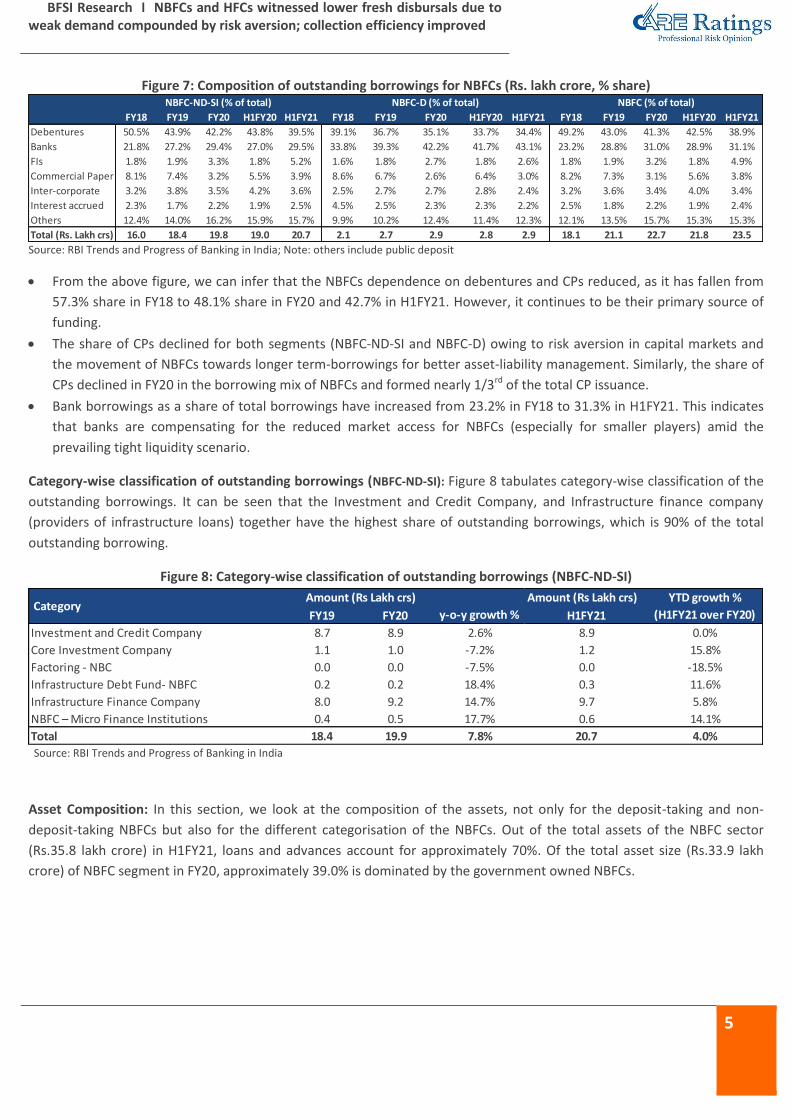
Category-wise classification of outstanding borrowings (NBFC-ND-SI): Figure 8 tabulates category-wise classification of the
outstanding borrowings. It can be seen that the Investment and Credit Company, and Infrastructure finance company
(providers of infrastructure loans) together have the highest share of outstanding borrowings, which is 90% of the total
outstanding borrowing.
Figure 8: Category-wise classification of outstanding borrowings (NBFC-ND-SI)
Source: RBI Trends and Progress of Banking in India
Asset Composition: In this section, we look at the composition of the assets, not only for the deposit-taking and non-
deposit-taking NBFCs but also for the different categorisation of the NBFCs. Out of the total assets of the NBFC sector
(Rs.35.8 lakh crore) in H1FY21, loans and advances account for approximately 70%. Of the total asset size (Rs.33.9 lakh
crore) of NBFC segment in FY20, approximately 39.0% is dominated by the government owned NBFCs.
FY18 FY19 FY20 H1FY20 H1FY21 FY18 FY19 FY20 H1FY20 H1FY21 FY18 FY19 FY20 H1FY20 H1FY21
Debentures 50.5% 43.9% 42.2% 43.8% 39.5% 39.1% 36.7% 35.1% 33.7% 34.4% 49.2% 43.0% 41.3% 42.5% 38.9%
Banks 21.8% 27.2% 29.4% 27.0% 29.5% 33.8% 39.3% 42.2% 41.7% 43.1% 23.2% 28.8% 31.0% 28.9% 31.1%
FIs 1.8% 1.9% 3.3% 1.8% 5.2% 1.6% 1.8% 2.7% 1.8% 2.6% 1.8% 1.9% 3.2% 1.8% 4.9%
Commercial Paper 8.1% 7.4% 3.2% 5.5% 3.9% 8.6% 6.7% 2.6% 6.4% 3.0% 8.2% 7.3% 3.1% 5.6% 3.8%
Inter-corporate 3.2% 3.8% 3.5% 4.2% 3.6% 2.5% 2.7% 2.7% 2.8% 2.4% 3.2% 3.6% 3.4% 4.0% 3.4%
Interest accrued 2.3% 1.7% 2.2% 1.9% 2.5% 4.5% 2.5% 2.3% 2.3% 2.2% 2.5% 1.8% 2.2% 1.9% 2.4%
Others 12.4% 14.0% 16.2% 15.9% 15.7% 9.9% 10.2% 12.4% 11.4% 12.3% 12.1% 13.5% 15.7% 15.3% 15.3%
Total (Rs. Lakh crs) 16.0 18.4 19.8 19.0 20.7 2.1 2.7 2.9 2.8 2.9 18.1 21.1 22.7 21.8 23.5
NBFC (% of total)NBFC-ND-SI (% of total) NBFC-D (% of total)
Amount (Rs Lakh crs)
FY19 FY20 H1FY21
Investment and Credit Company 8.7 8.9 2.6% 8.9 0.0%
Core Investment Company 1.1 1.0 -7.2% 1.2 15.8%
Factoring - NBC 0.0 0.0 -7.5% 0.0 -18.5%
Infrastructure Debt Fund- NBFC 0.2 0.2 18.4% 0.3 11.6%
Infrastructure Finance Company 8.0 9.2 14.7% 9.7 5.8%
NBFC – Micro Finance Institutions 0.4 0.5 17.7% 0.6 14.1%
Total 18.4 19.9 7.8% 20.7 4.0%
YTD growth %
(H1FY21 over FY20) Category
y-o-y growth %
Amount (Rs Lakh crs)

BFSI Research I NBFCs and HFCs witnessed lower fresh disbursals due to weak demand compounded by risk aversion; collection efficiency improved
6
Figure 9: Composition of assets for NBFCs (Rs. lakh crore)
Source: RBI Trends and Progress of Banking in India
Infrastructure finance companies, predominantly comprises of New Delhi based government companies such as PFC, REC,
IRFC, IIFCL etc. The share of Infrastructure finance companies in total assets of NBFCs-NDSI increased in H1FY21, driven by
expansion in other assets, mainly investments. PFC and REC gained from liquidity infusion of Rs.90,000 crore for state
power distribution utilities (DISCOMs) announced by the Government. As can be seen in the figure below, infrastructure
NBFCs has a share of 31.1% in total assets of NBFC sector. PFC and REC together have 21.1% share in total assets of NBFCs
as of September 30, 2020.
Figure 10: Composition of assets for select Government owned NBFCs (Rs. lakh crore)
Source: Company Reports; Note: Standalone
Figure 11: Category-wise analysis of loans and advances
Source: RBI Trends and Progress of Banking in India
NBFC category-wise breakdown of loans and advances (which comprises around 70% of the total assets of the NBFC sector)
has been tabulated in figure 11. Similar to the outstanding borrowings, Investment and Credit Company (ICC), and
Infrastructure finance companies (IFCs) are the ones which have the highest quantum of loans and advances amounting to
Rs.19.3 lakh crore (78.2% of the total) in H1FY21.
Particulars FY18 FY19 FY20
y-o-y
growth %
FY19
y-o-y
growth %
FY20 H1FY21
YTD growth %
(H1FY21 over FY20)
Loans and Advances 19.6 23.2 23.6 18.0% 1.9% 24.6 4.4%
Total Investment 4.2 4.8 5.4 16.1% 12.0% 6.1 13.4%
Cash and Bank 0.8 1.0 1.4 31.0% 39.1% 1.5 8.7%
Current assets 1.3 1.3 2.5 2.3% 86.8% 2.3 -6.2%
Other assets 0.3 0.8 1.0 150.3% 23.0% 1.2 24.9%
Total assets 26.2 31.1 33.9 18.9% 8.9% 35.8 5.8%
Companies FY19 FY20 y-o-y Growth % H1FY21YTD Growth %
(H1FY21 over FY20)
PFC 3.4 3.6 5.9% 3.9 7.5%
REC 3.0 3.5 16.4% 3.7 6.9%
IIFCL 0.4 0.5 19.8% 0.5 -4.9%
IFCI 0.2 0.2 -17.2% 0.2 -6.2%
IRFC 2.1 2.8 33.6% 2.9 5.8%
Total 9.1 10.5 15.7% 11.2 6.0%
Amount (Rs Lakh crs)
FY19 FY20 H1FY21
NBFC-ND-SI 19.4 19.4 0.4% 20.5 5.5%
Investment and Credit Company 9.5 9.4 -1.2% 9.7 3.0%
Core Investment Company 0.2 0.1 -29.7% 0.3 120.4%
Factoring - NBC 0.03 0.03 -3.4% 0.03 -18.0%
Infrastructure Debt Fund- NBFC 0.2 0.3 45.5% 0.3 6.2%
Infrastructure Finance Company 8.9 9.0 1.5% 9.6 5.9%
NBFC – Micro Finance Institutions 0.5 0.6 8.2% 0.6 11.0%
NBFC-D 3.8 4.2 9.7% 4.1 -0.9%
Total NBFCs (NBFC-ND-SI + NBFC-D) 23.2 23.6 1.9% 24.6 4.4%
YTD growth %
(H1FY21 over FY20) Category
Amount (Rs Lakh crs)
y-o-y growth %

BFSI Research I NBFCs and HFCs witnessed lower fresh disbursals due to weak demand compounded by risk aversion; collection efficiency improved
7
The overall growth of loans and advances contracted in FY20 to 1.9% as compared with 18.1% in FY19. Also, the growth has
moderated to 4.4% in H1FY21 as compared with a growth of 4.6% in H1FY20 (discussed in detail in section 3). There was a
sharp reduction in credit growth to all sectors except retail (refer figure 19). Agriculture, Industry and Services sectors
witnessed a significant decline, while the retail sector registered a slower growth in FY20 as compared with FY19. ICC and
IFC segments together registered an YTD growth of 4.5% as compared with a growth of 0.1% in FY20 (y-o-y). Loans and
advances growth of NBFC-MFI segment improved in H1FY21 (YTD) as compared with FY20.
Figure 12: Composition of loans & advances for select Government owned NBFCs (Rs. lakh crore)
Source: Company Reports; Note: Standalone; loans and advances of IRFC includes lease receivables
As can be seen in the above figure, select government owned NBFCs has a share of 36.6% in total loans and advances of
NBFC sector, while, PFC and REC together dominates the loans and advances with a share of 28.3% as of September 30,
2020.
2. Financial performance
This section looks at the annual and half-yearly performance of the NBFC-ND-SI and NBFC-D companies for the financial
years, FY18, FY19, FY20, H1FY20 and H1FY21. Key financial indicators of the profit and loss account like total income, total
expenditure and net profit after tax have been presented.
Figure 13: Comparison of Financial Performance between NBFC-ND-SI and NBFC-D companies (Rs. lakh crore)
Total Income Total Expenditure Net Profit
Source: RBI Trends and Progress of Banking in India
The above figure shows that the total income grew strongly at 13.9% y-o-y in FY19, but the growth slowed down to 12.9%
y-o-y in FY20 due to slower loan disbursals and rate cuts. NBFC sector registered a net profit growth of 167.3% in FY20 as
compared with a de growth of 59.4% in FY19 (low base).
Companies FY19 FY20 y-o-y Growth % H1FY21YTD Growth %
(H1FY21 over FY20)
PFC 3.0 3.3 10.2% 3.6 7.8%
REC 2.7 3.1 15.6% 3.4 8.0%
IIFCL 0.4 0.3 -4.3% 0.3 1.8%
IFCI 0.1 0.1 -21.5% 0.1 -9.3%
IRFC 1.3 1.6 18.4% 1.6 3.3%
Total 7.5 8.4 12.3% 9.0 6.6%
2.5 2.8 3.1
1.6 1.6
0.5 0.6
0.7
0.3 0.3
3.0 3.4
3.8
1.9 1.9
0
1
2
3
4
FY1
8
FY1
9
FY2
0
H1
FY2
0
H1
FY2
1
NBFC-ND-SI NBFC-D
2.0 2.5 2.6
1.3 1.1
0.4
0.4 0.5
0.3 0.3
2.4
2.9 3.1
1.6 1.4
0
1
2
3
4
FY1
8
FY1
9
FY2
0
H1
FY2
0
H1
FY2
1
NBFC-ND-SI NBFC-D
0.4
0.1
0.3 0.2
0.4
0.1
0.1
0.1
0.1
0.0 0.4
0.2
0.5
0.3
0.4
0.0
0.2
0.4
0.6
0.8
FY1
8
FY1
9
FY2
0
H1
FY2
0
H1
FY2
1
NBFC-ND-SI NBFC-D

BFSI Research I NBFCs and HFCs witnessed lower fresh disbursals due to weak demand compounded by risk aversion; collection efficiency improved
8
Key Financial Ratios: A comparison of financial ratios for FY18, FY19, FY20, H1FY20 and H1FY21 is given in Figure 14.
Although we have seen that NBFC-ND-SI comprise around 83.0% share in total income of the NBFC sector, the income and
net profit measured as percentage of total asset is higher for the NBFC-D set of companies (it accounts for around 23%
share in net profit of NBFCs). The total cost to income ratio of the NBFC-ND-SI declined from 80.2% in FY18 to 70.8% in
H1FY21 indicating a fall in operating expenditure of this segment. On contrary, the total cost to income ratio of the NBFC-D
increased from 77.8% in FY18 to 81.9% in H1FY21.
Figure 14: Key financial ratios (as percentage of total assets)
Cost to income ratio (%)
Income to total assets (%) Net profit to total assets (%)
Source: RBI Trends and Progress of Banking in India
The cost to income ratio has been higher for NBFC-ND-SI during the last three financial years and came down
significantly in the first half of FY21 owing to lower operational costs.
The total income as a percentage to total assets declined from 11.2% in FY18 to 10.8% in FY20 and further declined to
5.1% in H1FY21.
The balance sheet of NBFC-ND-SI category witnessed a fall in FY20, while NBFC-D continued to grow at a healthy pace,
While in H1FY21, balance sheet growth of NBFC-ND-SI gained traction due to pick up in loans and advances and base
effect.
Figure 15: Key profitability and asset quality indicators of the NBFC sector (%)
Source: RBI Trends and Progress of Banking in India
80.2
91.7 84.7 81.2
70.8 77.8
72.7 77.9
74.8
81.9
0
20
40
60
80
100
FY1
8
FY1
9
FY2
0
H1
FY2
0
H1
FY2
1
NBFC-ND-SI NBFC-D
11.2 10.3 10.8
5.6 5.1
14.0 14.6 14.5
7.6 6.4
0
3
6
9
12
15
18FY
18
FY1
9
FY2
0
H1
FY2
0
H1
FY2
1
NBFC-ND-SI NBFC-D
1.6
0.2
1.2 0.7
1.2
2.0
2.7 2.3
1.4
0.9
0
1
2
3
FY1
8
FY1
9
FY2
0
H1
FY2
0
H1
FY2
1
NBFC-ND-SI NBFC-D
1.6
6.9
5.7 5.6
3.3
1.5
3.5
5.5 6.0
3.0
1.9
5.9 5.0
6.6
3.0
0
2
4
6
8
ROA ROE NIM GNPA NNPA
FY18 FY19 FY20
BFSI Research I NBFCs and HFCs witnessed lower fresh disbursals due to weak demand compounded by risk aversion; collection efficiency improved
9
As per RBI’s trends and progress report, the improvement in ROA and ROE of NBFCs in FY20 was due to a base effect
(IL&FS event) and lower provisions as companies have already provided in FY19.
Interestingly, while NBFCs have ROA of 1.9% in FY20, while SCBs (Scheduled Commercial Banks) had ROA of 0.2% in the
same period. Similarly SCBs had NIM of 2.9% in FY20 thus, indicating higher profitability of NBFCs.
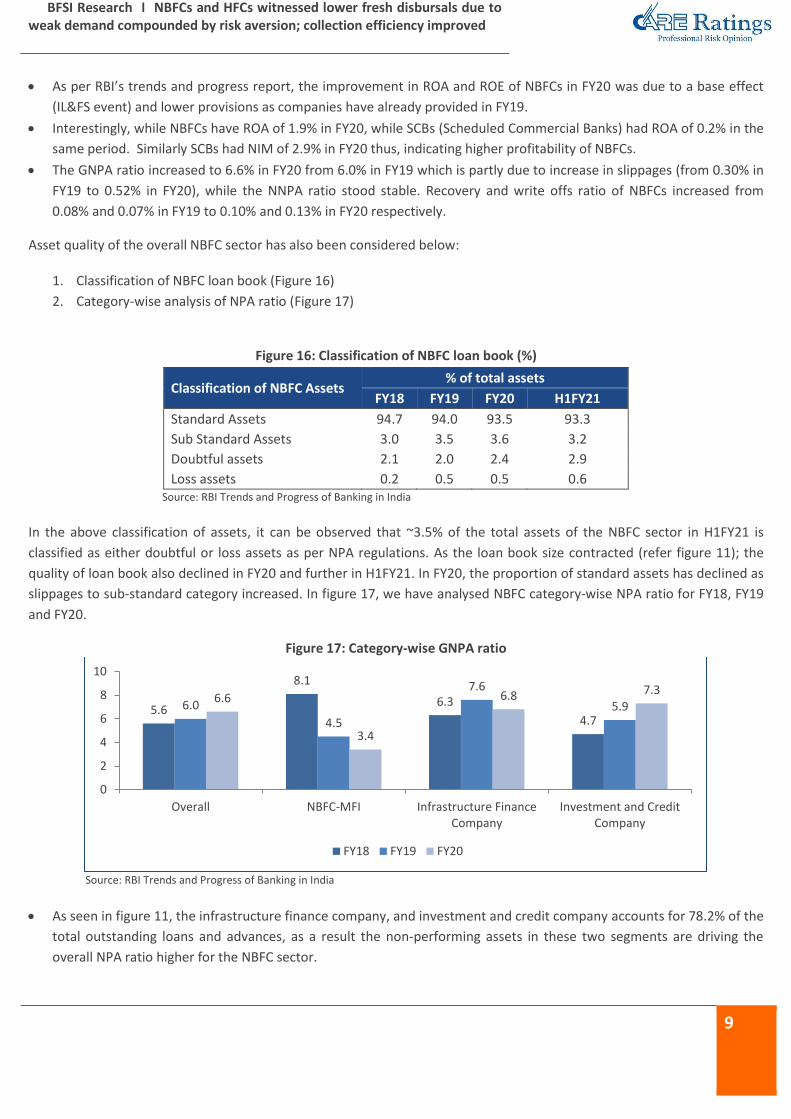
The GNPA ratio increased to 6.6% in FY20 from 6.0% in FY19 which is partly due to increase in slippages (from 0.30% in
FY19 to 0.52% in FY20), while the NNPA ratio stood stable. Recovery and write offs ratio of NBFCs increased from
0.08% and 0.07% in FY19 to 0.10% and 0.13% in FY20 respectively.
Asset quality of the overall NBFC sector has also been considered below:
1. Classification of NBFC loan book (Figure 16)
2. Category-wise analysis of NPA ratio (Figure 17)
Figure 16: Classification of NBFC loan book (%)
Classification of NBFC Assets % of total assets
FY18 FY19 FY20 H1FY21
Standard Assets 94.7 94.0 93.5 93.3
Sub Standard Assets 3.0 3.5 3.6 3.2
Doubtful assets 2.1 2.0 2.4 2.9
Loss assets 0.2 0.5 0.5 0.6 Source: RBI Trends and Progress of Banking in India
In the above classification of assets, it can be observed that ~3.5% of the total assets of the NBFC sector in H1FY21 is
classified as either doubtful or loss assets as per NPA regulations. As the loan book size contracted (refer figure 11); the
quality of loan book also declined in FY20 and further in H1FY21. In FY20, the proportion of standard assets has declined as
slippages to sub-standard category increased. In figure 17, we have analysed NBFC category-wise NPA ratio for FY18, FY19
and FY20.
Figure 17: Category-wise GNPA ratio
Source: RBI Trends and Progress of Banking in India
As seen in figure 11, the infrastructure finance company, and investment and credit company accounts for 78.2% of the
total outstanding loans and advances, as a result the non-performing assets in these two segments are driving the
overall NPA ratio higher for the NBFC sector.
5.6
8.1
6.3
4.7 6.0
4.5
7.6
5.9 6.6
3.4
6.8 7.3
0
2
4
6
8
10
Overall NBFC-MFI Infrastructure FinanceCompany
Investment and CreditCompany
FY18 FY19 FY20
BFSI Research I NBFCs and HFCs witnessed lower fresh disbursals due to weak demand compounded by risk aversion; collection efficiency improved
10
As per RBI’s trends and progress report, infrastructure finance companies reported an improvement in the GNPA ratio
as a result of resolution in stressed thermal assets of PFC/REC. The GNPA ratio of NBFCs-ND-SI deteriorated in FY20 on
account of worsening asset quality of NBFCs-ICC. The NBFC-MFI segment registered further improvement in asset
quality driven by healthy quality of MFI loan portfolio.
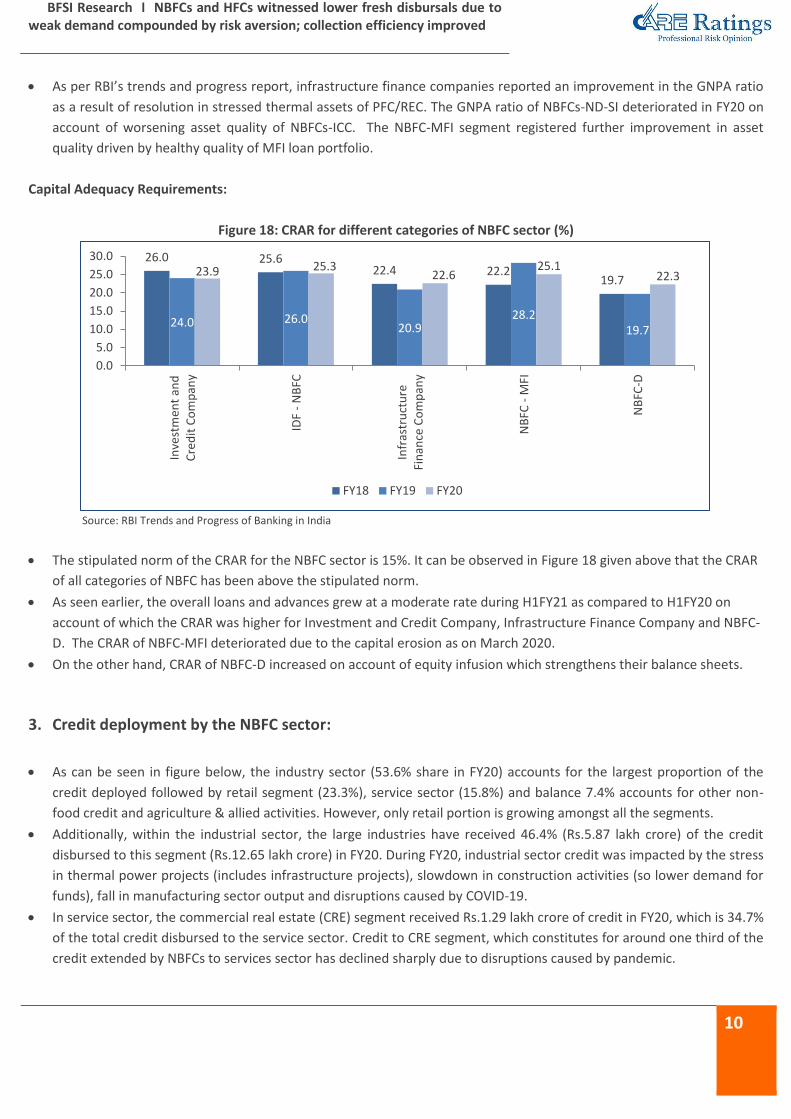
Capital Adequacy Requirements:
Figure 18: CRAR for different categories of NBFC sector (%)
Source: RBI Trends and Progress of Banking in India
The stipulated norm of the CRAR for the NBFC sector is 15%. It can be observed in Figure 18 given above that the CRAR
of all categories of NBFC has been above the stipulated norm.
As seen earlier, the overall loans and advances grew at a moderate rate during H1FY21 as compared to H1FY20 on
account of which the CRAR was higher for Investment and Credit Company, Infrastructure Finance Company and NBFC-
D. The CRAR of NBFC-MFI deteriorated due to the capital erosion as on March 2020.
On the other hand, CRAR of NBFC-D increased on account of equity infusion which strengthens their balance sheets.
3. Credit deployment by the NBFC sector:
As can be seen in figure below, the industry sector (53.6% share in FY20) accounts for the largest proportion of the
credit deployed followed by retail segment (23.3%), service sector (15.8%) and balance 7.4% accounts for other non-
food credit and agriculture & allied activities. However, only retail portion is growing amongst all the segments.
Additionally, within the industrial sector, the large industries have received 46.4% (Rs.5.87 lakh crore) of the credit
disbursed to this segment (Rs.12.65 lakh crore) in FY20. During FY20, industrial sector credit was impacted by the stress
in thermal power projects (includes infrastructure projects), slowdown in construction activities (so lower demand for
funds), fall in manufacturing sector output and disruptions caused by COVID-19.
In service sector, the commercial real estate (CRE) segment received Rs.1.29 lakh crore of credit in FY20, which is 34.7%
of the total credit disbursed to the service sector. Credit to CRE segment, which constitutes for around one third of the
credit extended by NBFCs to services sector has declined sharply due to disruptions caused by pandemic.
26.0 25.6 22.4 22.2
19.7
24.0 26.0 20.9
28.2 19.7
23.9 25.3 22.6
25.1 22.3
0.0
5.0
10.0
15.0
20.0
25.0
30.0
Inve
stm
ent
and
Cre
dit
Co
mp
any
IDF
- N
BFC
Infr
astr
uct
ure
Fin
ance
Co
mp
any
NB
FC -
MFI
NB
FC-D
FY18 FY19 FY20

BFSI Research I NBFCs and HFCs witnessed lower fresh disbursals due to weak demand compounded by risk aversion; collection efficiency improved
11
Retail loan segment grew by 21.6% y-o-y in FY20, led by increase in credit disbursed to vehicle and auto loan which
accounts for 43.4% of the total credit disbursed to retail segment. However, several NBFCs remained ahead of the
curve in retail sector by diversifying into other areas of vehicles financing like used vehicles, two-wheelers in place of
commercial vehicles which helped in arresting the fall in credit to retail sector.
There was a contraction in credit to agriculture, mainly due to the shift in lending by NBFC-MFI to industry.
Figure 19: Sectoral deployment of NBFC credit
Particulars
Amount (Rs. Lakh cr) y-o-y
growth (%) % share of total (FY19) % share of total (FY20)
FY19 FY20
Gross Advances 23.2 23.6 1.9% - -
Non-food Credit 23.2 23.6 1.9% - -
Agriculture & Allied Activities 0.7 0.6 -13.0% 3.1% 2.6%
Industry 12.7 12.7 -0.3% 54.8% 53.6%
Micro and Small 0.4 0.8 80.7% 1.8% 3.2%
Medium 0.2 0.2 -5.8% 0.8% 0.7%
Large 7.1 5.9 -17.1% 30.6% 24.9%
Others 5.0 5.9 16.9% 21.6% 24.8%
Services 3.9 3.7 -3.3% 16.6% 15.8%
Commercial real estate 1.5 1.3 -14.8% 6.5% 5.5%
Trade 0.3 0.4 26.9% 1.3% 1.6%
Retail 4.5 5.5 21.6% 19.5% 23.3%
Housing loans 0.2 0.2 37.1% 0.7% 0.9%
Vehicle/auto loans 2.0 2.4 18.2% 8.7% 10.1%
Consumer durables 0.1 0.1 -0.4% 0.2% 0.2%
Other Non-food credit 1.4 1.1 -19.9% 5.9% 4.7%
Source: RBI Trends and Progress of Banking in India
BFSI Research I NBFCs and HFCs witnessed lower fresh disbursals due to weak demand compounded by risk aversion; collection efficiency improved
12
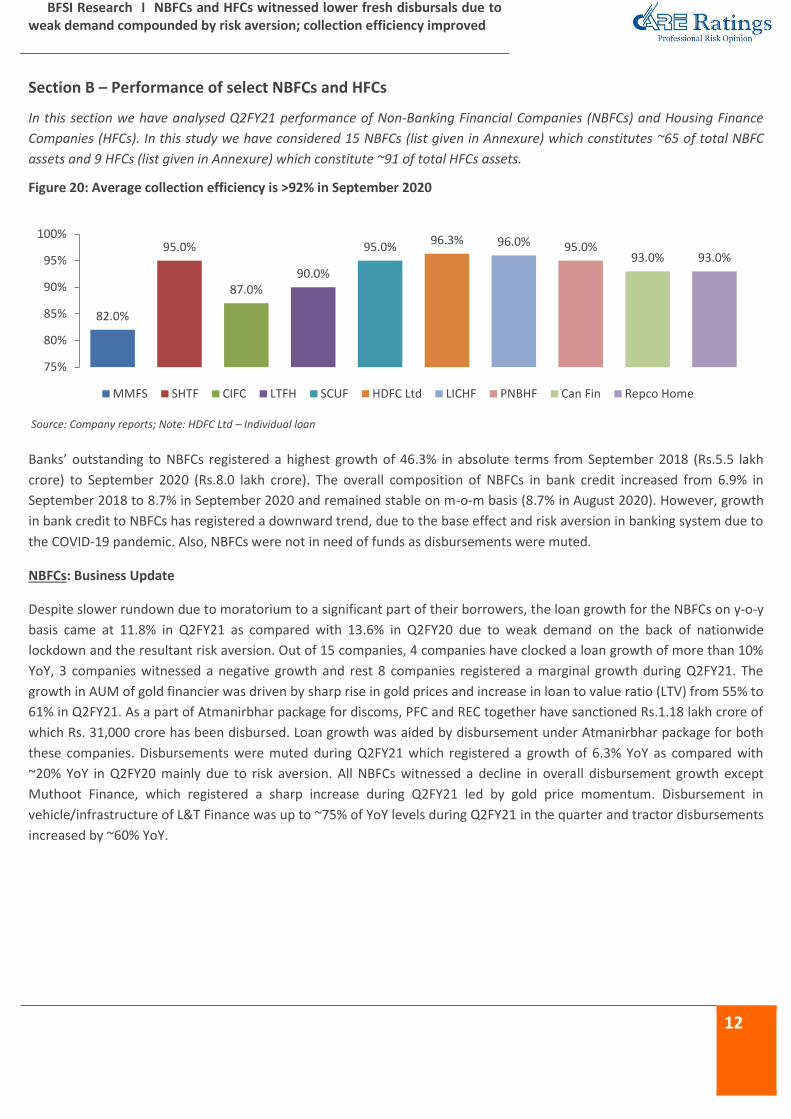
Section B – Performance of select NBFCs and HFCs
In this section we have analysed Q2FY21 performance of Non-Banking Financial Companies (NBFCs) and Housing Finance
Companies (HFCs). In this study we have considered 15 NBFCs (list given in Annexure) which constitutes ~65 of total NBFC
assets and 9 HFCs (list given in Annexure) which constitute ~91 of total HFCs assets.
Figure 20: Average collection efficiency is >92% in September 2020
Source: Company reports; Note: HDFC Ltd – Individual loan
Banks’ outstanding to NBFCs registered a highest growth of 46.3% in absolute terms from September 2018 (Rs.5.5 lakh
crore) to September 2020 (Rs.8.0 lakh crore). The overall composition of NBFCs in bank credit increased from 6.9% in
September 2018 to 8.7% in September 2020 and remained stable on m-o-m basis (8.7% in August 2020). However, growth
in bank credit to NBFCs has registered a downward trend, due to the base effect and risk aversion in banking system due to
the COVID-19 pandemic. Also, NBFCs were not in need of funds as disbursements were muted.
NBFCs: Business Update
Despite slower rundown due to moratorium to a significant part of their borrowers, the loan growth for the NBFCs on y-o-y
basis came at 11.8% in Q2FY21 as compared with 13.6% in Q2FY20 due to weak demand on the back of nationwide
lockdown and the resultant risk aversion. Out of 15 companies, 4 companies have clocked a loan growth of more than 10%
YoY, 3 companies witnessed a negative growth and rest 8 companies registered a marginal growth during Q2FY21. The
growth in AUM of gold financier was driven by sharp rise in gold prices and increase in loan to value ratio (LTV) from 55% to
61% in Q2FY21. As a part of Atmanirbhar package for discoms, PFC and REC together have sanctioned Rs.1.18 lakh crore of
which Rs. 31,000 crore has been disbursed. Loan growth was aided by disbursement under Atmanirbhar package for both
these companies. Disbursements were muted during Q2FY21 which registered a growth of 6.3% YoY as compared with
~20% YoY in Q2FY20 mainly due to risk aversion. All NBFCs witnessed a decline in overall disbursement growth except
Muthoot Finance, which registered a sharp increase during Q2FY21 led by gold price momentum. Disbursement in
vehicle/infrastructure of L&T Finance was up to ~75% of YoY levels during Q2FY21 in the quarter and tractor disbursements
increased by ~60% YoY.
82.0%
95.0%
87.0% 90.0%
95.0% 96.3% 96.0% 95.0%
93.0% 93.0%
75%
80%
85%
90%
95%
100%
MMFS SHTF CIFC LTFH SCUF HDFC Ltd LICHF PNBHF Can Fin Repco Home
BFSI Research I NBFCs and HFCs witnessed lower fresh disbursals due to weak demand compounded by risk aversion; collection efficiency improved
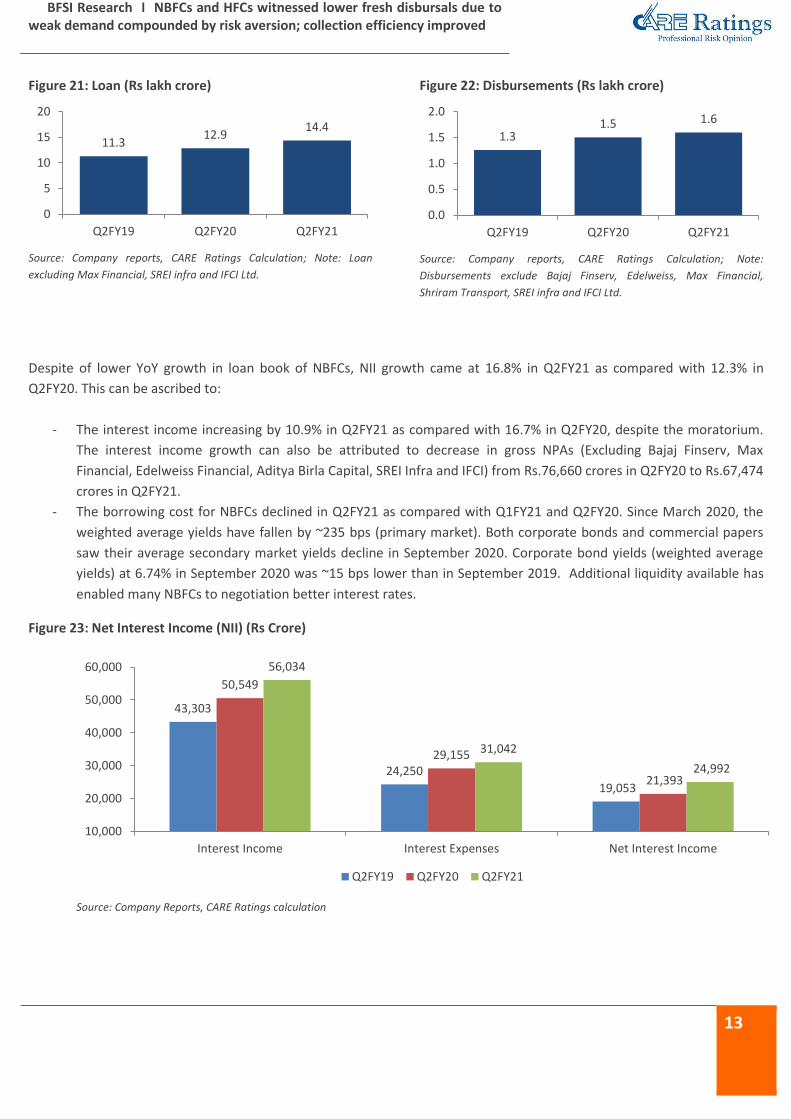
13
Figure 21: Loan (Rs lakh crore)
Source: Company reports, CARE Ratings Calculation; Note: Loan
excluding Max Financial, SREI infra and IFCI Ltd.
Figure 22: Disbursements (Rs lakh crore)
Source: Company reports, CARE Ratings Calculation; Note:
Disbursements exclude Bajaj Finserv, Edelweiss, Max Financial,
Shriram Transport, SREI infra and IFCI Ltd.
Despite of lower YoY growth in loan book of NBFCs, NII growth came at 16.8% in Q2FY21 as compared with 12.3% in
Q2FY20. This can be ascribed to:
- The interest income increasing by 10.9% in Q2FY21 as compared with 16.7% in Q2FY20, despite the moratorium.
The interest income growth can also be attributed to decrease in gross NPAs (Excluding Bajaj Finserv, Max
Financial, Edelweiss Financial, Aditya Birla Capital, SREI Infra and IFCI) from Rs.76,660 crores in Q2FY20 to Rs.67,474
crores in Q2FY21.
- The borrowing cost for NBFCs declined in Q2FY21 as compared with Q1FY21 and Q2FY20. Since March 2020, the
weighted average yields have fallen by ~235 bps (primary market). Both corporate bonds and commercial papers
saw their average secondary market yields decline in September 2020. Corporate bond yields (weighted average
yields) at 6.74% in September 2020 was ~15 bps lower than in September 2019. Additional liquidity available has
enabled many NBFCs to negotiation better interest rates.
Figure 23: Net Interest Income (NII) (Rs Crore)
Source: Company Reports, CARE Ratings calculation
11.3 12.9
14.4
0
5
10
15
20
Q2FY19 Q2FY20 Q2FY21
1.3 1.5 1.6
0.0
0.5
1.0
1.5
2.0
Q2FY19 Q2FY20 Q2FY21
43,303
24,250
19,053
50,549
29,155
21,393
56,034
31,042
24,992
10,000
20,000
30,000
40,000
50,000
60,000
Interest Income Interest Expenses Net Interest Income
Q2FY19 Q2FY20 Q2FY21
BFSI Research I NBFCs and HFCs witnessed lower fresh disbursals due to weak demand compounded by risk aversion; collection efficiency improved
14
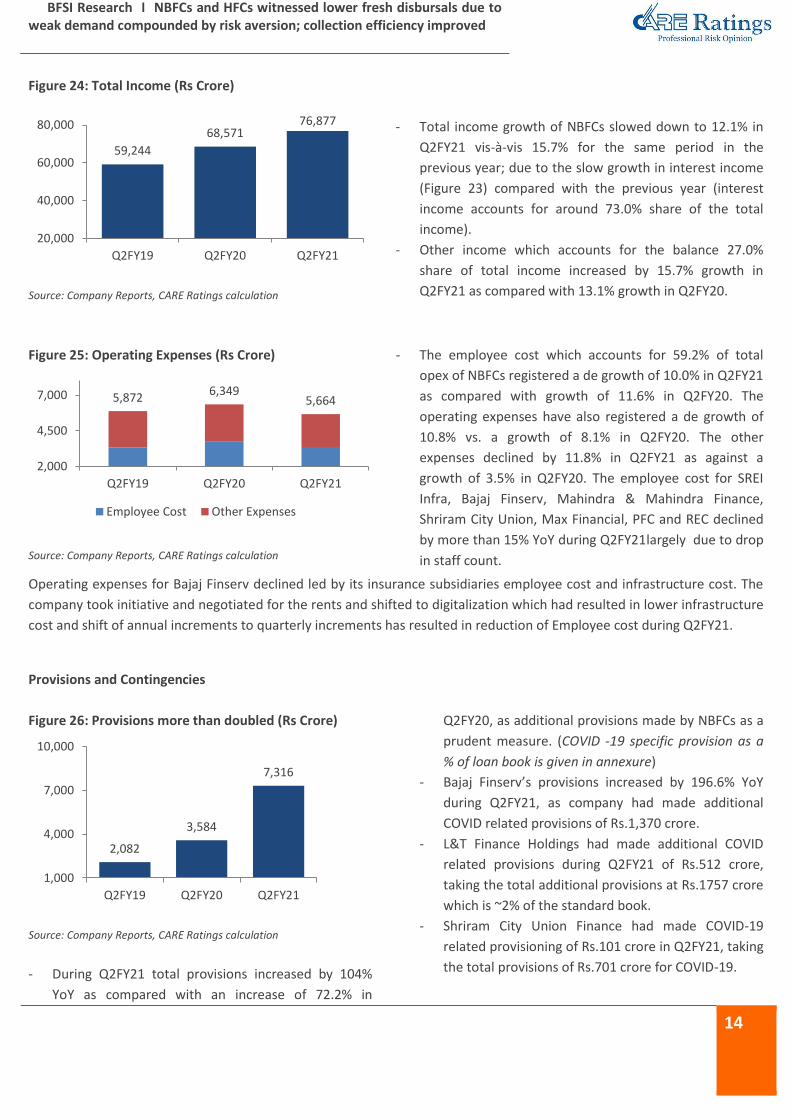
Figure 24: Total Income (Rs Crore)
Source: Company Reports, CARE Ratings calculation
- Total income growth of NBFCs slowed down to 12.1% in
Q2FY21 vis-à-vis 15.7% for the same period in the
previous year; due to the slow growth in interest income
(Figure 23) compared with the previous year (interest
income accounts for around 73.0% share of the total
income).
- Other income which accounts for the balance 27.0%
share of total income increased by 15.7% growth in
Q2FY21 as compared with 13.1% growth in Q2FY20.
Figure 25: Operating Expenses (Rs Crore)
Source: Company Reports, CARE Ratings calculation
- The employee cost which accounts for 59.2% of total
opex of NBFCs registered a de growth of 10.0% in Q2FY21
as compared with growth of 11.6% in Q2FY20. The
operating expenses have also registered a de growth of
10.8% vs. a growth of 8.1% in Q2FY20. The other
expenses declined by 11.8% in Q2FY21 as against a
growth of 3.5% in Q2FY20. The employee cost for SREI
Infra, Bajaj Finserv, Mahindra & Mahindra Finance,
Shriram City Union, Max Financial, PFC and REC declined
by more than 15% YoY during Q2FY21largely due to drop
in staff count.
Operating expenses for Bajaj Finserv declined led by its insurance subsidiaries employee cost and infrastructure cost. The
company took initiative and negotiated for the rents and shifted to digitalization which had resulted in lower infrastructure
cost and shift of annual increments to quarterly increments has resulted in reduction of Employee cost during Q2FY21.
Provisions and Contingencies
Figure 26: Provisions more than doubled (Rs Crore)
Source: Company Reports, CARE Ratings calculation
- During Q2FY21 total provisions increased by 104%
YoY as compared with an increase of 72.2% in
Q2FY20, as additional provisions made by NBFCs as a
prudent measure. (COVID -19 specific provision as a
% of loan book is given in annexure)
- Bajaj Finserv’s provisions increased by 196.6% YoY
during Q2FY21, as company had made additional
COVID related provisions of Rs.1,370 crore.
- L&T Finance Holdings had made additional COVID
related provisions during Q2FY21 of Rs.512 crore,
taking the total additional provisions at Rs.1757 crore
which is ~2% of the standard book.
- Shriram City Union Finance had made COVID-19
related provisioning of Rs.101 crore in Q2FY21, taking
the total provisions of Rs.701 crore for COVID-19.
59,244
68,571 76,877
20,000
40,000
60,000
80,000
Q2FY19 Q2FY20 Q2FY21
5,872 6,349
5,664
2,000
4,500
7,000
Q2FY19 Q2FY20 Q2FY21
Employee Cost Other Expenses
2,082
3,584
7,316
1,000
4,000
7,000
10,000
Q2FY19 Q2FY20 Q2FY21
BFSI Research I NBFCs and HFCs witnessed lower fresh disbursals due to weak demand compounded by risk aversion; collection efficiency improved
15
- Shriram Transport Finance had made Rs.401 crore of
provisions in Q2FY21, Rs.300 crore for accounts
which would have been NPA if Supreme Court order
was not in place and rest is additional cautious
provisioning for COVID-19.
- Provisions of Cholamandalam Investment & Finance
registered a sharp increase of 233.8% YoY as
Management’s prudent measure. The company made
additional provisions of Rs.250 crore taking total
provisions to ~2.6% of book.
- In the coming quarter’s provisions of NBFCs are
expected to remain elevated on account of
recognition of stressed assets owing to COVID-19 and
its disruptions affecting the business which could
impact its financial performance.
Asset Quality
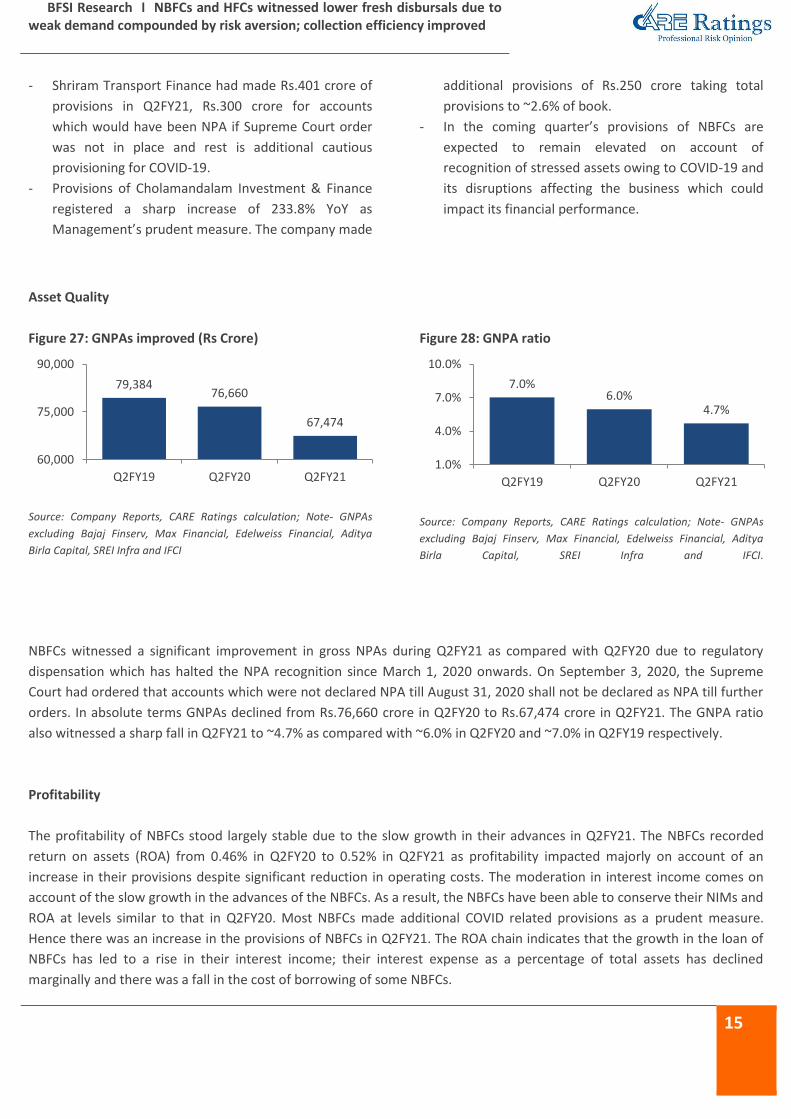
Figure 27: GNPAs improved (Rs Crore)
Source: Company Reports, CARE Ratings calculation; Note- GNPAs
excluding Bajaj Finserv, Max Financial, Edelweiss Financial, Aditya
Birla Capital, SREI Infra and IFCI
Figure 28: GNPA ratio
Source: Company Reports, CARE Ratings calculation; Note- GNPAs
excluding Bajaj Finserv, Max Financial, Edelweiss Financial, Aditya
Birla Capital, SREI Infra and IFCI.
NBFCs witnessed a significant improvement in gross NPAs during Q2FY21 as compared with Q2FY20 due to regulatory
dispensation which has halted the NPA recognition since March 1, 2020 onwards. On September 3, 2020, the Supreme
Court had ordered that accounts which were not declared NPA till August 31, 2020 shall not be declared as NPA till further
orders. In absolute terms GNPAs declined from Rs.76,660 crore in Q2FY20 to Rs.67,474 crore in Q2FY21. The GNPA ratio
also witnessed a sharp fall in Q2FY21 to ~4.7% as compared with ~6.0% in Q2FY20 and ~7.0% in Q2FY19 respectively.
Profitability
The profitability of NBFCs stood largely stable due to the slow growth in their advances in Q2FY21. The NBFCs recorded
return on assets (ROA) from 0.46% in Q2FY20 to 0.52% in Q2FY21 as profitability impacted majorly on account of an
increase in their provisions despite significant reduction in operating costs. The moderation in interest income comes on
account of the slow growth in the advances of the NBFCs. As a result, the NBFCs have been able to conserve their NIMs and
ROA at levels similar to that in Q2FY20. Most NBFCs made additional COVID related provisions as a prudent measure.
Hence there was an increase in the provisions of NBFCs in Q2FY21. The ROA chain indicates that the growth in the loan of
NBFCs has led to a rise in their interest income; their interest expense as a percentage of total assets has declined
marginally and there was a fall in the cost of borrowing of some NBFCs.
79,384 76,660
67,474
60,000
75,000
90,000
Q2FY19 Q2FY20 Q2FY21
7.0% 6.0%
4.7%
1.0%
4.0%
7.0%
10.0%
Q2FY19 Q2FY20 Q2FY21
BFSI Research I NBFCs and HFCs witnessed lower fresh disbursals due to weak demand compounded by risk aversion; collection efficiency improved
16
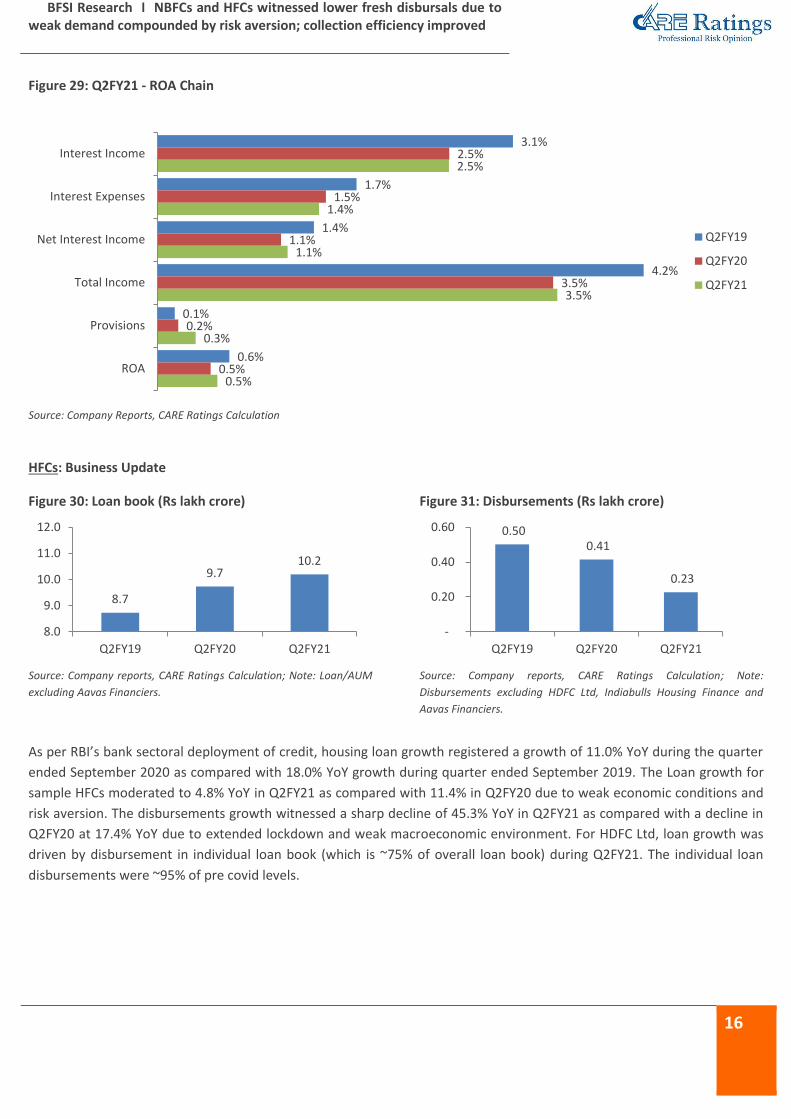
Figure 29: Q2FY21 - ROA Chain
Source: Company Reports, CARE Ratings Calculation
HFCs: Business Update
Figure 30: Loan book (Rs lakh crore)
Source: Company reports, CARE Ratings Calculation; Note: Loan/AUM
excluding Aavas Financiers.
Figure 31: Disbursements (Rs lakh crore)
Source: Company reports, CARE Ratings Calculation; Note:
Disbursements excluding HDFC Ltd, Indiabulls Housing Finance and
Aavas Financiers.
As per RBI’s bank sectoral deployment of credit, housing loan growth registered a growth of 11.0% YoY during the quarter
ended September 2020 as compared with 18.0% YoY growth during quarter ended September 2019. The Loan growth for
sample HFCs moderated to 4.8% YoY in Q2FY21 as compared with 11.4% in Q2FY20 due to weak economic conditions and
risk aversion. The disbursements growth witnessed a sharp decline of 45.3% YoY in Q2FY21 as compared with a decline in
Q2FY20 at 17.4% YoY due to extended lockdown and weak macroeconomic environment. For HDFC Ltd, loan growth was
driven by disbursement in individual loan book (which is ~75% of overall loan book) during Q2FY21. The individual loan
disbursements were ~95% of pre covid levels.
3.1%
1.7%
1.4%
4.2%
0.1%
0.6%
2.5%
1.5%
1.1%
3.5%
0.2%
0.5%
2.5%
1.4%
1.1%
3.5%
0.3%
0.5%
Interest Income
Interest Expenses
Net Interest Income
Total Income
Provisions
ROA
Q2FY19
Q2FY20
Q2FY21
8.7
9.7 10.2
8.0
9.0
10.0
11.0
12.0
Q2FY19 Q2FY20 Q2FY21
0.50 0.41
0.23
-
0.20
0.40
0.60
Q2FY19 Q2FY20 Q2FY21
BFSI Research I NBFCs and HFCs witnessed lower fresh disbursals due to weak demand compounded by risk aversion; collection efficiency improved
17
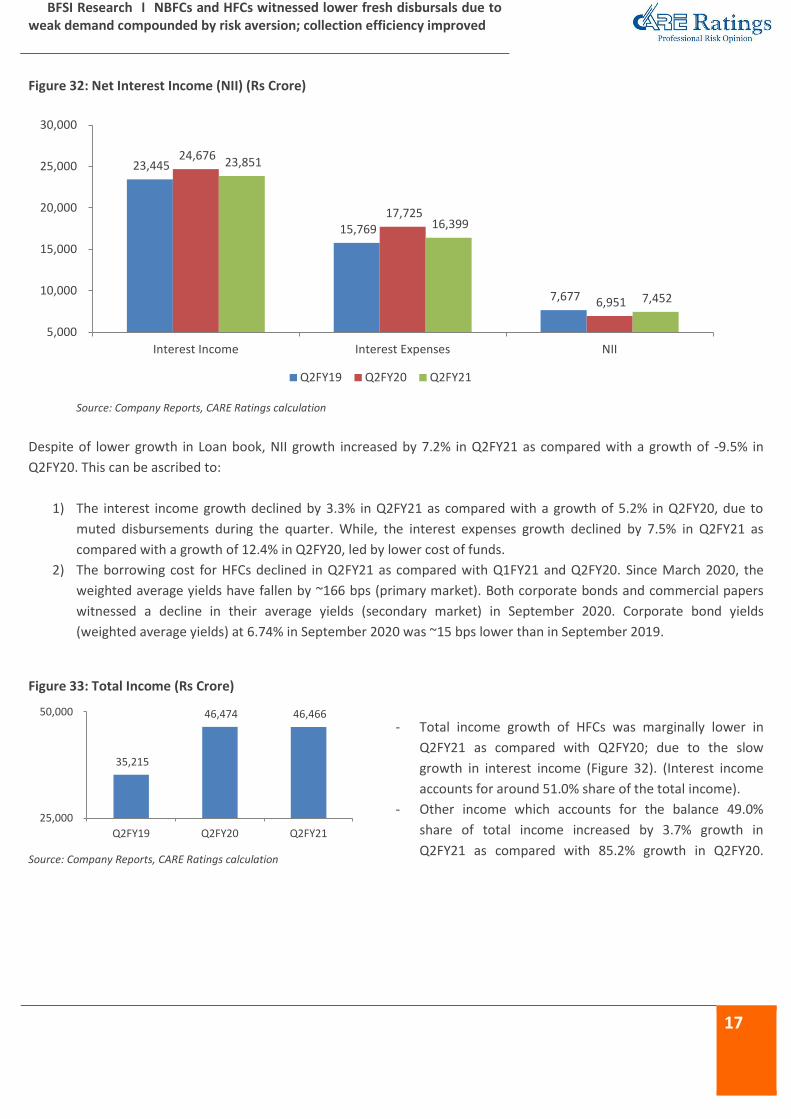
Figure 32: Net Interest Income (NII) (Rs Crore)
Source: Company Reports, CARE Ratings calculation
Despite of lower growth in Loan book, NII growth increased by 7.2% in Q2FY21 as compared with a growth of -9.5% in
Q2FY20. This can be ascribed to:
1) The interest income growth declined by 3.3% in Q2FY21 as compared with a growth of 5.2% in Q2FY20, due to
muted disbursements during the quarter. While, the interest expenses growth declined by 7.5% in Q2FY21 as
compared with a growth of 12.4% in Q2FY20, led by lower cost of funds.
2) The borrowing cost for HFCs declined in Q2FY21 as compared with Q1FY21 and Q2FY20. Since March 2020, the
weighted average yields have fallen by ~166 bps (primary market). Both corporate bonds and commercial papers
witnessed a decline in their average yields (secondary market) in September 2020. Corporate bond yields
(weighted average yields) at 6.74% in September 2020 was ~15 bps lower than in September 2019.
Figure 33: Total Income (Rs Crore)
Source: Company Reports, CARE Ratings calculation
- Total income growth of HFCs was marginally lower in
Q2FY21 as compared with Q2FY20; due to the slow
growth in interest income (Figure 32). (Interest income
accounts for around 51.0% share of the total income).
- Other income which accounts for the balance 49.0%
share of total income increased by 3.7% growth in
Q2FY21 as compared with 85.2% growth in Q2FY20.
23,445
15,769
7,677
24,676
17,725
6,951
23,851
16,399
7,452
5,000
10,000
15,000
20,000
25,000
30,000
Interest Income Interest Expenses NII
Q2FY19 Q2FY20 Q2FY21
35,215
46,474 46,466
25,000
50,000
Q2FY19 Q2FY20 Q2FY21
BFSI Research I NBFCs and HFCs witnessed lower fresh disbursals due to weak demand compounded by risk aversion; collection efficiency improved
18
Operating Expenses
The employee cost of HFCs registered a de growth of 25.7% in Q2FY21 largely due to lower staff count (de growth of 23.4%
in Q2FY20). The other expenses declined by 22.8% in Q2FY21 as against a de growth of 51.9% in Q2FY20. However, the
operating expenses have also registered a de growth of 24.7% vs. a de growth of 36.7% in Q2FY20 driven by lower
employee and non-employee cost. LIC Housing Finance reported a higher growth in its operating expenses in Q2FY21 due
to CSR expenses.
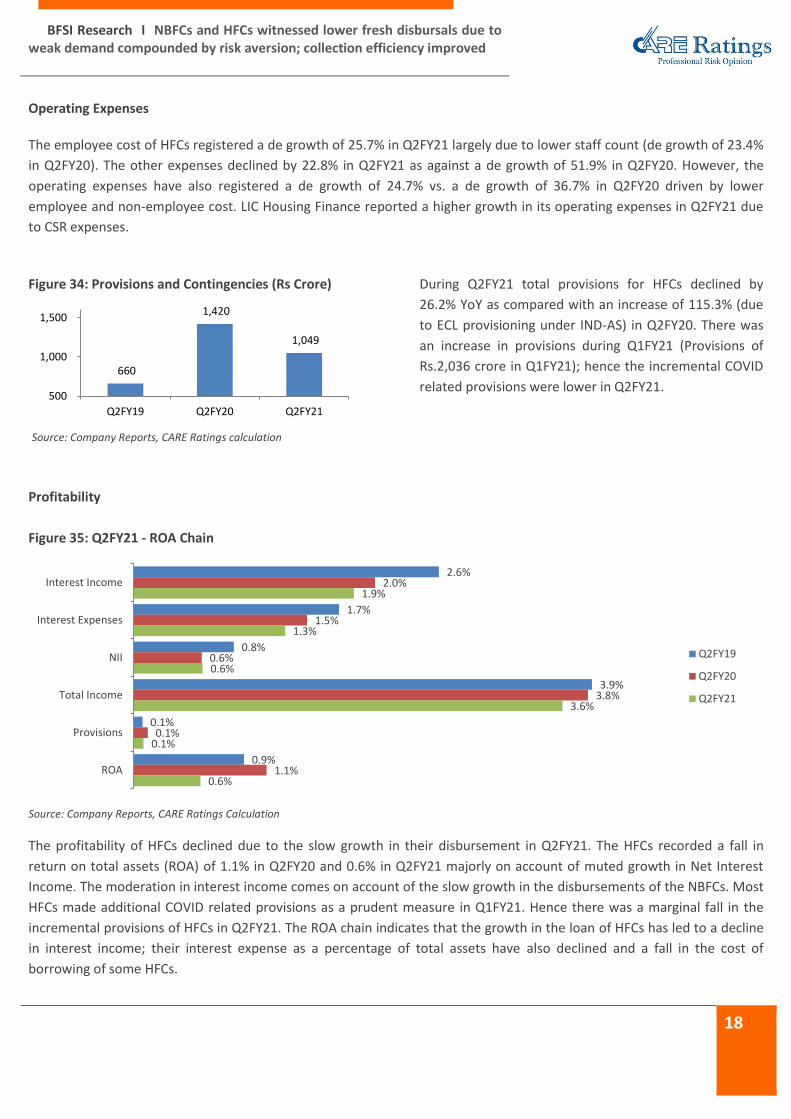
Figure 34: Provisions and Contingencies (Rs Crore)
Source: Company Reports, CARE Ratings calculation
During Q2FY21 total provisions for HFCs declined by
26.2% YoY as compared with an increase of 115.3% (due
to ECL provisioning under IND-AS) in Q2FY20. There was
an increase in provisions during Q1FY21 (Provisions of
Rs.2,036 crore in Q1FY21); hence the incremental COVID
related provisions were lower in Q2FY21.
Profitability
Figure 35: Q2FY21 - ROA Chain
Source: Company Reports, CARE Ratings Calculation
The profitability of HFCs declined due to the slow growth in their disbursement in Q2FY21. The HFCs recorded a fall in
return on total assets (ROA) of 1.1% in Q2FY20 and 0.6% in Q2FY21 majorly on account of muted growth in Net Interest
Income. The moderation in interest income comes on account of the slow growth in the disbursements of the NBFCs. Most
HFCs made additional COVID related provisions as a prudent measure in Q1FY21. Hence there was a marginal fall in the
incremental provisions of HFCs in Q2FY21. The ROA chain indicates that the growth in the loan of HFCs has led to a decline
in interest income; their interest expense as a percentage of total assets have also declined and a fall in the cost of
borrowing of some HFCs.
660
1,420
1,049
500
1,000
1,500
Q2FY19 Q2FY20 Q2FY21
2.6%
1.7%
0.8%
3.9%
0.1%
0.9%
2.0%
1.5%
0.6%
3.8%
0.1%
1.1%
1.9%
1.3%
0.6%
3.6%
0.1%
0.6%
Interest Income
Interest Expenses
NII
Total Income
Provisions
ROA
Q2FY19
Q2FY20
Q2FY21

19
Asset Quality
Figure 36: GNPAs (Rs Crore)
Source: Company Reports, CARE Ratings calculation; Note- GNPAs
excluding Aavas Financiers
Figure 37: GNPA ratio
Source: Company Reports, CARE Ratings calculation; Note- GNPAs
excluding Aavas Financiers
HFCs witnessed deterioration in gross NPAs during Q2FY21 as compared with Q2FY20 despite of regulatory dispensation. In
absolute terms GNPAs increased from Rs.18,165 crore in Q2FY20 to Rs.24,158 crore in Q2FY21. The GNPA ratio also
witnessed a sharp increase in Q2FY21 to ~2.4% as compared with ~1.9% in Q2FY20 and ~1.4% in Q2FY19 respectively.
HDFC Ltd.’s overall collection efficiency for individual loans was 96.3% in September. The collection efficiency for non-
moratorium customers stood at 99.5%. The non-performing loans would have been only 2 bps higher at 1.83% of the loan
portfolio if Supreme Court order on asset classification were not considered; with individual NPLs at 0.88% and non-
individuals NPLs at 4.19%. For LIC Housing Finance 3-4 big ticket developer loans are in final stages of resolution which
should improve the NPA movement in Q3FY21. Its Individual stage 3 assets stood at 1.7% and project stage 3 assets stood
at 16.5%.
Capital Adequacy Ratio (CRAR) under Basel III for NBFCs and HFCs
NBFCs in Figure 38 had a strong capital position during Q2FY21. RBI requires NBFCs to maintain a minimum level of CRAR or
Capital to Risk Assets Ratio of 15%. NBFCs had requested RBI to consider a one-time measure to allow NBFCs to draw down
from their Reserves and adjust towards additional ECL provision requirement. It will enable the NBFCs to shore up their
balance sheet strength by reporting a more fortified ECL provision cover against their likely increase in delinquent loans
and remain eligible to access equity/debt capital when COVID situation improves. The aggregate Debt/Equity ratio of
sample NBFCs improved marginally at 4.0x as of September 2020 as compared with 4.3x as of March 2020.
12,605
18,165
24,158
-
10,000
20,000
30,000
Q2FY19 Q2FY20 Q2FY21
1.4%
1.9%
2.4%
0.5%
1.5%
2.5%
Q2FY19 Q2FY20 Q2FY21

BFSI Research I NBFCs and HFCs witnessed lower fresh disbursals due to weak demand compounded by risk aversion; collection efficiency improved
20
Figure 38: CRAR position of select NBFCs and HFCs (%)
Source: Company Reports
Conclusion
As on August 31, 2020, the overall percentage of NBFC customers who have availed the loan moratorium has been
comparatively lower than banks, while the loans outstanding under moratorium were higher as compared with banks.
The combined sample set of NBFCs and HFCs have witnessed a lower disbursals and AUM growth in Q2FY21 as
compared with Q2FY20 due to cautious approach towards fresh disbursements and weak demand compounded by risk
aversion. During Q2FY21, the rural focused NBFCs have witnessed an almost normal disbursements and collections
supported by harvest.
The funding challenges for NBFCs and HFCs could mount again (especially for smaller NBFCs), on the back of Covid-19
related disruptions, leading to tighter liquidity concerns. The liquidity covers of NBFCs and HFCs will be dependent on
collections and the ability to raise resources during these challenging times. Amidst this challenging time, banks overall
exposure to NBFCs have been increasing, while the share of CPs and corporate debt deployed together in NBFCs
witnessed a declining trend during November 2019 to November 2020. While this has seen minor reversal lately, the
long term trend is to be seen.
As the economic recovery is gaining the traction, the gradual pickup in disbursements is expected in the second half of
FY21. For most of large NBFCs collection efficiency has improved and may improve further.
It will be important to monitor the collection trends and restructuring under the COVID-19 stress resolution framework
for NBFCs and HFCs.
25.1 23.4
30.1
19.5 18.2 18.4
25.7
19.3 20.7
13.9
18.7
24.8 26.8
5.0
15.0
25.0
35.0
MM
FS
SHTF
SCU
F
CIF
C
PFC
REC
Mu
tho
ot
Sun
dar
am
HD
FC L
td
LIC
HF
PN
BH
F
Can
Fin
Ho
me
s
Re
pco
Ho
me
Fin
ance
Q2FY19 Q2FY20 Q2FY21
BFSI Research I NBFCs and HFCs witnessed lower fresh disbursals due to weak demand compounded by risk aversion; collection efficiency improved
21
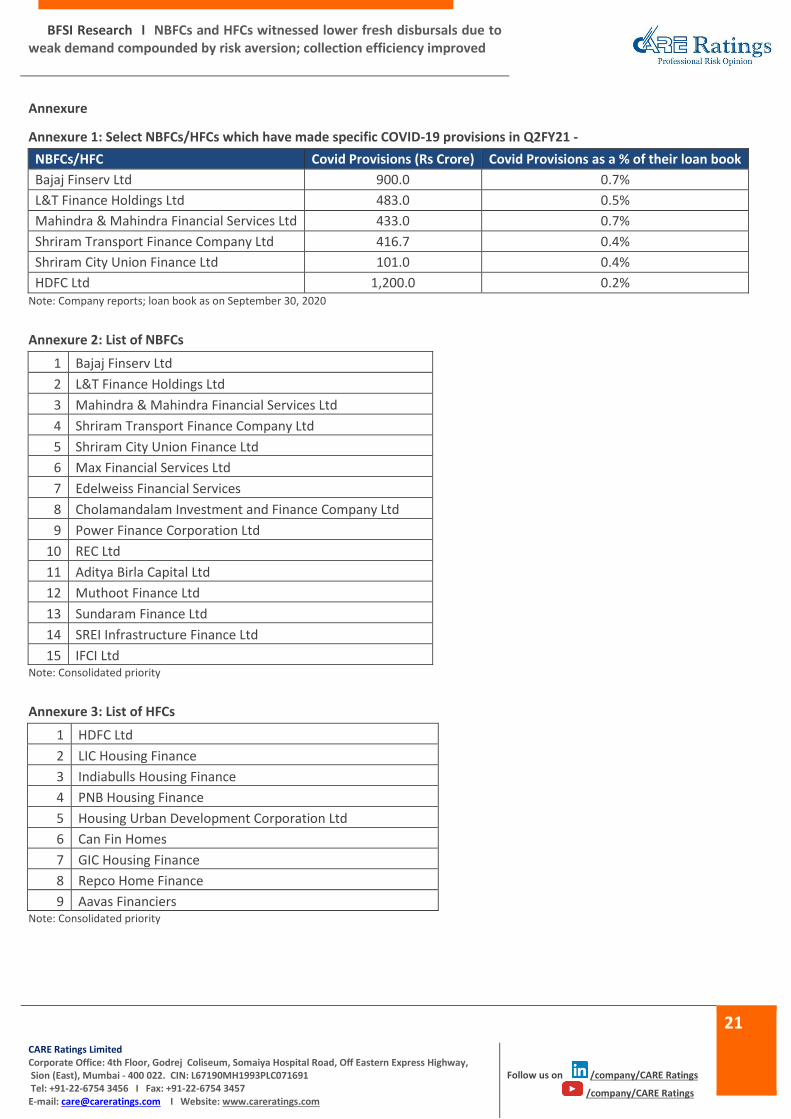
Annexure
Annexure 1: Select NBFCs/HFCs which have made specific COVID-19 provisions in Q2FY21 -
NBFCs/HFC Covid Provisions (Rs Crore) Covid Provisions as a % of their loan book
Bajaj Finserv Ltd 900.0 0.7%
L&T Finance Holdings Ltd 483.0 0.5%
Mahindra & Mahindra Financial Services Ltd 433.0 0.7%
Shriram Transport Finance Company Ltd 416.7 0.4%
Shriram City Union Finance Ltd 101.0 0.4%
HDFC Ltd 1,200.0 0.2% Note: Company reports; loan book as on September 30, 2020
Annexure 2: List of NBFCs
1 Bajaj Finserv Ltd
2 L&T Finance Holdings Ltd
3 Mahindra & Mahindra Financial Services Ltd
4 Shriram Transport Finance Company Ltd
5 Shriram City Union Finance Ltd
6 Max Financial Services Ltd
7 Edelweiss Financial Services
8 Cholamandalam Investment and Finance Company Ltd
9 Power Finance Corporation Ltd
10 REC Ltd
11 Aditya Birla Capital Ltd
12 Muthoot Finance Ltd
13 Sundaram Finance Ltd
14 SREI Infrastructure Finance Ltd
15 IFCI Ltd Note: Consolidated priority
Annexure 3: List of HFCs
1 HDFC Ltd
2 LIC Housing Finance
3 Indiabulls Housing Finance
4 PNB Housing Finance
5 Housing Urban Development Corporation Ltd
6 Can Fin Homes
7 GIC Housing Finance
8 Repco Home Finance
9 Aavas Financiers Note: Consolidated priority
CARE Ratings Limited Corporate Office: 4th Floor, Godrej Coliseum, Somaiya Hospital Road, Off Eastern Express Highway, Sion (East), Mumbai - 400 022. CIN: L67190MH1993PLC071691 Tel: +91-22-6754 3456 I Fax: +91-22-6754 3457 E-mail: [email protected] I Website: www.careratings.com
Follow us on /company/CARE Ratings
/company/CARE Ratings


