
NEVADA SPEED MANAGEMENT WORKSHOP
Davey L. WarrenOffice of Safety and Traffic Operations R&D
Federal Highway Administration
Reno, NV
April 4, 1996

Realistic Speed LimitsWhy & How
Speed limits and the law Speed limits, speed and accident risk Speed limits and driver acceptance Design speed vs posted speed Methods for setting speed limits Recommended approach Implementation & federal assistance
SPEEDLIMIT
85PERCENTILE

Speeding Problem
Rational for government regulation of speed Speed a factor in 10% of accidents & 30% of
fatal crashes Severity increases with speed Speed limits widely disobeyed Conflict between access, safety, and mobility What is a safe speed & who decides?

Why Do People Speed
Speed set too low Road design conducive to high speeds Perceived risk of accident or citation from
speeding is low (everyone is doing it) Fast is consistent with social values General conflict between mobility & safety

Basic Tenets of Law Laws protect the public by regulating
unreasonable or unsafe actions Actions of a reasonable person should be
legal Most people drive in a safe and reasonable
manner Law cannot be effectively enforced without
the public consent & voluntary compliance

Speed Limit Laws
BASIC SPEED RULE -Driver must travel at a speed that is reasonable and proper for conditions and not endanger others or crash.
SPEED ZONING -Gives highway agency or localities authority to post limits higher or lower based on an engineering study, and to set them to indicate the maximum reasonable and safe speed.

Speed Laws
Illegal to exceed Reasonable and safe
speed not relevant Easier to enforce Not fair unless speed
limit set for optimal conditions
Exceeding limit is evidence of traveling at unsafe speed
Recognizes no one speed is safe for all conditions
Post for prevailing conditions
Check against traps
PRIMA FACIE LIMIT ABSOLUTE LIMIT
Methods Used To Set Speed Limits
Arbitrary ....lack funds & personnel
Political Pressure ....based on complaints and reactions to accidents
Traffic engineering ....based on traffic and road characteristics...but
still somewhat subjective and arbitrarily applied

Current Practice
States Locals85th percentile speed 100 86Roadside development 85 77Accident experience 79 81Adjacent limits 71 4510 mph pace 67 34Roadway geometrics 67 57Average test run speed 40 50Pedestrian activity 40 50
SPEEDLIMIT
85PERCENTILE

Requirements of Speed Limits
Be fair Be related to risk Be credible and
accepted by drivers Enforce control over
unreasonable behavior
SPEEDLIMIT
85PERCENTILE

Speed and Accident Risk
Safest near mean speed of traffic
Roads with highest speeds are safest
Limit should be set at upper end of low risk band
0
2
4
6
8
10
12
ACCIDENTS
Freeway
Main Rural
Two Lane
OVERTAKINGS
0 5 10 15 20-5-10-15-20
Relative Risk
Deviation from mean speed, mi/h

Accident Risk in Built-up Areas
0
2
4
6
8
10
12
14
Percentile Speed
5 15 50 85 95 100

Speed of traffic best indicator of reasonable and safe speed
0
2
4
6
8
0 5 10 15 20-5-10-15-20
Relative Risk
Deviation from mean speed, mph
OVERTAKINGS
ACCIDENTINVOLVEMENT
SPEEDLIMIT
85PERCENTILE

Driver Acceptance 30% nationwide Range from 3-100% Worse with low limit Better in west/midwest Better w/prima facie Only 1 speed zone in
10 better than 50 percent compliance
Group Mean %
%Compliance

Most Limits Set Way Below Prevailing Speed
Prevailing speeds 8-12 mph above limit
Trucks 3 mph slower Speeds vary 4-8 mph
over a 24-hr day No difference between
weekday & weekend
0
10
20
30
40
50
60
25 30 35 40 45 50
Speed Limit, mi/h
85 %tile Average
Operating Speed

Factors Influencing Speeds
Number of access points along road
Commercial development
Severe curvature Level of accidents Adverse weather
Minimum Design Speed All geometric elements must meet or exceed Only when constrained by terrain or
development is minimum used Maximum safe speed for worst driver under
bad road conditions Reaction time of drunk drivers, stopping
with bald tires on slippery road, average comfort level of blind folded passengers in 1930 vintage car

Raising limit has little effect on prevailing speed of traffic

Lowering limit doesn’t slow traffic

Little or no change in behavior
-5
-4
-3
-2
-1
0
1
2
3
4
5 C
hang
e in
85t
h P
erce
ntile
Spe
ed, m
i/h
-15 & -20 -10 -5 +5 +10 & +15
Change in Posted Speed Limit, mi/h
AverageChange
MaximumIncrease
MaximumDecrease

Compliance before and after change
0
10
20
30
40
50
60
70
80
90
100
Per
cent
age
of D
river
Com
plia
nce
-15 & -20 -10 -5 +5 +10 & +15
Change in Posted Speed Limit, mi/h
93
82
68
25
15
26
36 39
55
66
Before After

Accidents Before & After
Per
cent
Cha
nge
in C
rash
es
-50
-40
-30
-20
-10
0
10
20
30
40
50
Lowering Speed Limit Raising Speed Limit
-10.4
-25.2
+6.9
-11.3
+27.5
+5.3
Upper Estimate
Lower Estimate
Best Estimate
Most speed limits set unreasonably low
Make technical violators out of large percent of motorists driving at safe speed
Current speed limits do not reflect accident risk Inconsistent with traffic law system Misallocates enforcement resources
Most motorists drive at a speed road and traffic permits regardless of posted speed Don’t automatically drive 5 mph over limit
Speed limits have lost their informational value Engineering of credible limits which are appropriate and enforceable the
key to managing risk
What We’ve Learned
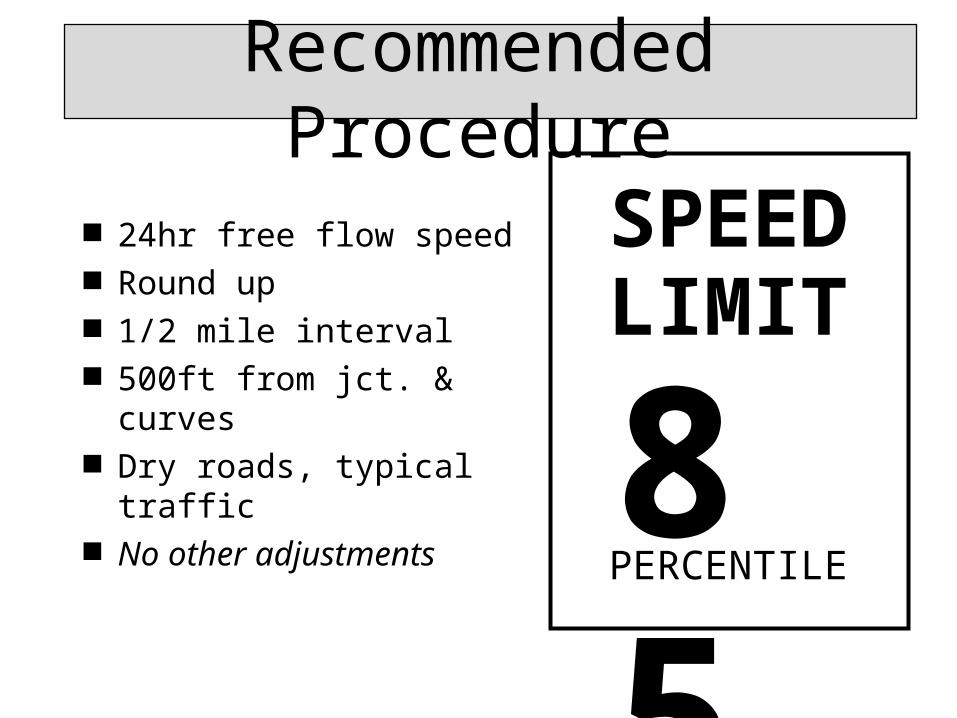
Recommended Procedure
85PERCENTILE
SPEEDLIMIT
24hr free flow speed Round up 1/2 mile interval 500ft from jct. & curves Dry roads, typical traffic No other adjustments

Design Speed vs
Maximum Curve Speed
Source: FHWA-RD-89-226
Design Min. Tolerable Min. Impending Impending Rollover
Speed E Lateral Gs Radius Skid (wet) Skid (dry) Car
40 mi/h 0.06 0.15 509’ 63.3 mi/h 87.5 mi/h 98.1 mi/h
70 mi/h 0.06 0.10 2,083’ 120.7 mi/h 177.0 mi/h 198.4 mi/h
Car: f(dry) = 0.65

Special Zones
School zone - • Base on average speeds when children present
• Restrict to 15 -30 minutes periods when kids present
Work zones• Base on average speed during good conditions
• Use warning sign for hidden hazards & post advisory speed at average speed of traffic when hazard exits
• Vary limit based on speeds when work in progress

Residential Areas
Post at 85% rounded to nearest
If lower limit desired, must change the road environment
Road humps, traffic circles, etc.
Confine engineering measures to small area

General Approach Engineer rational speed limits Educate and inform public
Hazards of traveling too fast or too slow Limits engineered to be safe & reasonable
Strict enforcement and adjudication Eliminate tolerances & inform judiciary
Evaluate Effects on drivers, safety, police, courts
SPEEDLIMIT
85PERCENTILE

Key Benefits Respect for law and enforcement Effective allocation of resources Deterrent to excessive speed by clearly separating
occasional violator from majority Reduce conflicts caused by large variations in
travel speeds Improved road safety and better use of roads
SPEEDLIMIT
85PERCENTILE

Federal Fund$ Available
Engineering Education
Enforcement Evaluation

$ Mileage of roads to be rezoned by class Frequency and duration of speed studies Public information and outreach plans Enforcement and judicial cooperation Evaluation Estimated total cost and cost share
Next Step-Application to practice

Where to get more information
Greg NovakFederal Highway Administration705 N. Plaza Street, Suite 220Carson City, NV 89701 775.687.1204fax 775.687.3803Email: [email protected] SPEED
LIMIT
85PERCENTILE


