On Strategy Maps and Balanced Scorecard
Ziya G. Boyacigiller
This presentation was created and given by Ziya Boyacigiller who was leading Angel Investor and a loved mentor to many young entrepreneurs in Turkey. We have shared it on the web for everyone’s benefit. It is free to use but please cite Ziya Boyacigiller as the source when you use any part of this presentation. For more about Ziya Boyacigiller’s contributions to the start-up Ecosystem of Turkey, please go to www.ziyaboyacigiller.com

2Ziya G. Boyacigiller © 2005
Pulling It All Together
With “Strategy Maps” and “Balanced
Scorecard”Ziya G. BoyacıgillerSabancı Ünıversitesi
3Ziya G. Boyacigiller © 2005
Question: Now What?
You get a new job. First thing you do is to apply what you learned in this class to your new company. You create and develop some powerful ideas as to what is wrong, or missing, or needs improvement… You develop a vision and a strategy.
• What would you do next? • How would you like the upper
management to measure the company’s performance?
• How would you know if you are gaining or losing ground?
4Ziya G. Boyacigiller © 2005
Focusing question becomes:
Which activity do we measure to control the
company’s performance?

5Ziya G. Boyacigiller © 2005
In an airplane, reliance on one dial can be fatal…
…that is why pilots need multiple dials in the
cockpit.

6Ziya G. Boyacigiller © 2005
“…no single measure can provide a clear performance target
or focus attention on the critical areas of a
business” – which is a complex system of activities and interacts with external
environment…
7Ziya G. Boyacigiller © 2005
…that is why we need a “Balanced ScoreCard”
(BSC)BSC shows both:• Financial Measures – that tell the
results of actions already taken, and
• Operational Measures – that are the drivers of future performance (measures such as customer satisfaction, internal processes, innovation & growth activities)
8Ziya G. Boyacigiller © 2005
A “business” needs more than an idea…
If you can define:
1. Who is the customer?2. What value (benefits/cost)
proposition do I have?3. How do I deliver that value?
then, stakeholders will follow you. However, stakeholders will ignore you if you only have an “idea”, and you cannot define these three...
9Ziya G. Boyacigiller © 2005
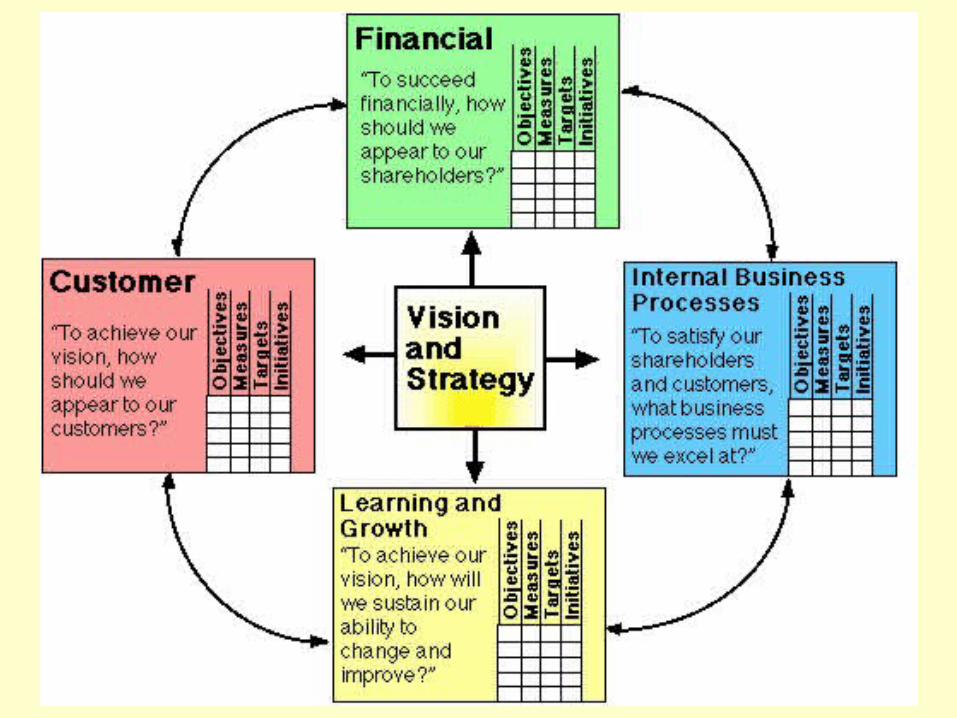
BSC provides answers to 4
essential questions:1. How do customers see us?(customer perspective)
2. What must we excel at?(internal processes perspective)
3. How can we continue to create and improve value?(innovation and growth perspective)
4. How do we look to stakeholders?(financial/corporate perspective)

10Ziya G. Boyacigiller © 2005
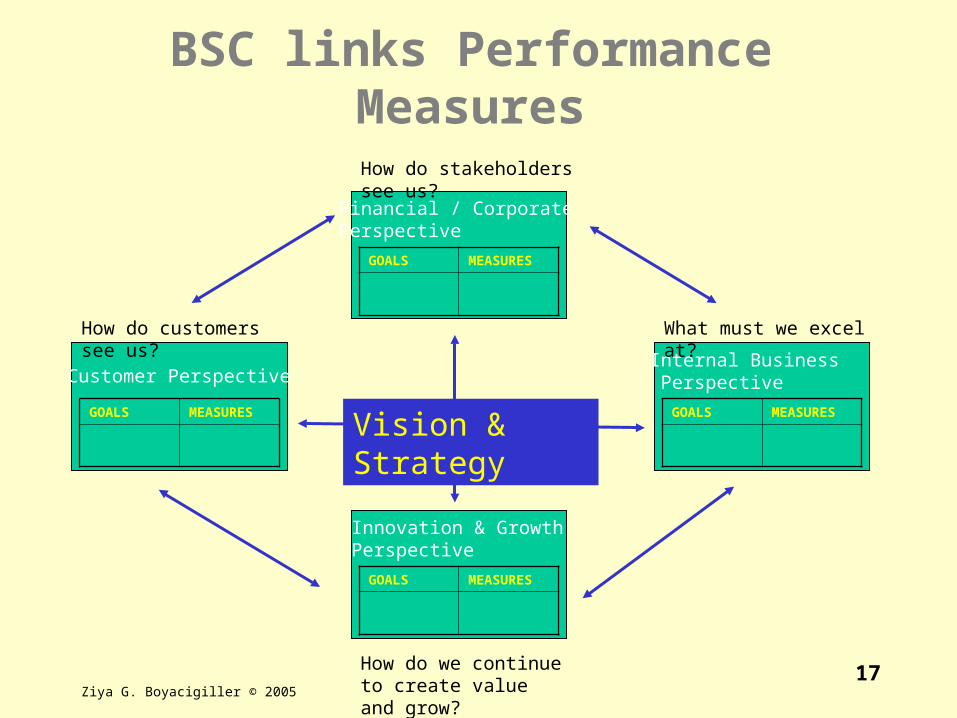
BSC links Performance Measures
Financial / CorporatePerspective
GOALS MEASURES
Internal Business Perspective
GOALS MEASURES
Customer Perspective
GOALS MEASURES
Innovation & GrowthPerspective
GOALS MEASURES
Vision & Strategy
How do customers see us?
How do stakeholders see us?
What must we excel at?
How do we continue to create value and grow?
11Ziya G. Boyacigiller © 2005
Why BSC?(needle in a haystack)
• It is difficult to “focus” on strategic objectives(local optimization vs global optimization)
• It is difficult to identify the conflicting objectives and decide how to proceed
• It is difficult to know “what-to-do” and “what not-to-do”strategic focus
• It is difficult to communicate strategy convincingly (both up, lateral, and down)
• It is difficult to execute strategy• It is difficult to measure performance
(companies rarely suffer from having too few measures. )
12Ziya G. Boyacigiller © 2005
Customer Perspective:
• Customers’ concerns :– 1. Time
(orderdelivery, or definition market)
– 2. Quality (fulfill what customers want -- they will know it
when they see it…)
– 3. Performance & Service (contribute to customers’ value generation
process)
– 4. Cost(enable customers to be in business, address
total cost)
13Ziya G. Boyacigiller © 2005
Examples:
• Producer of very expensive medical equipment:– Equipment up time percentage– Mean-time response to service calls
• Computer company wanted to solve customers’ problems through partnerships– Percentage of third-party revenue

14Ziya G. Boyacigiller © 2005
BSC links Performance Measures
Financial / CorporatePerspective
GOALS MEASURES
Internal Business Perspective
GOALS MEASURES
Customer Perspective
GOALS MEASURES
Innovation & GrowthPerspective
GOALS MEASURES
Vision & Strategy
How do customers see us?
How do stakeholders see us?
What must we excel at?
How do we continue to create value and grow?

15Ziya G. Boyacigiller © 2005
Internal Business Perspective:
• Focus on critical internal processes that will best enable the company to satisfy customer needs.
• Must have information system (backup data) available to understand root-causes of problems.

16Ziya G. Boyacigiller © 2005
Examples:
• HP to measure effectiveness of new product development activities:– BET (breakeven time)
• One company to measure effectiveness of TQM program:– Monthly survey of randomly selected
employees to see if they are aware of the program, had it changed their behavior, believed it worked, etc.
17Ziya G. Boyacigiller © 2005
BSC links Performance Measures
Financial / CorporatePerspective
GOALS MEASURES
Internal Business Perspective
GOALS MEASURES
Customer Perspective
GOALS MEASURES
Innovation & GrowthPerspective
GOALS MEASURES
Vision & Strategy
How do customers see us?
How do stakeholders see us?
What must we excel at?
How do we continue to create value and grow?
18Ziya G. Boyacigiller © 2005
Innovation & Growth Perspective:
• Growth and Innovation improve shareholder value the most, make the company most competitive in time.
• Growth comes from more customers• Innovation results in improved profits
• Organizational Learning & Continuous Improvement are also important factors for growth and innovation.
19Ziya G. Boyacigiller © 2005
Examples:• Plan for growth by hiring 10% of company employees
from universities and by on-the-job training (growth)• Start “break-through projects” as 5% of all new product
development projects (innovation)• Develop 2 new processes per year to obsolete existing
high volume production processes and improve productivity by minimum 200% (innovation)
• Improve new product success (meet/exceed marketing forecast by 3rd year after introduction) by focusing on definition, design, and merchandising processes (organizational learning)
• Improve customer satisfaction ratings 1% per quarter (continuous improvement)

20Ziya G. Boyacigiller © 2005
BSC links Performance Measures
Financial / CorporatePerspective
GOALS MEASURES
Internal Business Perspective
GOALS MEASURES
Customer Perspective
GOALS MEASURES
Innovation & GrowthPerspective
GOALS MEASURES
Vision & Strategy
How do customers see us?
How do stakeholders see us?
What must we excel at?
How do we continue to create value and grow?
21Ziya G. Boyacigiller © 2005
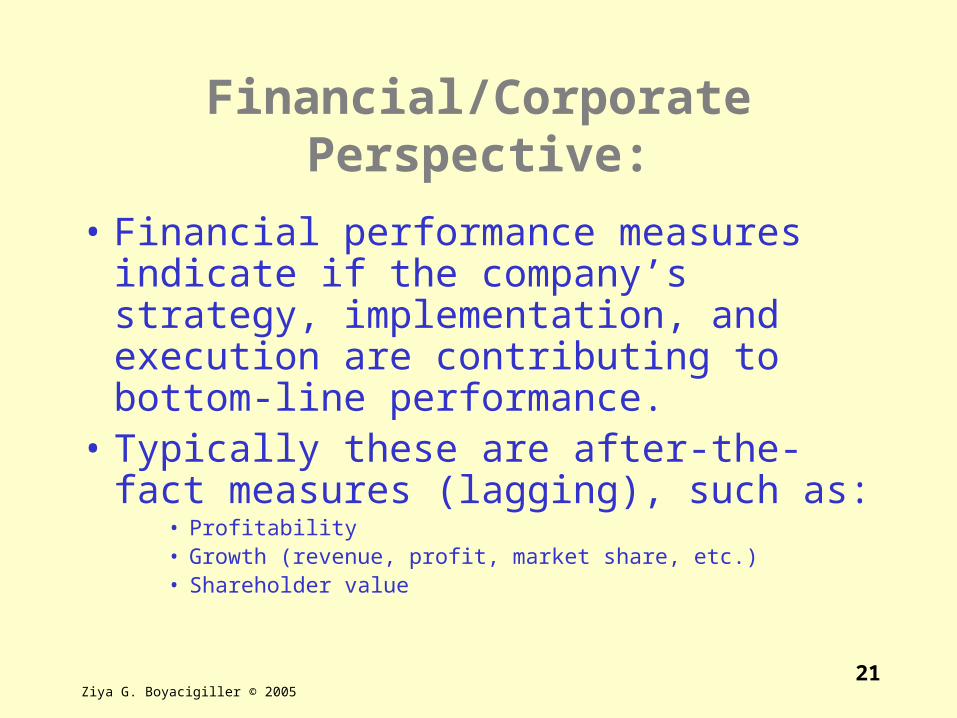
Financial/Corporate Perspective:
• Financial performance measures indicate if the company’s strategy, implementation, and execution are contributing to bottom-line performance.
• Typically these are after-the-fact measures (lagging), such as:
• Profitability• Growth (revenue, profit, market share, etc.)• Shareholder value
22Ziya G. Boyacigiller © 2005
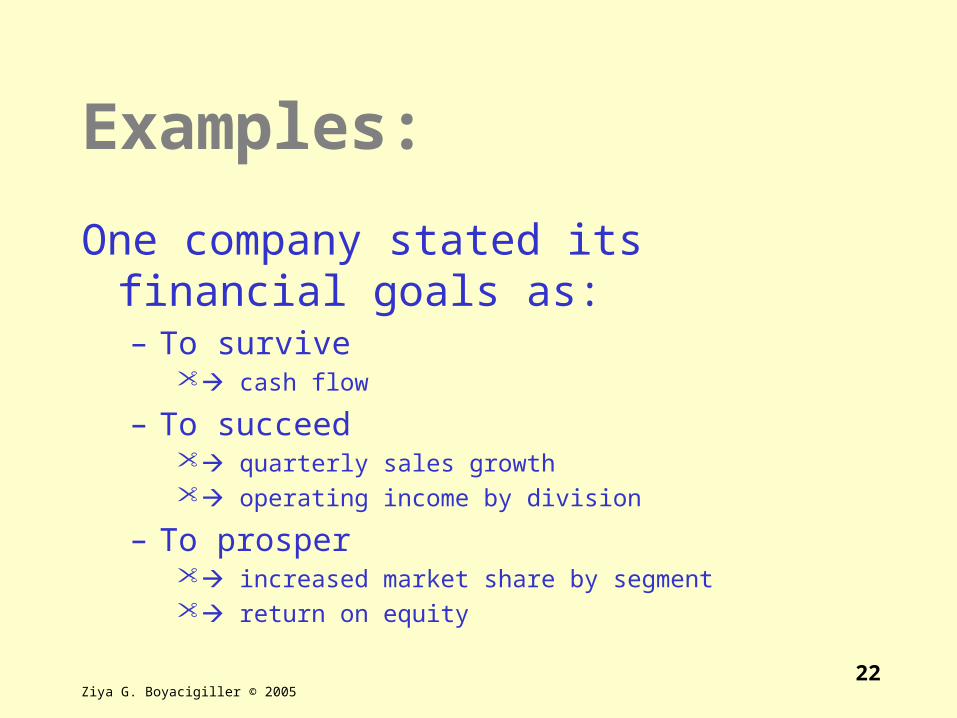
Examples:
One company stated its financial goals as:– To survive
cash flow
– To succeed quarterly sales growth operating income by division
– To prosper increased market share by segment return on equity
23Ziya G. Boyacigiller © 2005
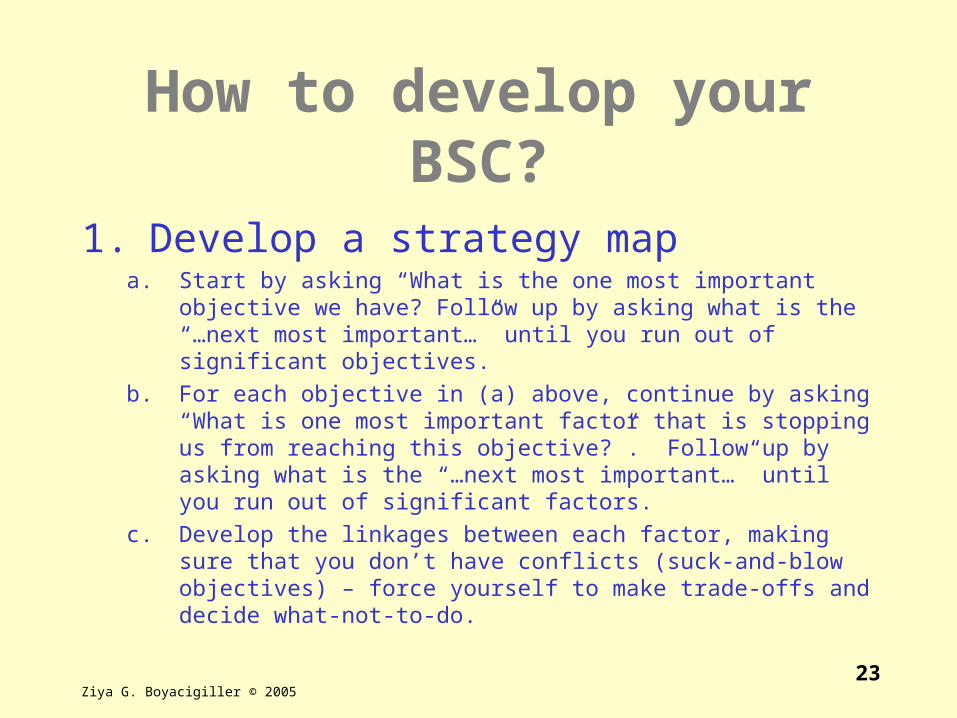
How to develop your BSC?
1. Develop a strategy mapa. Start by asking “What is the one most important objective
we have? Follow up by asking what is the “…next most important…” until you run out of significant objectives.
b. For each objective in (a) above, continue by asking “What is one most important factor that is stopping us from reaching this objective?”. Follow up by asking what is the “…next most important…” until you run out of significant factors.
c. Develop the linkages between each factor, making sure that you don’t have conflicts (suck-and-blow objectives) – force yourself to make trade-offs and decide what-not-to-do.
24Ziya G. Boyacigiller © 2005
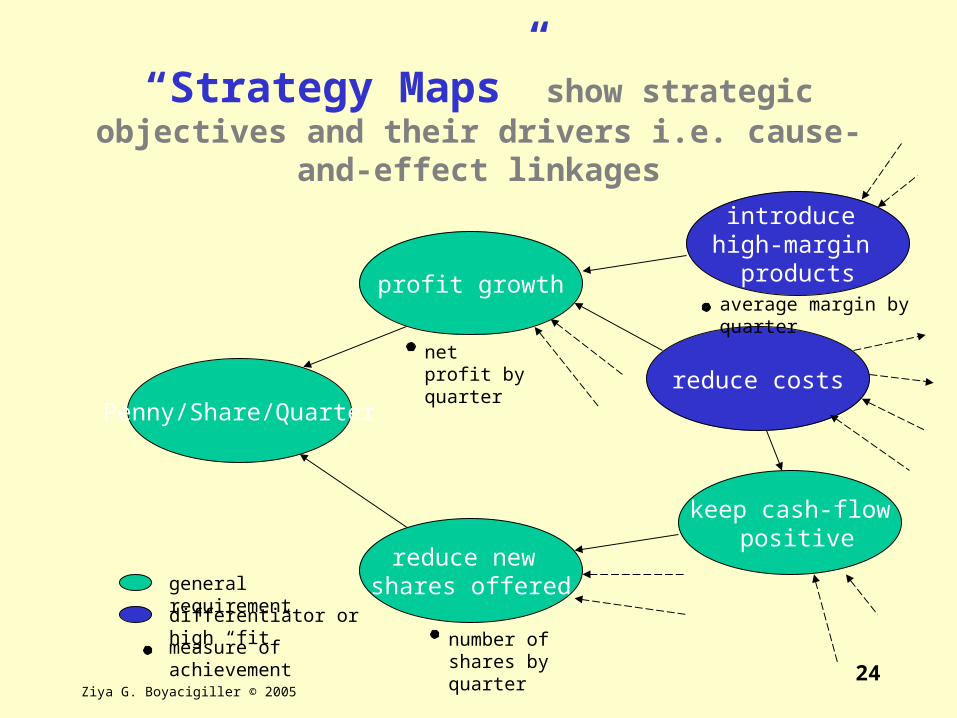
Penny/Share/Quarter
profit growth
reduce new shares offered
reduce costs
keep cash-flow positive
“Strategy Maps” show strategic objectives and their drivers i.e. cause-and-
effect linkagesintroduce
high-margin products
general requirement
differentiator or high “fit”
measure of achievement
net profit by quarter
number of shares by quarter
average margin by quarter
25
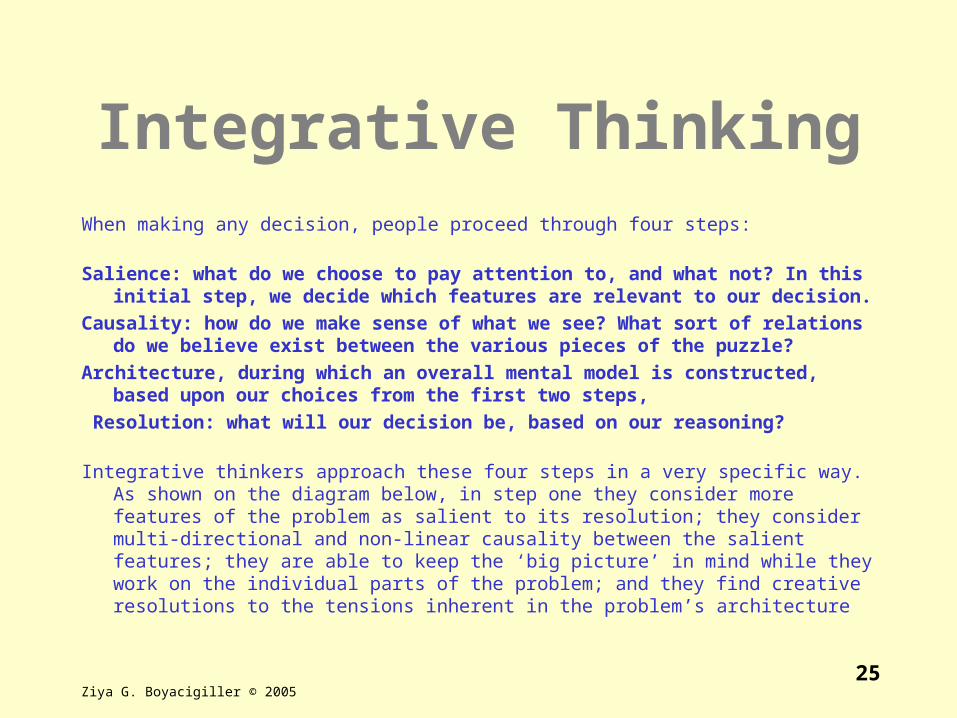
Integrative ThinkingWhen making any decision, people proceed through four steps:
Salience: what do we choose to pay attention to, and what not? In this initial step, we decide which features are relevant to our decision.
Causality: how do we make sense of what we see? What sort of relations do we believe exist between the various pieces of the puzzle?
Architecture, during which an overall mental model is constructed, based upon our choices from the first two steps,
Resolution: what will our decision be, based on our reasoning?
Integrative thinkers approach these four steps in a very specific way. As shown on the diagram below, in step one they consider more features of the problem as salient to its resolution; they consider multi-directional and non-linear causality between the salient features; they are able to keep the ‘big picture’ in mind while they work on the individual parts of the problem; and they find creative resolutions to the tensions inherent in the problem’s architecture
Ziya G. Boyacigiller © 2005
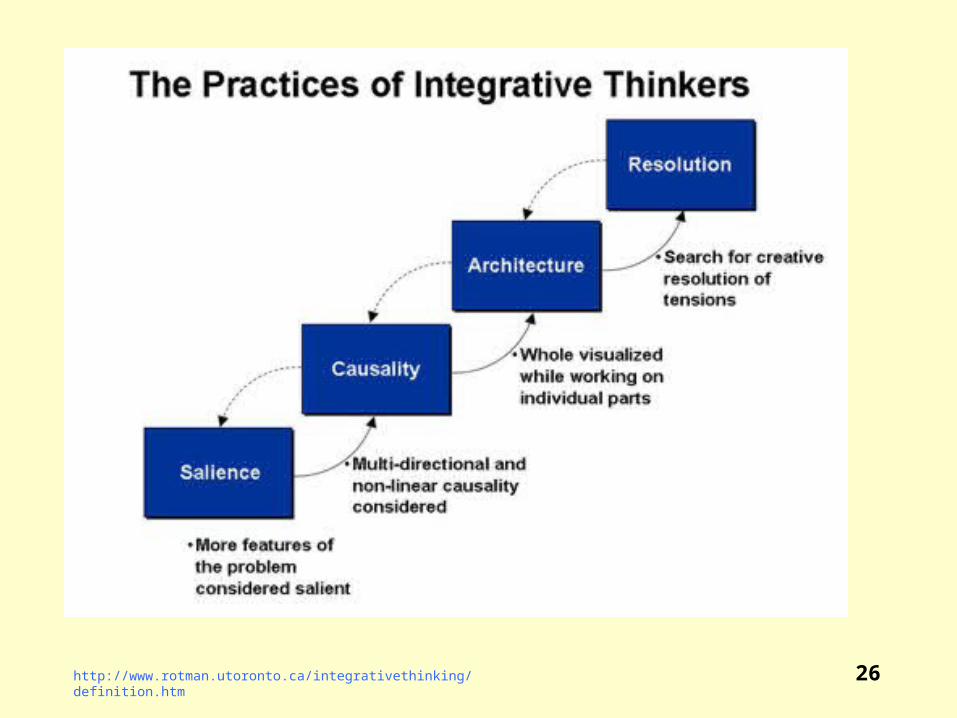
26http://www.rotman.utoronto.ca/integrativethinking/definition.htm
27
IT vs CT(Integrative Thinkers vs Conventional Thinkers)
• Integrative thinkers build models rather than choose between them.
• Their models include consideration of numerous variables — customers, employees, competitors, capabilities, cost structures, industry evolution, and regulatory environment — not just a subset of the above.
• Their models capture the complicated, multi-faceted and multidirectional causal relationships between the key variables in any problem.
• Integrative thinkers consider the problem as a whole, rather than breaking it down and forming out the parts.
• Finally, they creatively resolve tensions without making costly trade-offs, turning challenges into opportunities.
Ziya G. Boyacigiller © 2005

28Ziya G. Boyacigiller © 2005
Penny/Share/Quarter
profit growth
reduce new shares offered
reduce costs
keep cash-flow positive
“Strategy Maps” show strategic objectives and their drivers i.e. cause-and-
effect linkagesintroduce
high-margin products
general requirement
differentiator or high “fit”
measure of achievement
net profit by quarter
number of shares by quarter
average margin by quarter
29Ziya G. Boyacigiller (c) 2007
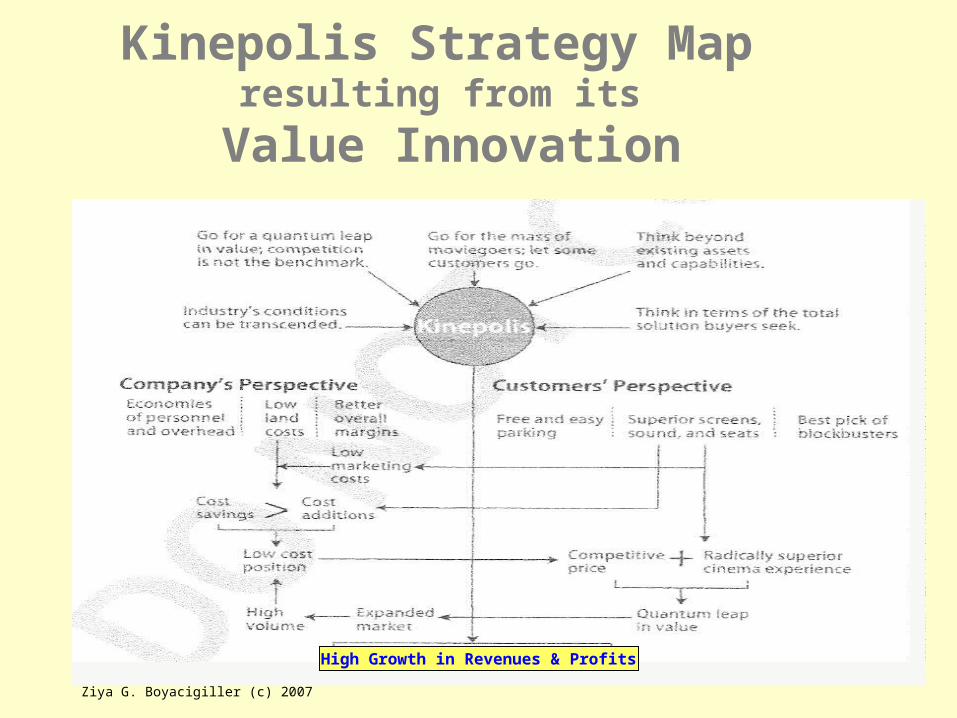
Kinepolis Strategy Map resulting from its
Value Innovation
High Growth in Revenues & Profits
30Ziya G. Boyacigiller © 2005
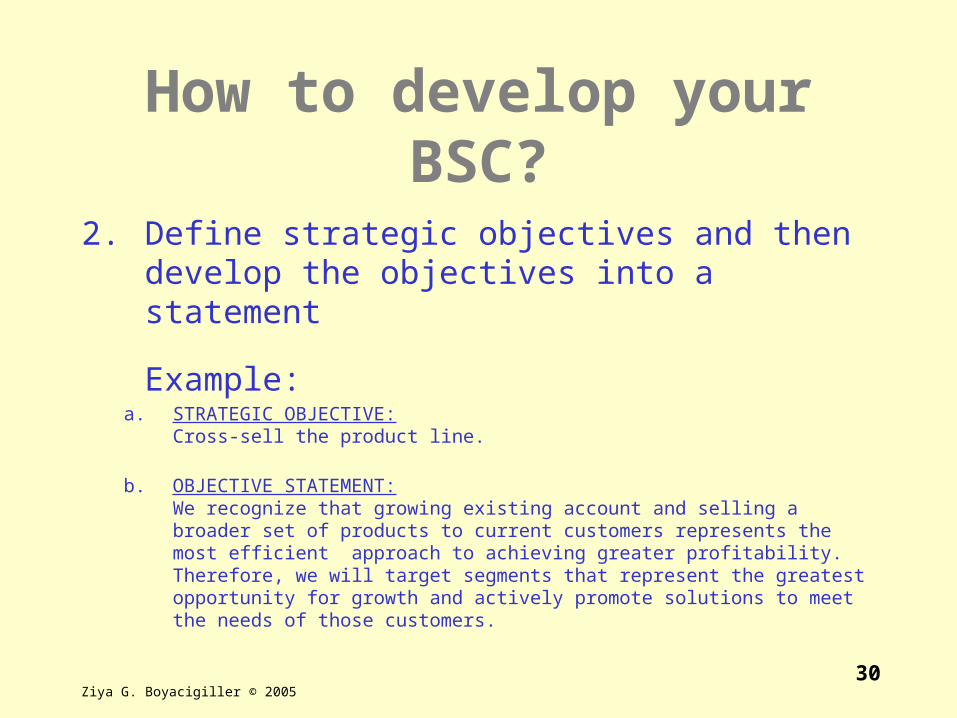
2. Define strategic objectives and then develop the objectives into a statement
Example:a. STRATEGIC OBJECTIVE:
Cross-sell the product line.
b. OBJECTIVE STATEMENT:We recognize that growing existing account and selling a broader set of products to current customers represents the most efficient approach to achieving greater profitability. Therefore, we will target segments that represent the greatest opportunity for growth and actively promote solutions to meet the needs of those customers.
How to develop your BSC?
31Ziya G. Boyacigiller © 2005
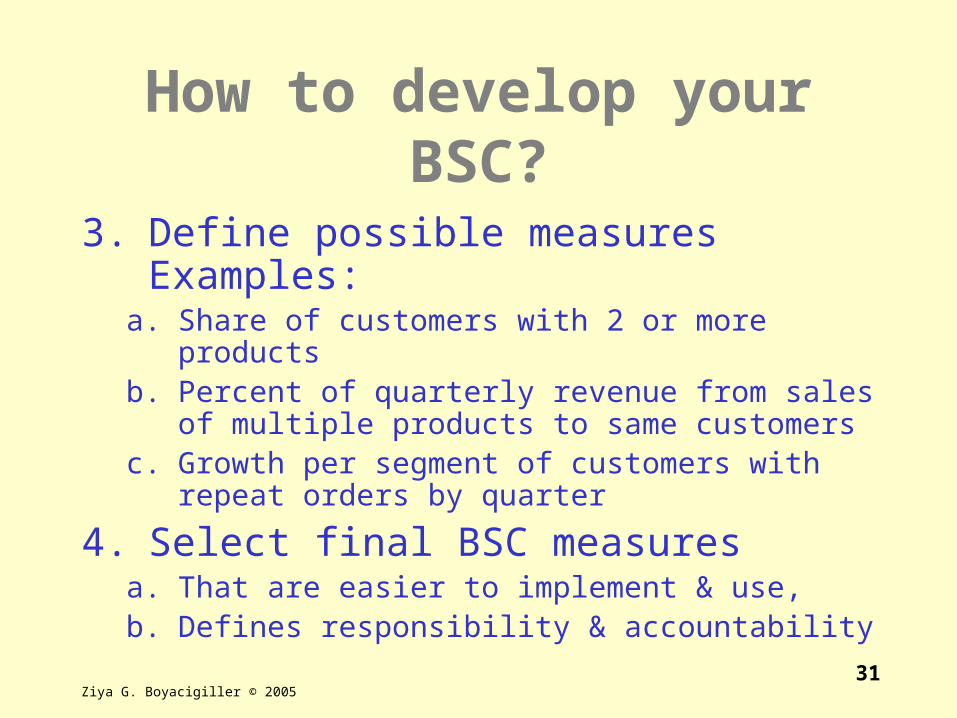
3. Define possible measuresExamples:
a. Share of customers with 2 or more products
b. Percent of quarterly revenue from sales of multiple products to same customers
c. Growth per segment of customers with repeat orders by quarter
4. Select final BSC measuresa. That are easier to implement & use, b. Defines responsibility & accountability
How to develop your BSC?
32Ziya G. Boyacigiller © 2005

33Ziya G. Boyacigiller © 2005
Summary
• Strategy requires Vision
• Vision & Strategy drive the organizational resource allocation and prioritization decisions
• BSC and Strategy Maps drive execution of vision & strategy.


