C O N S U M E R C O N F I D E N C EConCerns and spending intentions around the WorldQUARTER 2, 2013
2013 CONSUMER CONFIDENCE SERIES | 2ND EDITION
2 Quarter 2 2013 - Global Consumer ConfidenCe report2
GlObal CONSUMER CONFIDENCE REPORTED SlOw bUT STEaDy IMPROvEMENTGlobal consumer confidence indexed at 94 in the second quarter, a
one-point increase from the previous quarter (Q1 2013), according to
consumer confidence findings from Nielsen, a leading global provider
of information and insights into what consumers watch and buy. The
increase is part of a slow but steady upward movement reported in the
first half of the year. Consumer confidence improvements were reported
in Asia-Pacific (+2 to 105), North America (+2 to 96), and Middle East/
Africa (+6 to 91), compared to the previous quarter. Europe’s consumer
confidence index held steady at 71 for three consecutive quarters, and
Latin America’s confidence declined one index point to 93 in Q2.
GLOBALLY • Global consumer confidence increased one index point to 94 in Q2
REGIONALLY• Quarterly confidence rose in all regions except Latin America
• North American recessionary sentiment dropped to lowest level
since the Great Recession
• European respondents remained stuck in a spending holding pattern
• Confidence in Middle East/Africa returned to Q4 2012 levels
• Discretionary spending intentions improved in Asia-Pacific
3Copyright © 2013 The Nielsen Company
The Nielsen Global Survey of Consumer Confidence and Spending
Intentions, established in 2005, measures consumer confidence,
major concerns and spending intentions among more than 29,000
respondents with Internet access in 58 countries. Consumer confidence
levels above and below a baseline of 100 indicate degrees of optimism
and pessimism.
“While confidence in Europe remained largely in a holding pattern
as financial conditions stabilized, perceptions about jobs, personal
finances and spending intentions increased in the world’s three largest
economies, U.S., China and Japan, which is having a beneficial effect
around the world,” said Dr. Venkatesh Bala, chief economist at The
Cambridge Group, a part of Nielsen. “However, concerns remain that
macroeconomic events, such as too sharp a rise in interest rates, can
impair the consumer recovery including lowering the demand for home
purchases and spending on big-ticket items.”
Japan’s consumer confidence index of 78 rose five points in the second
quarter, its highest reading since Q1 2006, amid government stimulus
measures intended to jolt the economy out of almost two decades of
stagnation. In the U.S., a robust rebound in housing and equity markets
has helped to elevate confidence levels to a score of 96, an increase of
three index points in the second quarter. In China, consumer confidence
rose two index points to 110 in the second quarter.
In the latest round of the survey, conducted between May 13 and May 31,
2013, consumer confidence increased in 45 percent of markets measured
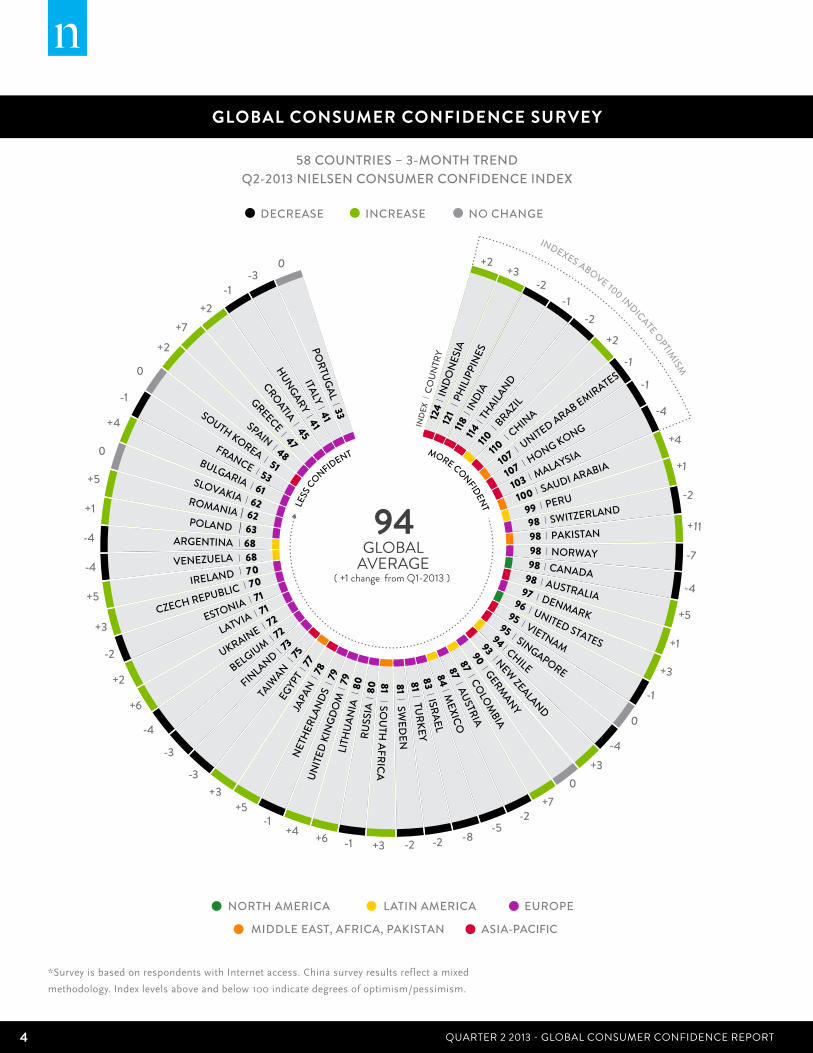
by Nielsen, compared to 60 percent in the previous quarter. Indonesia
(124) reported the highest consumer confidence index for the second
consecutive quarter with a two point increase from Q1 2013. Portugal
reported the lowest index of 33. Pakistan reported the biggest quarterly
index increase of 11 points to a score of 98. Israel’s drop of eight index
points to 83 was the biggest quarterly decline.
3Copyright © 2013 The Nielsen Company
ABOUT THE GLOBAL SURVEY METHODOLOGYThe findings in this survey are based on respondents with online
access across 58 countries. While an online survey methodology
allows for tremendous scale and global reach, it provides a
perspective only on the habits of existing Internet users, not total
populations. In developing markets where online penetration
has not reached majority potential, audiences may be younger
and more affluent than the general population of that country.
Additionally, survey responses are based on claimed behavior,
rather than actual metered data.
4 Quarter 2 2013 - Global Consumer ConfidenCe report
+3-2
-1-2
+2
-1
-1
-4
+4
+1
-2
+11
-7
-4
+5
+1
+3
-1
0
-4+3
0+7
-2-5
-8-2-2+3-1+6+4-1
+3-3
-3
-4
+6
+2
-2
+3
+5
-4
-4
+1
+5
0
+4
-1
0
+2+7
+2-1
-3
+5
81 SOU
TH AFRICA
81 SWED
EN 81 TU
RKEY 83 ISRAEL
84 MEXICO
87 AUSTRIA
ITALY 41
87 COLOMBIA
HUNGARY 41
90 GERMANY
CROATIA 45
GREECE 47
93 NEW ZEALAND
SPAIN 48
94 CHILE
SOUTH KOREA 51
95 SINGAPORE
FRANCE 53
95 VIETNAM
BULGARIA 61
96 UNITED STATES
SLOVAKIA 62
97 DENMARK
ROMANIA 62
98 AUSTRALIA
POLAND 63
98 CANADA
ARGENTINA 68 98 NORWAYVENEZUELA 68
98 PAKISTAN
IRELAND 70
98 SWITZERLAND
CZECH REPUBLIC 70
99 PERU
ESTONIA 71
100 SAUDI ARABIA
LATVIA 71
103 MALAYSIA
UKRAINE 72
107 HONG KONG
BELGIUM 72
107 UNITED ARAB EMIRATES
FINLAND 7
3
110 C
HINA
TAIW
AN
75
110
BRAZIL
EGYPT 77
114
THAILA
ND
JAPA
N 78
118
INDIA
NET
HERL
ANDS
7
9
121
PHI
LIPP
INES
UNIT
ED K
INGD
OM
79
LITH
UAN
IA
80
RUSS
IA
80
0
PORTUGAL 33
+2
124
INDO
NES
IA
IND
EX
COUN
TRY
LESS
CONFIDENT
MORE CONFIDENT
NORTH AMERICA LATIN AMERICA EUROPE
MIDDLE EAST, AFRICA, PAKISTAN ASIA-PACIFIC
94 GLOBAL
AVERAGE( +1 change from Q1-2013 )
INDEXES ABOVE 100 INDICATE OPTIMISM
GLOBAL CONSUMER CONFIDENCE SURVEY
58 COUNTRIES – 3-MONTH TRENDQ2-2013 NIELSEN CONSUMER CONFIDENCE INDEX
*Survey is based on respondents with Internet access. China survey results reflect a mixed
methodology. Index levels above and below 100 indicate degrees of optimism/pessimism.
5Copyright © 2013 The Nielsen Company
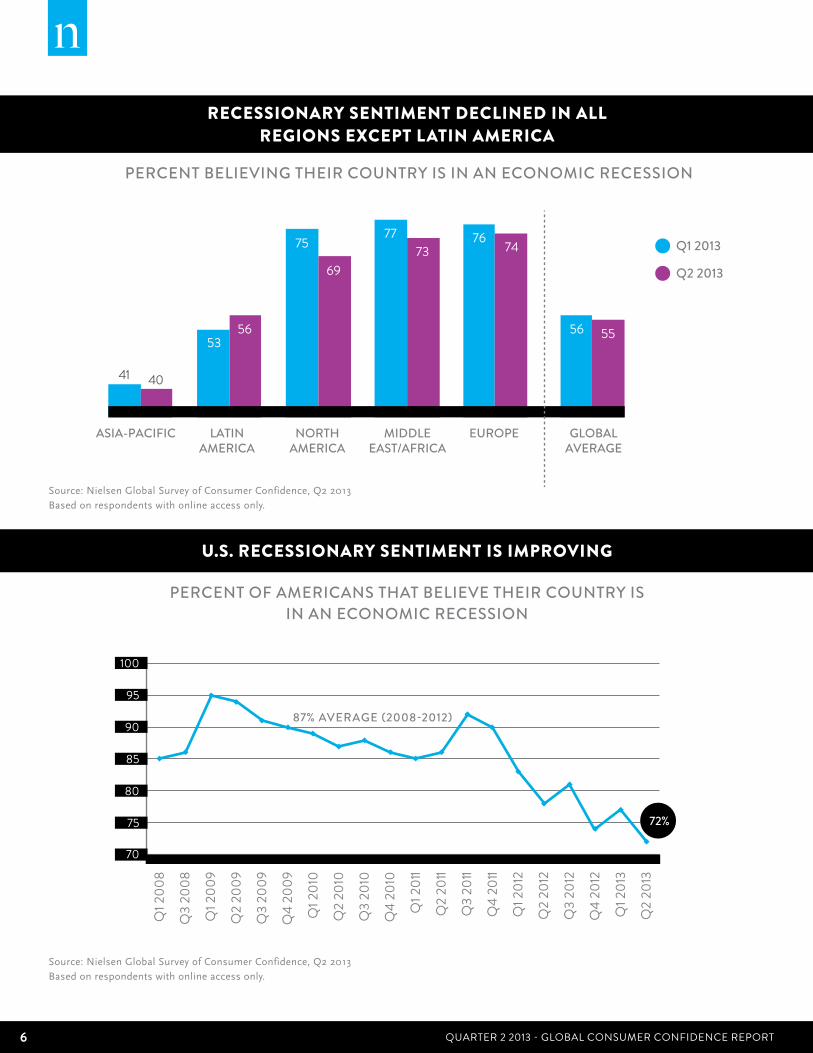
a DISMal RECESSIONaRy SENTIMENT bRIGHTENED While more than half (55%) of global respondents believed they were in
a recession in the second quarter, it was the lowest level reported in two
years (since Q1 2011). North Americans reported the biggest three-month
recessionary mindset decline of six percentage points to 69 percent, which
is noteworthy considering a level below 70 percent has not been reached
since before the Great Recession.
“The improved recessionary sentiment among North Americans was driven
by positive macro-economic developments in the U.S.,” said Dr. Bala.
Seventy-two percent of U.S. respondents said they were in a recession—a
five percentage point improvement from Q1 and a 15-percentage point
change from a five-year average (2008–2012), when 87 percent of
Americans felt mired in a recession. Concern about the U.S. economy also
reported a marked decline of eight percentage points among American
respondents in the second quarter, dropping to 19 percent.
“There is increasing evidence that the U.S. economy is improving,” said
James Russo, senior vice president, Global Consumer Insights, Nielsen.
“While the unemployment rate is trending steadily downward to the
current 7.6 percent, the biggest drivers of change include the record gains
in equity markets and the housing rebound, which are clearly impacting
household wealth and spending potential.”
Second-quarter recessionary sentiment declines were also reported in
Middle East/Africa, which dropped four percentage points to 73 percent,
in Europe, which fell two points to 74 percent, and in Asia-Pacific, which
declined one percentage point to 40 percent. In Latin America, a growing
recessionary sentiment was reported, increasing three percentage points
since the start of the year to 56 percent.
58 COUNTRIES – 3-MONTH TRENDQ2-2013 NIELSEN CONSUMER CONFIDENCE INDEX
6 Quarter 2 2013 - Global Consumer ConfidenCe report
Q1 2
008
Q3
2008
Q1 2
009
Q2
2009
Q3
2009
Q4
2009
Q1 2
010
Q2
2010
Q3
2010
Q4
2010
Q1 2
011
Q2
2011
Q3
2011
Q4
2011
Q1 2
012
Q2
2012
Q3
2012
Q4
2012
Q1 2
013
Q2
2013
70
75
80
85
90
95
100
72%
reCessionary sentiment deClined in all regions exCept latin ameriCa
u.s. reCessionary sentiment is improving
41 40
53 56
75
69
77 73
76 74
56 55
ASIA-PACIFIC LATIN AMERICA
NORTH AMERICA
MIDDLE EAST/AFRICA
EUROPE GLOBAL AVERAGE
Q1 2013
Q2 2013
PERCENT bELIEvINg THEIR COUNTRy IS IN AN ECONOMIC RECESSION
PERCENT OF AMERICANS THAT bELIEvE THEIR COUNTRy IS IN AN ECONOMIC RECESSION
87% AvERAgE (2008-2012)
Source: Nielsen Global Survey of Consumer Confidence, Q2 2013Based on respondents with online access only.
Source: Nielsen Global Survey of Consumer Confidence, Q2 2013Based on respondents with online access only.
7Copyright © 2013 The Nielsen Company
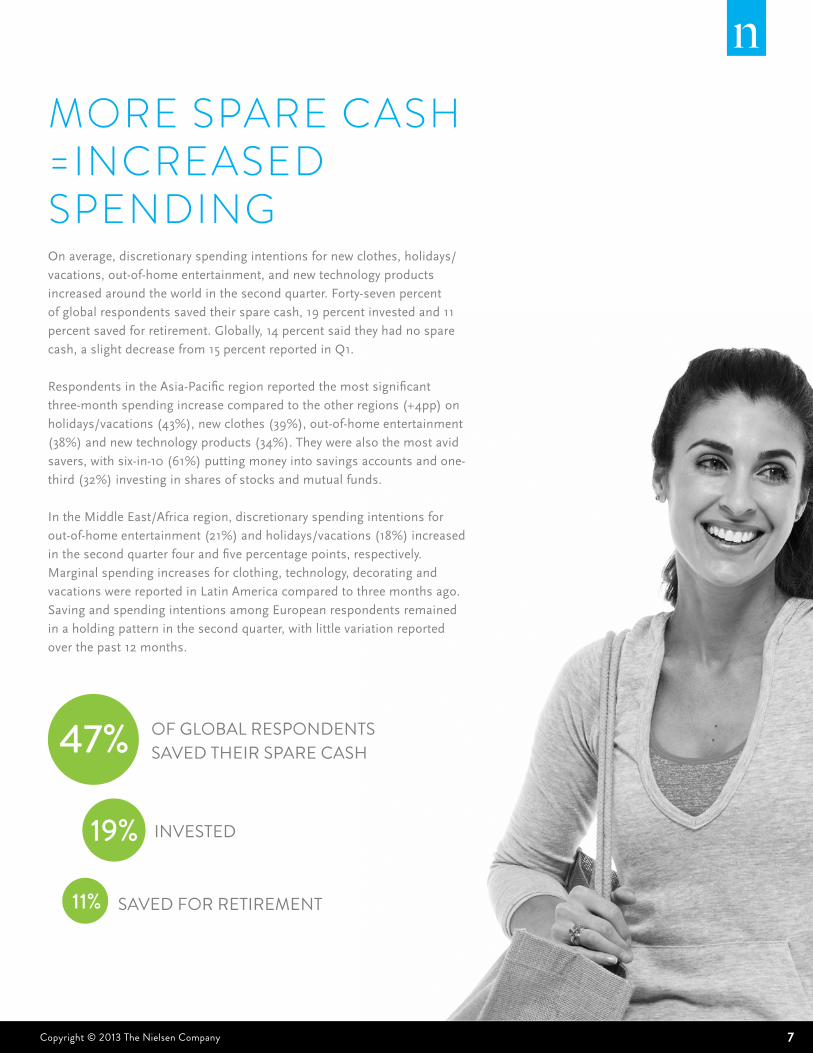
MORE SPaRE CaSH=INCREaSED SPENDING On average, discretionary spending intentions for new clothes, holidays/
vacations, out-of-home entertainment, and new technology products
increased around the world in the second quarter. Forty-seven percent
of global respondents saved their spare cash, 19 percent invested and 11
percent saved for retirement. Globally, 14 percent said they had no spare
cash, a slight decrease from 15 percent reported in Q1.
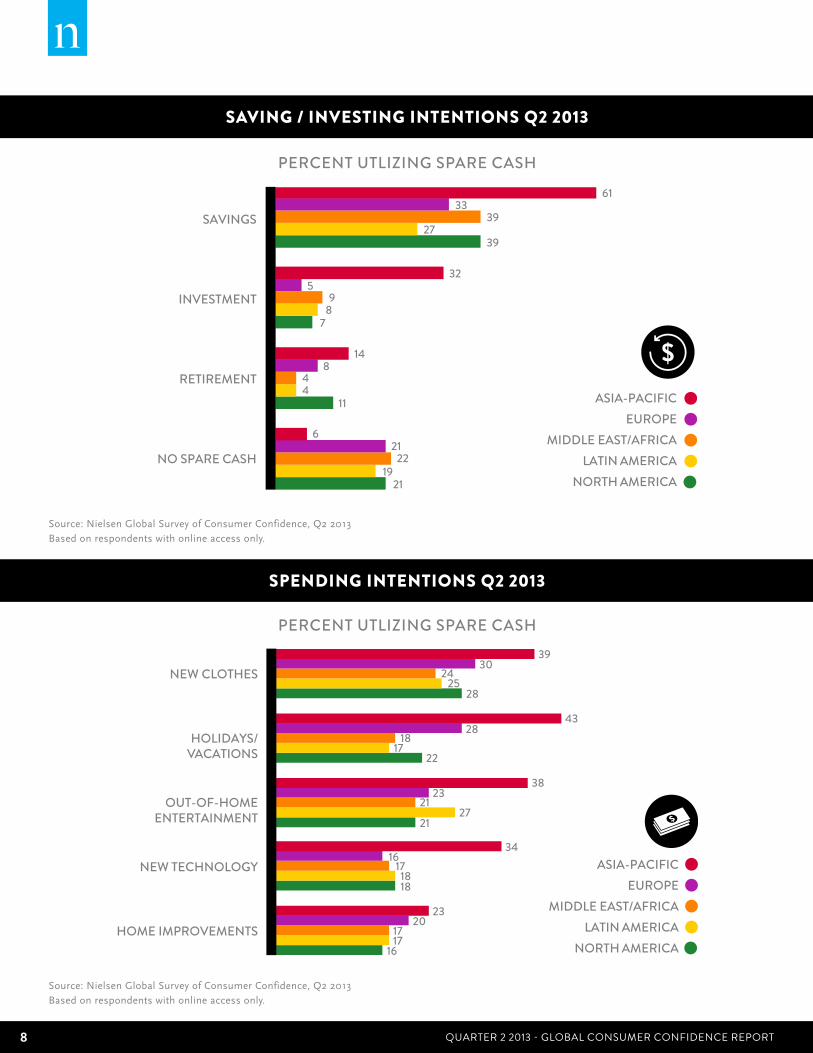
Respondents in the Asia-Pacific region reported the most significant
three-month spending increase compared to the other regions (+4pp) on
holidays/vacations (43%), new clothes (39%), out-of-home entertainment
(38%) and new technology products (34%). They were also the most avid
savers, with six-in-10 (61%) putting money into savings accounts and one-
third (32%) investing in shares of stocks and mutual funds.
In the Middle East/Africa region, discretionary spending intentions for
out-of-home entertainment (21%) and holidays/vacations (18%) increased
in the second quarter four and five percentage points, respectively.
Marginal spending increases for clothing, technology, decorating and
vacations were reported in Latin America compared to three months ago.
Saving and spending intentions among European respondents remained
in a holding pattern in the second quarter, with little variation reported
over the past 12 months.
47% OF GLOBAL RESPONDENTS SAVED THEIR SPARE CASH
19% INVESTED
SAVED FOR RETIREMENT11%
8 Quarter 2 2013 - Global Consumer ConfidenCe report
saving / investing intentions Q2 2013
spending intentions Q2 2013
16
18
21
22
28
17
18
27
17
25
17
17
21
18
24
20
16
23
28
30
23
34
38
43
39
HOME IMPROVEMENTS
NEW T ECHNOLOGY
OUT-OF-HOMEENTERTAINMENT
HOLIDAYS/VACATIONS
NEW CLOTHES
ASIA-PACIFIC EUROPE
MIDDLE EAST/AFRICA LATIN AMERICA
NORTH AMERICA
21
11
7
39
19
4
8
27
22
4
9
39
21
8
5
33
6
14
32
61
NO SPARE CASH
RETIREMENT
INVESTMENT
SAVINGS
ASIA-PACIFIC EUROPE
MIDDLE EAST/AFRICA LATIN AMERICA
NORTH AMERICA
Source: Nielsen Global Survey of Consumer Confidence, Q2 2013Based on respondents with online access only.
Source: Nielsen Global Survey of Consumer Confidence, Q2 2013Based on respondents with online access only.
PERCENT UTLIZINg SPARE CASH
PERCENT UTLIZINg SPARE CASH
9Copyright © 2013 The Nielsen Company
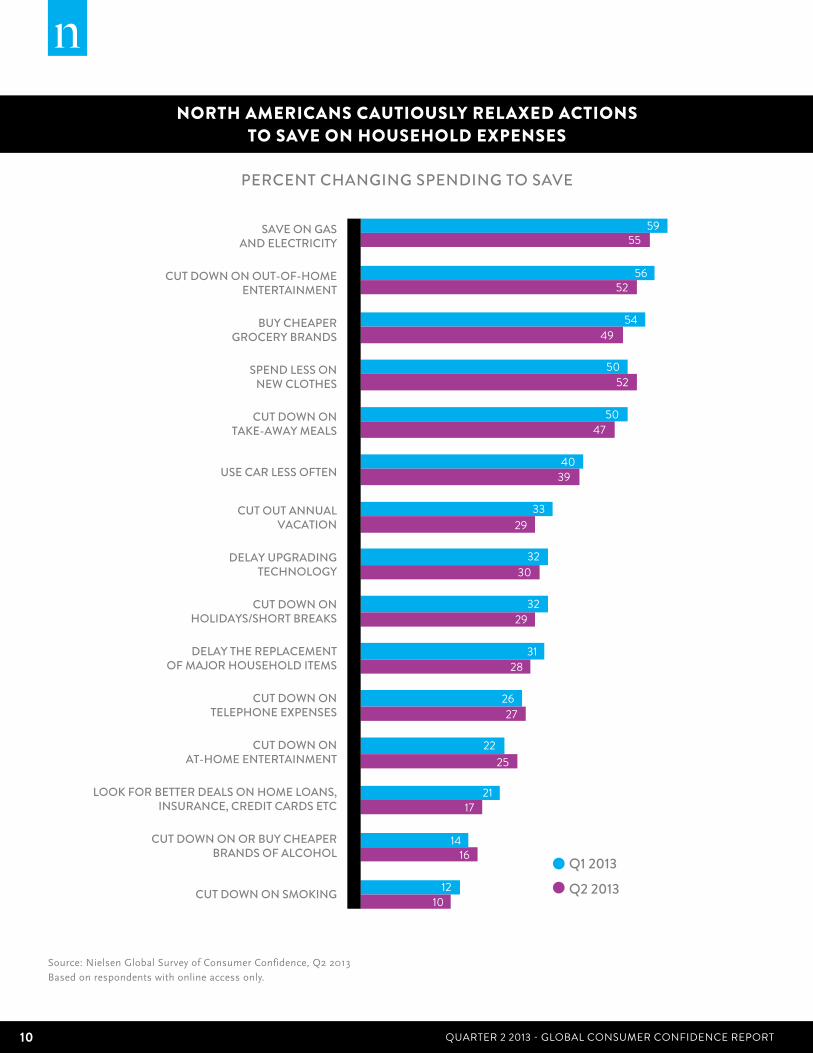
bElT-TIGHTENING MEaSURES lOOSENED IN THE UNITED STaTESOne-fifth (21%) of North Americans reported having no spare cash, which was an improvement from 26 percent reported in the first quarter. With more discretionary income to spend, North Americans loosened the reins on actions taken to save on household expenses, albeit cautiously. Declining four percentage points from the first quarter, fewer North American respondents said they saved on gas and electricity (55%), out-of-home entertainment (52%) and vacation (29%) expenses. Less than half (49%) said they were switching to cheaper grocery brands, a decline of five percentage points from three months ago. Fewer respondents also cut down on take-away meals (47%) and delayed the replacement of major household items (28%).
“In the U.S., improved sentiment is converting to dollar sales at the cash register,” said Russo. “For the period ending May 11, 2013, dollar and unit sales were both up, rising 3.4 percent and 2 percent, respectively, compared to year-ago performance. There is a watch-out, however. While U.S. confidence in the economy has shown improvement, more than half of respondents (55%) still believe the recession will live on for another year.”
In Canada, consumer confidence declined four index points in the second quarter to a score of 98. “The recent decline in Canadian sentiment is a testimony of the consumer volatility that still exists and we’re still not out of the woods,” said Carman Allison, director, Shopper and Industry Insights, Nielsen Canada. “Based on economic projections, we expect 2013 to be a relatively slow growth year for Canada’s economy. Record high consumer debt, stabilized home prices and a slowing equities market have restrained household spending power. As consumers continue to focus on spend control, expect a repeat performance of 2012, when consumer package goods growth stalled and more consumers shopped at discount retailers.”
10 Quarter 2 2013 - Global Consumer ConfidenCe report
north ameriCans Cautiously relaxed aCtions to save on household expenses
59 55
56 52
54 49
50 52
50 47
40 39
33 29
32 30
32 29
31 28
26 27
22 25
21 17
14 16
12 10
SAVE ON GAS AND ELECTRICITY
CUT DOWN ON OUT-OF-HOME ENTERTAINMENT
BUY CHEAPERGROCERY BRANDS
SPEND LESS ONNEW CLOTHES
CUT DOWN ONTAKE-AWAY MEALS
USE CAR LESS OFTEN
CUT OUT ANNUALVACATION
DELAY UPGRADINGTECHNOLOGY
CUT DOWN ONHOLIDAYS/SHORT BREAKS
DELAY THE REPLACEMENTOF MAJOR HOUSEHOLD ITEMS
CUT DOWN ONTELEPHONE EXPENSES
CUT DOWN ONAT-HOME ENTERTAINMENT
LOOK FOR BETTER DEALS ON HOME LOANS,INSURANCE, CREDIT CARDS ETC
CUT DOWN ON OR BUY CHEAPERBRANDS OF ALCOHOL
CUT DOWN ON SMOKING
Q1 2013
Q2 2013
Source: Nielsen Global Survey of Consumer Confidence, Q2 2013Based on respondents with online access only.
PERCENT CHANgINg SPENDINg TO SAvE
11Copyright © 2013 The Nielsen Company
SPENDING IN EUROPE STaGNaTED; aCTIONS TO SavE INCREaSED Europeans were in a spending holding pattern in the second quarter and actions to save on household expenses increased as unemployment rates in many European markets were high and confidence in the economic outlook for the rest of the year remained weak.
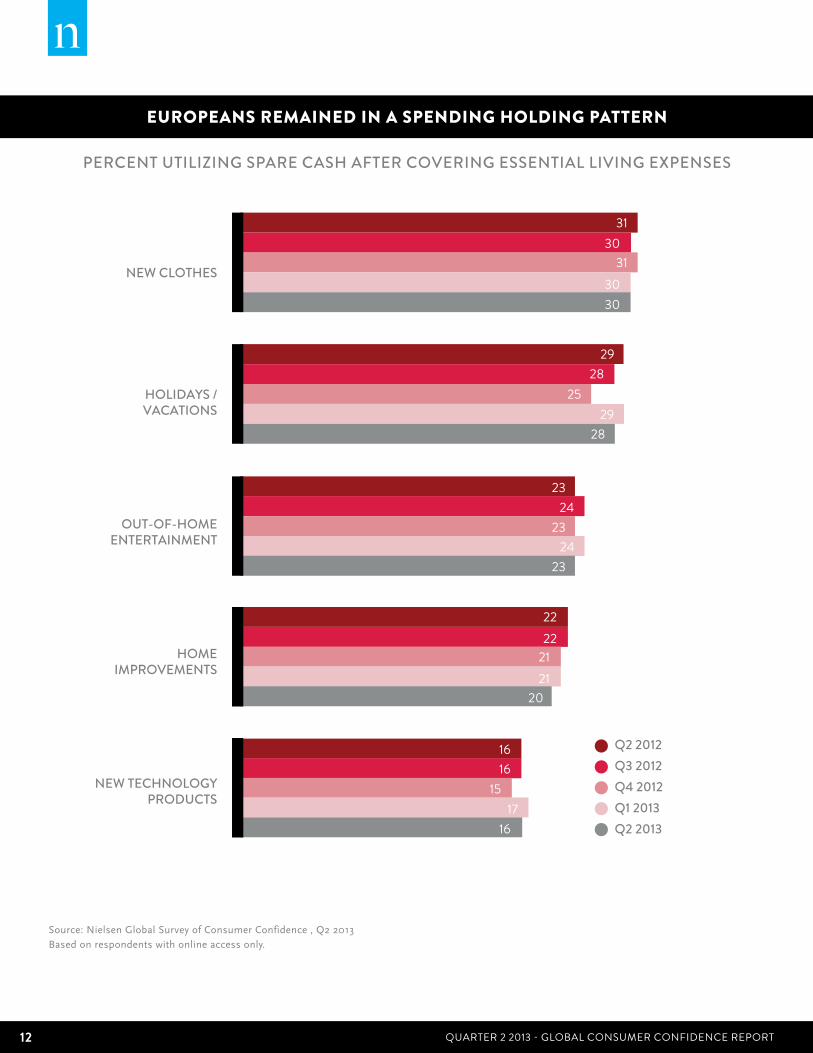
Fewer European respondents planned to spend discretionary income on holidays/vacations, out-of-home entertainment, home improvements, and new technology products, declining one percentage point each from three months ago. One-third of European respondents planned to put spare cash into savings, and 21 percent had no spare cash to spend.
Looking for ways to save, half of European respondents spent less on new clothes (56%), cut down on out-of-home entertainment (54%), switched to cheaper grocery brands (50%), and tried to save on gas and electricity (48%). Four in 10 respondents cut back on holidays (43%) and take-away meals (41%). Roughly one-third spent less on telephone expenses (36%), delayed upgrading technology (36%)/major household items (33%), used their car less often (32%) and did not take an annual vacation (31%). Consumer confidence in Germany, the world’s fourth-largest economy, held steady with an index of 90 for two consecutive quarters. Confidence increased in the United Kingdom by four index points to a score of 79. Second-quarter confidence declines were reported in Russia (80), France (53), and Italy (41), declining one, one, and three index points, respectively.
“German economic indicators in May 2013 had an impact on consumer confidence, which remains stable in Germany,” said Ingo Schier, managing director, Nielsen Germany. “While the number of registered job-seekers declined for the first time in five months below the mark of three million, recent wage and salary negotiations between trade unions and employers led to salary rises in many sectors. Additionally, the German DAX registered an unprecedented record high in May. But Germans’ consumer confidence stands on shaky ground. According to predictions, economic growth may continue to decline with the Euro zone stuck in recession.”
12 Quarter 2 2013 - Global Consumer ConfidenCe report
europeans remained in a spending holding pattern
Q2 2012 Q3 2012 Q4 2012 Q1 2013 Q2 2013
NEW CLOTHES
31 30
31 30 30
HOLIDAYS / VACATIONS
29 28
25 29
28
OUT-OF-HOME ENTERTAINMENT
23 24
23 24
23
HOME IMPROVEMENTS
22 22
21 21
20
NEW TECHNOLOGY PRODUCTS
16 16
15 17
16
Source: Nielsen Global Survey of Consumer Confidence , Q2 2013Based on respondents with online access only.
PERCENT UTILIZINg SPARE CASH AFTER COvERINg ESSENTIAL LIvINg EXPENSES
13Copyright © 2013 The Nielsen Company
REaDINESS TO SPEND waS EvIDENT IN aSIa-PaCIFICOverall consumer confidence in the Asia-Pacific region remained high, with seven markets reporting indexes above the 100 baseline. Indonesia (124), the Philippines (121), and China (110) reported increases in the second quarter of two, three and two points, respectively. India (118), Thailand (114), Hong Kong (107), and Malaysia (103) declined two, one, one and four index point(s), respectively.
Spending intentions increased in 10 of 14 Asia-Pacific markets, with respondents from Indonesia, Hong Kong, India and the Philippines leading the shopping spree. More than half of respondents from these markets indicated that spending on items wanted and needed over the next 12 months would be good or excellent.
“Indonesian consumers are keen about the future and spending should remain robust as Indonesians continue to become more affluent and sophisticated in their needs,” said Catherine Eddy, managing director, Nielsen Indonesia. “Earlier this year, we saw significant increases in minimum wages and this is no doubt fueling the consumption and optimism we are observing. We expect that this will continue throughout the year; however, the government’s decision to decrease fuel subsidies has the potential to dampen consumption and confidence.”
“The healthy growth of Chinese consumer confidence in the latest quarter and the stronger willingness to spend go hand in hand,” said Yan Xuan, president of Nielsen Greater China. “Today, Chinese consumers’ aspirations for a better and higher quality life can be found in all city tiers and in the countryside thanks to the continued increase in personal and household income and ongoing urbanization. The policies of the Chinese government to boost domestic consumption will only further push ahead such momentum.”
14 Quarter 2 2013 - Global Consumer ConfidenCe report
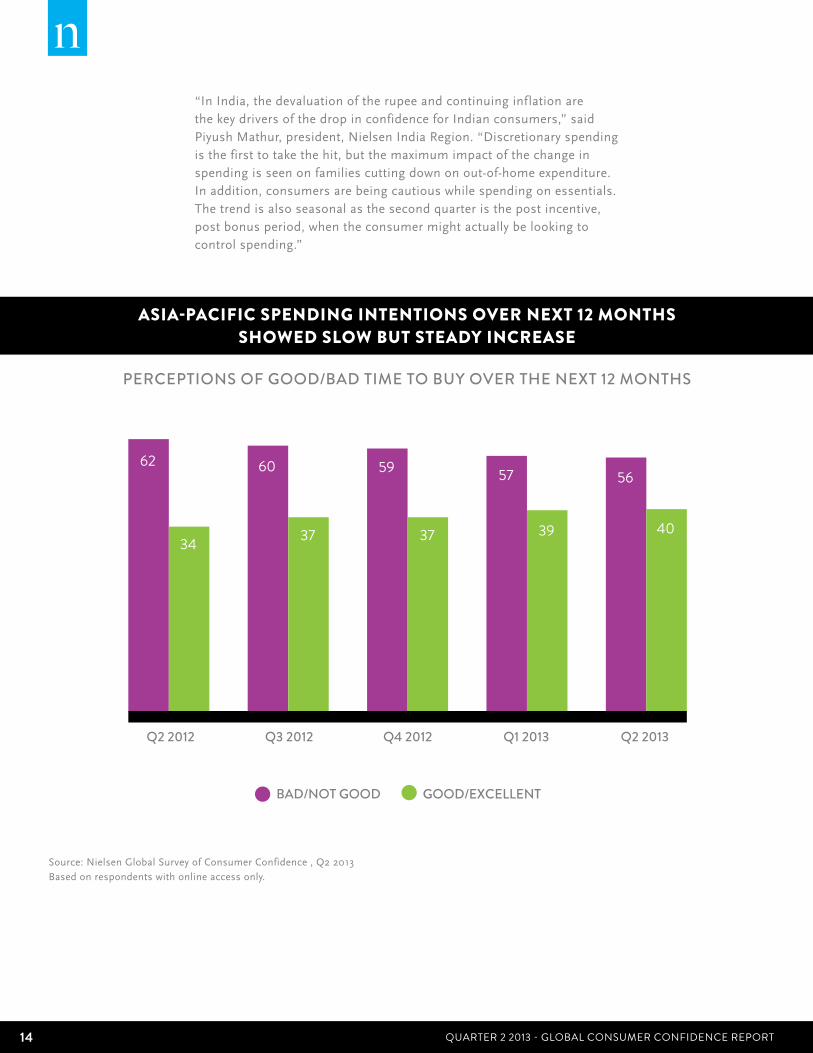
62
34
60
37
59
37
57
39
56
40
Q2 2012 Q3 2012 Q4 2012 Q1 2013 Q2 2013
BAD/NOT GOOD GOOD/EXCELLENT
Source: Nielsen Global Survey of Consumer Confidence , Q2 2013Based on respondents with online access only.
asia-paCifiC spending intentions over next 12 months shoWed sloW but steady inCrease
PERCEPTIONS OF gOOD/bAD TIME TO bUy OvER THE NEXT 12 MONTHS
“In India, the devaluation of the rupee and continuing inflation are the key drivers of the drop in confidence for Indian consumers,” said Piyush Mathur, president, Nielsen India Region. “Discretionary spending is the first to take the hit, but the maximum impact of the change in spending is seen on families cutting down on out-of-home expenditure. In addition, consumers are being cautious while spending on essentials. The trend is also seasonal as the second quarter is the post incentive, post bonus period, when the consumer might actually be looking to control spending.”
15Copyright © 2013 The Nielsen Company
117122
121120
119118
115115
85108
103107
95
9593
8896
9490
6678
5973
51
95
108108
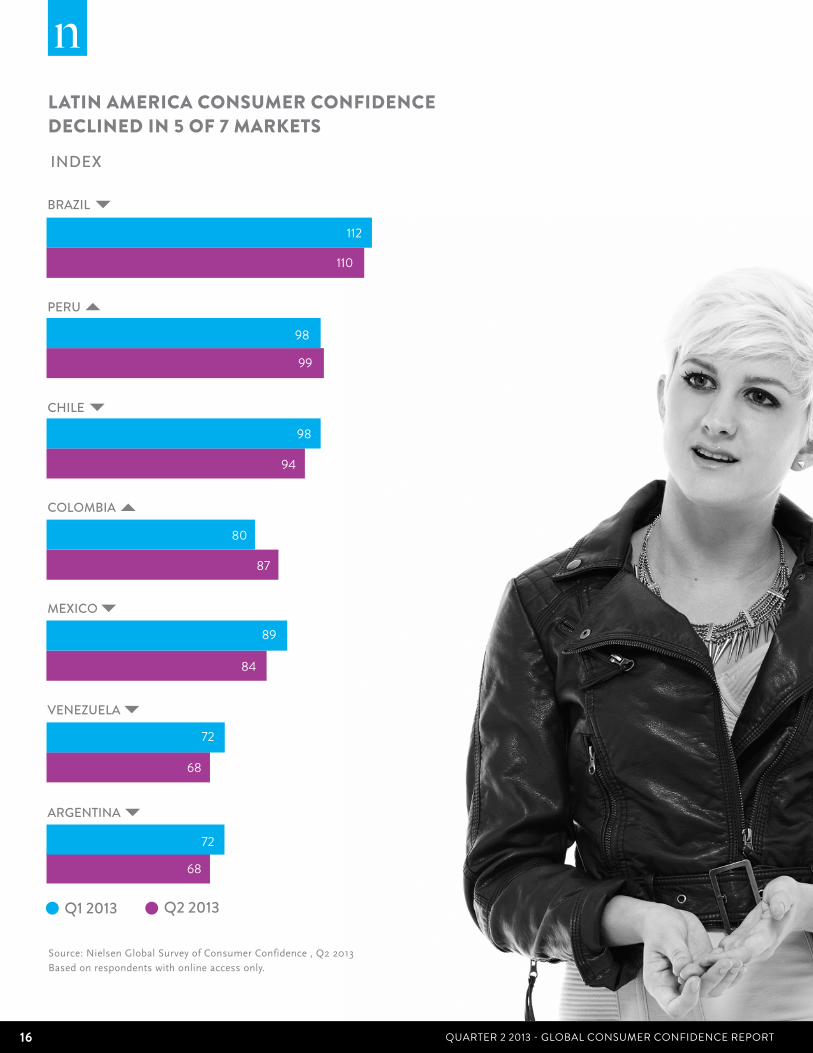
RETICENT laTIN aMERICaNS SHOwED EaGERNESS TO SPENDConsumer confidence in Latin America decreased for the second consecutive quarter, declining one index point from Q1 2013 to a score of 93. Brazil led the region with the highest index of 110, which decreased two points in the second quarter. Positive consumer confidence performance in Peru (99) and Colombia (87) reported increases of one and seven index points, respectively. Consumer confidence in Venezuela (68) reported declines for three consecutive quarters, and Chile (94), Argentina (68), and Mexico (84) each dropped for the second straight quarter.
The overall regional consumer confidence decline in the second quarter did not negatively impact discretionary spending intentions, however, with marginal increases reported across most spending categories measured. Spending plans for new clothes (25%) increased two percentage points, and intent to spend on new technology (18%), home improvement projects (17%), and holidays/vacations (17%) inched up by one percentage point each.
“Current economic conditions in Brazil, especially low GDP growth and high inflation, are affecting consumer confidence,” said Eduardo Ragasol, country manager, Nielsen Brazil. “Government efforts, such as temporary tax reductions and credit stimulus measures aimed to reignite investments, have failed to fuel economic growth at the pace needed to keep infrastructure and supply side of the economy, thus producing price increases.”
16 Quarter 2 2013 - Global Consumer ConfidenCe report
87
84
68
68
94
99
112
98
PERU
98
CHILE
80
COLOMBIA
89
MEXICO
72
VENEZUELA
72
ARGENTINA
Q2 2013 Q1 2013
BRAZIL
110
latin ameriCa Consumer ConfidenCe deClined in 5 of 7 marKets
Source: Nielsen Global Survey of Consumer Confidence , Q2 2013Based on respondents with online access only.
INDEX
17Copyright © 2013 The Nielsen Company
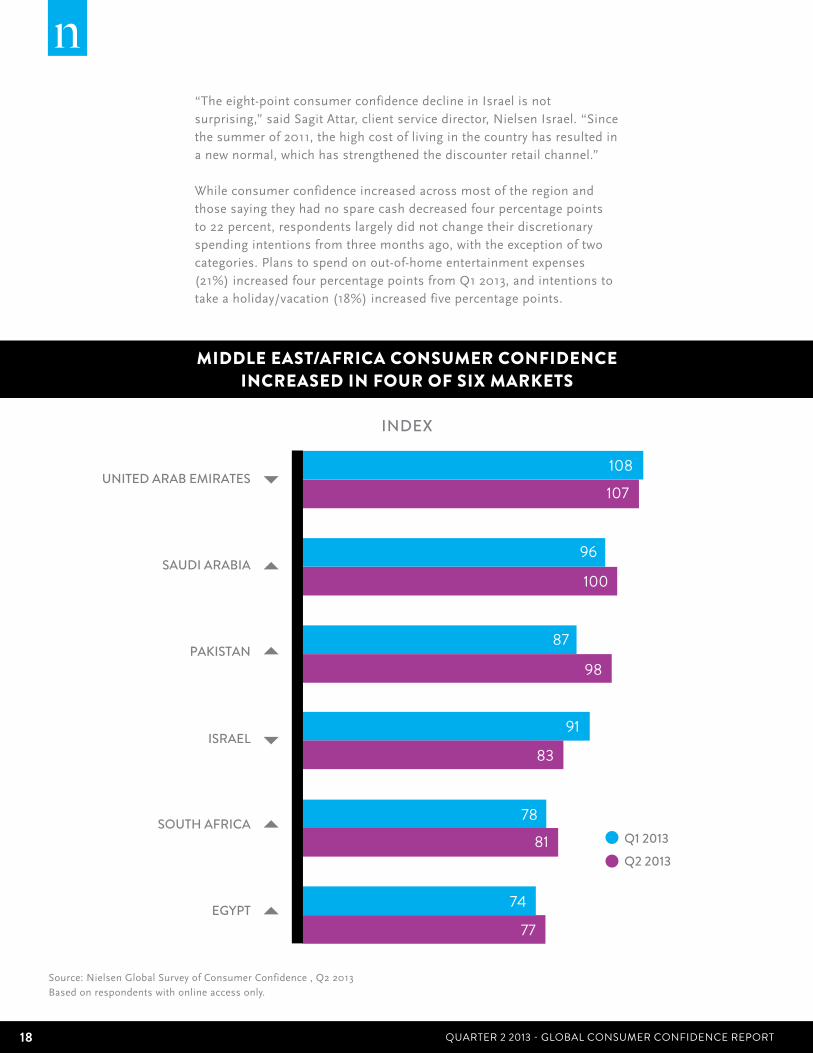
CONSUMER CONFIDENCE REbOUNDED IN MIDDlE EaST/aFRICa REGIONConsumer confidence increased in four of six Middle East/Africa markets, boosting the regional average by six index points in the second quarter, which came after an 11-point regional index decline in the first quarter. Pakistan (98) reported the biggest three-month increase of 11 index points, followed by a rise of four points in Saudi Arabia (100), three points in Egypt (77) and South Africa (81). Confidence declines were reported in United Arab Emirates (107) and Israel (83), which declined one and eight points, respectively.
“Pakistan’s consumer confidence increase was a rebound from a six-point decline reported in the first quarter amid tumultuous extremist activity that ensued during that time,” said Mustafa Moosajee, managing director, Nielsen Pakistan. “Yet, the resilience of the Pakistani people, and the capabilities of its large and growing urban middle class is reflected in the steady increase over the previous five quarters and in the latest quarter, which was boosted by a sense of excitement among Pakistani’s who participated in landmark national and provincial elections. The historical significance of their vote represented the country’s first transition between an elected government fulfilling its term, to another, in a country that has been ruled by the military for more than half of its turbulent history.” Saudi Arabia’s consumer confidence increase of four points came after a 12-point index decline reported in the first quarter. “One major development that impacted consumer confidence during Q1 was a new law that made it illegal for export workers to work for any person/business/institution other than their own sponsors,” said Arslan Ashraf, managing director, Nielsen Saudi Arabia. “However, at the start of April, a three-month grace period was granted, which eased the overall situation a bit in the second quarter. A looming deadline could negatively impact the economy, as it is expected that inflation will increase and service levels will go down.”
18 Quarter 2 2013 - Global Consumer ConfidenCe report
“The eight-point consumer confidence decline in Israel is not surprising,” said Sagit Attar, client service director, Nielsen Israel. “Since the summer of 2011, the high cost of living in the country has resulted in a new normal, which has strengthened the discounter retail channel.”
While consumer confidence increased across most of the region and those saying they had no spare cash decreased four percentage points to 22 percent, respondents largely did not change their discretionary spending intentions from three months ago, with the exception of two categories. Plans to spend on out-of-home entertainment expenses (21%) increased four percentage points from Q1 2013, and intentions to take a holiday/vacation (18%) increased five percentage points.
middle east/afriCa Consumer ConfidenCe inCreased in four of six marKets
Source: Nielsen Global Survey of Consumer Confidence , Q2 2013Based on respondents with online access only.
74
78
91
87
96
108
77
81
83
98
100
EGYPT
SOUTH AFRICA
ISRAEL
PAKISTAN
SAUDI ARABIA
UNITED ARAB EMIRATES 107
Q2 2013 Q1 2013
INDEX
19Copyright © 2013 The Nielsen Company
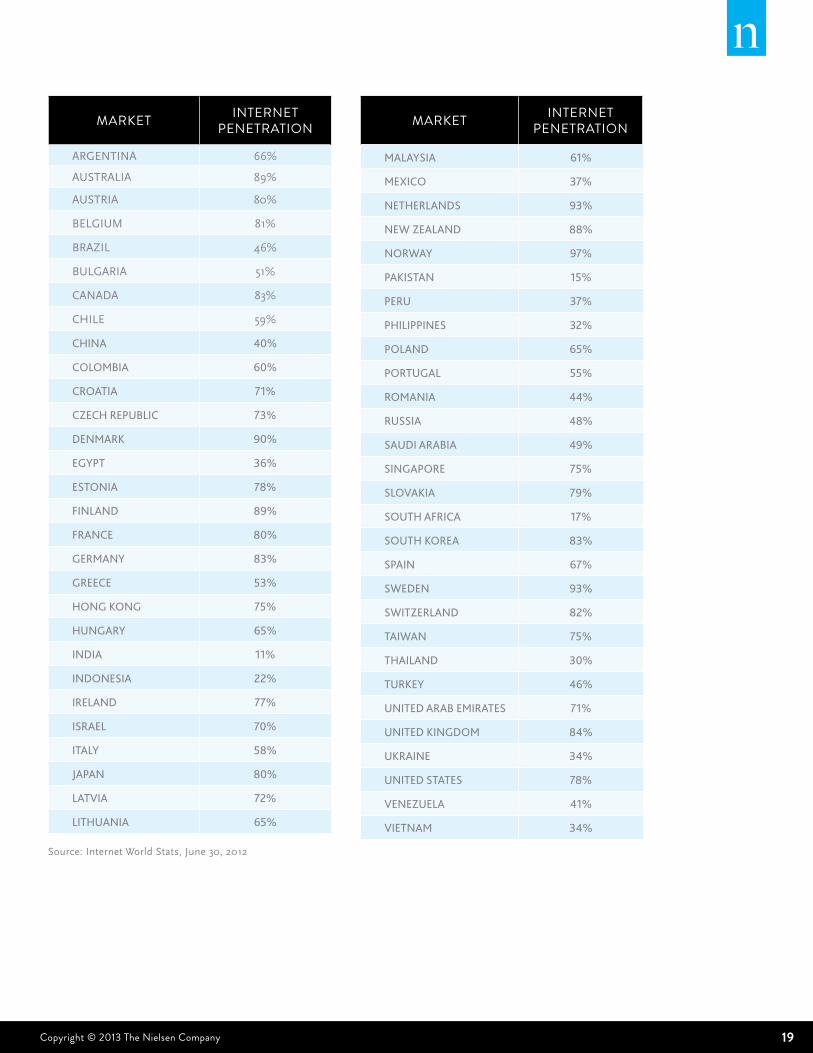
Source: Internet World Stats, June 30, 2012
MARKET INTERNET PENETRATION
ARGENTINA 66%
AUSTRALIA 89%
AUSTRIA 80%
BELGIUM 81%
BRAZIL 46%
BULGARIA 51%
CANADA 83%
CHILE 59%
CHINA 40%
COLOMBIA 60%
CROATIA 71%
CZECH REPUBLIC 73%
DENMARK 90%
EGYPT 36%
ESTONIA 78%
FINLAND 89%
FRANCE 80%
GERMANY 83%
GREECE 53%
HONG KONG 75%
HUNGARY 65%
INDIA 11%
INDONESIA 22%
IRELAND 77%
ISRAEL 70%
ITALY 58%
JAPAN 80%
LATVIA 72%
LITHUANIA 65%
MARKET INTERNET PENETRATION
MALAYSIA 61%
MEXICO 37%
NETHERLANDS 93%
NEW ZEALAND 88%
NORWAY 97%
PAKISTAN 15%
PERU 37%
PHILIPPINES 32%
POLAND 65%
PORTUGAL 55%
ROMANIA 44%
RUSSIA 48%
SAUDI ARABIA 49%
SINGAPORE 75%
SLOVAKIA 79%
SOUTH AFRICA 17%
SOUTH KOREA 83%
SPAIN 67%
SWEDEN 93%
SWITZERLAND 82%
TAIWAN 75%
THAILAND 30%
TURKEY 46%
UNITED ARAB EMIRATES 71%
UNITED KINGDOM 84%
UKRAINE 34%
UNITED STATES 78%
VENEZUELA 41%
VIETNAM 34%
INDEX
20 Quarter 2 2013 - Global Consumer ConfidenCe report
abOUT THE NIElSEN GlObal SURvEy The Nielsen Global Survey of Consumer Confidence and Spending
Intentions was conducted between May 13–31, 2013, and polled more
than 29,000 online consumers in 58 countries throughout Asia-Pacific,
Europe, Latin America, the Middle East, Africa and North America. The
sample has quotas based on age and sex for each country based on
their Internet users, and is weighted to be representative of Internet
consumers and has a maximum margin of error of ±0.6%. This Nielsen
survey is based on the behavior of respondents with online access only.
Internet penetration rates vary by country. Nielsen uses a minimum
reporting standard of 60 percent Internet penetration or 10M online
population for survey inclusion. The China Consumer Confidence Index
is compiled from a separate mixed methodology survey among 3,500
respondents in China. The Nielsen Global Survey, which includes the
Global Consumer Confidence Index, was established in 2005.
ABOUT NIELSEN Nielsen Holdings N.V. (NYSE: NLSN) is a global information and
measurement company with leading market positions in marketing
and consumer information, television and other media measurement,
online intelligence and mobile measurement. Nielsen has a presence in
approximately 100 countries, with headquarters in New York, USA and
Diemen, the Netherlands.
For more information, visit www.nielsen.com.
Copyright © 2013 The Nielsen Company. All rights reserved. Nielsen and
the Nielsen logo are trademarks or registered trademarks of CZT/ACN
Trademarks, L.L.C. Other product and service names are trademarks or
registered trademarks of their respective companies. 13/6610