Nucleotide diversity and linkage disequilibrium in balsampoplar (Populus balsamifera)
Matthew S. Olson1, Amanda L. Robertson1, Naoki Takebayashi1, Salim Silim2, William R. Schroeder2 and
Peter Tiffin3
1Institute of Arctic Biology and Department of Biology and Wildlife, University of Alaska Fairbanks, AK 99775, USA; 2Agriculture and Agri-Food Canada,
Agri-Environment Services Branch, Indian Head, SK, Canada; 3Department of Plant Biology, University of Minnesota, St Paul, MN, USA
Author for correspondence:Matthew S. Olson
Tel: +1 907 4742766
Email: [email protected]
Received: 14 October 2009Accepted: 8 December 2009
New Phytologist (2010) 186: 526–536doi: 10.1111/j.1469-8137.2009.03174.x
Key words: effective population size,genomic diversity, insertion deletiondiversity, poplar, purifying selection, singlenucleotide polymorphisms (SNPs).
Summary
• Current perceptions that poplars have high levels of nucleotide variation, large
effective population sizes, and rapid decay of linkage disequilibrium are based pri-
marily on studies from one poplar species, Populus tremula.
• We analysed 590 gene fragments (average length 565 bp) from each of 15 indi-
viduals from different populations from throughout the range of Populus balsamif-
era.
• Nucleotide diversity (htotal = 0.0028, p = 0.0027) was low compared with other
trees and model agricultural systems. Patterns of nucleotide diversity and site fre-
quency spectra were consistent with purifying selection on replacement and intron
sites. When averaged across all loci we found no evidence for decay of linkage dis-
equilibrium across 750 bp, consistent with the low estimates of the scaled recombi-
nation parameter, q = 0.0092.
• Compared with P. tremula, a well studied congener with a similar distribution, P.
balsamifera has low diversity and low effective recombination, both of which indi-
cate a lower effective population size in P. balsamifera. Patterns of diversity and
linkage indicate that there is considerable variation in population genomic patterns
among poplar species and unlike P. tremula, association mapping techniques in
balsam poplar should consider sampling single nucleotide polymorphisms (SNPs) at
well-spaced intervals.
Introduction
Multilocus surveys of nucleotide diversity and linkage dis-equilibrium (LD) provide valuable insights into a specieshistory and the genomic imprint of selection (Rosenberget al., 2002; Wright & Andolfatto, 2008). To date, how-ever, genome-wide estimates of nucleotide diversity andlinkage disequilibrium have allowed for detailed analysisof demographic history, selection and contemporary popula-tion structure in only a limited number of model plant spe-cies (Nordborg et al., 2005; Caicedo et al., 2007; Francoiset al., 2008; Ingvarsson, 2008b). These, and other studieshave leveraged information on the outliers of empiricaldistributions of diversity, frequency spectra, and LDamong sites to identify likely targets of species-wide(Bustamante et al., 2005; Gojobori et al., 2007; Shapiroet al., 2007; Wright & Andolfatto, 2008; Cai et al.,2009) and local adaptation (Caicedo et al., 2004; Kane &
Rieseberg, 2008; Moeller & Tiffin, 2008; McCrackenet al., 2009). Multi-locus sampling also aids in estimationof the roles that selective constraint, background selection,and hitchhiking have played in shaping nucleotidediversity in regions of the genome with different func-tional characteristics (Clark et al., 2007; Andolfatto,2008; Makinen et al., 2008; Wright & Andolfatto, 2008;McVicker et al., 2009; Sella et al., 2009). Finally, gen-ome-scale data are necessary for evaluating the potentialpower of marker-based approaches for identifying genesunderlying phenotypic variation. Although associationmapping techniques are not without their problems(McCarthy et al., 2008), association techniques remainattractive to forest tree breeders and researchers becausethey offer the potential to identify genomic regions (per-haps even individual nucleotides) underlying phenotypicvariation without the time-intensive aspects associated withQTL mapping population development (Mackay, 2001;
NewPhytologistResearch
526 New Phytologist (2010) 186: 526–536
www.newphytologist.com� The Authors (2010)
Journal compilation � New Phytologist Trust (2010)

Brunner & Nilsson, 2004; Neale & Savolainen, 2004;Neale & Ingvarsson, 2008).
Poplars (Populus spp.) have become a model system forstudies of angiosperm tree physiology and genetics (Tuskanet al., 2006) offering a set of study organisms that span awide range of habitats and community interactions (Stettleret al., 1996; Martin et al., 2004; LeRoy et al., 2006). Fur-ther development of population genetic resources for poplarspecies not only provides data from a long-lived perennialfor comparison against existing short-lived populationgenetic models (e.g. Arabidopsis, Zea, Oryza), but also setsthe stage for investigating the genetic basis of wood forma-tion, perenniality and dormancy (Brunner et al., 2004).Surveys of nucleotide diversity in Populus tremula are moreextensive than those conducted for any other woody angio-sperm. An investigation of 77 gene fragments from theEuropean portions of P. tremula’s range revealed a specieswith relatively high diversity (h = 0.018) and low LD (r2
dropped to < 0.1 within 200 bp); both properties are con-sistent with a large effective population size (Ingvarsson,2008b). Nucleotide diversity and LD in P. tremula suggestthat association mapping approaches in this species mayrequire dense sampling of single nucleotide polymorphisms(SNPs), but also may be effective at identifying very smallgenomic regions underlying phenotypic variation, perhapseven causative SNPs. Indeed, association mapping trials inP. tremula have identified candidate quantitative trait nucle-otides for influencing the timing of seasonal dormancy(Hall et al., 2007; Ingvarsson et al., 2008). Because fewspecies of poplar are characterized for nucleotide diversityacross many loci, it is unclear whether patterns of diversityand LD are common properties of the genus or historicalcontingencies have resulted in differences among species.
Here, we present analyses of nucleotide polymorphismfound in a survey of 590 genome regions sequenced fromeach of 15 balsam poplar (Populus balsamifera) trees sam-pled from different populations across the species’ range.This sampling scheme was designed to minimize effects ofpopulation structure in order to best discern species-widepatterns of diversity (Wakeley & Lessard, 2003; Staedleret al., 2009). Although the inclusion of two samples fromeach population (by sampling both chromosomes from eachindividual) may introduce minor effects of populationstructure, because population structure tends to be low in P.balsamifera (Keller et al., 2010) we expect that these effectsare weak. We characterize species-wide genetic diversity,patterns of linkage disequilibrium decay and compare sitefrequency distributions among different functional catego-ries of nucleotide polymorphisms. Our data provide an in-trageneric comparison to patterns found in P. tremula; thesetwo species have similar ecological roles in contemporarycommunities and may have been affected in similar ways byQuaternary climate fluctuations. Because balsam poplar iscommon throughout Canada and Alaska, it has garnered
intense interest for silvicultural applications including car-bon sequestration, windrows, biofuels and wood products.For this reason, identification of functionally importantgenetic variants may not only provide insight into pastadaptation into the species’ current niche, but also be valu-able in breeding programs.
Materials and Methods
Populus balsamifera L. is a dioecious (obligately outcrossing)species with a range from Newfoundland to Alaska at lati-tudes from 42�N to nearly 70�N. It is a key component ofboreal forests, with natural populations in the Arctic (Bock-heim et al., 2003), further north than any other NorthAmerican tree. Balsam poplar is the sister species to Populustrichocarpa (black cottonwood), with c. 25% shared ances-tral polymorphism (N. Levsen, pers. comm.). Although theUSDA plants database (http://plants.usda.gov/) classifiesthese taxa as subspecies because of morphological similarity,we refer to them as separate species to follow the precedentin recent scientific literature.
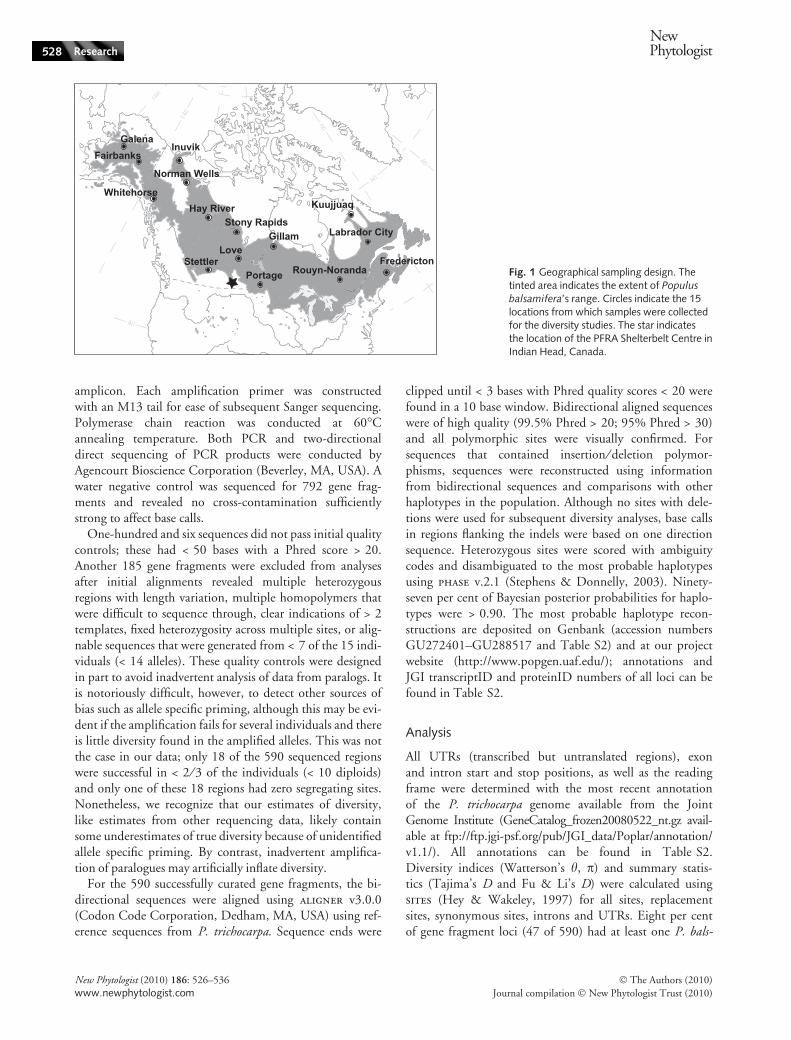
For this study we sampled a single individual from eachof 15 populations that spanned the geographical range andecological environments in which P. balsamifera grows(Fig. 1). Most of these trees are part of the live AgCanBaPcollection that is maintained at the Prairie Farm Rehabilita-tion Administration Shelterbelt Centre in Indian HeadCanada. These trees were originally collected from the natu-ral populations as stem cuttings from trees separated fromone another by > 200 m when possible, to minimize thepossibility of sampling clonal stems. Stems were rooted andtransplanted into common gardens in Indian HeadSaskatchewan, Canada (latitude 50�N), Vancouver BritishColumbia Canada (49�N), and Fairbanks Alaska USA(65�N). Leaf or bud tissues for this study were collectedfrom the Indian Head common garden and dried in silicagel before extraction in Qiagen DNeasy Plant Maxi kitsusing the manufacturer’s protocols.
Primers for 881 gene fragments were designed usingprimer3 v1.0.0 (see the Supporting Information, Table S1;Rozen & Skaletsky, 2000). The target genes for thesefragments were randomly selected from the complete setof predicted transcripts in the P. trichocarpa genome(http://genome.jgi-psf.org/Poptr1_1/Poptr1_1.home.html).Annealing sites for primers were restricted to exons, untran-scribed regions (UTRs), or in a few cases were allowed toanneal within 200 bases 5¢ of the first exon; target ampliconlengths varied from 500 to 800 bases. The poplar genomeharbors many paralogues with a mean fourfold synonymousdivergence c. 0.09% that resulted from a whole-genomeduplication (Tuskan et al., 2006); for this reason, wedesigned primers using a mispriming file to avoid paralogsto our target regions. The mispriming file was composed oftranscripts from the second best blast hit for each target
NewPhytologist Research 527
� The Authors (2010)
Journal compilation � New Phytologist Trust (2010)
New Phytologist (2010) 186: 526–536
www.newphytologist.com
amplicon. Each amplification primer was constructedwith an M13 tail for ease of subsequent Sanger sequencing.Polymerase chain reaction was conducted at 60�Cannealing temperature. Both PCR and two-directionaldirect sequencing of PCR products were conducted byAgencourt Bioscience Corporation (Beverley, MA, USA). Awater negative control was sequenced for 792 gene frag-ments and revealed no cross-contamination sufficientlystrong to affect base calls.
One-hundred and six sequences did not pass initial qualitycontrols; these had < 50 bases with a Phred score > 20.Another 185 gene fragments were excluded from analysesafter initial alignments revealed multiple heterozygousregions with length variation, multiple homopolymers thatwere difficult to sequence through, clear indications of > 2templates, fixed heterozygosity across multiple sites, or alig-nable sequences that were generated from < 7 of the 15 indi-viduals (< 14 alleles). These quality controls were designedin part to avoid inadvertent analysis of data from paralogs. Itis notoriously difficult, however, to detect other sources ofbias such as allele specific priming, although this may be evi-dent if the amplification fails for several individuals and thereis little diversity found in the amplified alleles. This was notthe case in our data; only 18 of the 590 sequenced regionswere successful in < 2 ⁄ 3 of the individuals (< 10 diploids)and only one of these 18 regions had zero segregating sites.Nonetheless, we recognize that our estimates of diversity,like estimates from other requencing data, likely containsome underestimates of true diversity because of unidentifiedallele specific priming. By contrast, inadvertent amplifica-tion of paralogues may artificially inflate diversity.
For the 590 successfully curated gene fragments, the bi-directional sequences were aligned using aligner v3.0.0(Codon Code Corporation, Dedham, MA, USA) using ref-erence sequences from P. trichocarpa. Sequence ends were
clipped until < 3 bases with Phred quality scores < 20 werefound in a 10 base window. Bidirectional aligned sequenceswere of high quality (99.5% Phred > 20; 95% Phred > 30)and all polymorphic sites were visually confirmed. Forsequences that contained insertion ⁄ deletion polymor-phisms, sequences were reconstructed using informationfrom bidirectional sequences and comparisons with otherhaplotypes in the population. Although no sites with dele-tions were used for subsequent diversity analyses, base callsin regions flanking the indels were based on one directionsequence. Heterozygous sites were scored with ambiguitycodes and disambiguated to the most probable haplotypesusing phase v.2.1 (Stephens & Donnelly, 2003). Ninety-seven per cent of Bayesian posterior probabilities for haplo-types were > 0.90. The most probable haplotype recon-structions are deposited on Genbank (accession numbersGU272401–GU288517 and Table S2) and at our projectwebsite (http://www.popgen.uaf.edu/); annotations andJGI transcriptID and proteinID numbers of all loci can befound in Table S2.
Analysis
All UTRs (transcribed but untranslated regions), exonand intron start and stop positions, as well as the readingframe were determined with the most recent annotationof the P. trichocarpa genome available from the JointGenome Institute (GeneCatalog_frozen20080522_nt.gz avail-able at ftp://ftp.jgi-psf.org/pub/JGI_data/Poplar/annotation/v1.1/). All annotations can be found in Table S2.Diversity indices (Watterson’s h, p) and summary statis-tics (Tajima’s D and Fu & Li’s D) were calculated usingsites (Hey & Wakeley, 1997) for all sites, replacementsites, synonymous sites, introns and UTRs. Eight per centof gene fragment loci (47 of 590) had at least one P. bals-
Fig. 1 Geographical sampling design. Thetinted area indicates the extent of Populus
balsamifera’s range. Circles indicate the 15locations from which samples were collectedfor the diversity studies. The star indicatesthe location of the PFRA Shelterbelt Centre inIndian Head, Canada.
� The Authors (2010)
Journal compilation � New Phytologist Trust (2010)
New Phytologist (2010) 186: 526–536
www.newphytologist.com
528 Research
NewPhytologist
amifera individual with a premature stop codon mutation.Distributions of summary statistics for different classes ofsites (Table S3) were compared using nonparametric Wil-coxon rank sum tests calculated using JMP 7 (SAS,2007). Hudson’s ms, sample_stats, and stats were used tocompute mean Tajima’s D for simulated data sets underthe neutral coalescent model (Hudson, 2002). Distribu-tions from these simulations are available by request fromthe first author.
Linkage disequilibrium was estimated as r2 for all 372gene fragments with pairs of SNPs with frequencies ‡ 10%using the rsq program (http://molpopgen.org/software/lseqsoftware.html; Weir & Hill, 1980; Thornton, 2003).Kelly’s Zns (Kelly, 1997) was calculated as r2 averaged acrossall pairs of SNPs within gene fragments. The LD decay wasestimated by plotting r2 against the physical distancebetween sites (in bp) and fitting a nonlinear equation thatdescribes the best estimate of the average recombinationparameter for all gene fragments, q, given empirical rela-tionships between pairwise r2 and physical distance betweensites (Eqn 1; Remington et al., 2001). We do not reportthese estimates of q because of potential bias introducedfrom non-independence between sites (Remington et al.,2001); nonetheless, it remains useful as an estimate of therate of decay of linkage disequilibrium as physical distanceincreases. The nonlinear fit was conducted using jmp 7(SAS, 2007).
We used Hudson’s composite likelihood estimatorimplemented in maxdip (Hudson, 2001; available at http://home.uchicago.edu/~rhudson1/source/maxdip.html) to cal-culate the scaled recombination parameter (q = 4 Ner,where r is the recombination rate) per site for each genefragment with ‡ 2 SNPs with minor allele frequencies‡ 10%. maxdip calculates scaled q from diploid unphaseddata. For data with few SNPs, such as ours, Hudson’smethod has been shown to be among the most accurate ofthose currently available for estimating q (Li & Stephens,2003); moreover, because this method was also used forestimation of q in P. tremula (Ingvarsson et al., 2008), wecan make direct comparisons across taxa.
Results
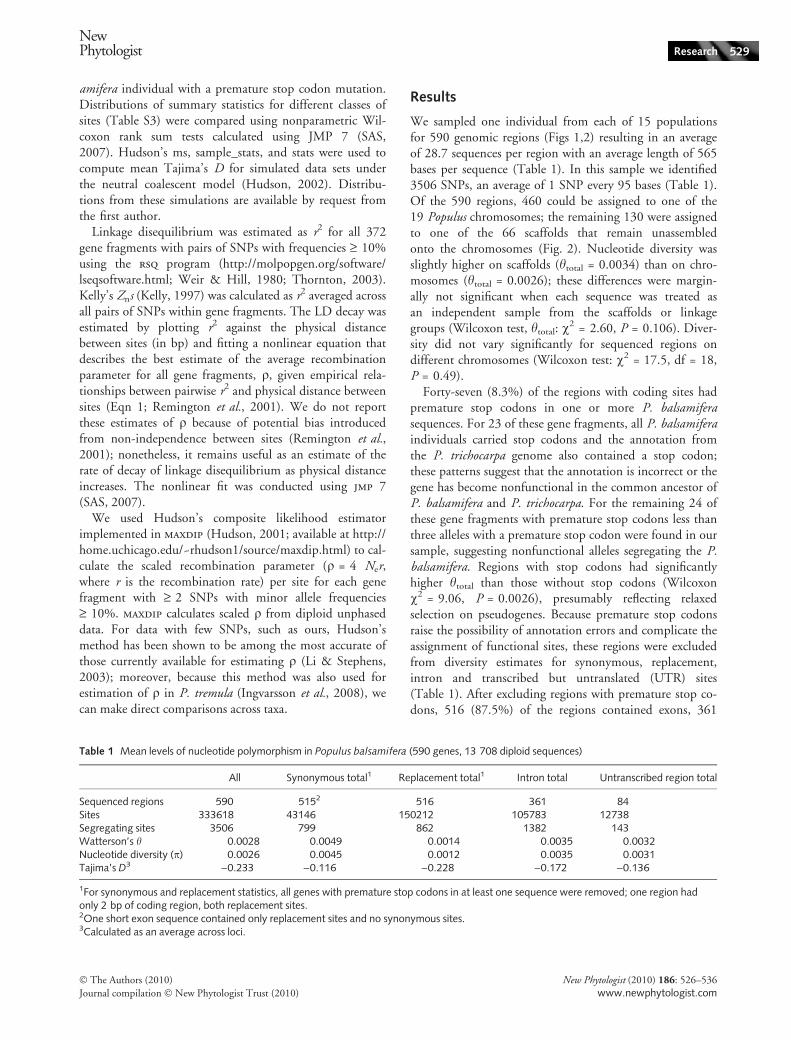
We sampled one individual from each of 15 populationsfor 590 genomic regions (Figs 1,2) resulting in an averageof 28.7 sequences per region with an average length of 565bases per sequence (Table 1). In this sample we identified3506 SNPs, an average of 1 SNP every 95 bases (Table 1).Of the 590 regions, 460 could be assigned to one of the19 Populus chromosomes; the remaining 130 were assignedto one of the 66 scaffolds that remain unassembledonto the chromosomes (Fig. 2). Nucleotide diversity wasslightly higher on scaffolds (htotal = 0.0034) than on chro-mosomes (htotal = 0.0026); these differences were margin-ally not significant when each sequence was treated asan independent sample from the scaffolds or linkagegroups (Wilcoxon test, htotal: v2 = 2.60, P = 0.106). Diver-sity did not vary significantly for sequenced regions ondifferent chromosomes (Wilcoxon test: v2 = 17.5, df = 18,P = 0.49).
Forty-seven (8.3%) of the regions with coding sites hadpremature stop codons in one or more P. balsamiferasequences. For 23 of these gene fragments, all P. balsamiferaindividuals carried stop codons and the annotation fromthe P. trichocarpa genome also contained a stop codon;these patterns suggest that the annotation is incorrect or thegene has become nonfunctional in the common ancestor ofP. balsamifera and P. trichocarpa. For the remaining 24 ofthese gene fragments with premature stop codons less thanthree alleles with a premature stop codon were found in oursample, suggesting nonfunctional alleles segregating the P.balsamifera. Regions with stop codons had significantlyhigher htotal than those without stop codons (Wilcoxonv2 = 9.06, P = 0.0026), presumably reflecting relaxedselection on pseudogenes. Because premature stop codonsraise the possibility of annotation errors and complicate theassignment of functional sites, these regions were excludedfrom diversity estimates for synonymous, replacement,intron and transcribed but untranslated (UTR) sites(Table 1). After excluding regions with premature stop co-dons, 516 (87.5%) of the regions contained exons, 361
Table 1 Mean levels of nucleotide polymorphism in Populus balsamifera (590 genes, 13 708 diploid sequences)
All Synonymous total1 Replacement total1 Intron total Untranscribed region total
Sequenced regions 590 5152 516 361 84Sites 333618 43146 150212 105783 12738Segregating sites 3506 799 862 1382 143Watterson’s h 0.0028 0.0049 0.0014 0.0035 0.0032Nucleotide diversity (p) 0.0026 0.0045 0.0012 0.0035 0.0031Tajima’s D3 )0.233 )0.116 )0.228 )0.172 )0.136
1For synonymous and replacement statistics, all genes with premature stop codons in at least one sequence were removed; one region hadonly 2 bp of coding region, both replacement sites.2One short exon sequence contained only replacement sites and no synonymous sites.3Calculated as an average across loci.
� The Authors (2010)
Journal compilation � New Phytologist Trust (2010)
New Phytologist (2010) 186: 526–536
www.newphytologist.com
NewPhytologist Research 529

(61.2%) had introns and 84 (14.2%) contained UTRsequences.
Per site synonymous nucleotide diversity, perhaps thebest estimate of neutral diversity (Wright & Andolfatto,2008), averaged hsyn = 0.0049, but the distribution wasskewed towards small values and 191 of the 515 gene frag-ments had no segregating synonymous sites, hsyn = 0(Fig. 3a). Nucleotide diversity was lower at replacement(Rep) sites, introns and UTRs than at synonymous (Syn)sites, but the difference was statistically significant only forreplacement and intron sites (Wilcoxon Sign rank: h Rep vsSyn: v2
df = 514 = )31 833, P < 0.0001; Intron vs Synv2
df = 304 = )3652.5, P < 0.0075; UTR vs Syn v2df = 76 =
)213.5, P = 0.165). This pattern was consistent with stron-ger selective constraint on replacement sites and intronsthan synonymous sites because of the effects of selectionagainst deleterious mutations (Table 1). Diversity also was
correlated for replacement and intron (Spearman’s rho =0.235, P < 0.0001) synonymous and intron (Spearman’srho = 0.170, P < 0.0018) and intron and replacement sites(Spearman’s rho = 0.217, P < 0.0001). Correlations withUTRs were not computed because of small sample sizes.
Two-hundred and twenty-five (38%) of the sequencedregions harbored insertion ⁄ deletion (indel) length polymor-phisms. Regions with indels had significantly higher average
Fig. 2 Genomic sampling design. Vertical lines represent each of the19 poplar chromosomes (LG1-19, note scale). Circles indicate theapproximate positions of sequenced fragments along the chromo-somes and the two best sampled scaffolds. Numbers of sequencedfragments are shown in parentheses under each chromosome orscaffold. One-hundred and thirty sequenced regions were locatedon unassembled scaffolds.
Minor allele count1 2 3 4 5 6 7 8 9 10 11 12 13 14 15
Pro
port
ion
of lo
ci
0.0
0.1
0.2
0.3
0.4Expected (Wright–Fisher)ReplacementSynonymousIntron
Tajima's D–2 –1 0 1 2 3
Num
ber
of lo
ci0
10
20
30
40
50
60
0.00 0.01 0.02 0.03 0.04
Num
ber
of lo
ci
0
50
100
150
200
250
qsyn
(a)
(b)
(c)
Fig. 3 Distributions of summary statistics describing nucleotidediversity. (a) Empirical distribution of synonymous nucleotide diver-sity per site (hsyn) for the 515 gene fragments with synonymoussites. (b) Empirical distribution of Tajima’s D for all 565 gene frag-ments with segregating sites. (c) Site frequency spectrum for singlenucleotide polymorphisms from the 349 sequenced regions with 30alleles. Expected values are based on a constant size populationgenetics model given a sample size of 30 (Wakeley, 2009).
� The Authors (2010)
Journal compilation � New Phytologist Trust (2010)
New Phytologist (2010) 186: 526–536
www.newphytologist.com
530 Research
NewPhytologist

htotal = 0.0032 (Wilcoxon Sign rank v2 = 19.80,P < 0.0001) than sequences without indels (htotal =0.0024). However, this comparison is biased by the fact
that sequenced regions with indels were more likely to alsocontain introns (likelihood ratio v2 = 59.82. P < 0.0001).Nevertheless, when only the 297 sequenced regions with> 100 bp of introns were considered (148 regions with in-dels htotal = 0.0032; 149 regions without indels htotal =0.0027), regions with indels still had higher average diver-
sity than regions without indels (Wilcoxon sign rankv2 = 5.12, P = 0.024) even after adjusting for differences inthe length of introns (parametric ancova t1,294 = )1.90,P = 0.058).When analysing only intron site diversity, how-ever, introns with indels did not have significantly differentdiversity than introns without indels (with indels hintron =0.0035; without indels hintron = 0.0032; Wilcoxon sign
rank hintron v2 = 1.51, P = 0.220). The lack of significancemay be caused by higher variance associated with theshorter regions or because indels, even in introns, are morefrequent in genes that experience lower selective constraint.
Because first introns often have regulatory functions (seethe Discussion section), we asked whether first introns dif-fered from later introns in their diversity. Gene fragmentswere short and often did not contain multiple introns, sowe compared the diversity in first introns in those genes thatcontained them to overall diversity of introns in those genesthat did not contain first introns. No differences wereobserved in diversity of segregating sites in first intronscompared with later introns (Wilcoxon rank sum testv2 = 0.03, P = 0.87). Five of the 113 first introns werelocated in the 5¢UTR, where regulatory introns are oftenlocated (see the Discussion section); these five had statisti-cally higher diversity (mean h = 0.0059) than first intronsnot located in the 5¢UTR (mean h = 0.0033; Wilcoxonrank test v2 = 4.66, P = 0.031), an outcome that was notconsistent with greater constraint on first introns in5¢UTRs. This difference also remained significant afterincluding hsyn as a covariate to lessen effects of regional vari-ability in nucleotide diversity (ancova t1,110 = 2.00,P = 0.048).
Synonymous sites had the highest mean Tajima’s D,UTRs and introns had more negative mean Tajima’s D’s,and replacement sites had the most negative mean D(Table 1). The mean values of Tajima’s D for the gene frag-ments were significantly < 0 for all site categories exceptUTRs (Table 1; Fig. 3b, DREP: Wilcoxon sign rank tdf = 327
= )302, P < 0.0001; DSyn: tdf = 323 = )4273, P < 0.011;DIntron: tdf = 300 = )4471, P < 0.0030; DUTR: tdf = 54 =)113, P = 0.348). Mean Tajima’s D from all site categoriesexcept UTRs were also significantly less than expected fromneutral coalescent simulations (with similar diversity andsample sizes as each category); empirical values of mean Taj-ima’s D were less than the means from 99% of the 1000replicated coalescent simulations for replacement, synony-
mous and intron site categories (simulated 1% quantilesfor mean D: DREP = )0.101, DSyn = )0.103, DIntron =)0.155, DUTR = )0.261). Moreover, both replacementand intron sites exhibited significantly higher frequencies ofsingletons that synonymous sites for the site frequency dis-tributions (Fig. 3c; goodness of fit: Rep vs Syn v2 = 48.8,P < 0.0001; intron vs syn v2 = 536.2, P < 0.0001). Pat-terns of Tajima’s D and frequencies of singletons were con-sistent with stronger selective constraint on replacementcompared with synonymous sites and introns comparedwith synonymous sites. Tajima’s D values of the concate-nated sequences showed similar rankings to that of themean values (Table 2). Values calculated for concatenatedsequences are usually farther from zero than the mean Taj-ima’s D calculated by averaging across estimates from manygene fragments owing to lower variance of h and p (i.e. thedenominator of D; A. Eyre-Walker, pers. comm.).
Linkage disequilibrium
Linkage disequilibrium averaged r2 = 0.52 for all pairwisecomparisons of SNPs within the 372 gene fragments withminor allele frequencies (MAF) > 10% (Fig. 4a). Averagedacross all loci, no appreciable decay of LD was detectedwhen r2 was plotted against distance between sites in basepairs for the sequenced gene fragments (Fig. 4a). The distri-bution of Kelly’s Zns (mean r2 for each gene fragment;Kelly, 1997) was multimodal with strong peaks at c. 0.025and at 1.0; otherwise values had a broad peak at approx. 0.4(Fig. 4b), indicating wide variance in haplotype structureand LD among different gene fragments. The scaled recom-bination parameter, q, could be estimated for only 353 ofthe gene fragments with multiple SNPs with MAF > 10%because for 19 gene fragments the composite likelihoodestimates converged to the upper limit of q = 5000 set bythe maxdip program. Estimates of q ranged from 0 to 1.8and were generally very low. For 33.7% of the gene frag-ments q = 0, the mean and median values for q were0.0092 and 1.6 · 10)5, respectively, indicating that the
Table 2 Comparison of Tajima’s D estimate when averaging acrossloci to the estimate when all loci are concatenated
Site categoryTajima’s D
averaged (± SE)Tajima’s D
concatenated
Total )0.280 (± 0.058) )0.325Synonymous )0.181 (± 0.067) )0.201Replacement )0.260 (± 0.070) )0.493Intron )0.230 (± 0.082) )0.283UTR )0.100 (± 0.189) )0.523
Only the 323 loci with 30 alleles (all 15 diploid individuals) wereused in the calculations to maintain consistency; sites with missingdata have been excluded throughout.UTR, transcribed but untranslated sites.
� The Authors (2010)
Journal compilation � New Phytologist Trust (2010)
New Phytologist (2010) 186: 526–536
www.newphytologist.com
NewPhytologist Research 531
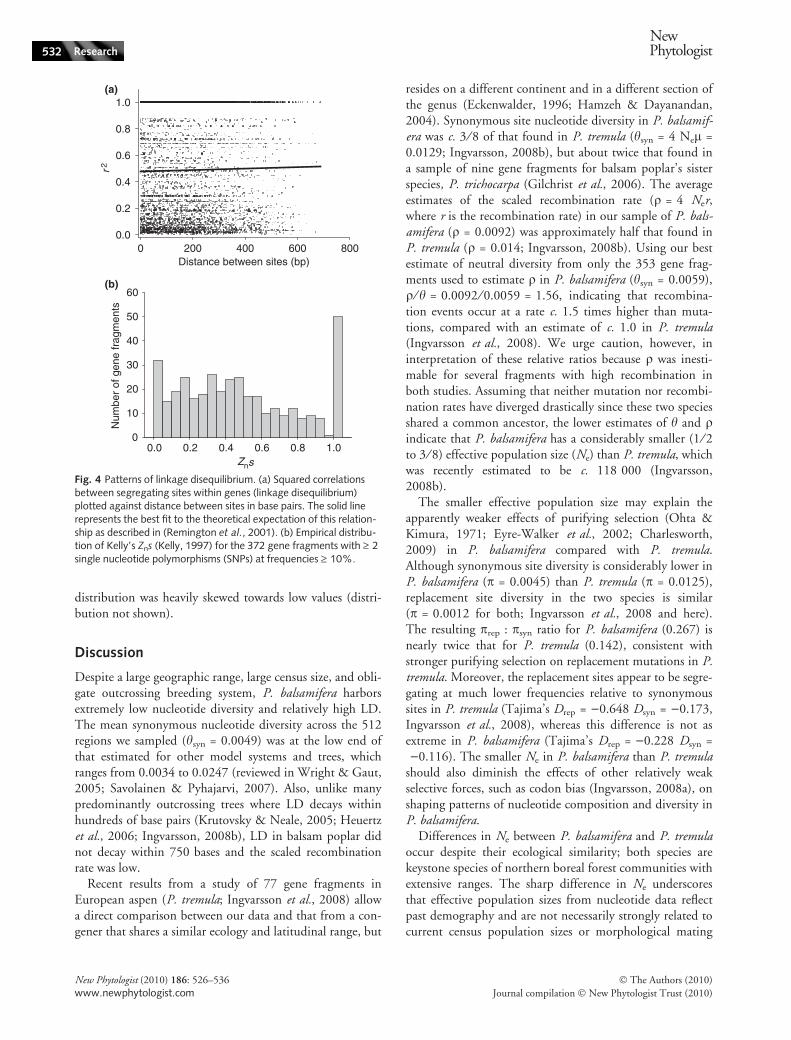
distribution was heavily skewed towards low values (distri-bution not shown).
Discussion
Despite a large geographic range, large census size, and obli-gate outcrossing breeding system, P. balsamifera harborsextremely low nucleotide diversity and relatively high LD.The mean synonymous nucleotide diversity across the 512regions we sampled (hsyn = 0.0049) was at the low end ofthat estimated for other model systems and trees, whichranges from 0.0034 to 0.0247 (reviewed in Wright & Gaut,2005; Savolainen & Pyhajarvi, 2007). Also, unlike manypredominantly outcrossing trees where LD decays withinhundreds of base pairs (Krutovsky & Neale, 2005; Heuertzet al., 2006; Ingvarsson, 2008b), LD in balsam poplar didnot decay within 750 bases and the scaled recombinationrate was low.
Recent results from a study of 77 gene fragments inEuropean aspen (P. tremula; Ingvarsson et al., 2008) allowa direct comparison between our data and that from a con-gener that shares a similar ecology and latitudinal range, but
resides on a different continent and in a different section ofthe genus (Eckenwalder, 1996; Hamzeh & Dayanandan,2004). Synonymous site nucleotide diversity in P. balsamif-era was c. 3 ⁄ 8 of that found in P. tremula (hsyn = 4 Nel =0.0129; Ingvarsson, 2008b), but about twice that found ina sample of nine gene fragments for balsam poplar’s sisterspecies, P. trichocarpa (Gilchrist et al., 2006). The averageestimates of the scaled recombination rate (q = 4 Ner,where r is the recombination rate) in our sample of P. bals-amifera (q = 0.0092) was approximately half that found inP. tremula (q = 0.014; Ingvarsson, 2008b). Using our bestestimate of neutral diversity from only the 353 gene frag-ments used to estimate q in P. balsamifera (hsyn = 0.0059),q ⁄ h = 0.0092 ⁄ 0.0059 = 1.56, indicating that recombina-tion events occur at a rate c. 1.5 times higher than muta-tions, compared with an estimate of c. 1.0 in P. tremula(Ingvarsson et al., 2008). We urge caution, however, ininterpretation of these relative ratios because q was inesti-mable for several fragments with high recombination inboth studies. Assuming that neither mutation nor recombi-nation rates have diverged drastically since these two speciesshared a common ancestor, the lower estimates of h and qindicate that P. balsamifera has a considerably smaller (1 ⁄ 2to 3 ⁄ 8) effective population size (Ne) than P. tremula, whichwas recently estimated to be c. 118 000 (Ingvarsson,2008b).
The smaller effective population size may explain theapparently weaker effects of purifying selection (Ohta &Kimura, 1971; Eyre-Walker et al., 2002; Charlesworth,2009) in P. balsamifera compared with P. tremula.Although synonymous site diversity is considerably lower inP. balsamifera (p = 0.0045) than P. tremula (p = 0.0125),replacement site diversity in the two species is similar(p = 0.0012 for both; Ingvarsson et al., 2008 and here).The resulting prep : psyn ratio for P. balsamifera (0.267) isnearly twice that for P. tremula (0.142), consistent withstronger purifying selection on replacement mutations in P.tremula. Moreover, the replacement sites appear to be segre-gating at much lower frequencies relative to synonymoussites in P. tremula (Tajima’s Drep = )0.648 Dsyn = )0.173,Ingvarsson et al., 2008), whereas this difference is not asextreme in P. balsamifera (Tajima’s Drep = )0.228 Dsyn =)0.116). The smaller Ne in P. balsamifera than P. tremula
should also diminish the effects of other relatively weakselective forces, such as codon bias (Ingvarsson, 2008a), onshaping patterns of nucleotide composition and diversity inP. balsamifera.
Differences in Ne between P. balsamifera and P. tremulaoccur despite their ecological similarity; both species arekeystone species of northern boreal forest communities withextensive ranges. The sharp difference in Ne underscoresthat effective population sizes from nucleotide data reflectpast demography and are not necessarily strongly related tocurrent census population sizes or morphological mating
Distance between sites (bp)0 200 400 600 800
r2
0.0
0.2
0.4
0.6
0.8
1.0
Zns0.0 0.2 0.4 0.6 0.8 1.0
Num
ber
of g
ene
frag
men
ts
0
10
20
30
40
50
60
(a)
(b)
Fig. 4 Patterns of linkage disequilibrium. (a) Squared correlationsbetween segregating sites within genes (linkage disequilibrium)plotted against distance between sites in base pairs. The solid linerepresents the best fit to the theoretical expectation of this relation-ship as described in (Remington et al., 2001). (b) Empirical distribu-tion of Kelly’s Zns (Kelly, 1997) for the 372 gene fragments with ‡ 2single nucleotide polymorphisms (SNPs) at frequencies ‡ 10%.
� The Authors (2010)
Journal compilation � New Phytologist Trust (2010)
New Phytologist (2010) 186: 526–536
www.newphytologist.com
532 Research
NewPhytologist

characteristics (e.g. dioecy and wind dispersal). Instead,these differences are most likely caused by demographic dif-ferences since their divergence. One possibility for these dif-ferences may be that Quaternary ice ages affectedpopulations in North America and Eurasia in differentmanners. For example, although distributions of bothNorth American and European trees were affected by Qua-ternary glacial cycles (Taberlet et al., 1998; Anderson et al.,2006), the potentially much larger unglaciated land area inAsia may have allowed for smaller influences of historicalbottlenecks on Ne in P. tremula. The differences between P.balsamifera and P. tremula also underscore that that popula-tion genetic parameters are not a property of a genus butinstead are a property of an evolutionary lineage of inter-breeding individuals (i.e. a population or a species). It istherefore important to keep in mind that estimates of diver-sity and effective recombination may be sensitive to sam-pling – especially in species with extensive populationstructure or nonequilibrium demographic histories (Rosen-berg et al., 2005; Moeller et al., 2007; Ross-Ibarra et al.,2008; Staedler et al., 2009).
Although Ne likely contributes to differences in LDbetween P. balsamifera and P. tremula, population struc-ture and hybridization may elevate LD to some extent(Ohta, 1983; Wakeley & Lessard, 2003). A recent studyof SNP diversity in P. balsamifera using one SNP ⁄ locus,but including 15 individuals per population across 34populations found that population structure was signifi-cantly different from zero, but low (Fst = 0.053, 95% CI0.048–0.058), and migration rates were high M = m ⁄l, c.1216–9598 (Keller et al., 2010). Keller et al. (2010) alsofound that the majority of the population structure couldbe accounted for by partitioning samples into three popu-lations: one northern, one central and one eastern popula-tion. We had too few samples within the northern andeastern populations to address whether LD was reducedin these regions relative to a range-wide sample, but wecould estimate LD using only the seven populations fromcentral Canada. We found that when only samples fromthe central populations were included, LD was reducedslightly (average Kelly’s Zns complete data set = 0.48, cen-tral populations only = 0.42), but pairwise r2 still did notdecay significantly with distance between sites (data notshown). Theoretical studies also suggest that populationstructure is unlikely to maintain correlations among lociin the face of the high levels of migration that Kelleret al. (2010) estimated (Wakeley & Lessard, 2003).Hybridization and introgression, however, may have con-tributed to elevated LD in Populus balsamifera. Poplarsare well known to hybridize with closely related congenersand P. balsamifera hybridizes with P. deltoides along thesoutheastern portion of its range and with P. trichocarpaand P. angustifolia along the western and southwesternedges of its range. A recent study of protease inhibitors in
Populus balsamifera also showed clear evidence of intro-gressed alleles (Neiman et al., 2009).
Diversity and selective constraint for differentfunctional classes
As expected, nucleotide diversity in P. balsamifera was con-siderably lower at replacement sites than at either synony-mous sites or introns. Moreover, replacement sites harboredan excess of low frequency variants relative to introns orsynonymous sites. These differences presumably reflect theaction of purifying selection, which appears to operatedespite the low effective population size. Less expected wasour finding that introns harbored significantly less diversityand a relative excess of low-frequency variants than synony-mous sites.
Recent multilocus surveys of nucleotide diversity in Dro-sophila melanogaster and Arabidopsis thaliana have foundthat introns harbor less diversity than synonymous sites(Andolfatto, 2005; Halligan & Keightley, 2006; Wright &Andolfatto, 2008). A possible reason for the apparentlyhigher selective constraint at introns than synonymous sitesis that introns harbor regulatory sequences (Wray et al.,2003; Rose, 2008). Early evidence for the importance of in-trons in gene regulation derives from transgene experimentsthat found increased expression of the same gene when in-trons were included compared with when they wereexcluded (Callis et al., 1987; Duncker et al., 1997; Rethme-ier et al., 1997; Le Hir et al., 2003). The first intron in thegene, especially those located in the 5¢UTR, appear to beparticularly important in regulating expression (Chunget al., 2006; Hong et al., 2006; Rose, 2008) and may beexpected to have low diversity relative to other introns. Ouranalyses, however, found no significant differences betweendiversity in first introns and other introns, although thisconclusion should be viewed with some caution given thesmall sample size. This lack of difference between the intronclasses may come from multiple sources. One possibility isthat several of the first introns we sampled may not haveroles in gene regulation. For example, first introns in the5¢UTR may be more likely to have regulatory influencesthan first introns that are not located in the 5¢UTR (Rose,2008). Our data, however, were not consistent with predic-tions from this hypothesis; first introns located in the5¢UTR had higher diversity than first introns not located inthe 5¢UTR. A second possibility for the lack of lower diver-sity in first introns is that first introns may contain onlyshort regions with regulatory function whereas the remain-der of the first intron is accumulating variation at the samerate as the remaining introns. Deletions of major portionsof the first intron of sh1 in maize, Ostub1A1 in rice andPRF2 in Arabidopsis had limited effects on regulatoryenhancement (Jeon et al., 2000; Clancy & Hannah, 2002;Jeong et al., 2006). Because some of our sequences included
� The Authors (2010)
Journal compilation � New Phytologist Trust (2010)
New Phytologist (2010) 186: 526–536
www.newphytologist.com
NewPhytologist Research 533
only a portion of the first intron, it is also possible that forsome genes the functional region of the first intron was notincluded in our survey. In summary, although first intronshave been shown to be more likely to have strong effects onexpression, we found no evidence for lower diversity in firstintrons, as would be expected if these experience strongerpurifying selection than other introns.
In addition to finding that diversity was affected by func-tional classification, we found higher diversity in gene frag-ments with insertion ⁄ deletion length variation (indels) thanfragments that did not contain indels. High divergenceclose to indels has been found across eukaryotes and bacte-ria (Tian et al., 2008; Chen et al., 2009); this pattern hasbeen hypothesized to be caused by mutagenic properties ofindels (Tian et al., 2008). An alternative explanation, how-ever, may be that indels are more common in regions lessaffected by background selection or hitchhiking. Regardlessof the causes, our results suggest that studies that do notinclude regions with length variation may slightly underesti-mate the overall level of nucleotide diversity. Given thatdecreased intron diversity compared with synonymous sitediversity is also consistent with selective constraint on in-trons, future analyses focused on different aspects of in-trons, including length, position and presence or absence oflength variation may further illuminate the evolutionaryforces constraining intron evolution. We note that ourstudy may have underestimated diversity if there was ahigher portion of indels within the 291 gene fragments thatwere sequenced but unanalysable, than in the 590 interpret-able gene fragments.
Prospects for association mapping of functionallyimportant traits
Characterization of nucleotide diversity and recombinationare important not only for understanding the demographicand selective history of a species, they are also necessary forevaluating the precision and power of association mappingtechniques (Nielsen et al., 2004; Weir, 2008). Slow LDdecay in balsam poplar indicates that haplotype structuremay be strong and functional sites may be linked to nearbysites that have no influence on function. Sampling all SNPswithin a region for association with phenotype may beredundant in some cases and tagSNP or haplotype-basedassociation mapping strategies may prove fruitful for identi-fication of large linked regions associated with traits. Thedistance over which we were able to quantify linkage dis-equilibrium and its decay (or lack thereof) was < 750 bp,and it is now clear that this distance is not adequate fordetermining the distance required for LD to decay for theaverage gene fragment in P. balsamifera. The wide varianceexhibited in LD averaged across gene fragments (Zns), how-ever, suggests that there also is considerable variation indecay of LD for different genes in the balsam poplar gen-
ome. Future studies should concentrate both on estimationof LD across greater distances to identify the extent of LDand work towards a better understanding of the variabilityof haplotype structure across the genome.
Acknowledgements
This research was supported by a NSF Plant Genome awardDBI-0701911 to M.S.O. and P.T., Alaska EPSCoR NSFaward #EPS-0701898, the University of Alaska FairbanksInstitute of Arctic Biology and the state of Alaska. We thankShawn Houston and James Long and the Life SciencesInformatics Group for bioinformatics support. We thankPer Ingvarsson for sharing analytical software and providinginsightful comments regarding patterns of LD and purify-ing selection. We also thank Stephen Keller, Nick Levsenand two anonymous reviewers for comments that greatlyimproved the manuscript. Author contributions: M.S.O.conceived and designed the research, organized data collec-tion, oversaw data analysis and wrote the manuscript.A.L.R. and N.T. contributed to data analysis and manu-script editing. S.S. and W.D.S. made the original collec-tions of the plant material and assisted with manuscriptediting. P.T. conceived and designed the research, contrib-uted to data analysis, overseeing of the project and writing.
References
Anderson LL, Hu FS, Nelson DM, Petit RJ, Paige KN. 2006. Ice-age
endurance: DNA evidence of a white spruce refugium in Alaska. Proceed-ings of the National Academy of Sciences, USA 103: 12447–12450.
Andolfatto P. 2005. Adaptive evolution of non-coding DNA in drosoph-
ila. Nature 437: 1149–1152.
Andolfatto P. 2007. Hitchhiking effects of recurrent beneficial amino acid
substitutions in the Drosophila melanogaster genome (vol 17, pg 1755,
2007). Genome Research 17: 1755–1762.
Bockheim JG, O’Brien JD, Munroe JS, Hinkel KM. 2003. Factors affect-
ing the distribution of Populus balsamifera on the north slope of Alaska,
USA. Arctic, Antarctic and Alpine Research 35: 331–340.
Brunner AM, Busov VB, Strauss SH. 2004. Poplar genome sequence:
functional genomics in an ecologically dominant plant species. TrendsPlant Science 9: 49–56.
Brunner AM, Nilsson O. 2004. Revisiting tree maturation and floral initi-
ation in the poplar functional genomics era. New Phytologist 164: 43–
51.
Bustamante CD, Fledel-Alon A, Williamson S, Nielsen R, Hubisz MT,
Glanowski S, Tanenbaum DM, White TJ, Sninsky JJ, Hernandez RD
et al. 2005. Natural selection on protein-coding genes in the human
genome. Nature 437: 1153–1157.
Cai JJ, Macpherson JM, Sella G, Petrov DA 2009. Pervasive hitchhiking
at coding and regulatory sites in humans. PLoS Genetics 5(1): e1000336.
Caicedo AL, Stinchcombe JR, Olsen KM, Schmitt J, Purugganan MD.
2004. Epistatic interaction between arabidopsis fri and flc flowering time
genes generates a latitudinal cline in a life history trait. Proceedings of theNational Academy of Sciences, USA 101: 15670–15675.
Caicedo AL, Williamson SH, Hernandez RD, Boyko A, Fledel-Alon A,
York TL, Polato NR, Olsen KM, Nielsen R, McCouch SR et al. 2007.
Genome-wide patterns of nucleotide polymorphism in domesticated
rice. PLoS Genetics 3(9): e163.
� The Authors (2010)
Journal compilation � New Phytologist Trust (2010)
New Phytologist (2010) 186: 526–536
www.newphytologist.com
534 Research
NewPhytologist
Callis J, Fromm M, Walbot V. 1987. Introns increase gene-expression in
cultures maize cells. Genes & Development 1: 1183–1200.
Charlesworth B. 2009. Effective population size and patterns of molecular
evolution and variation. Nature Reviews Genetics 10: 195–205.
Chen JQ, Wu Y, Yang HW, Bergelson J, Kreitman M, Tian DC. 2009.
Variation in the ratio of nucleotide substitution and indel rates across
genomes in mammals and bacteria. Molecular Biology and Evolution 26:
1523–1531.
Chung BYW, Simons C, Firth AE, Brown CM, Hellens RP. 2006. Effect
of 5¢UTR introns on gene expression in Arabidopsis thaliana. BMCGenomics 7: Article–No.: 120
Clancy M, Hannah LC. 2002. Splicing of the maize sh1 first intron is
essential for enhancement of gene expression, and a t-rich motif increases
expression without affecting splicing. Plant Physiology 130: 918–929.
Clark RM, Schweikert G, Toomajian C, Ossowski S, Zeller G, Shinn P,
Warthmann N, Hu TT, Fu G, Hinds DA et al. 2007. Common
sequence polymorphisms shaping genetic diversity in Arabidopsisthaliana. Science 317: 338–342.
Duncker BP, Davies PL, Walker VK. 1997. Introns boost transgene
expression in Drosophila melanogaster. Molecular & General Genetics 254:
291–296.
Eckenwalder JE. 1996. Systematics and evolution of populus. In: Stettler
RF, Bradshaw HD, Heilman PE, Hinckley TM, eds. Biology of Populus
and its implications for management and conservation. Ottawa, ON,
Canada: NRC Research Press, 7–56.
Eyre-Walker A, Keightley PD, Smith NGC, Gaffney D. 2002. Quantify-
ing the slightly deleterious mutation model of molecular evolution.
Molecular Biology and Evolution 19: 2142–2149.
Francois O, Blum MGB, Jakobsson M, Rosenberg NA. 2008.
Demographic history of European populations of Arabidopsis thaliana.
PLoS Genetics 4(5): e1000075.
Gilchrist EJ, Haughn GW, Ying CC, Otto SP, Zhuang J, Cheung D,
Hamberger B, Aboutorabi F, Kalynyak T, Johnson L et al. 2006. Use
of ecotilling as an efficient SNP discovery tool to survey genetic variation
in wild populations of Populus trichocarpa. Molecular Ecology 15: 1367–
1378.
Gojobori J, Tang H, Akey JM, Wu CI. 2007. Adaptive evolution in
humans revealed by the negative correlation between the polymorphism
and fixation phases of evolution. Proceedings of the National Academy ofSciences, USA 104: 3907–3912.
Hall D, Luquez V, Garcia VM, St Onge KR, Jansson S, Ingvarsson PK.
2007. Adaptive population differentiation in phenology across a latitudi-
nal gradient in European aspen (Populus tremula L.): a comparison of
neutral markers, candidate genes and phenotypic traits. Evolution 61:
2849–2860.
Halligan DL, Keightley PD. 2006. Ubiquitous selective constraints in the
drosophila genome revealed by a genome-wide interspecies comparison.
Genome Research 16: 875–884.
Hamzeh M, Dayanandan S. 2004. Phylogeny of Populus (Salicaceae) based
on nucleotide sequences of chloroplast trnt–trnf region and nuclear
rDNA. American Journal of Botany 91: 1398–1408.
Heuertz M, De Paoli E, Kallman T, Larsson H, Jurman I, Morgante M,
Lascoux M, Gyllenstrand N. 2006. Multilocus patterns of nucleotide
diversity, linkage disequilibrium and demographic history of Norway
spruce [Picea abies (L.) Karst]. Genetics 174: 2095–2105.
Hey J, Wakeley J. 1997. A coalescent estimator of the population recombi-
nation rate. Genetics 145: 833–846.
Hong X, Scofield DG, Lynch M. 2006. Intron size, abundance, and distri-
bution within untranslated regions of genes. Molecular Biology andEvolution 23: 2392–2404.
Hudson RR. 2001. Two-locus sampling distributions and their applica-
tion. Genetics 159: 1805–1817.
Hudson RR. 2002. Generating samples under a Wright–Fisher neutral
model of genetic variation. Bioinformatics 18: 337–338.
Ingvarsson PK. 2008a. Molecular evolution of synonymous codon usage
in Populus. BMC Evolutionary Biology 8: 13.
Ingvarsson PK. 2008b. Multilocus patterns of nucleotide polymorphism
and the demographic history of Populus tremula. Genetics 180: 329–340.
Ingvarsson PK, Garcia MV, Luquez V, Hall D, Jansson S. 2008. Nucleo-
tide polymorphism and phenotypic associations within and around the
phytochrome b2 locus in European aspen (Populus tremula, Salicaceae).
Genetics 178: 2217–2226.
Jeon JS, Lee S, Jung KH, Jun SH, Kim C, An G. 2000. Tissue-preferential
expression of a rice alpha-tubulin gene, ostuba1, mediated by the first
intron. Plant Physiology 123: 1005–1014.
Jeong YM, Mun JH, Lee I, Woo JC, Hong CB, Kim SG. 2006. Distinct
roles of the first introns on the expression of arabidopsis profilin gene
family members. Plant Physiology 140: 196–209.
Kane NC, Rieseberg LH. 2008. Genetics and evolution of weedy Helian-thus annuus populations: adaptation of an agricultural weed. MolecularEcology 17: 384–394.
Keller SR, Olson MS, Silim S, Schroeder WR, Tiffin P. 2010. Genomic
diversity, population structure, and migration following range expansion
in the balsam poplar, Populus balsamifera. Molecular Ecology, in press.
Kelly JK. 1997. A test of neutrality based on interlocus associations.
Genetics 146: 1197–1206.
Krutovsky KV, Neale DB. 2005. Nucleotide diversity and linkage disequi-
librium in cold-hardiness- and wood quality-related candidate genes in
Douglas fir. Genetics 171: 2029–2041.
Le Hir H, Nott A, Moore MJ. 2003. How introns influence and
enhance eukaryotic gene expression. Trends in Biochemical Sciences 28:
215–220.
LeRoy CJ, Whitham TG, Keim P, Marks JC. 2006. Plant genes link for-
ests and streams. Ecology 87: 255–261.
Li N, Stephens M. 2003. Modeling linkage disequilibrium and identifying
recombination hotspots using single-nucleotide polymorphism data.
Genetics 165: 2213–2233.
Mackay TFC. 2001. The genetic architecture of quantitative traits. AnnualReview of Genetics 35: 303–339.
Makinen HS, Shikano T, Cano JM, Merila J. 2008. Hitchhiking mapping
reveals a candidate genomic region for natural selection in three-spined
stickleback chromosome viii. Genetics 178: 453–465.
Martin F, Tuskan GA, DiFazio SP, Lammers P, Newcombe G, Podila
GK. 2004. Symbiotic sequencing for the Populus mesocosm. NewPhytologist 161: 330–335.
McCarthy MI, Abecasis GR, Cardon LR, Goldstein DB, Little J,
Ioannidis JPA, Hirschhorn JN. 2008. Genome-wide association studies
for complex traits: consensus, uncertainty and challenges. Nature ReviewsGenetics 9: 356–369.
McCracken KG, Bulgarella M, Johnson KP, Kuhner MK, Trucco J,
Valqui TH, Wilson RE, Peters JL. 2009. Gene flow in the face of
countervailing selection: adaptation to high-altitude hypoxia in the beta
a hemoglobin subunit of yellow-billed pintails in the Andes. MolecularBiology and Evolution 26: 815–827.
McVicker G, Gordon D, Davis C, Green P. 2009. Widespread genomic
signatures of natural selection in hominid evolution. PLoS Genetics 5(5):
e1000471.
Moeller DA, Tiffin P. 2008. Geographic variation in adaptation at the
molecular level: a case study of plant immunity genes. Evolution 62:
3069–3081.
Moeller DA, Tenaillon MI, Tiffin P. 2007. Population structure and its
effects on patterns of nucleotide polymorphism in teosinte (Zea maysssp. Parviglumis). Genetics 176: 1799–1809.
Neale DB, Ingvarsson PK. 2008. Population, quantitative and compara-
tive genomics of adaptation in forest trees. Current Opinion in PlantBiology 11: 149–155.
Neale DB, Savolainen O. 2004. Association genetics of complex traits in
conifers. Trends in Plant Science 9: 325–330.
� The Authors (2010)
Journal compilation � New Phytologist Trust (2010)
New Phytologist (2010) 186: 526–536
www.newphytologist.com
NewPhytologist Research 535
Neiman M, Olson MS, Tiffin P. 2009. Selective histories of poplar prote-
ase inhibitors: elevated polymorphism, purifying selection, and positive
selection driving divergence of recent duplicates. New Phytologist 183:
740–750.
Nielsen DM, Ehm MG, Zaykin DV, Weir BS. 2004. Effect of two- and
three-locus linkage disequilibrium on the power to detect marker ⁄phenotype associations. Genetics 168: 1029–1040.
Nordborg M, Hu TT, Ishino Y, Jhaveri J, Toomajian C, Zheng HG,
Bakker E, Calabrese P, Gladstone J, Goyal R et al. 2005. The pattern
of polymorphism in Arabidopsis thaliana. Plos Biology 3: 1289–1299.
Ohta T. 1983. Linkage disequilibrium with the island model. Genetics101: 139–155.
Ohta T, Kimura M. 1971. On the constancy of the evolutionary rate of
cistrons. Journal of Molecular Evolution 1: 18–25.
Remington DL, Thornsberry JM, Matsuoka Y, Wilson LM, Whitt SR,
Doeblay J, Kresovich S, Goodman MM, Buckler ES. 2001. Structure
of linkage disequilibrium and phenotypic associations in the maize gen-
ome. Proceedings of the National Academy of Sciences, USA 98: 11479–
11484.
Rethmeier N, Seurinck J, VanMontagu M, Cornelissen M. 1997. Intron-
mediated enhancement of transgene expression in maize is a nuclear,
gene-dependent process. Plant Journal 12: 895–899.
Rose AB. 2008. Intron-mediated regulation of gene expression. NuclearPre-Mrna Processing in Plants 326: 277–290.
Rosenberg NA, Pritchard JK, Weber JL, Cann HM, Kidd KK,
Zhivotovsky LA, Feldman MW. 2002. Genetic structure of human
populations. Science 298: 2381–2385.
Rosenberg NA, Mahajan S, Ramachandran S, Zhao CF, Pritchard JK,
Feldman MW. 2005. Clines, clusters, and the effect of study design on
the inference of human population structure. PLoS Genetics 1(6): e70.
Ross-Ibarra J, Wright SI, Foxe JP, Kawabe A, DeRose-Wilson L, Gos G,
Charlesworth D, Gaut BS. 2008. Patterns of polymorphism and demo-
graphic history in natural populations of Arabidopsis lyrata. PLoS ONE3: Article No.: e2411.
Rozen S, Skaletsky H. 2000. Primer3 on the www for general users and for
biologist programmers. In: Krawetz S, Misener S, eds. Bioinformaticsmethods and protocols in the series methods in molecular biology. Totowa,
NJ, USA: Humana Press, 365–386.
SAS 2007. Jmp statistics and graphics guide, release 7. Cary, NC, USA: SAS
Institute, Inc.
Savolainen O, Pyhajarvi T. 2007. Genomic diversity in forest trees.
Current Opinion in Plant Biology 10: 162–167.
Sella G, Petrov DA, Przeworski M, Andolfatto P. 2009. Pervasive natural
selection in the drosophila genome? PLoS Genetics 5(6): e1000495.
Shapiro JA, Huang W, Zhang CH, Hubisz MJ, Lu J, Turissini DA, Fang
S, Wang HY, Hudson RR, Nielsen R et al. 2007. Adaptive genic evolu-
tion in the drosophila genomes. Proceedings of the National Academy ofSciences, USA 104: 2271–2276.
Staedler T, Haubold B, Merino C, Stephan W, Pfaffelhuber P. 2009.
The impact of sampling schemes on the site frequency spectrum in
nonequilibrium subdivided populations. Genetics 182: 205–216.
Stephens M, Donnelly P. 2003. A comparison of Bayesian methods for
haplotype reconstruction from population genotype data. AmericanJournal Of Human Genetics 73: 1162–1169.
Stettler RF, Bradshaw HD, Heilman PE, Hinckley TM. 1996. Biology ofPopulus and its implications for management and conservation. Ottawa,
ON, Canada: NRC Research Press.
Taberlet P, Fumagalli L, Wust-Saucy AG, Cosson JF. 1998. Comparative
phylogeography and postglacial colonization routes in Europe. MolecularEcology 7: 453–464.
Thornton K. 2003. Libsequence: a c++ class library for evolutionary
genetic analysis. Bioinformatics 19: 2325–2327.
Tian DC, Wang Q, Zhang PF, Araki H, Yang SH, Kreitman M,
Nagylaki T, Hudson R, Bergelson J, Chen JQ. 2008. Single-nucleotide
mutation rate increases close to insertions ⁄ deletions in eukaryotes.
Nature 455: 105–U170.
Tuskan GA, DiFazio S, Jansson S, Bohlmann J, Grigoriev I, Hellsten U,
Putnam N, Ralph S, Rombauts S, Salamov A et al. 2006. The genome
of black cottonwood, Populus trichocarpa (Torr. & Gray). Science 313:
1596–1604.
Wakeley J. 2009. Coalescent theory. Greenwood Village, CO, USA: Roberts
and Company Publishers.
Wakeley J, Lessard S. 2003. Theory of the effects of population structure
and sampling on patterns of linkage disequilibrium applied to genomic
data from humans. Genetics 164: 1043–1053.
Weir BS. 2008. Linkage disequilibrium and association mapping. AnnualReview of Genomics and Human Genetics 9: 129–142.
Weir BS, Hill WG. 1980. Effect of mating structure on variation in
linkage disequilibrium. Genetics 95: 477–488.
Wray GA, Hahn MW, Abouheif E, Balhoff JP, Pizer M, Rockman MV,
Romano LA. 2003. The evolution of transcriptional regulation in
eukaryotes. Molecular Biology and Evolution 20: 1377–1419.
Wright SI, Andolfatto P. 2008. The impact of natural selection on the
genome: emerging patterns in drosophila and arabidopsis. AnnualReview of Ecology Evolution and Systematics 39: 193–213.
Wright SI, Gaut BS. 2005. Molecular population genetics and the search
for adaptive evolution in plants. Molecular Biology and Evolution 22:
506–519.
Supporting Information
Additional supporting information may be found in theonline version of this article.
Table S1 List of primers used for this study, the gene frag-ment names and transcript IDs that they amplified, and theexpected lengths of the amplicons
Table S2 List of JGI Transcript IDs, Protein IDs and anno-tations of the 590 gene fragments analysed in this manu-script
Table S3 List of all summary statistics for the 590 genefragments analysed in this manuscript
Please note: Wiley-Blackwell are not responsible for thecontent or functionality of any supporting informationsupplied by the authors. Any queries (other than missingmaterial) should be directed to the New Phytologist CentralOffice.
� The Authors (2010)
Journal compilation � New Phytologist Trust (2010)
New Phytologist (2010) 186: 526–536
www.newphytologist.com
536 Research
NewPhytologist


