Download - October 10, 2017 Current Business Trends

Institute for Supply Management, GreaterGrandRapids,Inc.P.O.Box230621GrandRapids,MI49523-0321
News Release (For Immediate Release) October 10, 2017
Current Business Trends By Brian G. Long, Ph.D., C.P.M. Director, Supply Chain Management Research Grand Valley State University (269) 870-0428 Positive Growth Continues Yes, theWestMichigan economy is still going strong.AccordingtotheWestMichigansurveyconductedduringthe last two weeks of September, NEW ORDERS, ourclosely-watched index of business improvement, rosequietly to +21 from +19. The PRODUCTION indexremained positive but retreated modestly to +17 from+20. Activity in the purchasing offices, our index ofPURCHASES, slowed to +14 from +24. The index ofFINISHED GOODS INVENTORY remained unchanged.However,becauseoftherecenthurricanesandotherwisestrong business conditions, some classes of inventoriesare being drained across the entire country. Hence, theRAWMATERIALS INVENTORIES fell to +3 from +16. Theindexof LEADTIMES remained stretchedat+30, andnooneexpectsreliefanytimesoon.Just aswe have reported formost of the year, all ofour individual industries still remain on track, althoughslightly less robust.Mostautoparts suppliershavebeenconcernedthroughoutthesummerabouttheslowerautosales, so the September bounce in sales seems to haveforestalled any immediate fear of an automotiverecession lurking around the corner. The major officefurniture firms still appear to be topping out at thepresent level, but the smaller firms are having a littlemoresuccess.Thecapitalequipmentfabricatorsstillhavebusiness coming in, but the pace has slowed for mostfirms.Fortheindustrialdistributors,themoodisstable.Fortunately, business optimism still remains strong inWest Michigan. Our September survey of the SHORTTERMBUSINESSOUTLOOK,which asks local firms abouttheperceptionforthenextthreetosixmonths,remainedunchanged at +30. Looking out three to five years, theLONGTERMBUSINESSOUTLOOKedgedslightlyhigherto+45,upfrom+39.Theanecdotalcommentsbythesurveyparticipants continue to be cautiously optimistic,althoughmost firms clearly recognize that theremaybelittle room for additional growth unless something likethelong-promisedtaxcutsfinallymaterialize.At the national level, there is still a divergence ofopinion regarding the direction of the economy. TheOctober 2 press release from the Institute for SupplyManagement, our parent organization, came in evenmore bullish than last month. ISM’s index of NEWORDERSjumpedto+26from+18.ThePRODUCTIONindexrosemodestlyto+21from+20.TheEMPLOYMENTindexcame off its five-year high of +19, easing marginally to+17. The expansion of INVENTORIES, which had jumpedto +11 lastmonth, eased to amore normal level of +5.Afterpostinga six-yearhighof58.8percent lastmonth,ISM’soverallindexforSeptemberjumpedevenhighertoathirteen-yearhighof60.8.Needlesstosay,thisindexisnearing its highest level since the post-war recovery in1948. This level of performance was certainly notexpectedorpredicted.Now for the confusion. IHS Markit.com, the Britisheconomics consulting firm, also surveyed industrialpurchasingagentsthroughouttheU.S.aswellastherest
of theworld.Although theMarkit report is still positive,thepaceofexpansionforNEWORDERSretreatedforthesecond month in a row. The PRODUCTION indexremained unchanged at a positive butmuted level. TheIHSMarkitPMIfortheU.S.cameinat53.1,alittlehigherthan last month’s 52.8, but still very subdued whencompared to thenear-record report filedby ISM for thesame time period. Although the headline for the reportwas still termed “improved,” ChrisWilliamson, the chiefbusiness economist for Markit, struck a less optimistictone:
“WhiletheheadlinePMIremainedresilientlyelevated inSeptember, despite disruption from hurricanes Harveyand Irma, the details of the survey are more worrying.Output growth was unchanged on August’s 14-monthlow,andtranslatesintostagnationatbestintermsoftheofficialmanufacturingoutputdata.Firms’expectationsoffuture output growth also slipped to a four-month low.There was better news on the hiring front, with jobcreationperkinguptoanine-monthhigh.However,withemployment rising faster than output, productivity maybeslipping.Althoughthehurricanesappeartohavemadelittle overall impact on production, supply delays werewidely reported and prices for many inputs rose,suggesting some near-term upward pressure oninflation.”
Much aswehave seen for the past fewmonths, theeconomyfortherestoftheworldcontinuesto improve.Canada and Mexico, our two largest trading partners,turnedinstrongreportsforSeptember.Whereasmostofthemajor economieswere improving over the summer,growthinSeptemberslowedinChina,Japan,andtheUK.J.P.Morgan’sGlobalManufacturingsurveyof31nationscame in unchanged at 53.2. The survey author furthernoted:
“Theglobalmanufacturingsectorcontinuedtoexpandata solid and stable clip in September, as output growthtickedhigherandneworderscontinuedtoriseatoneofthebestratesoverthepastthreeyears.Thesectorlooksto have sufficient momentum to see growth continuethroughtoyear-end,even inthefaceofarecentrevivalincostinflationarypressures.”
FortheEuropeaneconomy,thenewscontinuestogetbetter and better. The Purchasing Manager’s Indexes(PMIs)forGermany,Netherlands,andAustrialedthewayat 60.6, 60.0, and 59.4, respectively. Even beleagueredFrance came in with a PMI of 56.1, a 77-month high.Greececontinuestoclimboutoftheeconomicabyss,andcameinwitha111monthPMIhighof52.8.IHSMarkit’schiefeconomistcommented:
“TheEurozonemanufacturingboomkicked intoanevenhigher gear in September,with thePMI rising to a levelsurpassedonlyonceinthepast17years.Therecoveryisalsolookingincreasinglybroad-based,withrisingdemandacross the region lifting all boats. Surging order bookgrowth has encouragedmanufacturers to take on extra

staffatarateneverpreviouslyseeninthe20-yearhistoryof the PMI survey. Despite the expansion of capacity,backlogs of incomplete work built up at a faster rate,suggesting that the hiring upturnhas plentymore roomtorun.”
For auto sales, the September report reversed thenegative pattern of the past sixmonths and reported asignificantsalesgain.Althoughautosalesweredueforabounce, a largeportionof this gain canbeattributed tothe estimated one or two million cars that were eitherdamaged or destroyed by the Texas (and, to a lesserdegree, Florida) hurricanes. Among the major brands,Ford sales gained 8.9 percent, GM rose 11.9 percent,Honda added 6.8 percent, and Toyota was a winner by14.9 percent. At 21.4 percent, Volkswagen posted thebiggestgain.However,asalesdeclineof9.7percent leftFiatChryslerwellbehindtherestofthemajorbrands.Fortheentireindustry,saleswereup6.8percent.However,itiswisetorememberalloftheseyear-over-yearnumbersthatarequotedforautomobilessalesarereally forbothcars and light trucks. Hence, the 6.8 percent sales gainactuallybreaksdowntoa12.0percent increase for lighttruckandSUVsales,offsetbya3.3percentdeclineincarsales.Needless to say, Hurricanes Harvey and Irma will betalked about for decades. After many years withoutnatural disasters having a major lasting effect on theeconomy, these two storms coming back–to-back aredefinitelyhavinganimpactasfarnorthasWestMichigan.Hurricane Nate came close behind, but the devastationwas far less. Much as we expected, the demand forplywood,roofingmaterials,anddrywallhavedrivenmostmaterialcostshigher.Manyof theplasticmoldingshopsin West Michigan have been hit with higher costs formosttypesofplasticresins,eventhoughthesuppliersintheTexas-Louisianaareawereonlyofflineforafewdays.Because of tight inventories for many commodities,prices have been rising. After remaining relativelydormant formanymonths, inflation isagainbecomingacauseforconcern.Thehurricanesdisruptedmanyofthesupplychains,resultinginourlocalindexofPRICESrisingto+29frim+15.However,oneofoursurveyrespondentsnoted that the economic impact of the hurricanes forWest Michigan could have been worse. ISM’s index of
LEAD TIMES jumped to +28 from +14, and the tightersupplychainshavebeenusedasanexcusetoraiseprices.ISM’s indexofPRICESrocketedto+43,upfrom+24,andJ.P.Morgan’sinternationalindexofPRICESrosetoafive-yearhighof60.8.However,itisalsothestrengtheningofthe major economies around the globe that is coaxingmanymajorcommoditiestoedgeupinprice.For September, there was more news about GDP.Although the Gross Domestic Product calculations wereformulatedback inthe1930’sbasedontheassumptionsofamuchsimplerworld,nooneasyethasformulatedanew index to replace it. Hence, the reports for thequarterlyGDPreadingsalwaysmakenews.OnSeptember28, the CommerceDepartment released a “final” reportof a 3.1 percent GDP growth rate for the April-Junequarter, the best report since the first quarter of 2015.The upward revision is marginally higher than theprevious estimate of 3.0 percent growth, andconsiderablyhigherthanthe1.2percentgrowthrateforthe first quarter of 2017. Estimates for the July-Septemberperiodarenowrunningabout2.2percent,butspending resulting from the recent hurricanes are nowforecastedtoraiseGDPabove3.0percentforthefourthquarter.However,itshouldbenotedthattheseforecastshavenotbeenespeciallyaccurateinthepast.In summary, theprices forpetroleumandpetroleum-related products are now returning to pre-hurricanelevels,althoughHurricaneNatemayhavelengthenedtherecovery period. The reconstruction efforts for thehurricaneshavedrivenpriceshigher forawide rangeofproducts. The world economy, and especially theeconomy in Western Europe, continues to strengthen,resulting in the prices rising for many industrialcommoditiessuchassteel,zinc,andbrass.TheEuropeanCentralBankisnowtalkingaboutinflationreturningtoanunacceptable level, which probably means that interestrateswillstarttoedgehigher.Thethreatofanaltercationwith North Korea or other Middle Eastern countriescontinue tobe ignoredby themarkets and thebusinesscommunity in general. Some simply call theseuncertainties the “new norm.” That said, the economicpath ahead of us continues to be positive for theforeseeable future IF the geopolitical situation remainsstable.
SEPTEMBERCOMMENTSFROMSURVEYPARTICIPANTS
“Hurricaneeffectswereminimalonoursupply
chainfromasupplystandpoint.However,thiseventprovidedanopportunityforpriceincreasesfromnearlyallthemajorpiecesofoursupplychain.”
“Withsummeraboutover,vacationsdone,kids
backinschool,it'stimetogetbacktobusiness!‘Let'sgolookatthatmachinery’!“
“Augustwasoneofourbestmonthsoftheyear,
BUTitlookslikewearepayingforthatinSeptember.Ifthingsdon'tpickupthelasttwomonths,thismaybetheworstmonthoftheyear.It’scertainlynotthewaywewantedtoendthequarter.”
“It’sslowbutsteadyonorderintake.”“Augustwassurprisinglyrobust.”
“Ourthirdquarterisfinishingsolidasexpected.For
thefourthquarter,weareseeinganuptick.”“Businessisgoodandholding.Themedicalmarket
isstillhot.”“Sofar,giventhedamageintheHoustonarea,the
supplydisruptionsarelessthanweexpected.”“Wearesettingprettygood,evenwiththe
disruptionsfromthehurricanes.Wearecurrentlyslow,butpickingupaswegointothefourthquarter.”
“Transportationfundingremainsstrongforthenext
fewmonths,butprojectionsafterthefirstoftheyeararequestionable.”
“Businessissteady,however,weareseeingsome
productlinesmuchslowerthanothers.Weshouldbebusier.”
“Thefourthquarterwillbeverybusyasusual.Businessissolid.”
“Continuedcautiousoptimism.Controlledgrowth.Choosingcustomersandpartswisely.”
“Thereisstilllotsofactivityinthesalesarea.”“Saleshavebeentrendingupthismonth,butwe’re
stillunsurewhatimpactthehurricanewillhave.We’reseeingsomesignsthatprojectsarestartingtomoveagain.”
“Businessissteady,butquotingforourcustomers
hasslowed.”“Recenthurricanesseemtobeasupplyfactorfor
someitems.”“Ourbusinessissteady.”“Thechickenortheeggisgoingonhere.Workis
availabletowin,butwillthebodies(workers)beavailableifthewinsoccur.”
“Businessoutlookcontinuestolookgreat!”
September2017SurveyStatisticsSept. Aug. July 25 Year
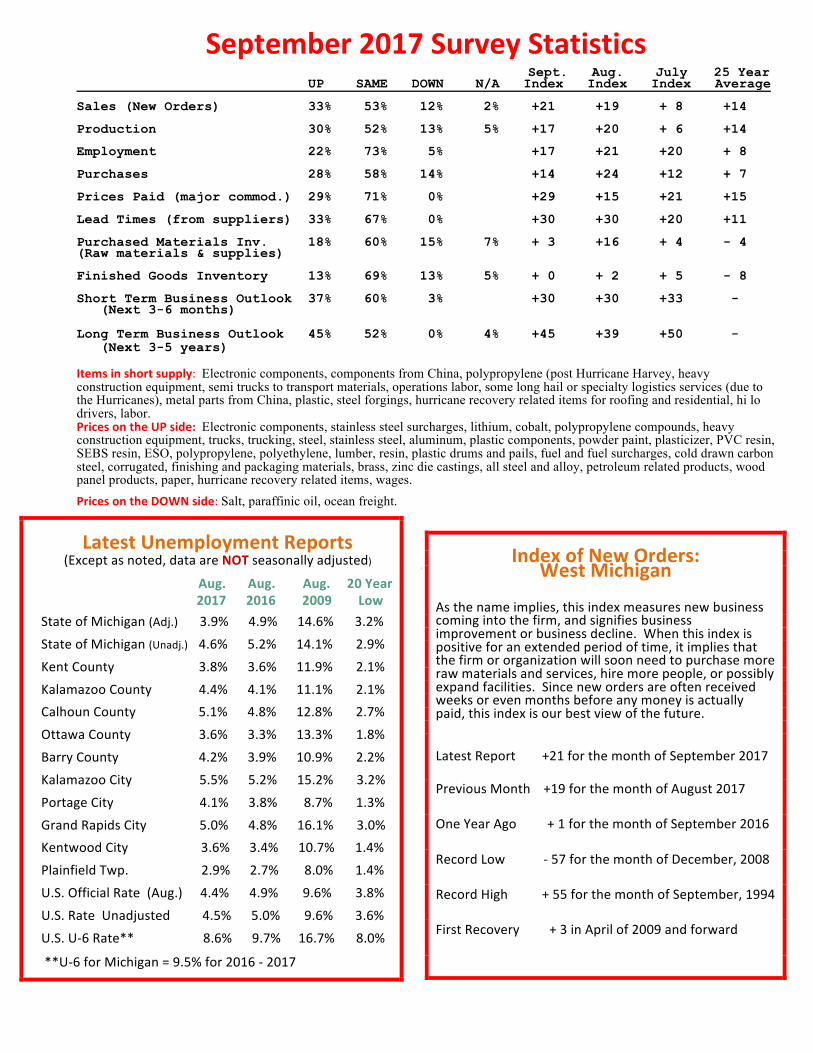
UP SAME DOWN N/A Index Index Index Average Sales (New Orders) 33% 53% 12% 2% +21 +19 + 8 +14 Production 30% 52% 13% 5% +17 +20 + 6 +14 Employment 22% 73% 5% +17 +21 +20 + 8 Purchases 28% 58% 14% +14 +24 +12 + 7 Prices Paid (major commod.) 29% 71% 0% +29 +15 +21 +15 Lead Times (from suppliers) 33% 67% 0% +30 +30 +20 +11 Purchased Materials Inv. 18% 60% 15% 7% + 3 +16 + 4 - 4 (Raw materials & supplies) Finished Goods Inventory 13% 69% 13% 5% + 0 + 2 + 5 - 8 Short Term Business Outlook 37% 60% 3% +30 +30 +33 - (Next 3-6 months) Long Term Business Outlook 45% 52% 0% 4% +45 +39 +50 - (Next 3-5 years) Itemsinshortsupply:Electronic components, components from China, polypropylene (post Hurricane Harvey, heavy construction equipment, semi trucks to transport materials, operations labor, some long hail or specialty logistics services (due to the Hurricanes), metal parts from China, plastic, steel forgings, hurricane recovery related items for roofing and residential, hi lo drivers, labor. PricesontheUPside:Electronic components, stainless steel surcharges, lithium, cobalt, polypropylene compounds, heavy construction equipment, trucks, trucking, steel, stainless steel, aluminum, plastic components, powder paint, plasticizer, PVC resin, SEBS resin, ESO, polypropylene, polyethylene, lumber, resin, plastic drums and pails, fuel and fuel surcharges, cold drawn carbon steel, corrugated, finishing and packaging materials, brass, zinc die castings, all steel and alloy, petroleum related products, wood panel products, paper, hurricane recovery related items, wages. PricesontheDOWNside:Salt, paraffinic oil, ocean freight.
LatestUnemploymentReports
(Exceptasnoted,dataareNOTseasonallyadjusted)
Aug.Aug.Aug.20Year201720162009LowStateofMichigan(Adj.)3.9%4.9%14.6%3.2%StateofMichigan(Unadj.)4.6%5.2%14.1%2.9%KentCounty 3.8%3.6%11.9%2.1%KalamazooCounty 4.4%4.1%11.1%2.1%CalhounCounty5.1%4.8%12.8%2.7%OttawaCounty 3.6%3.3%13.3%1.8%BarryCounty 4.2%3.9%10.9%2.2%KalamazooCity5.5%5.2%15.2%3.2%PortageCity4.1%3.8%8.7%1.3%GrandRapidsCity5.0%4.8%16.1%3.0%KentwoodCity3.6%3.4%10.7%1.4%PlainfieldTwp.2.9%2.7%8.0%1.4%U.S.OfficialRate(Aug.)4.4%4.9%9.6%3.8%U.S.RateUnadjusted4.5%5.0%9.6%3.6%U.S.U-6Rate**8.6%9.7%16.7%8.0%**U-6forMichigan=9.5%for2016-2017
IndexofNewOrders:WestMichigan
Asthenameimplies,thisindexmeasuresnewbusinesscomingintothefirm,andsignifiesbusinessimprovementorbusinessdecline.Whenthisindexispositiveforanextendedperiodoftime,itimpliesthatthefirmororganizationwillsoonneedtopurchasemorerawmaterialsandservices,hiremorepeople,orpossiblyexpandfacilities.Sincenewordersareoftenreceivedweeksorevenmonthsbeforeanymoneyisactuallypaid,thisindexisourbestviewofthefuture.
LatestReport+21forthemonthofSeptember2017
PreviousMonth+19forthemonthofAugust2017
OneYearAgo+1forthemonthofSeptember2016
RecordLow-57forthemonthofDecember,2008
RecordHigh+55forthemonthofSeptember,1994
FirstRecovery+3inAprilof2009andforward

ISM-WestMichiganIndexofNewOrders1988-2017
-70
-50
-30
-10
10
30
50
70
1989
1990
1991
1992
1993
1994
1995
1996
1997
1998
1999
2000
2001
2002
2003
2004
2005
2006
2007
2008
2009
2010
2011
2012
2013
2014
2015
2016
ISM-WestMichiganIndexofNewOrders:2005-2017Only
2005
2006
2007
2008
2009
2010
2011
2012
2013
2014
2015
2016
2017

ISM-WestMichiganIndexofEmploymentTheindexofEMPLOYMENTmeasuresthefirm’sincreasesanddecreasesinstaffing,includingpermanentworkersandtemps.Aftereconomicdownturns,itmeasurenewhiresaswellaspreviousworkerscalledbacktowork.Whenthisindex ispositiveforanextendedperiodoftime, italmostalwayssignalsareduction in industrialunemploymentforWestMichigan. Normally, there is aboutamonthor two in lag timebetween this report and thepayroll numbersbeing reflectedby thegovernment statistics. However, almostall employment indexesare laggards,meaning thatfirmsoftenwaituntilupticks inordersareconfirmedbeforeaddingstaff,andconversely layingoffstaffonlyafteradownturninordersappearstobecertainfortheforeseeablefuture.
ISM-WestMichiganFutureBusinessOutlook
TheindexesofLONGTERMBUSINESSOUTLOOKandSHORTTERMBUSIESSOUTLOOKprovideaglimpseatcurrentandfutureattitudesofthebusinesscommunity.Traditionally,mostbusinessesaremoreoptimisticaboutthelongterm,although current event can result in perceptions changing very rapidly. Both short and long term attitudes reflectcurrentbusinessconditions,andareusuallyhigherwhensales,production,andemploymentarepositive.
-60
-40
-20
0
20
40
60
2005
2006
2007
2008
2009
2010
2011
2012
2013
2014
2015
2016
2017
ISM-WESTMICHIGANEMPLOYMENTINDEX2005-2017
0
10
20
30
40
50
60
70
Sept-13
13-Nov
14-Ja
n
14-M
ar
14-M
ay
14-Ju
l
14-Sep
14-Nov
15-Ja
n
15-M
ar
15-M
ay
15-Ju
l
15-Sep
15-Nov
16-Ja
n
16-M
ar
16-M
ay
16-Ju
l
16-Sep
16-Nov
17-Ja
n
17-M
ar
17-M
ay
17-Ju
l
17-Sep
.LONGTERMBUSINESSOUTLOOK(3-6MONTHS)SHORTTERMBUSINESSOUTLOOK(3-5YEARS)


