Download - October 11, 2015 Data Analysis on Massive Online Game Logs Dora Cai – NCSA, Univ. of Illinois

April 19, 2023
Data Analysis on Massive Online Game Logs
Dora Cai – NCSA, Univ. of Illinois
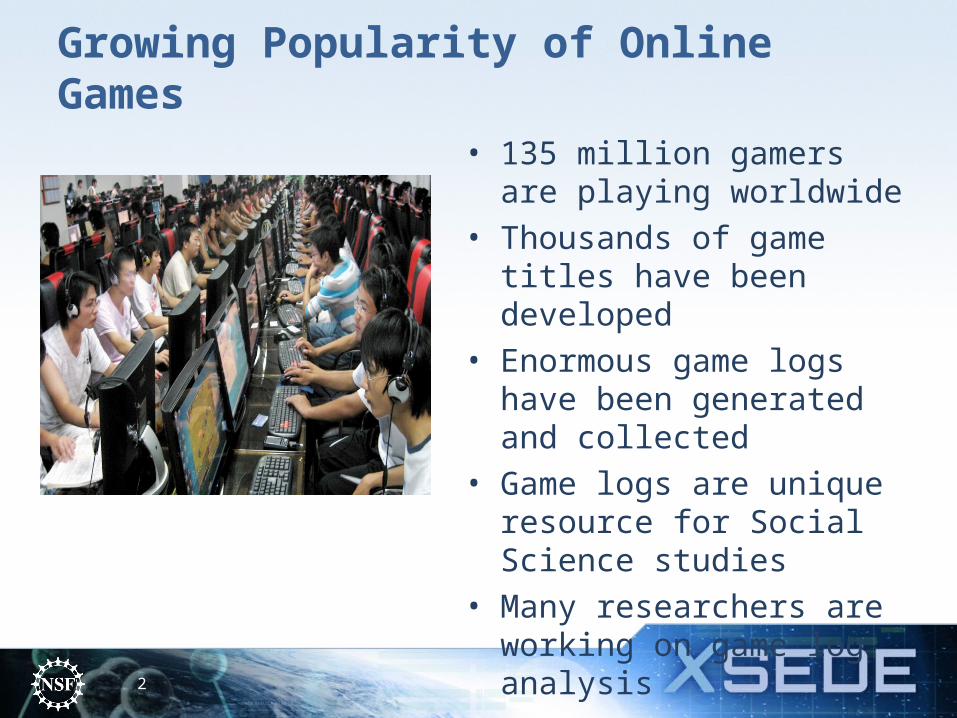
Growing Popularity of Online Games
2
• 135 million gamers are playing worldwide
• Thousands of game titles have been developed
• Enormous game logs have been generated and collected
• Game logs are unique resource for Social Science studies
• Many researchers are working on game log analysis

The Research Team
3
Started in 2007, about 20 members
University of Illinois at Urbana-Champaign
Professor Marshall Scott Poole, post-doctoral scholars and PhD students
Northwestern University
Professor Noshir Contractor, post-doctoral scholars and PhD students
University of Southern California
Professor Dmitri Williams and PhD students
University of Minnesota - Twin Cities
Professor Jaideep Srivastava and PhD students

Project Data Flow
4
Internet Players Game Logs UIUC Database
Analysis Software
Gordon Cluster

Research Issues in Game Log Analysis
5
Are there social networks behind the scene?
What are the characteristics of the social networks in game play?
Is player’s behavior predictable?
Does player’s behavior reflect his/her personality?
What is the relationship between the virtual world and real world?
What is the impact of game play on player’s personal life?
Does team assembly improve play performance?

Project Achievement
6
Project has been funded by NSF, ARI, AFRL, and ARL
More than 40 conference and journal papers have been published
More than 30 graduate students have been trained
8 PhD students worked on this project have graduated
A comprehensive game log database has been constructed
Project has attracted collaborations from many academic institutions and game companies
A spinoff company has been created by two of the PIs
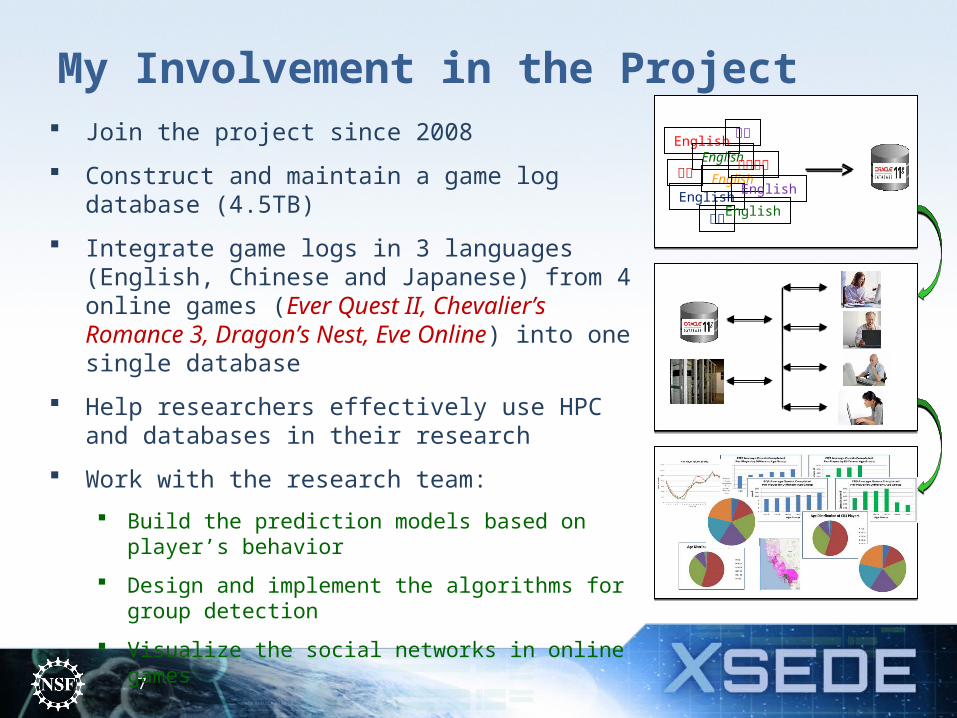
My Involvement in the Project
7
Join the project since 2008
Construct and maintain a game log database (4.5TB)
Integrate game logs in 3 languages (English, Chinese and Japanese) from 4 online games (Ever Quest II, Chevalier’s Romance 3, Dragon’s Nest, Eve Online) into one single database
Help researchers effectively use HPC and databases in their research
Work with the research team:
Build the prediction models based on player’s behavior
Design and implement the algorithms for group detection
Visualize the social networks in online games
EnglishEnglish
EnglishEnglish
中文
中文
日本語の
English
English
中文
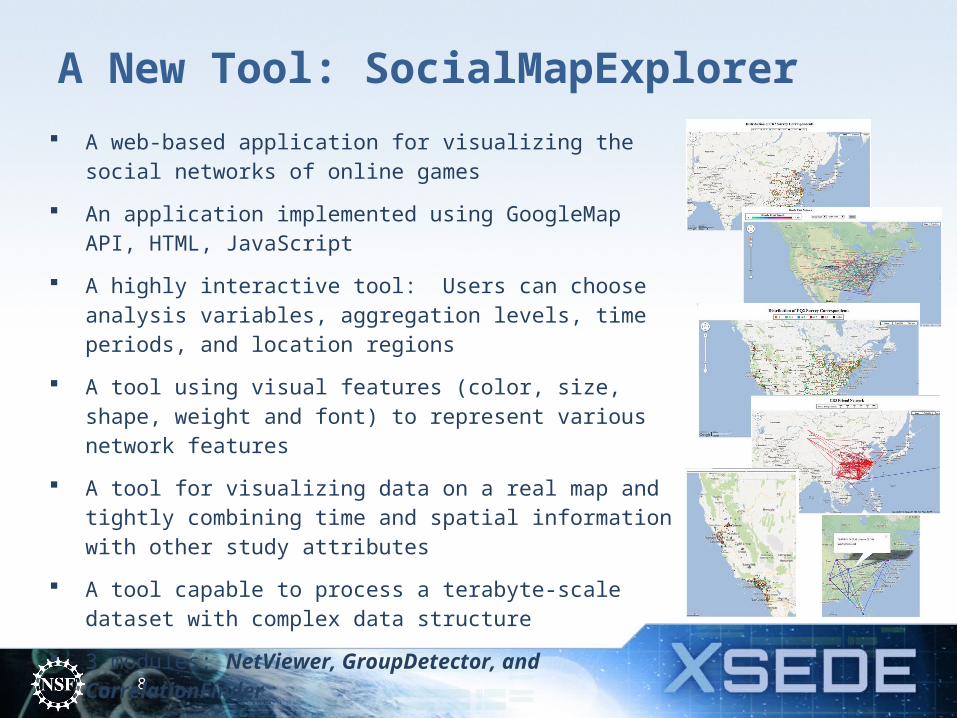
A New Tool: SocialMapExplorer
8
A web-based application for visualizing the social networks of online games
An application implemented using GoogleMap API, HTML, JavaScript
A highly interactive tool: Users can choose analysis variables, aggregation levels, time periods, and location regions
A tool using visual features (color, size, shape, weight and font) to represent various network features
A tool for visualizing data on a real map and tightly combining time and spatial information with other study attributes
A tool capable to process a terabyte-scale dataset with complex data structure
3 modules: NetViewer, GroupDetector, and CorrelationFinder

Work Flow for SocialMapExplorer
9
Step 1: Data summarization
Apply data-mining/data-warehouse techniques to construct materialized views on data cubes
Step 2: Geocoding
Match players’ zip-code with an official USA zip-code book and assign latitude/longitude coordinates for each player
Step 3: Data visualization
Visualize data on real maps
Player Zip-Code Latitude Longitude
1234567 15603 -122.26252 37.90194
2345678 44327 -56.77754 23.78321
…… ….. …… ……
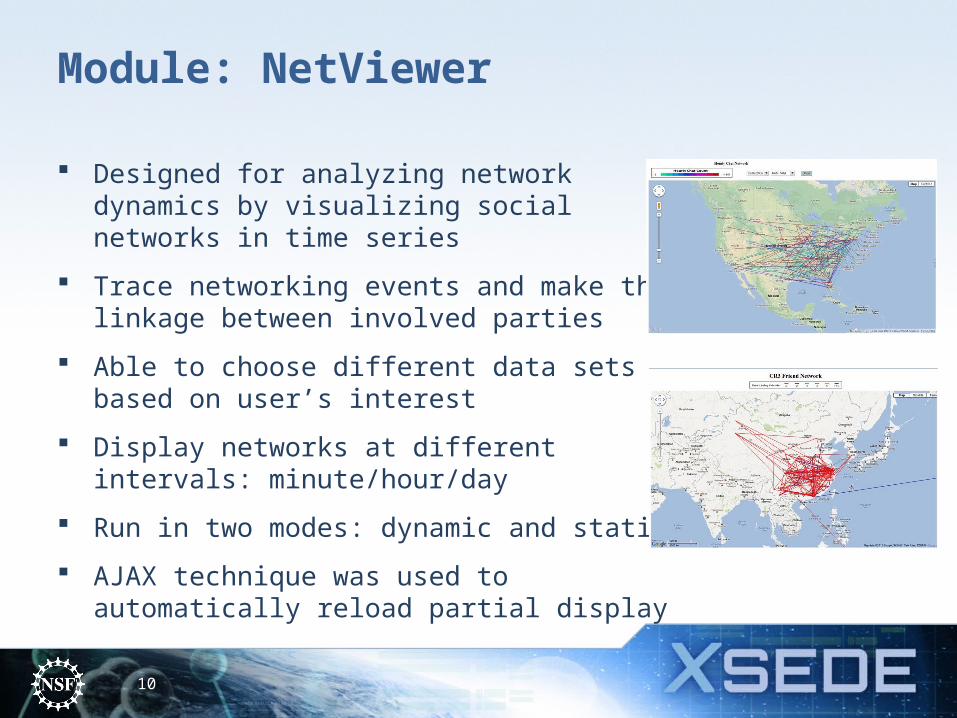
Module: NetViewer
10
Designed for analyzing network dynamics by visualizing social networks in time series
Trace networking events and make the linkage between involved parties
Able to choose different data sets based on user’s interest
Display networks at different intervals: minute/hour/day
Run in two modes: dynamic and static
AJAX technique was used to automatically reload partial display
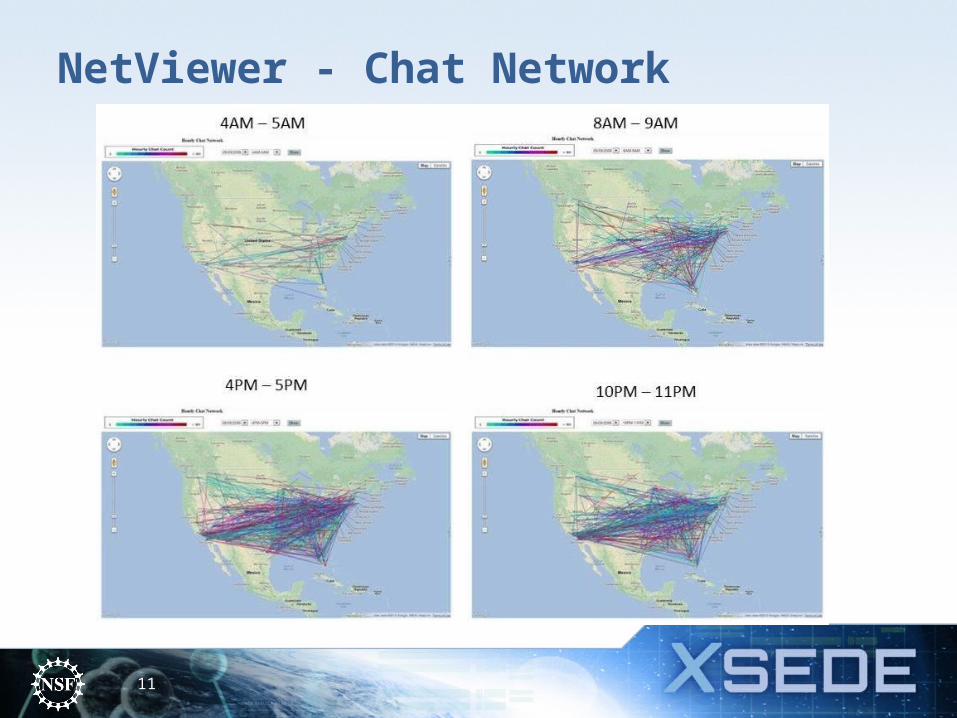
NetViewer - Chat Network
11

Module: GroupDetector
12
Designed to detect groups and visualize group evolution
Scan game logs and identify the trigger events for group reorganization
Able to choose game tasks and time periods
Display single group or multiple groups
Can run in two modes: dynamic and static
Use AJAX technique to automatically reload partial display

GroupDetector - Group evolution in a task
13
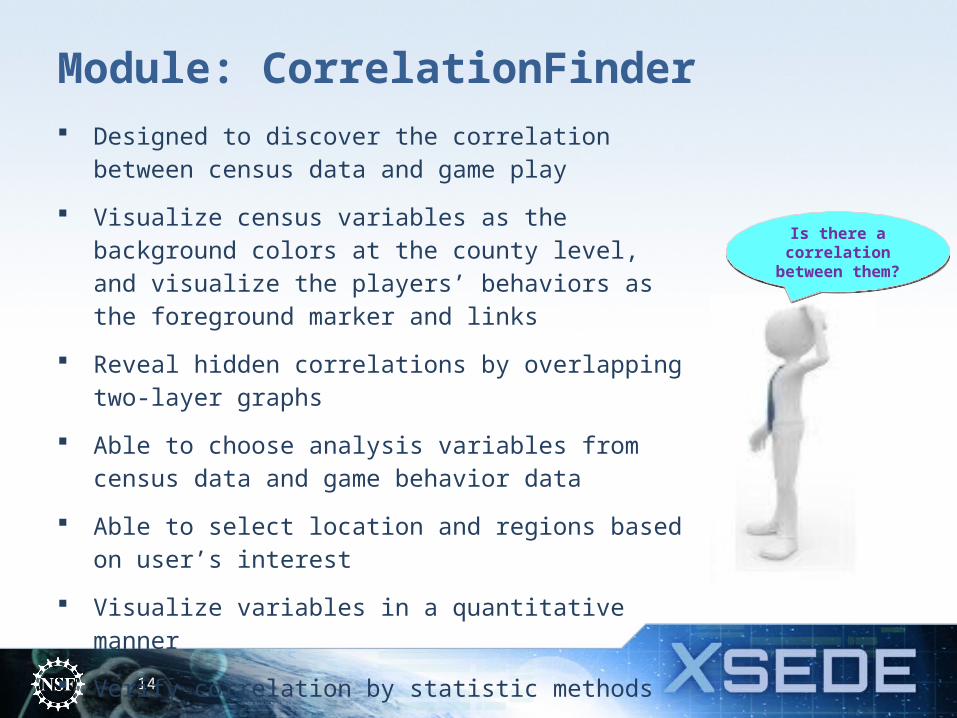
Module: CorrelationFinder
14
Designed to discover the correlation between census data and game play
Visualize census variables as the background colors at the county level, and visualize the players’ behaviors as the foreground marker and links
Reveal hidden correlations by overlapping two-layer graphs
Able to choose analysis variables from census data and game behavior data
Able to select location and regions based on user’s interest
Visualize variables in a quantitative manner
Verify correlation by statistic methods
Is there a correlation between
them?
Is there a correlation between
them?
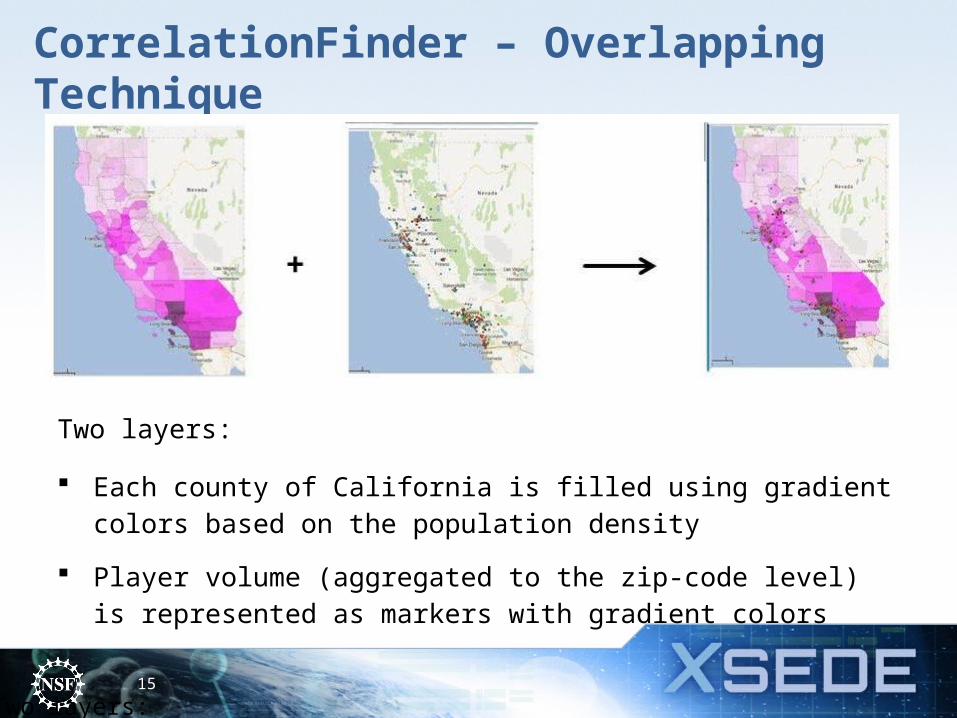
CorrelationFinder – Overlapping Technique
15
Two layers:
Two layers:
Each county of California is filled using gradient colors based on the population density
Player volume (aggregated to the zip-code level) is represented as markers with gradient colors
16
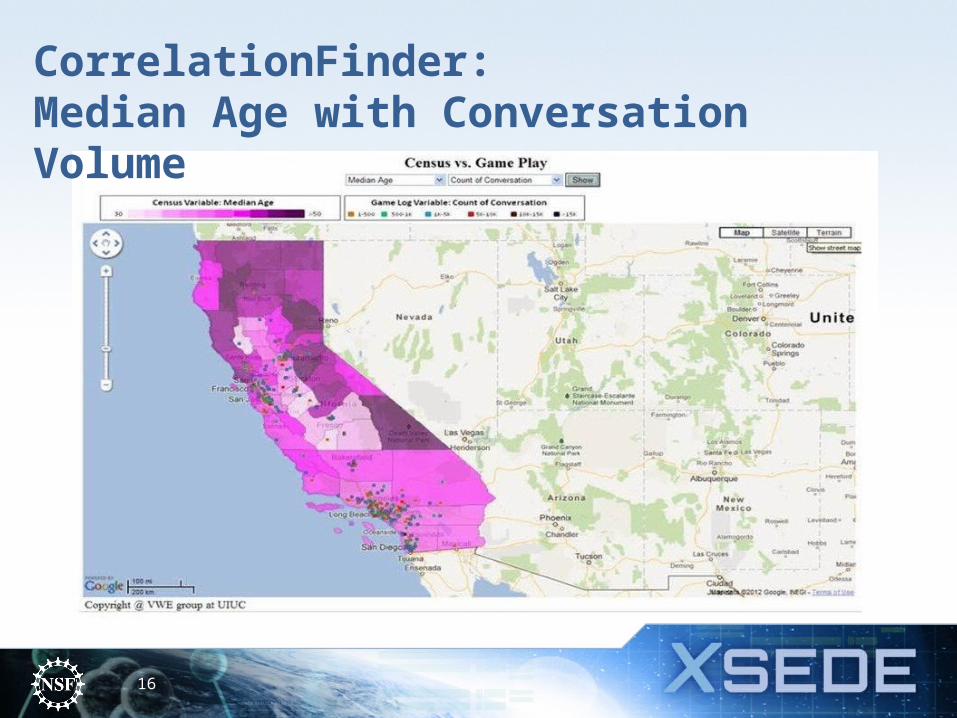
CorrelationFinder:Median Age with Conversation Volume

Computation Complexity
17
Major computation cost:
Data Summarization
Geocoding
Data Visualization
m – number of rows (R) in game logsn – number of time and location attributes (A)p – number of aggregation levels (L)
m – number of Players(P) in game logsn – number of zip-code in the zip-code book(Z)
x – number of snapshots in time series (T)m – number of edges (E) in drawingn – number of markers (R) in drawingp – number of links (L) in drawing
Data Analysis on Gordon
18
Massive computer nodes with rich memory on Gordon speed up the data processing
On standalone sever: With 8 CPUs and 12GB RAM, data summarization and geocoding took over 500 hours
On Gordon: 8 parallel jobs with each using 16 cores, all jobs done with 48 hours
Software stack, especially R, supported on Gordon allows the project to run lengthy and complex data analysis
The system support group and consulting office at SDSC always provide prompt services
We appreciate the effort of the SDSC’s Gordon team


