
Office for National Statistics & Public Health
Dr Azeem MajeedOffice for National Statistics & University College London

Structure of session
• Structure & function of ONS• Recent developments in
government statistics & analysis• Small group work on primary care
data

Learning objectives
• ONS - structure & function• Health related data• Future developments in
government statistics• Opportunities for training &
collaborative work• DH review of primary care data

What is the ONS?
• Formed in 1996 by the merger of Office of Population Censuses and Surveys & Central Statistical Office
• Main arm of the government statistical service
• Responsible for publication of wide range of government statistics

Public health related work
• Health & Care• Population & vital statistics

Health & Care
• Mortality• Morbidity• Child Health• Cancer• Longitudinal survey• Geographical variations

Publications
• Health Statistics Quarterly• Population Trends• Ad-hoc publications• Web site (www.statistics.gov.uk)

Opportunities for training
• ONS approved location for SpR training• Previous projects include accidents,
deaths from overdose, atrial fibrillation, epilepsy.
• Development of analytical skills, knowledge of routine data sources & publication of work encouraged
• SpRs from other specialties

Supporting public health I
• Collection & analysis of routine statistics
• Decennial census• Population estimates• Deprivation measures• Birth & death rates• Cancer incidence & survival• Teenage conception rates

Supporting public health II
• Primary care• Health inequalities• Measuring the burden of disease• Reducing suicide• New methods of measuring case-
mix

Primary care
• Prevalence of chronic diseases• Prescribing rates• Time trends• Variations
– Regional, socio-economic, practice
• Provide information for planning health services for DOH, PCTs etc.

Prevalence of atrial fibrillation per 1,000 among 1,4 million patients from 211 general practices in 1998
0
20
40
60
80
100
120
0-34 35-44 45-54 55-64 65-74 75-84 85+ All ages
Age Group
Prev
alenc
e per
1,00
0

Percentage of men with atrial fibrillation prescribed oral anticoagulants in 1994 and 1998
0
5
10
15
20
25
30
35
40
45
0-34 35-44 45-54 55-64 65-74 75-84 85+ All ages
Age Group
Perc
entag
e pre
scrib
ed or
al an
ticoa
gulan
ts 1994
1998

Percentage of men and women with AF prescribed anticoagulants in 1998
0
5
10
15
20
25
30
35
40
45
35-44 45-54 55-64 65-74 75-84 85+ All ages
Age Group
Perc
enta
ge Men
Women

Relative risks in AF patients
45-64 yrs 65-74 yrs 75+ yrs
IHD 4.5 2.6 2.5
Heart failure 33.5 7.5 3.7
Raised BP 2.5 1.4 1.5
Diabetes 1.6 1.4 1.1
Stroke 8.6 3.2 2.9
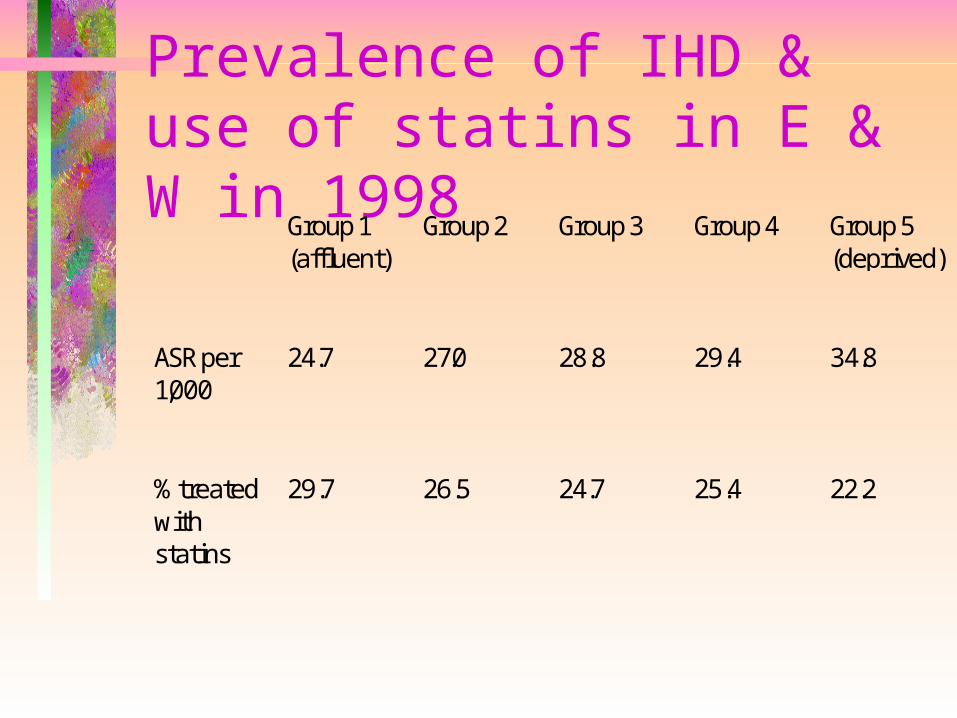
Prevalence of IHD & use of statins in E & W in 1998
Group 1(affluent)
Group 2 Group 3 Group 4 Group 5(deprived)
ASR per1,000
24.7 27.0 28.8 29.4 34.8
% treatedwithstatins
29.7 26.5 24.7 25.4 22.2

Some other diseases examined• Heart failure• Hypertension• Asthma• Epilepsy• Schizophrenia• Peptic ulceration

Annual No. of contacts with GPs Group 1
Affluent
Group 2 Group 3 Group 4 Group 5 Deprived
Mean No. of contacts
4.01 4.28 4.52 4.79 4.74

Referral rates per 1,000 (males)
Group 1 Affluent
Group 2 Group 3 Group 4 Group 5 Deprived
Total 131.9 120.4 118.6 120.4 115.9
Medical 20.0 17.3 16.6 17.4 16.8
Surgical 29.2 27.0 27.8 28.1 26.9
Paeds 42.9 31.0 30.5 31.0 27.6

Referral rates per 1,000 (females) Group 1
Affluent
Group 2 Group 3 Group 4 Group 5 Deprived
Total 170.6 158.2 161.6 159.8 160.4
Medical 20.3 17.9 17.4 18.3 18.9
Surgical 32.7 27.4 29.5 28.0 29.2
Paeds 37.9 30.8 29.7 29.7 28.7

Reducing deaths from suicide• Reducing deaths from overdose an
important component• GPs will play an important role• New database of deaths from
overdose developed by ONS• Allows more sophisticated and
flexible analyses than previously

Deaths from opiate overdose and poisoning per million population, England and Wales 1993-1998
05
10
15202530
3540
1993 1994 1995 1996 1997 1998
Year
Rate
per m
illion
Males
Females
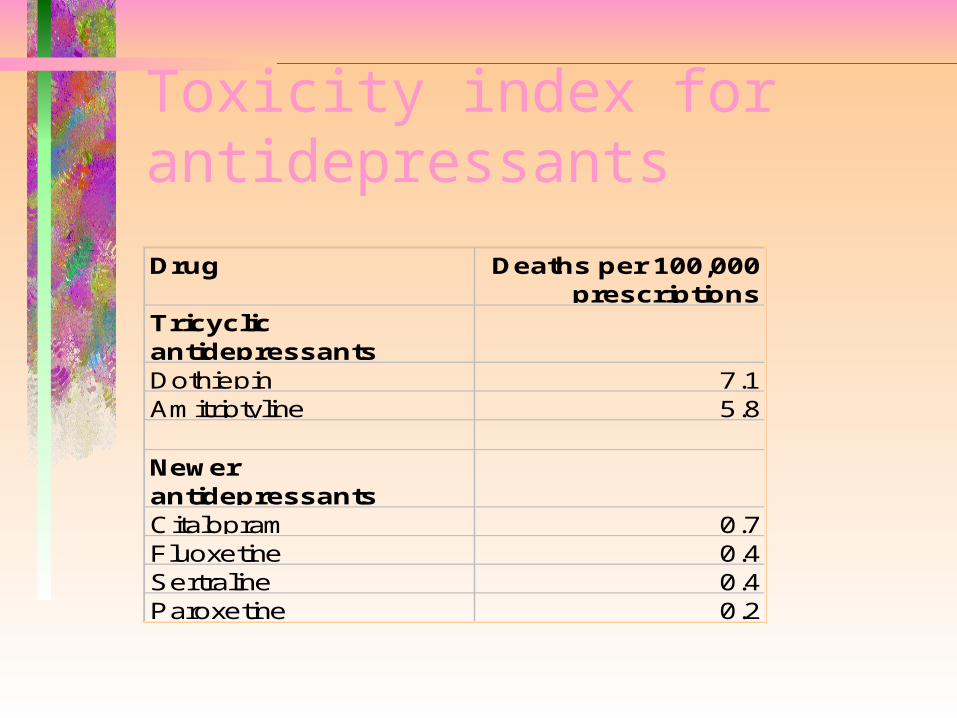
Toxicity index for antidepressants
Drug Deaths per 100,000 prescriptions
Tricyclic antidepressantsDothiepin 7.1Amitriptyline 5.8
Newer antidepressantsCitalopram 0.7Fluoxetine 0.4Sertraline 0.4Paroxetine 0.2

Deaths from overdose & poisoning in England & Wales by area deprivation, 1993-1998
0
1000
2000
3000
4000
5000
6000
1 2 3 4 5
Enumeration district group
Numb
er of
death
s Males
Females

Measuring case-mix in primary care• Comparing performance• Examining use of resources• Adjusting referral rates• Case mix measurement based on
patients’ medical history• Budget setting

Percentage referred in one year
Case mix group A 2.7
Case mix group B 10.1
Case mix group C 16.1
Case mix group D 28.9
Case mix group E 36.3
Case mix group F 45.4

Burden of disease
• Measuring the burden of disease• GP consultations• Prescribing• Referrals• Admissions• Projections

Hip fracture admissions among over 65 year olds in England
1998 2022 Increase
Men 11,562 16,410 +42%
Women 45,984 53,126 +12%
Total 57,546 69,536 +21%

Other areas
• Teenage pregnancy• Social & regional variations• Health surveys• Linkage studies• Child health• E-Strategy (www.statistics.gov.uk)

Conclusions
• Work of ONS & ONS data important to people working in public health
• Learn how to use data to help plan & monitor health services and the health of the public

Primary care data
• Department of Health reviewing primary care data
• Workshop in August/September• Report later this year

Issues to be considered
• Who are the users of primary care data?
• What data are currently available?• What are the strengths & limitations
of these data?• How can primary care data be used?• How can data from primary care be
improved?


