
Edition Forty Seven — February 2016
Prepare for $10-$15/bbl oil as Iran, US return to the market
UK government must save North Sea oil and gas sector
Why do oil prices keep going down?

OIL & GAS MANAGEMENT, LAW AND ACCOUNTING courses designed to take your career to the next level –
Full time, Part time and online.
Apply now for January and September 2016!
ABERDEEN BUSINESS SCHOOLwww.RGU.ac.uk/TOPDOG
#RGUTOPDOG

At blue asterisk, we specialise in providing on-demand cartography and graphic design services at highly competitive rates.
We work within your deadlines to provide accurate, high quality end products, from maps and montages to presentations and reports.
Find out how we can make your business stand out from the rest...
Cartographic Drafting & Design Services
We’ve got it covered…
blueasterisk.co.uk | [email protected] | +44 (0)1883 340341
Serving the E&P industry for over 25 years
Contact us for more detailsor visit our website

1 OilVoice Magazine – February 2016
The Biggest Conspiracy of the Century by Saudi Arabia and OPEC to Eliminate Its Competition
Written by Chris Vermeulen from The Gold and Oil Guy
Saudi Arabia and OPEC Manipulate Oil Prices
About eighteen months ago the international price of WTI Crude Oil, at the close of
June 2014, was $105.93 per barrel. Flash-forward to today; the price of WTI Crude
Oil was just holding above $38.00 per barrel, a drastic fall of more than 65% since
June 2014. I will point out several reasons behind this sharp, sudden, and what now
seems to be prolonged slump.
The Big Push
Despite a combination of factors triggering the fall in prices, the biggest push came
from the U.S. Shale producers. From 2010 to 2014, oil production in the U.S.
increased from 5,482,000 bpd to 8,663,000 (a 58% increase), making the U.S.

2 OilVoice Magazine – February 2016
the third largest oil-producing country in the world.
The next big push came from Iraq whose production increased from 2,358,000 bpd
in 2010 to 3,111,000 bpd in 2014 (a 32% increase), mostly resulting from the revival
of its post-war oil industry.
The country-wide financial crunch, and the need for the government to increasingly
export more to pay foreign companies for their production contracts and continue the
fight against militants in the country took production levels to the full of its current
capacity.
In addition; global demand remained flat, growing at just 1.1% and even declining for
some regions during 2014. Demand for oil in the U.S. grew just 0.6% against
production growth of 16% during 2014.
Europe registered extremely slow growth in demand, and Asia was plagued by a
slowdown in China which registered the lowest growth in its demand for oil in the last
five years. Consequently, a global surplus was created courtesy of excess supply
and lack of demand, with the U.S. and Iraq contributing to it the most.
The Response
In response to the falling prices, OPEC members met in the November of 2014, in
Vienna, to discuss the strategy forward. Advocated by Saudi Arabia, the most
influential member of the cartel, along with support from other GCC countries in the
OPEC, the cartel reluctantly agreed to maintain its current production levels.
This sent WTI Crude Oil and Brent Oil prices below $70, much to the annoyance of
Russia (non-OPEC), Nigeria and Venezuela, who desperately needed oil close
to $90 to meet their then economic goals.
For Saudi Arabia, the strategy was to leverage their low-cost of production
advantage in the market and send prices falling beyond such levels so that high-cost
competitors (U.S. Shale producers are the highest cost producers in the market) are
driven out and the market defines a higher equilibrium price from the resulting
correction. The GCC region, with a combined $2.5 trillion in exchange reserves,
braced itself for lower prices, even to the levels of $20 per barrel.
The Knockout Punch
By the end of September 2014, according to data from Baker Hughes, U.S. Shale
rigs registered their highest number in as many years at 1,931. However, they also
registered their very first decline to 1,917 at the end of November 2014, following
OPEC's first meeting after price falls and its decision to maintain production levels.

3 OilVoice Magazine – February 2016
By June 2015, in time for the next OPEC meeting, U.S. Shale rigs had already
declined to just 875 by the end of May; a 54% decline.
The Saudi Arabia strategy was spot on; a classic real-life example of predatory price
tactics being used by a market leader, showing its dominant power in the form of
deep foreign-exchange pockets and the low costs of production. Furthermore, on the
week ending on the date of the most recent OPEC meeting held on December 4th,
2015, the U.S. rig count was down even more to only 737; a 62% decline. Despite
increased pressure from the likes of Venezuela, the GCC lobby was able to ensure
that production levels were maintained for the foreseeable future.
Now What?
Moving forward; the U.S. production will decline by 600,000 bpd, according to a
forecast by the International Energy Agency. Furthermore, news from Iraq is that its
production will also decline in 2016 as the battle with militants gets more expensive
and foreign companies like British Petroleum have already cut operational budgets
for next year, hinting production slowdowns. A few companies in the Kurdish region
have even shut down all production, owing to outstanding dues on their contracts
with the government.
Hence, for the coming year, global oil supply is very much likely to be curtailed.
However, Iran's recent disclosure of ambitions to double its output once sanctions
are lifted next year, and call for $30 billion in investment in its oil and gas industry, is
very much likely to spoil any case for a significant price rebound.
4 OilVoice Magazine – February 2016
The same also led Saudi Arabia and its GCC partners to turn down any requests
from other less-economically strong members of OPEC to cut production, in their
December 2015, meeting. Under the current scenarios members like Venezuela,
Algeria and Nigeria, given their dependence on oil revenues to run their economies,
cannot afford to cut their own production but, as members of the cartel, can plea to
cut its production share to make room for price improvements, which they can
benefit from i.e. forego its market share.
It's Not Over Until I've Won?
With news coming from Iran, and the successful delivery of a knockout punch to a
six-year shale boom in the U.S., Saudi Arabia feared it would lose share to Iran if it
cut its own production. Oil prices will be influenced increasingly by the political
scuffles between Saudi Arabia and its allies and Iran. The deadlock and increased
uncertainty over Saudi Arabia and Iran's ties have sent prices plunging further. The
Global Hedge Fund industry is increasing its short position for the short-term, which
stood at 154 million barrels on November 17th, 2015, when prices hit $40 per barrel;
all of this indicating a prolonged bear market for oil.
One important factor that needs to be discussed is the $1+ trillions of junk bonds
holding up the shale and other marginal producers. As you know, that has been
teetering and looked like a crash not long ago. The pressure is still there. As the
shale becomes more impaired, the probability of a high-yield market crash looks very
high. If that market crashes, what happens to oil? Wouldn't there be feedback effects
between the oil and the crashing junk market, with a final sudden shutdown of
marginal production? Could this be the catalyst for a quick reversal of oil price?
The strategic interests, primarily of the U.S. and Saudi Arabia; the Saudis have
strategically decided to go all in to maintain their market share by maximizing oil
production, even though the effect on prices is to drive them down even further. In
the near term, they have substantial reserves to cover any budget shortfalls due to
low prices. More importantly, in the intermediate term, they want to force marginal
producers out of business and damage Iran's hopes of reaping a windfall due to the
lifting of sanctions. This is something they have in common with the strategic
interests of the U.S. which also include damaging the capabilities of Russia and ISIS.
It's certainly complicated sorting out the projected knock-on effects, but no doubt
they are there and very important.
I'll Show You How Great I Am
Moreover, despite a more than 50% decline in its oil revenues, the International
Monetary Fund has maintained Saudi Arabia's economy to grow at 3.5% for 2015,
buoyed by increasing government spending and oil production. According to data by
Deutsche Bank and IMF; in order to balance its fiscal books, Saudi Arabia needs an

5 OilVoice Magazine – February 2016
oil price of $105. But the petroleum sector only accounts for 45% of its GDP, and as
of June 2015, according to the Saudi Arabian Monetary Agency, the country had
combined foreign reserves of $650 billion. The only challenge for Saudi Arabia is to
introduce slight taxes to balance its fiscal books. As for the balance of payments
deficit; the country has asserted its will to depend on its reserves for the foreseeable
future.
Conclusion
The above are some of the advantages which only Saudi Arabia and a couple of
other GCC members in the OPEC enjoy, which will help them sustain their strategy
even beyond 2016 if required. But I believe it won't take that long. International
pressure from other OPEC members, and even the global oil corporations' lobby will
push leaders on both sides to negotiate a deal to streamline prices.
With the U.S. players more or less out by the end of 2016, the OPEC will be in more
control of price fluctuations and, therefore, in light of any deal between Iran and
Saudi Arabia (both OPEC members) and even Russia (non-OPEC), will alter global
supply for prices to rebound, thus controlling prices again.
What we see now in oil price manipulation is just the mid-way point. Lots of
opportunity in oil and oil related companies will slowly start to present themselves
over the next year which I will share my trades and long term investment pays with
subscribers of my newsletter at TheGoldAndOilGuy.com
View more quality content from
The Gold and Oil Guy

PICK A WINNERFOR THESE CHALLENGINGTIMES
Stay ahead of the game, and don’t wait for partners to show you the value in your assets! Find out more at
ikonscience.com/jifi
With the industry’s current focus on cost control, it is remarkable that more and more forward-thinking oil & gas companies are stepping up to invest in Ikon Science’s revolutionary RokDoc Ji-Fi®, a new tool to build reliable seismically-driven geological models. Ji-Fi breaks the mold of traditional workflows and opens up a whole new realm of possibilities. The cost/benefit of Ji-Fi is so compelling it redefines how customers leverage data and knowledge to drive success in their exploration, development and production activities.
The Present And Future Of GeoPrediction
ikonscience.com
C
M
Y
CM
MY
CY
CMY
K
Ji-Fi A4.pdf 1 20/05/2015 08:05:25

6 OilVoice Magazine – February 2016
Why oil under $30 per barrel is a major problem
Written by Gail Tverberg from Our Finite World
A person often reads that low oil prices-for example, $30 per barrel oil prices-will
stimulate the economy, and the economy will soon bounce back. What is wrong with
this story? A lot of things, as I see it:
1. Oil producers can't really produce oil for $30 per barrel
A few countries can get oil out of the ground for $30 per barrel. Figure 1 gives an
approximation to technical extraction costs for various countries. Even on this basis,
there aren't many countries extracting oil for under $30 per barrel-only Saudi Arabia,
Iran, and Iraq. We wouldn't have much crude oil if only these countries produced oil.
Figure 1. Global breakeven prices (considering only technical extraction costs) versus production.
Source: Alliance Bernstein, October 2014
2. Oil producers really need prices that are higher than the technical extraction
costs shown in Figure 1, making the situation even worse.
Oil can only be extracted within a broader system. Companies need to pay taxes.
These can be very high. Including these costs has historically brought total costs for
many OPEC countries to over $100 per barrel.
Independent oil companies in non-OPEC countries also have costs other than

7 OilVoice Magazine – February 2016
technical extraction costs, including taxes and dividends to stockholders. Also, if
companies are to avoid borrowing a huge amount of money, they need to have
higher prices than simply the technical extraction costs. If they need to borrow,
interest costs need to be considered as well.
3. When oil prices drop very low, producers generally don't stop producing.
There are built-in delays in the oil production system. It takes several years to put a
new oil extraction project in place. If companies have been working on a project, they
generally won't stop just because prices happen to be low. One reason for continuing
on a project is the existence of debt that must be repaid with interest, whether or not
the project continues.
Also, once an oil well is drilled, it can continue to produce for several years. Ongoing
costs after the initial drilling are generally very low. These previously drilled wells will
generally be kept operating, regardless of the current selling price for oil. In theory,
these wells can be stopped and restarted, but the costs involved tend to deter this
action.
Oil exporters will continue to drill new wells because their governments badly need
tax revenue from oil sales to fund government programs. These countries tend to
have low extraction costs; nearly the entire difference between the market price of oil
and the price required to operate the oil company ends up being paid in taxes. Thus,
there is an incentive to raise production to help generate additional tax revenue, if
prices drop. This is the issue for Saudi Arabia and many other OPEC nations.
Very often, oil companies will purchase derivative contracts that protect themselves
from the impact of a drop in market prices for a specified time period (typically a year
or two). These companies will tend to ignore price drops for as long as these
contracts are in place.
There is also the issue of employee retention. In a sense, a company's greatest
assets are its employees. Once these employees are lost, it will be hard to hire and
retrain new employees. So employees are kept on as long as possible.
The US keeps raising its biofuel mandate, regardless of the price of oil. No one stops
to realize that in the current over-supplied situation, the mandate adds to low price
pressures.
One brake on the system should be the financial pain induced by low oil prices, but
this braking effect doesn't necessarily happen quickly. Oil exporters often
have sovereign wealth funds that they can tap to offset low tax revenue. Because of
the availability of these funds, some exporters can continue to finance governmental
services for two or more years, even with very low oil prices.

8 OilVoice Magazine – February 2016
Defaults on loans to oil companies should also act as a brake on the system. We
know that during the Great Recession, regulators allowed commercial real estate
loans to be extended, even when property valuations fell, thus keeping the problem
hidden. There is a temptation for regulators to allow similar leniency regarding oil
company loans. If this happens, the 'braking effect' on the system is reduced,
allowing the default problem to grow until it becomes very large and can no longer be
hidden.
4. Oil demand doesn't increase very rapidly after prices drop from a high level.
People often think that going from a low price to a high price is the opposite of going
from a high price to a low price, in terms of the effect on the economy. This is not
really the case.
4a. When oil prices rise from a low price to a high price, this generally means
that production has been inadequate with only the production that could be obtained
at the prior lower price. The price must rise to a higher level in order to encourage
additional production.
The reason that the cost of oil production tends to rise is because the cheapest-to-
extract oil is removed first. Oil producers must thus keep adding production that is
ever-more expensive for one reason or another: harder to reach location, more
advanced technology, or needing additional steps that require additional human
labor and more physical resources. Growing efficiencies can somewhat offset this
trend, but the overall trend in the cost of oil production has been sharply
upward since about 1999.
The rising price of oil has an adverse impact on affordability. The usual pattern is
that after a rise in the price of oil, economies of oil importing nations go into
recession. This happens because workers' wages do not rise at the same time as oil
prices. As a result, workers find that they cannot buy as many discretionary items
and must cut back. These cutbacks in purchases create problems for businesses,
because businesses generally have high fixed costs including mortgages and other
debt payments. If these businesses are to continue to operate, they are forced to cut
costs in one way or another. Cost reduction occurs in many ways, including reducing
wages for workers, layoffs, automation, and outsourcing of manufacturing to cheaper
locations.
For both employers and employees, the impact of these rapid changes often feels
like a rug has been pulled out from under foot. It is very unpleasant and
disconcerting.
4b. When prices fall, the situation that occurs is not the opposite of 4a. Employers
9 OilVoice Magazine – February 2016
find that thanks to lower oil prices, their costs are a little lower. Very often, they will
try to keep some of these savings as higher profits. Governments may choose to
raise tax rates on oil products when oil prices fall, because consumers will be less
sensitive to such a change than otherwise would be the case. Businesses have no
motivation to give up cost-saving techniques they have adopted, such as automation
or outsourcing to a cheaper location.
Few businesses will construct new factories with the expectation that low oil prices
will be available for a long time, because they realize that low prices are only
temporary. They know that if oil prices don't go back up in a fairly short period of time
(months or a few years), the quantity oil available is likely to drop precipitously. If
sufficient oil is to be available in the future, oil prices will need to be high enough to
cover the true cost of production. Thus, current low prices are at most a temporary
benefit-something like the eye of a hurricane.
Since the impact of low prices is only temporary, businesses will want to adopt only
changes that can take place quickly and can be easily reversed. A restaurant or bar
might add more waiters and waitresses. A car sales business might add a few more
salesmen because car sales might be better. A factory making cars might schedule
more shifts of workers, so as to keep the number of cars produced very high. Airlines
might add more flights, if they can do so without purchasing additional planes.
Because of these issues, the jobs that are added to the economy are likely to be
mostly in the service sector. The shift toward outsourcing to lower-cost countries and
automation can be expected to continue. Citizens will get some benefit from the
lower oil prices, but not as much as if governments and businesses weren't first in
line to get their share of the savings. The benefit to citizens will be much less than if
all of the people who were laid off in the last recession got their jobs back.
5. The sharp drop in oil prices in the last 18 months has little to do with the
cost of production.
Instead, recent oil prices represent an attempt by the market to find a balance
between supply and demand. Since supply doesn't come down quickly in response
to lower prices, and demand doesn't rise quickly in response to lower prices, prices
can drop very low-far below the cost of production.
As noted in Section 4, high oil prices tend to be recessionary. The primary way of
offsetting recessionary forces is by directly or indirectly adding debt at low interest
rates. With this increased debt, more homes and factories can be built, and more
cars can be purchased. The economy can be forced to act in a more 'normal'
manner because the low interest rates and the additional debt in some sense
counteract the adverse impact of high oil prices.

10 OilVoice Magazine – February 2016
Figure 2. World oil supply and prices based on EIA data.
Oil prices dropped very low in 2008, as a result of the recessionary influences that
take place when oil prices are high. It was only with the benefit of considerable debt-
based stimulation that oil prices were gradually pumped back up to the $100+ per
barrel level. This stimulation included US deficit spending, Quantitative Easing (QE)
starting in December 2008, and a considerable increase in debt by the Chinese.
Commodity prices tend to be very volatile because we use such large quantities of
them and because storage is quite limited. Supply and demand have to balance
almost exactly, or prices spike higher or lower. We are now back to an 'out of
balance' situation, similar to where we were in late 2008. Our options for fixing the
situation are more limited this time. Interest rates are already very low, and
governments generally feel that they have as much debt as they can safely handle.
6. One contributing factor to today's low oil prices is a drop-off in the stimulus
efforts of 2008.
As noted in Section 4, high oil prices tend to be recessionary. As noted in Section 5,
this recessionary impact can, at least to some extent, be offset stimulus in the form
of increased debt and lower interest rates. Unfortunately, this stimulus has tended to
have adverse consequences. It encouraged overbuilding of both homes and
factories in China. It encouraged a speculative rise in asset prices. It encouraged
11 OilVoice Magazine – February 2016
investments in enterprises of questionable profitability, including many investments
in oil from US shale formations.
In response to these problems, the amount of stimulus is being reduced. The US
discontinued its QE program and cut back its deficit spending. It even began raising
interest rates in December 2015. China is also cutting back on the quantity of new
debt it is adding.
Unfortunately, without the high level of past stimulus, it is difficult for the world
economy to grow rapidly enough to keep the prices of all commodities, including oil,
high. This is a major contributing factor to current low prices.
7. The danger with very low oil prices is that we will lose the energy products
upon which our economy depends.
There are a number of different ways that oil production can be lost if low oil prices
continue for an extended period.
In oil exporting countries, there can be revolutions and political unrest leading to a
loss of oil production.
In almost any country, there can be a sharp reduction in production because oil
companies cannot obtain debt financing to pay for more services. In some cases,
companies may go bankrupt, and the new owners may choose not to extract oil at
low prices.
There can also be systemwide financial problems that indirectly lead to much lower
oil production. For example, if banks cannot be depended upon for payroll services,
or to guarantee payment for international shipments, such problems would affect all
oil companies, not just ones in financial difficulty.
Oil is not unique in its problems. Coal and natural gas are also experiencing low
prices. They could experience disruptions indirectly because of continued low prices.
8. The economy cannot get along without an adequate supply of oil and other
fossil fuel products.
We often read articles in the press that seem to suggest that the economy could get
along without fossil fuels. For example, the impression is given that renewables are
'just around the corner,' and their existence will eliminate the need for fossil fuels.
Unfortunately, at this point in time, we are nowhere being able to get along without
fossil fuels.
Food is grown and transported using oil products. Roads are made and maintained
using oil and other energy products. Oil is our single largest energy product.

12 OilVoice Magazine – February 2016
Experience over a very long period shows a close tie between energy use and GDP
growth (Figure 3). Nearly all technology is made using fossil fuel products, so even
energy growth ascribed to technology improvements could be considered to be
available to a significant extent because of fossil fuels.
Figure 3. World GDP growth compared to world energy consumption growth for selected time periods since
1820. World real GDP trends from 1975 to present are based on USDA real GDP data in 2010$ for 1975 and
subsequent. (Estimated by the author for 2015.) GDP estimates for prior to 1975 are based on Maddison project
updates as of 2013. Growth in the use of energy products is based on a combination of data from Appendix A
data from Vaclav Smil's Energy Transitions: History, Requirements and Prospects together with BP Statistical
Review of World Energy 2015 for 1965 and subsequent.
While renewables are being added, they still represent only a tiny share of the
world's energy consumption.
13 OilVoice Magazine – February 2016
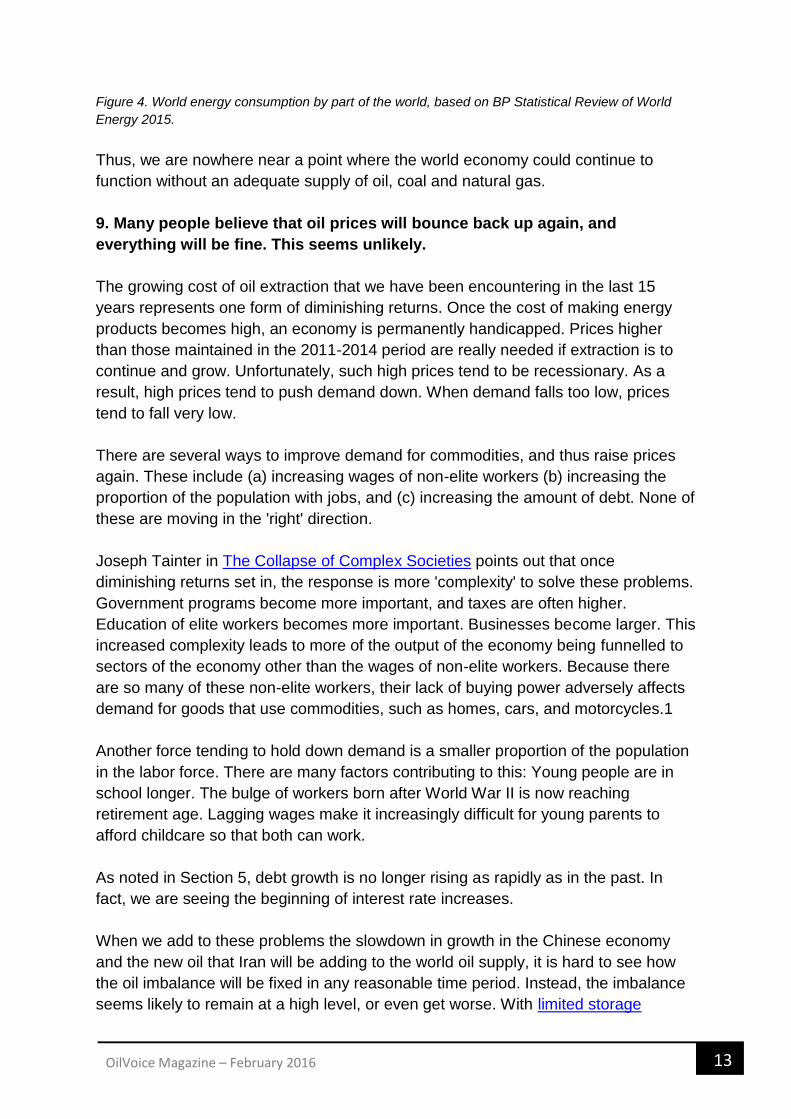
Figure 4. World energy consumption by part of the world, based on BP Statistical Review of World
Energy 2015.
Thus, we are nowhere near a point where the world economy could continue to
function without an adequate supply of oil, coal and natural gas.
9. Many people believe that oil prices will bounce back up again, and
everything will be fine. This seems unlikely.
The growing cost of oil extraction that we have been encountering in the last 15
years represents one form of diminishing returns. Once the cost of making energy
products becomes high, an economy is permanently handicapped. Prices higher
than those maintained in the 2011-2014 period are really needed if extraction is to
continue and grow. Unfortunately, such high prices tend to be recessionary. As a
result, high prices tend to push demand down. When demand falls too low, prices
tend to fall very low.
There are several ways to improve demand for commodities, and thus raise prices
again. These include (a) increasing wages of non-elite workers (b) increasing the
proportion of the population with jobs, and (c) increasing the amount of debt. None of
these are moving in the 'right' direction.
Joseph Tainter in The Collapse of Complex Societies points out that once
diminishing returns set in, the response is more 'complexity' to solve these problems.
Government programs become more important, and taxes are often higher.
Education of elite workers becomes more important. Businesses become larger. This
increased complexity leads to more of the output of the economy being funnelled to
sectors of the economy other than the wages of non-elite workers. Because there
are so many of these non-elite workers, their lack of buying power adversely affects
demand for goods that use commodities, such as homes, cars, and motorcycles.1
Another force tending to hold down demand is a smaller proportion of the population
in the labor force. There are many factors contributing to this: Young people are in
school longer. The bulge of workers born after World War II is now reaching
retirement age. Lagging wages make it increasingly difficult for young parents to
afford childcare so that both can work.
As noted in Section 5, debt growth is no longer rising as rapidly as in the past. In
fact, we are seeing the beginning of interest rate increases.
When we add to these problems the slowdown in growth in the Chinese economy
and the new oil that Iran will be adding to the world oil supply, it is hard to see how
the oil imbalance will be fixed in any reasonable time period. Instead, the imbalance
seems likely to remain at a high level, or even get worse. With limited storage

14 OilVoice Magazine – February 2016
available, prices will tend to continue to fall.
10. The rapid run up in US oil production after 2008 has been a significant
contributor to the mismatch between oil supply and demand that has taken
place since mid-2014.
Without US production, world oil production (broadly defined, including biofuels and
natural gas liquids) is close to flat.
Figure 5. Total liquids oil production for the world as a whole and for the world excluding the US,
based on EIA International Petroleum Monthly data.
Viewed separately, US oil production has risen very rapidly. Total production rose by
about six million barrels per day between 2008 and 2015.

15 OilVoice Magazine – February 2016
Figure 6. US Liquids production, based on EIA data (International Petroleum Monthly, through June
2015; supplemented by December Monthly Energy Review for most recent data).
US oil supply was able to rise very rapidly partly because QE led to the availability of
debt at very low interest rates. In addition, investors found yields on debt so low that
they purchased almost any equity investment that appeared to have a chance of
long-term value. The combination of these factors, plus the belief that oil prices
would always increase because extraction costs tend to rise over time, funneled
large amounts of investment funds into the liquid fuels sector.
As a result, US oil production (broadly defined), increased rapidly, increasing nearly
1.0 million barrels per day in 2012, 1.2 million barrels per day in 2013, 1.7 million
barrels per day in 2014. The final numbers are not in, but it looks like US oil
production will still increase by another 700,000 barrels a day in 2015. The 700,000
extra barrels of oil added by the US in 2015 is likely greater than the amount added
by either Saudi Arabia or Iraq.
World oil consumption does not increase rapidly when oil prices are high. World oil
consumption increased by 871,000 barrels a day in 2012, 1,397,000 barrels a day in
2013, and 843,000 barrels a day in 2014, according to BP. Thus, in 2014, the US by
itself added approximately twice as much oil production as the increase in world oil
demand. This mismatch likely contributed to collapsing oil prices in 2014.
Given the apparent role of the US in creating the mismatch between oil supply and
demand, it shouldn't be too surprising that Saudi Arabia is unwilling to try to fix the
problem.
Conclusion
Things aren't working out the way we had hoped. We can't seem to get oil supply
and demand in balance. If prices are high, oil companies can extract a lot of oil, but
consumers can't afford the products that use it, such as homes and cars; if oil prices
are low, oil companies try to continue to extract oil, but soon develop financial
problems.
Complicating the problem is the economy's continued need for stimulus in order to
keep the prices of oil and other commodities high enough to encourage production.
Stimulus seems to takes the form of ever-rising debt at ever-lower interest rates.
Such a program isn't sustainable, partly because it leads to mal-investment and
partly because it leads to a debt bubble that is subject to collapse.
Stimulus seems to be needed because of today's high extraction cost for oil. If the
cost of extraction were still very low, this stimulus wouldn't be needed because
products made using oil would be more affordable.

16 OilVoice Magazine – February 2016
Decision makers thought that peak oil could be fixed simply by producing more oil
and more oil substitutes. It is becoming increasingly clear that the problem is more
complicated than this. We need to find a way to make the whole system operate
correctly. We need to produce exactly the correct amount of oil that buyers can
afford. Prices need to be high enough for oil producers, but not too high for
purchasers of goods using oil. The amount of debt should not spiral out of control.
There doesn't seem to be a way to produce the desired outcome, now that oil
extraction costs are high.
Rigidities built into the oil price-supply system (as described in Sections 3 and 4)
tend to hide problems, letting them grow bigger and bigger. This is why we could
suddenly find ourselves with a major financial problem that few have anticipated.
Unfortunately, what we are facing now is a predicament, rather than a problem.
There is quite likely no good solution. This is a worry.
Note:
[1] For example, more dividend and interest payments are paid, tending to benefit
the financial industry and the elite classes. More of the output of the economy goes
to workers in supervisory positions or having advanced education. Other workers-
those with more 'ordinary' responsibilities-find their wages falling behind the general
rise in the cost of living. As a result, they find it increasingly difficult to buy cars,
homes, motorcycles, and other goods that use commodities.
View more quality content from
Our Finite World

A PERFECT FIT
neosgeo.com
Seismic + Non-Seismic
NEOS Adds Seismic Imaging to Its Multi-Physics Toolkit
Following our recent acquisition, some of the best and brightest minds in seismic imaging have joined the NEOS
team. Continuing to do what they do best, the NEOS Seismic Imaging Group will deliver stand-alone processing
and imaging services, including advanced onshore depth imaging in some of the most challenging regions in the
world. But it doesn’t stop there. Our strengths in multi-physics imaging align perfectly and we will be teaming up
to change the way the industry explores. Incorporating seismic attributes into our proprietary predictive analytics
methods and undertaking multi-physics inversions is just the beginning. Together we offer a truly complete
portfolio of subsurface imaging solutions to our clients.
Seismic + Non-Seismic. A powerful combination.

17 OilVoice Magazine – February 2016
Prepare for $10-$15/bbl oil as Iran, US return to the market
Written by Paul Hodges from ICIS
Oil markets finally entered their 'give-up phase' last week. Amazingly, it is now nearly
18 months since the start of the Great Unwinding of policymaker stimulus in August
2014, when Brent was still $105/bbl. On Friday night, Brent closed at $29/bbl. As
ICIS Chemical Business (ICB) notes in its latest editorial:
'International eChem's Paul Hodges has been predicting $20-30/ bbl since August
2014 and he has now been joined by the likes of Goldman Sachs and Morgan
Stanley in expecting the rout to continue and low prices to persist for years'.
Until last week, virtually all the analysts were still insisting that oil prices would return
to at least $50/bbl, or even $100/bbl. In their view, it was just a matter of 'when', not
'if'. But now, they finally begin to face reality, as I discussed with ICB:
'It's a market share game, as the Saudis realised when they gave up trying to hold
the price 18 months ago. You either sell today, or risk ending up leaving the oil in the
ground.'
The chart of the Great Unwinding above shows how far we have travelled before this
simple truth was finally recognised:
Brent oil prices are now down 71%, and fell 13% last week

18 OilVoice Magazine – February 2016
The US$ is up 21%, having broken out of its 30-year downtrend
And more recently, of course, the other elements of the Great Unwinding have
begun to impact - European and Japanese equity markets are down 10% since the
start of the year, and US markets are down 9%. As US financial magazine
Barron's notes:
'The juice that the Federal Reserve had provided is being withdrawn, and the
symptoms of going off the stuff are becoming apparent. The U.S. stock market is off
to its worst start of any year on record.'
OIL MARKETS ARE NOW IN THE GIVE-UP PHASE
What happens next is obviously the key question. I have never known a major price
movement, of the kind we've seen with oil over the past 18 months, end without an
overshoot. It therefore seems very unlikely that it could suddenly stabilise at $25/bbl,
although I do expect this to return to being the long-term level
Supply/demand factors suggest there is still a major imbalance in the market
o The IEA says there are a record 3bn barrels of storage
o The US has record storage, and European storage is virtually full
o China has become a net exporter of oil products as its economy slows
o The mild Western winter has reduced demand for heating purposes
2 major exporters are now re-joining the market:
o Iran is expected to add up to 500kb/d in January now nuclear
sanctions have ended, and has said its production costs are $1.70/bbl.
It wants to regain lost market share as quickly as possible
o The US has just begun shipments. Given its high storage levels, it
would make sense to monetise these quickly via sales, especially as
they are costing money to store
The short-term outlook is weak, given that Chinese/Asian demand is now
slowing ahead of Lunar New Year on February 8, and March will see the
traditional maintenance season for Western refineries after the winter
US production costs are falling fast, with Daniel Yergin suggesting that a
dollar spent in December was '65% more efficient that a dollar spent in 2014'
The outbreak of tension between Saudi Arabia and Iran makes it most unlikely
that OPEC could agree to any major cuts in production, even if Saudi wanted
to change course
Companies and investors therefore need to prepare for further chaos ahead. I fear
that oil producers and oil consumers will now start to go bankrupt - producers
because they cannot pay their interest bills, and consumers because they have high
and expensive stock levels. Many consumers put their trust in the so-called 'experts',
and rushed to fill tanks and warehouses in November/December, assuming that

19 OilVoice Magazine – February 2016
prices would rise in January. Today, however, buyers all down the chain are in a
state of simple panic, and worry that making any purchase is like trying to 'catch a
falling knife'.
As I have long feared, we face a very difficult 2016.
WEEKLY MARKET ROUND-UP
My weekly round-up of Benchmark prices since the Great Unwinding began is below,
with ICIS pricing comments:
Brent crude oil, down 71%
Naphtha Europe, down 66%. 'Fundamentals weaken on US gasoline build'
Benzene Europe, down 59%. 'Tumbling crude oil and benzene numbers are
weighing down on the European styrene spot market this week, with talk of
strong derivative demand doing little to stem the downward movement.'
PTA China, down 46%. 'Downstream polyester producers have confirmed
turnaround plans and adjusted contractual volumes for the Lunar New Year
holidays, sources in the country said. They also have sufficient inventories to
last them until after the long holiday'
HDPE US export, down 41%. 'Prices have to come down because there is too
much North American supply already and more capacity coming on line
throughout 2016'
¥:$, down 15%
S&P 500 stock market index, down 4%
Paul Hodges is Chairman of International eChem, trusted commercial advisers to the
global chemical industry.
View more quality content from
ICIS

20 OilVoice Magazine – February 2016
The great condensate con: Is the oil glut just about oil?
Written by Kurt Cobb from Resource Insights
My favorite Texas oilman Jeffrey Brown is at it again. In a recent email he's pointing
out to everyone who will listen that the supposed oversupply of crude oil isn't quite
what it seems. Yes, there is a large overhang of excess oil in the market. But how
much of that oversupply is honest-to-god oil and how much is so-called lease
condensate which gets carelessly lumped in with crude oil? And, why is this
important to understanding the true state of world oil supplies?
In order to answer these questions we need to get some preliminaries out of the
way.
Lease condensate consists of very light hydrocarbons which condense from gaseous
into liquid form when they leave the high pressure of oil reservoirs and exit through
the top of an oil well. This condensate is less dense than oil and can interfere with
optimal refining if too much is mixed with actual crude oil. The oil industry's own
engineers classify oil as hydrocarbons having an API gravity of less than 45--the
higher the number, the lower the density and the 'lighter' the substance. Lease
condensate is defined as hydrocarbons having an API gravity between 45 and
70. (For a good discussion about condensates and their place in the marketplace,
read 'Neither Fish nor Fowl - Condensates Muscle in on NGL and Crude Markets.')
Refiners are already complaining that so-called 'blended crudes' contain too much
lease condensate, and they are seeking out better crudes straight from the
wellhead. Brown has dubbed all of this the great condensate con.
Brown points out that U.S. net crude oil imports for December 2015 grew from the
previous December, according to the U.S. Energy Information Administration (EIA),
the statistical arm of the U.S. Department of Energy. U.S. statistics for crude oil
imports include condensate, but don't break out condensate separately. Brown
believes that with America already awash in condensate, almost all of those imports
must have been crude oil proper.
Brown asks, 'Why would refiners continue to import large--and increasing--volumes
of actual crude oil, if they didn't have to--even as we saw a huge build in [U.S.] C+C
[crude oil plus condensate] inventories?'

21 OilVoice Magazine – February 2016
Part of the answer is that U.S. production of crude oil has been declining since mid-
2015. But another part of the answer is that what the EIA calls crude oil is actually
crude plus lease condensate. With huge new amounts of lease condensate coming
from America's condensate-rich tight oil fields--the ones tapped by hydraulic
fracturing or fracking--the United States isn't producing quite as much actual crude
oil as the raw numbers would lead us to believe. This EIA chart breaking down the
API gravity of U.S. crude production supports this view.
Exactly how much of America's and the world's presumed crude oil production is
actually condensate remains a mystery. The data just aren't sufficient to separate
condensate production from crude oil in most instances.
Brown explains: 'My premise is that U.S. (and probably global) refiners hit in late
2014 the upper limit of the volume of condensate that they could process' and still
maintain the product mix they want to produce. That would imply that condensate
inventories have been building faster than crude inventories and that the condensate
is looking for an outlet.
That outlet has been in blended crudes, that is heavier crude oil that is blended with
condensates to make it lighter and therefore something that fits the definition of light
crude. Light crude is generally easier to refine and thus more valuable.
Trouble is, the blends lack the characteristics of nonblended crudes of comparable
density (that is, the same API gravity), and refiners are discovering to their chagrin
that the mix of products they can get out of blended crudes isn't what they expect.
So, now we can try to answer our questions. Brown believes that worldwide
production of condensate 'accounts for virtually all of the post-2005 increase in C+C
[crude plus condensate] production.' What this implies is that almost all of the 4
million-barrel-per-day increase in world 'oil' production from 2005 through 2014 may
actually be lease condensate. And that would mean crude oil production proper has
been nearly flat during this period--a conjecture supported by record and near record
average daily prices for crude oil from 2011 through 2014. Only when demand
softened in late 2014 did prices begin to drop.
Here it is worth mentioning that when oil companies talk about the price of oil, they
are referring to the price quoted on popular futures exchanges--prices which reflect
only the price of crude oil itself. The exchanges do not allow other products such as
condensates to be mixed with the oil that is delivered to holders of exchange
contracts. But when oil companies (and governments) talk about oil supply, they
include all sorts of things that cannot be sold as oil on the world market including
biofuels, refinery gains and natural gas plant liquids as well as lease
condensate. Which leads to a simple rule coined by Brown: If what you're selling
cannot be sold on the world market as crude oil, then it's not crude oil.

22 OilVoice Magazine – February 2016
The glut that developed in 2015 may ultimately be tied to some increases in actual,
honest-to-god crude oil production. The accepted story from 2005 through 2014 has
been that crude oil production has been growing, albeit at a significantly slower rate
than the previous nine-year period--15.7 percent from 1996 through 2005 versus 5.4
percent from 2005 through 2014 according to the EIA. If Brown is right, we have all
been victims of the great condensate con which has lulled the world into a sense of
complacency with regard to actual oil supplies--supplies he believes have been
barely growing or stagnant since 2005.
'Oil traders are acting on fundamentally flawed data,' Brown told me by phone. Often
a contrarian, Brown added: 'The time to invest is when there's blood in the streets.
And, there's blood in the streets.'
He explained: 'Who of us in January of 2014 believed that prices would be below $30
in January of 2016? If the conventional wisdom was wrong in 2014, maybe it's
similarly wrong in 2016' that prices will remain low for a long time.
Brown points out that it took trillions of dollars of investment from 2005 through today
just to maintain what he believes is almost flat production in oil. With oil companies
slashing exploration budgets in the face of low oil prices and production declining at
an estimated 4.5 and 6.7 percent per year for existing wells worldwide, a recovery in
oil demand might push oil prices much higher very quickly.
That possibility is being obscured by the supposed rise in crude oil production in
recent years that may just turn out to be an artifact of the great condensate con.
View more quality content from
Resource Insights

Early bird deadline extended! View full event details and register now for optimal savings at barcelona2016.iceevent.org.
• Technical Program featuring 300 oral and poster presentation sessions addressing the theme “Collaboration in a Changing World”
• State-of-the-art Exhibition displaying the latest in products, technologies, and services
• Student and Young Professional special events
• Short courses including:
• Carbonate Essentials: Pores to Prospect, presented by Christopher Liner
• Marine Broadband Technologies: Theory and Practice, presented by David H. Carlson
• Advanced Sequence Stratigraphic Applications for Exploration (SEPM course), presented by Vitor Abreu
• Field Trips including: • Fractured carbonate reservoirs outcrops: observing faults, fractures, and karsts permeability networks in different carbonate depositional settings
• Carbonate reservoir analogues: play concepts and controls on porosity
• Reservoir analogues from modern and ancient turbidite systems – Tabernas Basin, Spain
• Thrust belt structure and foreland basin evolution in the southern Pyrenees – Aragon, Spain
• Face-to-face networking opportunities designed to build connections, drive new business, and enhance career opportunities
• Women in Geosciences Forum
• Access to leaders on the forefront of advancing the geosciences industry
Register now for ICE Barcelona, Europe’s premier geosciences event!Benefit from:
IC E Barcelona
Centre de Convencions Internacional de Barcelona
3-6 April • Barcelona, Spainbarcelona2016.iceevent.org
®
MEDIA PARTNERS:
GOLD SPONSOR: SILVER SPONSOR:

22 OilVoice Magazine – February 2016
The glut that developed in 2015 may ultimately be tied to some increases in actual,
honest-to-god crude oil production. The accepted story from 2005 through 2014 has
been that crude oil production has been growing, albeit at a significantly slower rate
than the previous nine-year period--15.7 percent from 1996 through 2005 versus 5.4
percent from 2005 through 2014 according to the EIA. If Brown is right, we have all
been victims of the great condensate con which has lulled the world into a sense of
complacency with regard to actual oil supplies--supplies he believes have been
barely growing or stagnant since 2005.
'Oil traders are acting on fundamentally flawed data,' Brown told me by phone. Often
a contrarian, Brown added: 'The time to invest is when there's blood in the streets.
And, there's blood in the streets.'
He explained: 'Who of us in January of 2014 believed that prices would be below $30
in January of 2016? If the conventional wisdom was wrong in 2014, maybe it's
similarly wrong in 2016' that prices will remain low for a long time.
Brown points out that it took trillions of dollars of investment from 2005 through today
just to maintain what he believes is almost flat production in oil. With oil companies
slashing exploration budgets in the face of low oil prices and production declining at
an estimated 4.5 and 6.7 percent per year for existing wells worldwide, a recovery in
oil demand might push oil prices much higher very quickly.
That possibility is being obscured by the supposed rise in crude oil production in
recent years that may just turn out to be an artifact of the great condensate con.
View more quality content from
Resource Insights
23 OilVoice Magazine – February 2016
Oil Price Crash: How low will the oil price go?
Written by Euan Mearns from Energy Matters
I have been following the oil price crash since it began in late 2014, providing annual
forecast scenarios and monthly vital statistics updates. There has recently been an
acceleration in activity and news, and as the oil price has continued its fall to below
$30, investors and speculators wrestle with the main question: 'how low will the oil
price go?'
In August 2015 I gave a crude answer to that question based on history in a post
called The Oil Price: how low is low? where I observed:
To get straight to the point. Brent will need to fall below $30 to match the lows seen
in 1986 and to below $20 to match the lows seen in 1998.
This observation was based on deflated annual average price from BP ($2014). The
notion of $20 oil has since caught on and some commentators are now speculating
that $10 is possible. It is time to have a closer look at what history tells us.
This article was originally published on the Energy Matters blog.
First a look at recent oil price action.
24 OilVoice Magazine – February 2016
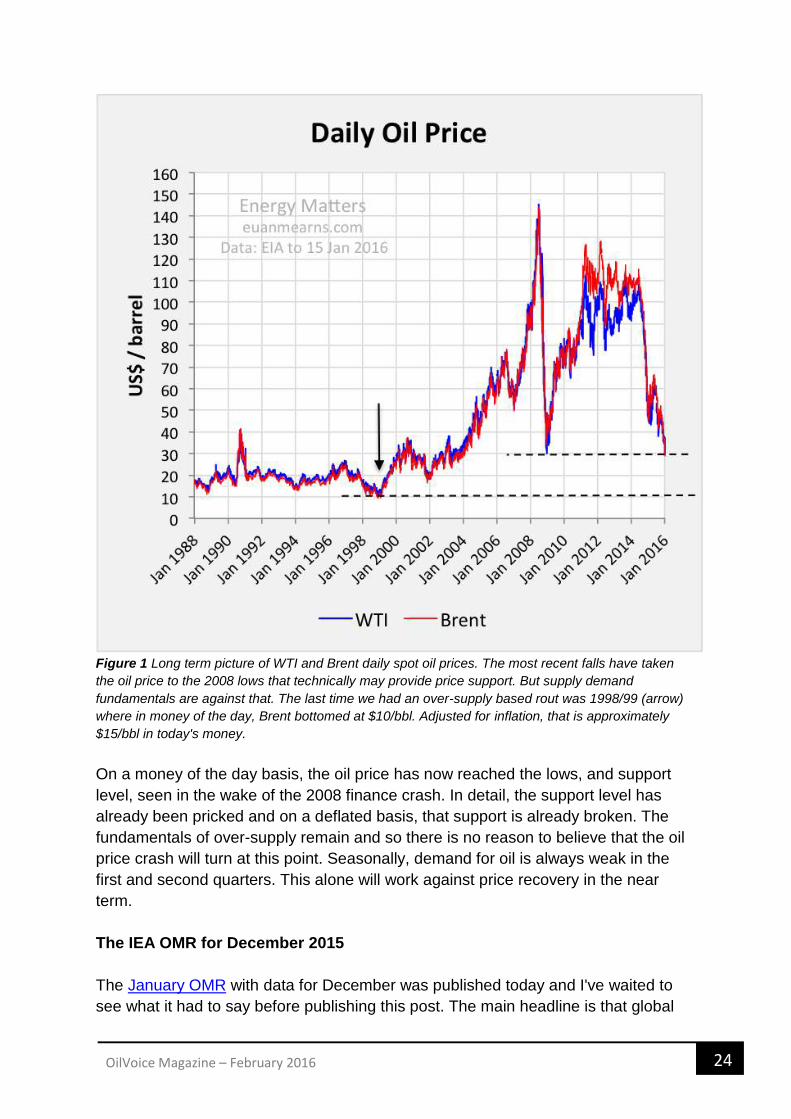
Figure 1 Long term picture of WTI and Brent daily spot oil prices. The most recent falls have taken
the oil price to the 2008 lows that technically may provide price support. But supply demand
fundamentals are against that. The last time we had an over-supply based rout was 1998/99 (arrow)
where in money of the day, Brent bottomed at $10/bbl. Adjusted for inflation, that is approximately
$15/bbl in today's money.
On a money of the day basis, the oil price has now reached the lows, and support
level, seen in the wake of the 2008 finance crash. In detail, the support level has
already been pricked and on a deflated basis, that support is already broken. The
fundamentals of over-supply remain and so there is no reason to believe that the oil
price crash will turn at this point. Seasonally, demand for oil is always weak in the
first and second quarters. This alone will work against price recovery in the near
term.
The IEA OMR for December 2015
The January OMR with data for December was published today and I've waited to
see what it had to say before publishing this post. The main headline is that global

25 OilVoice Magazine – February 2016
total liquids supply was 96.88 Mbpd in December, down 90,000 bpd on November.
This is effectively unchanged. The IEA observes:
a procession of investment banks has warned that oil prices 'could' fall to $25/bbl,
$20/bbl or, in one case, $10/bbl.
and asks the question
Can It Go Any Lower?
and concludes
So the answer to our question is an emphatic yes. It could go lower.
Recent News
Sanctions against Iran, as expected by all, have been lifted clearing the decks
for full oil exports to resume. Recent estimates suggest an additional 500,000
bpd exports. In my Oil Price Scenarios for 2016 post I assumed 800,000 bpd
additional oil from Iran. Regardless of whichever comes to pass, Iran returning
to full exports makes the over-supply situation worse.
Saudi Arabia has floated the idea of selling a 10% stake in Aramco, the Saudi
State oil company. This confirms the precarious state of Saudi finances but
also Saudi commitment to staying the strategic course. They would rather sell
the family silver than back down from their course towards national ruin.
Personally I don't believe this transaction will ever take place since investors
will be buying into production and not reserves, in a Nation that lies at the
centre of turmoil in the Middle East.
The Chinese stock market has crashed again and looks like it could now head
much lower leaving major questions about the general state of the Chinese
economy. The engine behind the commodities super cycle looks like it may
take some time out for repairs.
BHP Billiton, with Australian roots, listed in London but with global operations
is one of the World's largest diversified energy companies with stakes in oil &
gas, coal and uranium mining. They just announced a $7 billion write down on
their US shale assets. With a market capitalisation of £36 billion, BHP can
withstand balance sheet losses such as this more easily than the smaller
shale players.
UK North Sea oil production is rising for the first time since 1999.
US oil and gas drilling rig count continues to fall steadily but not so steeply as
during the early stage of the oil price crash. Below I take a closer look at the
oil price crash of 1998 / 99. The chart shows that back then US operational
rigs fell from 1000 to 500 before making a sharp recovery. Today, the oil+gas
rig count stands at 650, not yet so low as 1998/99 but proportionally much

26 OilVoice Magazine – February 2016
lower since the drilling fleet size is now 2000. At least it was 2000 leading into
the crash.
Figure 2 Stacked chart of US oil and gas directed drilling. The total rig count stood at 650 on 15
January, 515 oil and 135 gas. The combined rig count is still falling steeply and this must inevitably
bring about more significant declines in US oil and gas production at some future date once the
backlog of drilled but uncompleted wells works through the system.
The oil price crash of 1998/99
The oil price is already in irrational over-sold territory where virtually all producers
are making substantial losses, be they fiscal losses in OPEC countries or economic
losses in the market economies of the OECD. Longer term, the oil price must rise
above the level where everyone makes money, but short term, economics is not
helpful in trying to constrain where the market bottom might be. In the absence of
any rational economic pointers, all one can fall back upon is what happened before

27 OilVoice Magazine – February 2016
during similar circumstances. The oil price crash of 2008 is not a good analogy,
driven by financial crisis, that crash was ended with OPEC reining in production by 5
Mbpd. We have to go back to 1998 / 99 to see what happened during an oil market
driven price crash.
In money of the day, Brent fell below $10 / bbl for brief spells during December 1998
and February 1999. Back then, WTI traded at a premium to Brent of roughly $1.50 /
bbl. Today the WTI-Brent spread is effectively zero. Adjusting price for inflation using
the BP deflator points to price lows of about $14 for Brent in 2014 dollars.
Figure 3 WTI and Brent daily spot prices as reported by the EIA in money of the day (MOTD).

28 OilVoice Magazine – February 2016
Figure 4 Same as Figure 3 with prices adjusted for inflation using the BP deflator where $2014 =
$1998*1.45. Note that the price defines a distinct double bottom.
It is important to note that the nature of the 1998/99 price crash was different to
today's since this marked the culmination of an oil bear market that began in 1981.
Today's crash is caused by an inelastic market constrained by production volume
where relative swings in supply and demand of ±2 Mbpd is causing price swings of
±$40 per barrel. The market is currently caught in the over-supply + weak demand
vortex.
Once in a decade buying opportunity?
It is important at this stage to note that I am not a qualified investment advisor. All I
am doing here is laying out a framework of data and information to help others reach
their own decisions.
29 OilVoice Magazine – February 2016
There is no near-term bullish news for oil in the 'Recent News' I recount above. With
over-supply remaining, I therefore expect price to carry on down during the first two
quarters. It is worth noting that $20 is still 33% below $30 - that is a long way down!
But in the interim, distressed investors may be forced to sell on margin calls which
provides fuel to the downward spiral.
My central scenario for Brent in December 2016 was $37. Other commentators see
the price higher than that by year end. Should Brent go sub-$20 by mid-year this
would clearly present a good investment opportunity if prices do indeed rise
thereafter as expected. Of course, if one waits for sub-$20 and the price never gets
there, that would result in an opportunity lost.
My gut feel is that market bottom will be in the vicinity of $15. There are two reasons
for saying this. The first is that professional investment houses will to large extent be
looking at the same data I am and if they reach the same conclusions, they will
define the behaviour of the herd. The second is that current price trajectory heads
towards $15 by the end of the second quarter. Beyond that, supply and demand
should converge towards balance, heralding recovery.
In my 2016 scenarios, one scenario was called 'Event' and the probability of an
Event taking place, like disruptive terrorist attacks in Saudi Arabia, will increase as
the price falls. For example, Saudi ability to pay for state security is impaired while
the levels of social unrest linked to mounting poverty rises. If there is an Event that
sends the oil price sky high then lucky investors will be those who got on board
beforehand.
View more quality content from
Energy Matters

30 OilVoice Magazine – February 2016
The Trends That Will Be Driving the Oil Price in 2016 (and Beyond…)
Written by Andreas de Vries from Andreas de Vries
The past 18 months have been especially tough for those in the business of
forecasting the crude oil price.
At the end 2013, when Brent closed at $112 per barrel and WTI at $100, the
investment banks expected crude to continue to price around $100 per barrel during
2014. In actuality, of course, the price dropped to below $60 per barrel that year, as
the market became oversupplied and OPEC refused to cut its production to
rebalance supply and demand.
For 2015 essentially everyone got it wrong again. At the start of that year the general
expectation was that at around $60 per barrel, the price was (close to) bottoming out,
since a substantial amount of the North-America unconventional production (US
shale and Canadian tarsands) had become uneconomical and would thus be
removed from the market shortly. But, as US shale production did not go down
nearly as much as expected, the price decline that started in 2014 did not bottom out
but kept on going. During December 2015 Brent eventually reached an 11-year low
of $34 per barrel.
How could the forecasts have gotten it so wrong?
A major factor was the human tendency to assume that the trends we presently
experience, the trends that drive our world today, will continue into the future. In
other words, that fundamentally everything will stay the same.
For example the 2015 crude oil price forecast foresaw a reduction in US shale
production because it assumed these barrels would continue to cost between $70
and $90 to produce, as they did when OPEC's 'War on Shale' began in 2014. What
really happened, however, was that the shale producers aggressively drove
improvements and efficiencies in all elements of their value chain. New reservoir
analysis techniques and well completion improvements have enabled the producers
to increase average initial production of newly drilled wells (as compared to wells
drilled earlier in the Shale Revolution), while refracking has proven to be a (partial)
solution for the shale wells' notorious decline rate. Furthermore, the introduction
31 OilVoice Magazine – February 2016
of pad drilling has reduced the overall time needed for drilling while extending the
reach of horizontal wells, thus lowering development costs. This has enabled the US
shale industry to drastically lower production costs by as much as 65% according to
some estimates, maintain 2014 production levels throughout most of 2015, and even
prepare for a possible future uptick in prices through maintaining DUCs (drilled but
uncompleted wells) capable of adding some 500.000 barrels per day to production.
This lesson in this little bit of recent crude oil price forecasting history is that
forecasting requires more than extrapolation of the current trends in the industry
today. It requires identification of coming trends that will drive the industry tomorrow.
In this regard, crude oil price forecasters should take note of the research done
by Ray Kurzweil into the nature of technological innovation. Kurzweil is one of
America's leading inventors and futurists and currently Google's Director for
Engineering. For his book 'Singularity is Near' he researched different sciences and
technologies - computers, memory, DNA sequencing, communication, internet - to
find that innovation does not proceed in a constant manner. Rather, it tends
to accelerate. The more we learn, the easier it becomes to learn even more, and the
faster we will learn even more.
If Kurzweil's Law of accelerating innovation were to hold in the oil & gas industry as
well, what new trends would this lead to in the future?
Firstly, it would mean that shale technology goes global, substantially increasing
both shale production and proved (technologically and economically recoverable)
reserves. Continued innovation in shale technology will namely address the key pain
points of shale oil and gas production, i.e. its cost and environmental impact,
opening the way for development of the contingent resources located in places such
as China, Russia, Argentina, Europe and the United Arab Emirates. A lot of these
improvements are already underway, in fact. For example, centralized rather than
well-by-well wastewater management is being studied to lower shale's operational
costs and environmental footprint and waterless fracking is being researched to
eliminate the issue completely.
Secondly, it would mean shale technology becomes a quaternary recovery
technique, increasing crude oil production and expected ultimate recovery rates for
mature oilfields around the world. Tests on a number of mature oilfields in North
America have already shown that the techniques behind shale, horizontal drilling and
hydraulic fracturing, can indeed achieve this, not only through developing tight zones
in these fields that were left behind during original development, but also through re-
stimulation. The cutting edge of these technologies is currently being tested on the
giant mature conventional oilfields of the Middle East.
These two new trends will, in turn, lead in a third new trend: decoupling of the crude

32 OilVoice Magazine – February 2016
oil price from political events. If, namely, shale technology goes global and becomes
a quaternary recovery technique for mature conventional fields, global crude oil
production capacity will not only be increased but also diversified, reducing the
influence of individual countries over production and transportation. The current
global crude oil market is characterized by concentrated production with just 10
countries being responsible for two thirds of global crude oil production, five of whom
are located in the greater Middle East. At the same time the top 10 consumers of
crude oil also make up close to 60% of global consumption. This leads
to transportation chokepoints and a relatively small number of countries having
substantial leverage over the global crude oil supply and demand balance.
Diversification of production will reduce the importance of these countries for the
global crude oil supply and demand balance, thus making the crude oil price less
susceptible to political events in these countries. This trend can be witnessed
already as well, for example in the relatively muted response of the crude oil price to
events such as the Syrian Revolution, the rise of ISIL in Iraq, and most recently the
tensions between Saudi-Arabia and Iran.
Andreas de Vries works as a Strategy Consultant in the Oil & Gas industry, helping
companies to not only develop strategies but also execute them.
View more quality content from
Andreas de Vries

33 OilVoice Magazine – February 2016
What is the long run average oil price?
Written by Steve Brown from The Steam Oil Production Company Ltd
I read lots of commentary claiming that only now (when Brent is less than $35/bbl)
are we getting back to the long run average oil price, which of course is where some
economists think it should be. Of course nothing has changed since 1861 so the
price back then is just as relevant as last year's price... or perhaps the geology has
got a little tougher, and safety standards improved a tad. But the kind of economists
who believe in long run average prices probably also believe that technology is
making things in the oil patch cheaper and cheaper.
They couldn't be more wrong - electronic and computer technology is an aberration,
Moore's Law just doesn't apply much outside that domain. Indeed in some sectors
like medical the costs spiral upwards as technology advances.
Of course we can now do things with seismic technology and horizontal wells that we
couldn't in the past, but in reality we use the technology to access more elusive
reserves and stringent safety and environmental standards have layered cost on the
industry.
That rant is all to justify an assertion that in calculating the average oil price in the
past we need to take account of how recent the oil prices we are averaging are. It is
patent nonsense to average oil prices from 1861 to 2015 and say that $34.11 is the
average oil price and therefore today's oil price is somehow the 'right' price.
So I've come up with a methodology and done a calculation or too. I weighted last
year's price at 100% and knocked off 5% per annum all the way back to 1861. That
means the price in 2001 is half as relevant as last year's price, that 1987 matters a
quarter as much, 1968 a tenth as much and 1861 hardly at all. On that basis the
average oil price is $58.23, so if we are reverting to a mean, I think the mean we are
reverting to is closer to $60/bbl than $34/bbl.

34 OilVoice Magazine – February 2016
Data from 1861-2015 BP statistical review of world energy, 2015 EIA
Of course we might not be reverting to a mean... we might actually be working our
way through all the cheap and easy to develop reserves, we might be adding costs
by adhering to higher and better safety and environmental standards and we might
be on a pathway to a long run average price of about $80/bbl, but if I say that no-one
will believe me.
View more quality content from
The Steam Oil Production Company Ltd
35 OilVoice Magazine – February 2016
UK government must save North Sea oil and gas sector
Written by Alex Russel and Peter Strachan from Robert Gordon
University
The UK government is abandoning the North Sea oil and gas sector to its fate,
despite the fact that there is still enough oil and gas in place in the region to generate
the same amount of revenue that has been reaped up to now, argue Alex Russell
and Peter Strachan of Robert Gordon University. They advocate that full control of
energy and oil within the Scottish section should go to the Scottish government, so
that at least this part can be saved.
The (oil) well-funded Oil and Gas Authority (OGA) was established on 1 April 2015
as a consequence of the publication on 24 February 2014 of Sir Ian Wood's Review
on maximising economic recovery from the remnants of the UK's North Sea oil fields.
The OGA is an executive agency of the Department of Energy and Climate Change
(DECC) and states on its website that 'we work with government and industry to
make sure that the UK gets the maximum economic benefit from its oil and gas
reserves'.
With respect to offshore oil production the OGA can point to an unexpected increase
over the past year in barrels of oil equivalent output. Alas, at the same time there has
been around as many as 80,000 North Sea oil-related job losses over the past 15
months. From a UK perspective does this outcome represent a maximisation of
economic benefit? It may be akin to maximisation of production but in economic
terms it resembles a car crash.
Strange bedfellows
Those oil companies which have slashed their workforce and increased production
will indeed be getting some return on their huge recent past investments. However, it
appears that due to the low oil price accounting losses are being incurred and rather
than contributing cash to the UK Exchequer oil companies are having past tax
payments repaid to them by Chancellor George Osborne.
The reason for this situation is that US-inspired political machinations involving Saudi
Arabia have driven down the price of a barrel of Brent crude to a mere $30 and have
brought the UK oil sector to the brink of oblivion. OPEC, the cartel of oil producers

36 OilVoice Magazine – February 2016
led by the oil rich Kingdom of Saudi Arabia has been labelled the villain of the piece
for its failure to increase oil prices by reducing oil output in the face of a global glut of
oil stocks.
Well, there may be a smidgeon of truth in these claims, but over most of the past
forty-five years OPEC has been pilloried by the West for taking actions that
increased oil prices. They really can't win. And in any event it is all a red herring. If
there is a genuine cartel that can control the price of oil it consists not of OPEC but
of the US and Saudi Arabia alliance. US production and stockpiling of oil has never
been higher. By all accounts Saudi Arabia is on the point of selling shares in its
national oil company Saudi Aramco and that can only be to strengthen even further
its political and economic ties with the US.
Has world history seen stranger bedfellows? Would the US have any interest in
having a relationship with the Saudis if that Kingdom had no oil? No answers
required please, as this really is the world's dumbest rhetorical question. Self-interest
is at the heart of the relationship and when a definitive history of the fallout from it is
written it will not be on the list of Barack Obama's favourite bedtime reads.
Strident demands
Arguably, the US/Saudi Arabia cartel has forced down the oil price to put economic
pressure on their common adversary Russia. Clearly there are other external factors
that have impacted on oil price such as the downturn in the economies of China and
Europe but primarily US and Saudi over-production relative to demand is the root
cause of the oil crisis.
It is perhaps an example of economic and political genius on the part of the US.
When oil prices were high they milked rewards from their fast depleting fracking
plays and now that oil is scraping the bottom of the price barrel they have persuaded
other countries to sell their oil at give-away prices. The US economy is booming as a
consequence.
Unfortunately the high cost North Sea oil industry has been a casualty of this
situation. The OGA's strident demands for North Sea Operators to be more efficient
in their operations and to share what in the past would be commercially sensitive
information with them, has resulted in a cataclysmic loss of possibly 80,000 North
Sea-related jobs.
It is hard to believe that substantial real efficiencies have been brought about by
forcing oil companies to share information and resources as claimed by the OGA.
The reality is that rates of pay for contractors have been slashed and investment in
exploring for new reserves has stopped. The resultant job losses are a disaster
especially for the North East of Scotland and for the future of the industry.

37 OilVoice Magazine – February 2016
Huge profits
A way should be found to persuade oil companies to focus on finding new reserves
of oil and gas that can be exploited when oil prices rise rather than to produce oil
currently at a loss. The UK government and the oil companies need to invest in the
future and repay back the huge profits they have taken out of the North Sea. It is
good news if real efficiencies have and can continue to be made across the industry
and everyone would support the OGA in their efforts to achieve this outcome. But
even then there would need to be questions asked why over the past forty years
these inefficiencies were tolerated. Exactly how much revenue to the UK has been
lost through the prevalence of inefficient operational practices by oil companies? Will
anyone be held accountable?
The UK Government led by Chancellor George Osborne has shown all the sparkling
reaction to the crisis that you would expect to see from a rabbit paralysed by
myxomatosis and caught in the glaring headlights of a ten ton truck bearing down on
it. The only response recently has been to advocate the commencement of fracking
operations mostly under national parks in England's green and pleasant land; but for
how much longer once fracking starts?
The OGA are taking a leading role in this and on 17 December 2015 they announced
that 159 onshore blocks under the 14th Onshore Oil and Gas Licensing Round were
being formally offered to successful applicants. This defies economic logic as
onshore production will increase the supply of oil and gas thereby help drive down oil
prices to the further detriment of the North Sea and, in addition, will minimise
economic recovery from shale as oil and gas prices are at rock bottom levels.
Perhaps Osborne should revisit and take heed of the economic disaster that resulted
from Gordon Brown selling the UK's reserves of gold just before gold prices began a
meteoric rise.
The UK Government and the oil industry have reaped enormous direct tax income
(£300bn) and profits respectively from the exploitation of North Sea oil. There is
enough oil and gas still in place in the Atlantic and the North Sea that can generate
at least the same amount of income once oil prices rise. It is not a case of 'if' oil
prices will rise but 'when' they rise. The economic fate of Scotland should not be
imperilled by the mistaken and short-term decision-making of the oil majors to merely
get some payback from their proved reserves rather than take the longer game
stance of investing in retaining staff to continue to explore for new reserves.
Stoking the engine
By all means extract oil where it is possible to do so at a profit but wait till the price of
oil rises before maximising production. Neither should it be imperiled by a UK
government that should be incentivising the industry by matching investment funds £

38 OilVoice Magazine – February 2016
for £ and by agreeing to impose exactly the same taxation regime on the industry as
on any other industry. In this way economic return can be maximised and the
political gains for Westminster would be that these actions would help counter claims
that they are solely focused on stoking the economic engine of the already over-
heated London area rather than redistributing the nation's wealth over all the UK.
In the absence of Westminster showing a willingness to help maximise economic
recovery from the North Sea full control of energy and oil within the Scottish section
of the North Sea should be transferred to the Scottish government and tax receipts
for economic activity taking place within Scotland should be part of the funding
arrangements for Scotland. Under those circumstances we would have more
confidence that the actions suggested above will be taken to ensure that the current
plight of the industry will not result in full-scale decommissioning of all North Sea oil
facilities.
View more quality content from
Robert Gordon University
Why do oil prices keep going down?
Written by Marcelle Arak and Sheila Tschinkel from The Conversation
Global stock markets have been in a tailspin this week. And the sinking price of oil
received at least some of the blame.
Just this week, the cost of a barrel of crude reached a 12-year-low of US$27, down
from more than $100 a little more than year ago. And that may not be the end of it,
according to some in the industry.
Plummeting oil prices have raised fears of a worldwide recession, even though
countries are still reporting growth in jobs and income. Are there other factors driving
oil prices globally?
If prices are going down, suggesting flat or falling demand, why do producers keep
39 OilVoice Magazine – February 2016
adding supply to the market? They should be curtailing production, according to
economics 101. But the oil market doesn't always seem to follow the rules.
Swelling supply
In fact, even as prices have fallen, the amount of oil being pumped has actually
increased. And supply is poised to rise even further, thanks to the lifting of sanctions
against Iran, leading the International Energy Agency (IEA) to warnthis week that
markets could 'drown in oversupply.'
Global oil supply averaged 96.9 million barrels a day in the fourth quarter of 2015, up
from 95.4 million a year earlier. Demand, meanwhile, was almost 2 million barrels
lower at 95.1 million and is expected to decline in the current quarter, even as supply
is likely to increase, according to the IEA.
It's this glut of crude oil in the global economy that has led to the sharp declines in oil
prices. The additional supplies have ended up in storage tanks, because
consumption has barely budged. And oil revenues of producing countries have
consequently dropped very sharply, in tandem with price.
This leads to two more questions: if prices have fallen so much, why doesn't demand
increase? And if demand and revenues are down, why don't producers just turn
down the taps?
Inelasticity of demand
It's actually not a surprise that demand hasn't changed much, because oil use in the
short run is determined by factors that cannot be changed quickly.
Economists look at the responsiveness of demand to price changes in relative terms
and refer to this as the elasticity of demand. If a price decline of one percent, for
example, leads to an increase in the volume sold of less than one percent, it means
demand is not elastic. This is the case with oil consumption.
In other words, the demand for oil in the short run is not that affected by changes in
price. A consumer driving a gas-guzzling SUV in excellent condition will not trade it
in right away just because prices rose. Or if you are a manufacturer and your
equipment is still in good condition, you cannot adjust it to use less energy or buy
different machines quickly.
The inelasticity of demand also means that the total revenue the seller receives will
not rise when prices fall. On the other hand, if a one percent price decline were to
lead to a more than one percent increase in the volume sold, then total revenue
would rise as a result of the price cut.

40 OilVoice Magazine – February 2016
When prices are rising, inelasticity of demand works in the favor of the seller. An
increase in price leads to a lower volume of sales but higher revenue. That is, the
relative decline in volume is less than the rise in price, resulting in more money taken
in by the seller.
Thus, the current situation reflects a highly competitive market and a weak response
from customers in the short run. The current global rate of economic growth, the
state of technology and things like the weather determine the demand for energy
more than price.
At the same time, producers and individual nations keep trying to increase revenue
by producing and selling even more oil. With demand inelastic, the price decline
does not generate enough of an increase in sales volume to raise revenue for any
seller.
Fiddling with the taps
This brings us to the other question: why don't producers pump less oil?
If demand is inelastic in the short run, would withholding supply in hopes prices will
rise lead to more revenue? It turns out that this depends on the share of global
output the supplier controls.
It turns out that if a major player or cooperating group of sellers account for a share
of total sales greater than the elasticity of demand, then cutting back on supply can
improve its current revenue, even if sales volume declines. This is because the
cutback is able to generate a price increase that is large enough.
Of course, this cutback generates even larger benefits or a 'free ride' for other sellers
who do not cut back. Other suppliers happily sell at the higher price. This may be
one reason it is hard to get cooperation to raise the price.
Right now oil producers are not cooperating with each other as much as they have in
the past, such as in the 1970s. Back then, the Organization of Petroleum Exporting
Countries (OPEC) controlled more than half of the global supply of crude. When they
cut production, prices rose and all its members benefited.
Today, that kind of cooperation is much less likely, as oil-producing countries don't
appear interested or even able to work together to raise prices - let alone do so
unilaterally. They have varying foreign policy interests and economic structures. The
biggest producer, Saudi Arabia, is even accused of purposely trying to keep prices
low to run upstart American producers out of business.

41 OilVoice Magazine – February 2016
And those U.S. producers, which ramped up production in recent years in large part
because oil prices were above $100, still haven't backed down, perhaps encouraged
by the move by Congress to allow U.S. oil exports for the first time in four decades.
What's next
Still, the relationship between demand elasticity and percentage of market share
implies that all it would take is two or three major suppliers working together to
restrict supply sufficiently to raise prices by enough to increase their total revenue.
For example, Saudi Arabia and the Russian Federation each control about 10
percent of supply. If they both agreed to cut back, it would probably stop the skid in
prices and improve their total revenue. It would also improve revenues of countries
and producers who did not cut back.
While this would work in the current environment, producers may be thinking long-
term and waiting out the lower prices in hopes of either pushing U.S. marginal
suppliers into bankruptcy or reversing the trend toward fuel efficiency.
But these trends work both ways. For example, the OPEC-generated price increases
in the 1970s caused changes in the energy efficiency of capital equipment in the
years that followed. All sectors of the economy bought more fuel-efficient machinery
and insulated structures. And this reduced demand for oil.
That is, in the long run, the price elasticity of demand is higher because consumers
are more responsive to price changes. If prices go up, consumers and businesses
eventually find ways to cut back. If prices are low, demand will eventually rise
commensurate with the reduced cost.
Meanwhile, as long as supply continues to rise and demand remains inelastic or
unresponsive, the price of oil is likely to continue its slide.
Marcelle Arak - Professor of Finance Emerita, University of Colorado Denver
Sheila Tschinkel - Visiting Faculty in Economics, Emory University
View more quality content from
The Conversation


