Download - One Resolution SIP - LICMF

JANUARY 2021
MUTUAL FUND INVESTMENTS ARE SUBJECT TO MARKET RISKS, READ ALL SCHEME RELATED DOCUMENTS CAREFULLY.
/LICMutual /company/LICMutual/LICMutual 1800-258-5678Connect with us: www.licmf.com
Happy New YearLet the year ahead be the onewhere your dreams come true.
*(Systematic Investment Plan) SIP facility is generally available in Daily, Monthly & Quarterly frequency
OneResolutionStart An
SIP
MARKET REVIEW
Mr. Yogesh Patil
Fund Manager - Equity
₹
2
EQUITY DEBTMarket Review
Ÿ MPC Policy was a non event as policy rates remain unchanged with Repo Rate at 4% and Reverse Repo rate at 3.35%. Though some expected CRR to reverse to 4% considering overnight rates going below 3% due to excess liquidity, RBI maintained CRR also at 3% for the time being. Governor maintained that rural demand continues to show improvement with urban demand catching up, however he revised its expectation of real GDP contraction from 9.5% to 7.5%in FY21. Governor stated that it expects GDP growth for Q3 & Q4 to move into positive territory.
Ÿ In light of rising CPI print, Policy was expected to be pro inflation, however the policy was pro liquidity and pro growth. Except for upward revision of CPI estimates for FY21, there was not enough communication with respect to how RBI plans to tackle it. Rather there were a number of Pro liquidity announcements. The central bank plans to conduct special and outright bond purchases and announced on-tap TLTRO for ₹ 1 lakh crore at 4 percent till March 2021, besides, OMO worth ₹ 20,000 crore.
Ÿ Beyond the usual growth, inflation and policy rationale, the December RBI policy minutes shed light on increasing complexities arising out of (1) low short-term rates and sustained negative real interest rates, (2) macro-financial stability given liquidity, credit, and money supply, and (3) unequal pricing power among firms. A much-needed case was made for flexible inflation targeting framework and the gains seen out of it.
Ÿ Second round of Coronavirus infections has led to ultra-accommodative global monetary policy to persist in 2021 as the recovery remains policy dependent. ECB expanded policy accommodation to limit the downside risk to growth with renewed lockdowns in European countries. The PEPP was increased by €500bn and net purchases were extended to at least the end of March 2022.
Ÿ Meanwhile, BoJ extended asset purchase program till Sept 2021. The US Fed assured markets of continued accommodation and provided enhanced guidance on its asset purchase program, which will continue until substantial progress has been made toward maximum employment and price stability goals.
Ÿ Global steel prices have risen to multi-year highs, as demand outstrips supply, led by strong rebound in China and iron ore supply disruptions. Meanwhile, Brent crude oil prices rise to US$51pb, on the back of recovery hopes as well as supply side management by OPEC+, which has helped reduce the inventory build-up.
Outlook
Ÿ MPC members' outlook on inflation has become much more uncertain, with cost
push pressures such as elevated retail margins likely to persist. The supply side
disruptions come at a time when output gap remains negative. However, once the
recovery takes hold there is a risk that the cost push inflation could get generalized.
Ÿ Hence, the window to address the supply-side disruptions is small and RBI's
ability to look through inflation pressures has narrowed considerably. We expect RBI
to remain on hold and maintain accommodative stance into FY22. CY2021 will be
marked with hopes for (1) early roll-out of the Covid-19 vaccine, (2) normalization of
activities, and (3) unperturbed growth recovery.
Ÿ India will see a slow cyclical recovery along with inflation gradually easing
though not enough to sustain the accommodative stance. Interest rates will likely
harden with no rate cuts and persistent fiscal pressure. Key risks will be steering
through any financial sector stress, reviving the weak investment cycle, and any
adverse global liquidity issues.
Mr. Marzban Irani
CIO - Fixed Income
₹
Market Review
Ÿ The Indian economy and the sentiments are improving led by positive developments on Covid-19 vaccinations. The supply side challenges have recovered significantly, however; demand aggregates appear challenging. During the month, equity market saw appreciation with BSE Sensex rising by 8.2% month-on-month and CNX Nifty rising by 7.8% for the same month.
Ÿ On the macro front, CPI Inflation declined to 6.93% in November vs 7.61% in October 2020. The country's Index of Industrial Production (IIP) continued to grow at 3.6% in October vs 0.2% in September 2020. Sector-wise indices – BSE Realty, BSE Metal, BSE Consumer Durables, BSE IT, BSE Capital Goods, BSE 100, BSE 200, BSE 500, BSE FMCG, BSE Small-Cap, BSE Healthcare, BSE Oil & Gas, BSE Mid-Cap, BANKEX, BSE Auto and BSE Power rose by 20.2%, 13.5%, 12.4%, 12.1%, 10.1%, 8.0%, 7.8%, 7.7%, 7.5%, 7.2%, 6.7%, 6.3%, 6.1%, 5.9%, 3.4% and 3.1% respectively.
Capital flows:
FIIs were net buyers in the equity to the tune of ₹ 53,500 crores (US$ 7,267mn) in
December 2020. Cumulatively, FIIs bought equity worth ₹ 1,73,338 crores
(US$ 23,436mn) in last twelve months i.e., from January'20-Decemeber'20 and DII
sold equity worth ₹ 46,483 crores (US$ 6,244mn) for the same period. (As on 31st
December 2020, Source: SEBI) (December 2020 Avg. 1 USD = INR 73.6223).
Outlook
Ÿ The month gone by saw the emergence of the new Covid-19 strain in the UK
which prompted many countries to impose travel restrictions on the UK. However,
these were subsequently lifted by the end of the month. We finally see most of the
developed economies giving emergency approvals for the vaccines.
Ÿ 2020 was rather an eventful year. We saw the indices peaking in February
before the virus spread from China to most parts of the globe, India being no
different and it took merely 30 trading days for the Nifty index to reach the year's
low. However, the speed of the recovery was also surprising and demonstrated the
confidence in the potential of the Indian economy. While it took Nifty index 165 days
to reach the previous high mark, it had recovered most of the losses. In
comparison, the drawdown in 2008 was more prolonged and it took a lot longer for
the index to reach the previous high-water mark in 2009.
Ÿ As we enter 2021, we expect to see strong demand recovery in the domestic
economy with the backbone being strong foreign exchange reserves accretion
during the pandemic. Surplus liquidity in the system has ensured all-time low
interest rates acting as a catalyst and is also aiding RBI in facilitating Government's
capital expenditure plans and enhanced borrowings.
Ÿ Rural demand is likely to be robust on account of two consecutive years of good
agri-production, healthy food prices, MSP hikes, MGNREGA support etc. We are
also seeing consolidation of market share in the hands of few with strong balance
sheet and efficient supply chain. Pandemic has in a way catalyzed the process of
shift from unorganized to organized businesses and the benefits of government's
policies like demonetization, GST etc. are likely to be seen going forward.
Ÿ Lockdowns gave managements an opportunity to take a zero-base approach
to looking at overheads. Managements believe that even in a 'return to normalcy'
scenario, they can effect structural changes to their cost structure by managing
their fixed costs components. However, near term growth impulses are still weak
with households preferring savings over consumption, government spending
constrained and corporate sector deferring capital expenditure.
Ÿ We believe, India is well placed among its global peers and going forward a)
industry consolidation, b) technological adoption, c) structural industrial changes,
d) government reforms. e) focus on domestic manufacturing and f) cost saving
measures are likely to drive the Indian equity market.
Ÿ We prefer to focus on existing leaders who are likely to disrupt/ innovate in their
business to ensure that their leadership or competitive advantage remains strong.
Value creation imperatives in investment viz, high standards of governance, high
capital efficiency, strong moats and sustainable growth are unlikely to change.

RISKOMETER
Name Of The SchemeThe Product Is Suitable For Investors Who Are Seeking *
Riskometer
LIC MF Large Cap Fund
LIC MF Multicap Fund
LIC MF Large & Mid Cap Fund
LIC MF Infrastructure Fund
LIC MF Tax Plan
LIC MF Index Fund-Sensex Plan
LIC MF Index Fund-Nifty Plan
LIC MF Exchange Traded Fund - Nifty 50
LIC MF Exchange Traded Fund - Sensex
LIC MF Exchange Traded Fund - Nifty 100
3
Ÿ Long Term Capital AppreciationŸ A Fund that primarily invest in large-cap stockŸ Risk - Very High
Ÿ Long Term Capital AppreciationŸ Investing in Large, Mid & Small-cap stocksŸ Risk - Very High
Ÿ Long Term Capital AppreciationŸ A Fund that primarily invest in large and mid-cap
stocksŸ Risk - Very High
Ÿ Capital appreciation over long termŸ Investment predominantly in a portfolio of equity
and equity related securities of companies engaged in banking and financial services.
Ÿ Risk - Very High
Ÿ Long Term Capital GrowthŸ Investment in equity and equity related instruments
of companies engaged either directly or indirectly in infrastructure sector.
Ÿ Risk - Very High
Ÿ Long Term Capital GrowthŸ Investing in equity and equity related securities.Ÿ Risk - Very High
Ÿ Long Term Capital Growth
Ÿ Investment in equity instrument of S&P BSE Sensex
Index stocks subject to tracking error.
Ÿ Risk - Very High
Ÿ Long Term Capital Growth
Ÿ Investment in equity instrument of NIFTY 50 Index
stocks subject to tracking error.
Ÿ Risk - Very High
Ÿ Long Term InvestmentŸ Investment in securities covered by NIFTY 50
Index, subject to tracking errors.Ÿ Risk - Very High
Ÿ Long Term InvestmentŸ Investment in securities covered by S&P BSE
SENSEX, subject to tracking errors.Ÿ Risk - Very High
Ÿ Long Term InvestmentŸ Investment in equity and equity related securities
and portfolios replicating the composition of NIFTY 100 Index, subject to tracking errors.
Ÿ Risk - Very High
LIC MF Banking & Financial Services Fund
LIC MF Children’s Gift Fund
LIC MF Equity Hybrid Fund
SchemeLIC MF Unit Linked Insurance
Ÿ Long term capital appreciation with current income.Ÿ A fund that invests both in stocks and fixed income
instruments. Ÿ Risk - Very High
Ÿ Long term capital appreciation and current income.Ÿ Investment in equity and equity related securiries,
fixed income securities (debt and money market securities).
Ÿ Risk - Very High
Ÿ Long term capital appreciation and current income
Ÿ A fund that invests both in stocks and fixed income instruments.
Ÿ Risk - Very High
Low
Low toModerate
Moderate ModeratelyHigh
High
Very High
RISKOMETER HIGHLOW
Investors understand that their principalwill be at Very High risk
*Investors should consult their financial advisors if in doubt about whether the product is suitable for them. For scheme related details, including updation in Riskometer (if any) may please be referred on our website www.licmf.com
Name Of The SchemeThe Product Is Suitable For Investors Who Are Seeking *
Riskometer
LIC MF Government SecuritiesFund
LIC MF Debt Hybrid Fund
LIC MF Bond Fund
LIC MF Banking & PSU Debt Fund
LIC MF Savings Fund
RISKOMETER
4
Ÿ Long term capital appreciation and current incomeŸ Investment in sovereign securities issued by
Central/ State Government.Ÿ Risk - Moderate
Ÿ Medium term capital appreciation with current income
Ÿ A fund that invests predominantly in debt instruments with marginal equity exposure.
Ÿ Risk - Moderately High
Ÿ Income over medium to long termŸ To generate income/capital appreciation through
investments in Debt and Money market instruments.
Ÿ Risk - Moderate
Ÿ Regular income for medium term capital appreciation with current income
Ÿ An income fund that invests predominantly in debt and money market instruments issued by Banks, Public Sector Undertakings, Public Financial Institutions and Municipal Bonds.
Ÿ Risk - Moderate
Ÿ Regular Income for short termŸ A fund that focuses on low duration securities.Ÿ Risk - Low to Moderate
*Investors should consult their financial advisors if in doubt about whether the product is suitable for them. For scheme related details, including updation in Riskometer (if any) may please be referred on our website www.licmf.com
LIC MF G-Sec Long Term Exchange Traded Fund
Ÿ Medium to long term regular incomeŸ Investment in securities in line with Nifty 8-13 yr
G-Sec Index to generate comparable returns subject to tracking error.
Ÿ Risk - Moderate
LIC MF Short Term Debt Fund
LIC MF Ultra Short Term Fund
Ÿ Generation of reasonable returns over short to medium term.
Ÿ Investment in Debt securities and money market instruments.
Ÿ Risk - Moderate
Ÿ Regular income over short term.
Ÿ Investment in Debt & Money Market Instruments such that the Macaulay Duration of the portfolio is between 3 months - 6 months.
Ÿ Risk - Low to Moderate
Exchange Traded Fund
LIC MF Arbitrage Fund Ÿ Income over a short term investment horizon.
Ÿ Income through arbitrage opportunities between cash and derivative market and arbitrage opportunities within the derivative segment of the equity market.
• Risk - Low
LIC MF Liquid Fund
LIC MF Overnight Fund
Ÿ Regular income for short termŸ Investment in debt / money market instruments
with maturity of upto 91 days. Ÿ Risk - Low to Moderate
Ÿ Regular income with high levels of safety and liquidity over short term
Ÿ Investment in debt and money market instruments with overnight maturity.
Ÿ Risk - Low
Low
Low toModerate
Moderate ModeratelyHigh
High
Very High
RISKOMETER HIGHLOW
Investors understand that their principal will be atModerately High risk
Low
Low toModerate
Moderate ModeratelyHigh
High
Very High
RISKOMETER HIGHLOW
Investors understand that their principalwill be at Moderate risk
Low
Low toModerate
Moderate ModeratelyHigh
High
Very High
RISKOMETER HIGHLOW
Investors understand that their principalwill be at Low risk
Low
Low toModerate
Moderate ModeratelyHigh
High
Very High
RISKOMETER HIGHLOW
Investors understand that their principal willbe at Low to Moderate risk

To achieve long term capital appreciation by investing in diversified portfolio predominantly consisting of
equity and equity related securities of Large Cap companies including derivatives. However there can be no
assurance that the investment objective of the scheme will be achieved.
stAbove returns are as on 31 December, 2020. Past performance may or may not be sustained in the future. # Nifty 100 TRI, ## Nifty 50 TRI. Assuming ₹ 10,000/- invested
systematically on the first Business Day of every month over a period of time. CAGR returns are computed after accounting for the cash by using XIRR method (investment
internal rate of return) for Regular Plan - Growth Option. Load is not taken into consideration for computation of performance. The above investment simulation is for illustrative
purpose only and should not be construed as a promise on minimum returns and safeguard of capital. The Mutual Fund is not guaranteeing or promising or forecasting any
returns. NA : Not Available. The performance of the scheme is benchmarked to the Total Return variant of the index. * Scheme data & TRI value of the Index are not available for
since inception, hence performance for such period is not available.
SCHEME PERFORMANCE
SIP PERFORMANCE
PORTFOLIO AS ON 31.12.2020
INVESTMENT OBJECTIVESCHEME FEATURES
SECTOR ALLOCATION (% of NAV)
Company % of NAV Company % of NAV
SIP Investments 1 Year 3 Years 7 Years5 Years 10 Years Since Inception*
Total Amount Invested ( )₹ 1,20,000 3,60,000 8,40,0006,00,000 12,00,000 NA
Market Value as on December 31, 2020 ( ) ₹ 1,51,221 4,61,062 12,71,6078,34,272 22,34,142 NA
Returns (CAGR) (%) 51.50 16.73 11.6413.14 11.94 NA
Benchmark Returns (CAGR) (%) #
Additional Benchmark Returns (CAGR) (%) ##
59.18
60.66
16.84 12.96
17.61 13.10
14.31
14.89
13.11
12.91
NA
NA
5
Scheme Nifty 100 TRI* Nifty 100 TRI* Nifty 50 TRI** Nifty 50 TRI** Scheme
1 Year 13.77 16.03 16.09 11,381 11,608 11,614
3 Years 9.61 9.98 11.28 13,180 13,314 13,790
5 Years 11.31 13.17 13.39 17,094 18,577 18,754
Since Inception 4.67 NA 10.45 33,271 NA 1,37,223
CAGR (%)Value of lumpsum investment of 10,000/- invested ₹
on inception datePeriod
stAbove returns are as on 31 December, 2020. Different plans shall have a different expense structure. The performance details provided herein are of Regular plan - Growth th
option. Mr. Yogesh Patil is managing the above scheme from 18 September, 2020 and total no. of schemes managed by him is 11. Also, Ms. Ritu Modi is co managing the above
scheme from 1st November, 2019 and total no. of schemes managed by her is 7. Past performance may or may not be sustained in the future. Load is not taken into
consideration for computation of performance. The Mutual Fund is not guaranteeing or promising or forecasting any returns. As the scheme was launched before the launch of
the benchmark index, benchmark index figures since inception or the required period are not available.* Benchmark, ** Additional Benchmark. NA : Not Available. The
performance of the scheme is benchmarked to the Total Return variant of the index. For detailed disclaimer, please refer page no 33.
Factsheet January, 2021
Scheme Type: An open ended equity scheme predominantly investing in Large Cap stocks.
Date of allotment: September 01, 1994
Fund Size:
AUM as on 31/12/2020: ₹ 485.68 CrAverage AUM for December 2020: ₹ 471.17 Cr
Benchmark: Nifty 100 TRI
Minimum Investment (lumpsum): ₹ 5,000/-
Fund Manager:Name: Mr. Yogesh Patil;Experience: 11+ years
NAV as on December 31, 2020:NAV Regular Plan Direct Plan
Growth ₹ 33.2713 ₹ 35.7934
Dividend ₹ 20.0932 ₹ 23.7473
Expense Ratio:Regular: 2.61% Direct: 1.42%(for detailed bifurcation on TER, please see page no 32)
Annual Portfolio Turnover Ratio: 0.23 times
Risk Measures:Standard Deviation 5.63Portfolio Beta 0.88Sharpe Ratio 0.1235
Load Structure:Entry Load - NIL
Exit Load
Ÿ 12% of the units allotted shall be redeemed or switched out without any exit load, on or before completion of 12 months from the date of allotment of units.
Ÿ 1% on remaining units if redeemed or switched out on or before completion of 12 months from the date of allotment of units.
Ÿ Nil, if redeemed or switched out after completion of 12 months from the date of allotment of units.
Top 10 holdings
Co-Fund Manager:Name: Ms. Ritu Modi;Experience: 9+ years
23.61%
16.13%
16.13%
10.95%
5.66%
5.59%
5.58%
3.83%
3.05%
2.86%
2.43%
1.12%
Banks
Finance
Software
Consumer Non Durables
Pharmaceuticals
Petroleum Products
Retailing
Auto
Cement
Telecom - Services
Consumer Durables
Construction Project
Equity Holdings
Auto 3.83%
Maruti Suzuki India Ltd. 2.46%
Mahindra & Mahindra Ltd. 1.36%
Banks 23.61%
HDFC Bank Ltd. 8.87%
ICICI Bank Ltd. 8.65%
Kotak Mahindra Bank Ltd. 6.09%
Cement 3.05%
Shree Cement Ltd. 1.54%
Ultratech Cement Ltd. 1.51%
Construction Project 1.12%
Larsen & Toubro Ltd. 1.12%
Consumer Durables 2.43%
Titan Company Ltd. 2.43%
Consumer Non Durables 10.95%
Hindustan Unilever Ltd. 3.41%
Nestle India Ltd. 2.12%
Asian Paints Ltd. 1.99%
Tata Consumer Products Ltd. 1.79%
United Spirits Ltd. 1.64%
Finance 16.13%
Bajaj Finance Ltd. 7.31%
HDFC Ltd. 3.77%
Bajaj Finserv Ltd. 3.01%
ICICI Lombard General Ins Co. Ltd. 1.06%
ICICI Prudential Life Ins Co Ltd. 0.98%
Petroleum Products 5.59%
Reliance Industries Ltd. 5.52%
Reliance Industries Ltd. Partly Paid Up Fv2.5 0.07%
Pharmaceuticals 5.66%
Divi's Laboratories Ltd. 2.26%
Torrent Pharmaceuticals Ltd. 1.58%
Cipla Ltd. 0.76%
Biocon Ltd. 0.75%
Dr. Reddy's Laboratories Ltd. 0.30%
Retailing 5.58%
Avenue Supermarts Ltd. 5.58%
Software 16.13%
Infosys Ltd. 9.00%
Tata Consultancy Services Ltd. 6.18%
Wipro Ltd. 0.95%
Telecom - Services 2.86%
Bharti Airtel Ltd. 2.86%
Equity Holdings Total 96.94%
Cash & Other Receivables Total 3.06%
Grand Total 100.00%
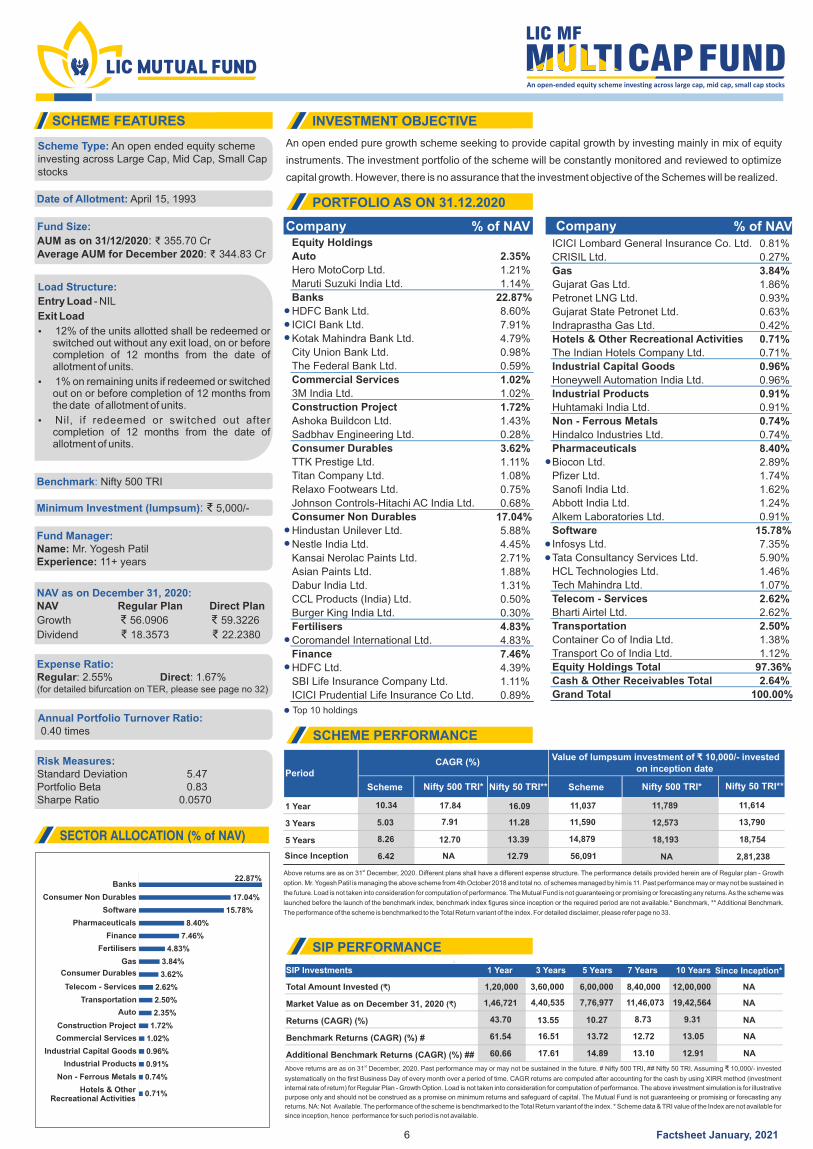
An open ended pure growth scheme seeking to provide capital growth by investing mainly in mix of equity
instruments. The investment portfolio of the scheme will be constantly monitored and reviewed to optimize
capital growth. However, there is no assurance that the investment objective of the Schemes will be realized.
stAbove returns are as on 31 December, 2020. Past performance may or may not be sustained in the future. # Nifty 500 TRI, ## Nifty 50 TRI. Assuming ₹ 10,000/- invested
systematically on the first Business Day of every month over a period of time. CAGR returns are computed after accounting for the cash by using XIRR method (investment
internal rate of return) for Regular Plan - Growth Option. Load is not taken into consideration for computation of performance. The above investment simulation is for illustrative
purpose only and should not be construed as a promise on minimum returns and safeguard of capital. The Mutual Fund is not guaranteeing or promising or forecasting any
returns. NA: Not Available. The performance of the scheme is benchmarked to the Total Return variant of the index. * Scheme data & TRI value of the Index are not available for
since inception, hence performance for such period is not available.
SIP Investments 1 Year 3 Years 5 Years 10 Years7 Years Since Inception*
Total Amount Invested ( )₹ 1,20,000 3,60,000 6,00,000 12,00,0008,40,000 NA
Market Value as on December 31, 2020 ( ) ₹ 1,46,721 4,40,535 7,76,977 19,42,56411,46,073 NA
Returns (CAGR) (%) 43.70 13.55 10.27 9.318.73 NA
Benchmark Returns (CAGR) (%) #
Additional Benchmark Returns (CAGR) (%) ##
61.54
60.66
16.51
17.61
13.72
14.89
13.0512.72
12.9113.10
NA
NA
SCHEME FEATURES INVESTMENT OBJECTIVE
PORTFOLIO AS ON 31.12.2020
SCHEME PERFORMANCE
SIP PERFORMANCE
Company % of NAV Company % of NAV
SECTOR ALLOCATION (% of NAV)
Scheme Scheme
1 Year 10.34 17.84 16.09 11,037 11,789 11,614
3 Years 5.03 7.91 11.28 11,590 12,573 13,790
5 Years 8.26 12.70 13.39 14,879 18,193 18,754
Since Inception 6.42 NA 12.79 56,091 NA 2,81,238
PeriodCAGR (%)
Value of lumpsum investment of 10,000/- invested ₹on inception date
stAbove returns are as on 31 December, 2020. Different plans shall have a different expense structure. The performance details provided herein are of Regular plan - Growth
option. Mr. Yogesh Patil is managing the above scheme from 4th October 2018 and total no. of schemes managed by him is 11. Past performance may or may not be sustained in
the future. Load is not taken into consideration for computation of performance. The Mutual Fund is not guaranteeing or promising or forecasting any returns. As the scheme was
launched before the launch of the benchmark index, benchmark index figures since inception or the required period are not available.* Benchmark, ** Additional Benchmark.
The performance of the scheme is benchmarked to the Total Return variant of the index. For detailed disclaimer, please refer page no 33.
Nifty 500 TRI* Nifty 500 TRI* Nifty 50 TRI** Nifty 50 TRI**
Scheme Type: An open ended equity scheme investing across Large Cap, Mid Cap, Small Cap stocks
Date of Allotment: April 15, 1993
Fund Size:
AUM as on 31/12/2020: ₹ 355.70 Cr: ₹ 344.83 CrAverage AUM for December 2020
Benchmark: Nifty 500 TRI
Minimum Investment (lumpsum): ₹ 5,000/-
Fund Manager:Name: Mr. Yogesh PatilExperience: years11+
NAV as on December 31, 2020:NAV Regular Plan Direct Plan
Growth ₹ 56.0906 ₹ 59.3226
Dividend ₹ 18.3573 ₹ 22.2380
Expense Ratio:Regular: 2.55% Direct: 1.67%(for detailed bifurcation on TER, please see page no 32)
Annual Portfolio Turnover Ratio: 0.40 times
Risk Measures:Standard Deviation 5.47Portfolio Beta 0.83Sharpe Ratio 0.0570
6
Load Structure:
Entry Load - NIL
Exit Load
Ÿ 12% of the units allotted shall be redeemed or switched out without any exit load, on or before completion of 12 months from the date of allotment of units.
Ÿ 1% on remaining units if redeemed or switched out on or before completion of 12 months from the date of allotment of units.
Ÿ Nil, if redeemed or switched out after completion of 12 months from the date of allotment of units.
Top 10 holdings
Factsheet January, 2021
22.87%
17.04%
15.78%
8.40%
7.46%
4.83%
3.84%
3.62%
2.62%
2.50%
2.35%
1.72%
1.02%
0.96%
0.91%
0.74%
0.71%
Banks
Consumer Non Durables
Software
Pharmaceuticals
Finance
Fertilisers
Gas
Consumer Durables
Telecom - Services
Transportation
Auto
Construction Project
Commercial Services
Industrial Capital Goods
Industrial Products
Non - Ferrous Metals
Hotels & OtherRecreational Activities
Equity Holdings
Auto 2.35%
Hero MotoCorp Ltd. 1.21%
Maruti Suzuki India Ltd. 1.14%
Banks 22.87%
HDFC Bank Ltd. 8.60%
ICICI Bank Ltd. 7.91%
Kotak Mahindra Bank Ltd. 4.79%
City Union Bank Ltd. 0.98%
The Federal Bank Ltd. 0.59%
Commercial Services 1.02%
3M India Ltd. 1.02%
Construction Project 1.72%
Ashoka Buildcon Ltd. 1.43%
Sadbhav Engineering Ltd. 0.28%
Consumer Durables 3.62%
TTK Prestige Ltd. 1.11%
Titan Company Ltd. 1.08%
Relaxo Footwears Ltd. 0.75%
Johnson Controls-Hitachi AC India Ltd. 0.68%
Consumer Non Durables 17.04%
Hindustan Unilever Ltd. 5.88%
Nestle India Ltd. 4.45%
Kansai Nerolac Paints Ltd. 2.71%
Asian Paints Ltd. 1.88%
Dabur India Ltd. 1.31%
CCL Products (India) Ltd. 0.50%
Burger King India Ltd. 0.30%
Fertilisers 4.83%
Coromandel International Ltd. 4.83%
Finance 7.46%
HDFC Ltd. 4.39%
SBI Life Insurance Company Ltd. 1.11%
ICICI Prudential Life Insurance Co Ltd. 0.89%
ICICI Lombard General Insurance Co. Ltd. 0.81%
CRISIL Ltd. 0.27%
Gas 3.84%
Gujarat Gas Ltd. 1.86%
Petronet LNG Ltd. 0.93%
Gujarat State Petronet Ltd. 0.63%
Indraprastha Gas Ltd. 0.42%
Hotels & Other Recreational Activities 0.71%
The Indian Hotels Company Ltd. 0.71%
Industrial Capital Goods 0.96%
Honeywell Automation India Ltd. 0.96%
Industrial Products 0.91%
Huhtamaki India Ltd. 0.91%
Non - Ferrous Metals 0.74%
Hindalco Industries Ltd. 0.74%
Pharmaceuticals 8.40%
Biocon Ltd. 2.89%
Pfizer Ltd. 1.74%
Sanofi India Ltd. 1.62%
Abbott India Ltd. 1.24%
Alkem Laboratories Ltd. 0.91%
Software 15.78%
Infosys Ltd. 7.35%
Tata Consultancy Services Ltd. 5.90%
HCL Technologies Ltd. 1.46%
Tech Mahindra Ltd. 1.07%
Telecom - Services 2.62%
Bharti Airtel Ltd. 2.62%
Transportation 2.50%
Container Co of India Ltd. 1.38%
Transport Co of India Ltd. 1.12%
Equity Holdings Total 97.36%
Cash & Other Receivables Total 2.64%
Grand Total 100.00%
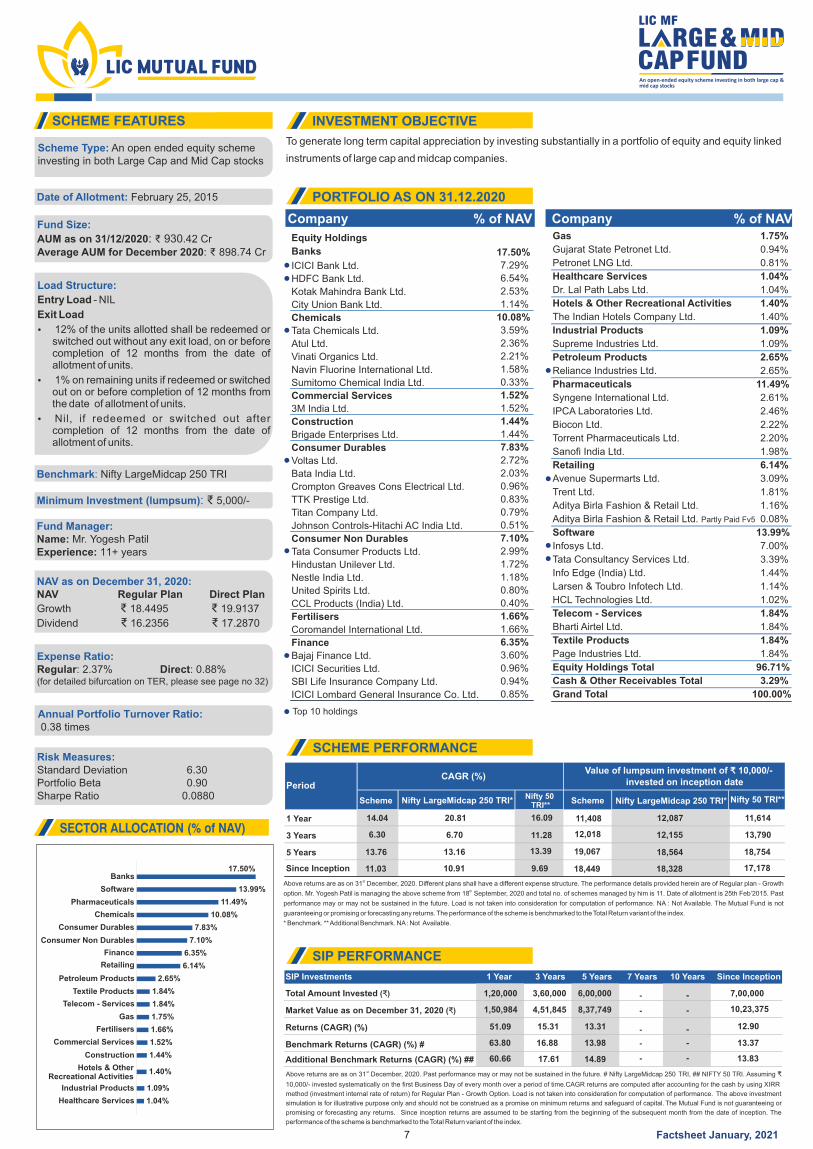
To generate long term capital appreciation by investing substantially in a portfolio of equity and equity linked
instruments of large cap and midcap companies.
stAbove returns are as on 31 December, 2020. Past performance may or may not be sustained in the future. # Nifty LargeMidcap 250 TRI, ## NIFTY 50 TRI. Assuming ₹
10,000/- invested systematically on the first Business Day of every month over a period of time.CAGR returns are computed after accounting for the cash by using XIRR
method (investment internal rate of return) for Regular Plan - Growth Option. Load is not taken into consideration for computation of performance. The above investment
simulation is for illustrative purpose only and should not be construed as a promise on minimum returns and safeguard of capital. The Mutual Fund is not guaranteeing or
promising or forecasting any returns. Since inception returns are assumed to be starting from the beginning of the subsequent month from the date of inception. The
performance of the scheme is benchmarked to the Total Return variant of the index.
SIP Investments 1 Year 3 Years 5 Years 7 Years 10 Years Since Inception
Total Amount Invested ( )₹ 1,20,000 3,60,000 6,00,000 - - 7,00,000
Market Value as on December 31, 2020 ( ) ₹ 1,50,984 4,51,845 8,37,749 - - 10,23,375
Returns (CAGR) (%) 51.09 15.31 13.31 - - 12.90
Benchmark Returns (CAGR) (%) #
Additional Benchmark Returns (CAGR) (%) ##
63.80 16.88 13.98
60.66 17.61 14.89
-
-
-
-
13.37
13.83
SCHEME FEATURES INVESTMENT OBJECTIVE
PORTFOLIO AS ON 31.12.2020
SCHEME PERFORMANCE
SIP PERFORMANCE
Company % of NAV Company % of NAV
SECTOR ALLOCATION (% of NAV)
Scheme Nifty LargeMidcap 250 TRI* Nifty LargeMidcap 250 TRI*SchemeNifty 50 TRI**
Nifty 50 TRI**
1 Year 14.04 20.81 16.09 11,408 12,087 11,614
3 Years 6.30 6.70 11.28 12,018 12,155 13,790
5 Years 13.76 13.16 13.39 19,067 18,564 18,754
Since Inception 11.03 10.91 9.69 18,449 18,328 17,178
PeriodCAGR (%)
Value of lumpsum investment of 10,000/- ₹invested on inception date
stAbove returns are as on 31 December, 2020. Different plans shall have a different expense structure. The performance details provided herein are of Regular plan - Growth thoption. Mr. Yogesh Patil is managing the above scheme from 18 September, 2020 and total no. of schemes managed by him is 11. Date of allotment is 25th Feb’2015. Past
performance may or may not be sustained in the future. Load is not taken into consideration for computation of performance. NA : Not Available. The Mutual Fund is not
guaranteeing or promising or forecasting any returns. The performance of the scheme is benchmarked to the Total Return variant of the index.
* Benchmark. ** Additional Benchmark. NA : Not Available.
Scheme Type: An open ended equity scheme investing in both Large Cap and Mid Cap stocks
Date of Allotment: February 25, 2015
Fund Size:
AUM as on 31/12/2020: ₹ 930.42 Cr: ₹ 898.74 CrAverage AUM for December 2020
Benchmark: Nifty LargeMidcap 250 TRI
Minimum Investment (lumpsum): ₹ 5,000/-
Fund Manager:Name: Mr. Yogesh PatilExperience: 11+ years
NAV as on December 31, 2020:NAV Regular Plan Direct Plan
Growth ₹ 18.4495 ₹ 19.9137
Dividend ₹ 16.2356 ₹ 17.2870
Expense Ratio:Regular: 2.37% Direct: 0.88%(for detailed bifurcation on TER, please see page no 32)
Annual Portfolio Turnover Ratio: 0.38 times
Risk Measures:Standard Deviation 6.30Portfolio Beta 0.90Sharpe Ratio 0.0880
7
Load Structure:
Entry Load - NIL
Exit Load
Ÿ 12% of the units allotted shall be redeemed or switched out without any exit load, on or before completion of 12 months from the date of allotment of units.
Ÿ 1% on remaining units if redeemed or switched out on or before completion of 12 months from the date of allotment of units.
Ÿ Nil, if redeemed or switched out after completion of 12 months from the date of allotment of units.
Top 10 holdings
Factsheet January, 2021
17.50%
13.99%
11.49%
10.08%
7.83%
7.10%
6.35%
6.14%
2.65%
1.84%
1.84%
1.75%
1.66%
1.52%
1.44%
1.40%
1.09%
1.04%
Banks
Software
Pharmaceuticals
Chemicals
Consumer Durables
Consumer Non Durables
Finance
Retailing
Petroleum Products
Textile Products
Telecom - Services
Gas
Fertilisers
Commercial Services
Construction
Hotels & OtherRecreational Activities
Industrial Products
Healthcare Services
Equity Holdings
Banks 17.50%
ICICI Bank Ltd. 7.29%
HDFC Bank Ltd. 6.54%
Kotak Mahindra Bank Ltd. 2.53%
City Union Bank Ltd. 1.14%
Chemicals 10.08%
Tata Chemicals Ltd. 3.59%
Atul Ltd. 2.36%
Vinati Organics Ltd. 2.21%
Navin Fluorine International Ltd. 1.58%
Sumitomo Chemical India Ltd. 0.33%
Commercial Services 1.52%
3M India Ltd. 1.52%
Construction 1.44%
Brigade Enterprises Ltd. 1.44%
Consumer Durables 7.83%
Voltas Ltd. 2.72%
Bata India Ltd. 2.03%
Crompton Greaves Cons Electrical Ltd. 0.96%
TTK Prestige Ltd. 0.83%
Titan Company Ltd. 0.79%
Johnson Controls-Hitachi AC India Ltd. 0.51%
Consumer Non Durables 7.10%
Tata Consumer Products Ltd. 2.99%
Hindustan Unilever Ltd. 1.72%
Nestle India Ltd. 1.18%
United Spirits Ltd. 0.80%
CCL Products (India) Ltd. 0.40%
Fertilisers 1.66%
Coromandel International Ltd. 1.66%
Finance 6.35%
Bajaj Finance Ltd. 3.60%
ICICI Securities Ltd. 0.96%
SBI Life Insurance Company Ltd. 0.94%
ICICI Lombard General Insurance Co. Ltd. 0.85%
Gas 1.75%
Gujarat State Petronet Ltd. 0.94%
Petronet LNG Ltd. 0.81%
Healthcare Services 1.04%
Dr. Lal Path Labs Ltd. 1.04%
Hotels & Other Recreational Activities 1.40%
The Indian Hotels Company Ltd. 1.40%
Industrial Products 1.09%
Supreme Industries Ltd. 1.09%
Petroleum Products 2.65%
Reliance Industries Ltd. 2.65%
Pharmaceuticals 11.49%
Syngene International Ltd. 2.61%
IPCA Laboratories Ltd. 2.46%
Biocon Ltd. 2.22%
Torrent Pharmaceuticals Ltd. 2.20%
Sanofi India Ltd. 1.98%
Retailing 6.14%
Avenue Supermarts Ltd. 3.09%
Trent Ltd. 1.81%
Aditya Birla Fashion & Retail Ltd. 1.16%
Aditya Birla Fashion & Retail Ltd. Partly Paid Fv5 0.08%
Software 13.99%
Infosys Ltd. 7.00%
Tata Consultancy Services Ltd. 3.39%
Info Edge (India) Ltd. 1.44%
Larsen & Toubro Infotech Ltd. 1.14%
HCL Technologies Ltd. 1.02%
Telecom - Services 1.84%
Bharti Airtel Ltd. 1.84%
Textile Products 1.84%
Page Industries Ltd. 1.84%
Equity Holdings Total 96.71%
Cash & Other Receivables Total 3.29%
Grand Total 100.00%
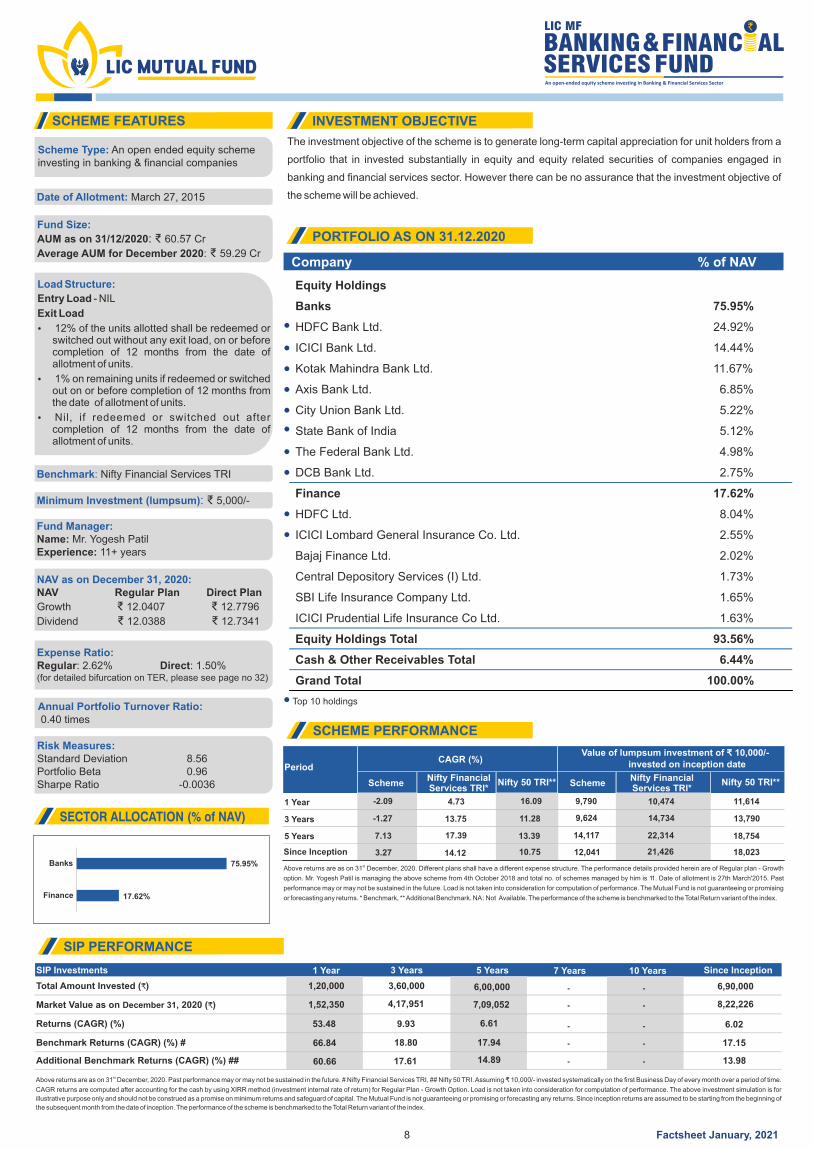
The investment objective of the scheme is to generate long-term capital appreciation for unit holders from a
portfolio that in invested substantially in equity and equity related securities of companies engaged in
banking and financial services sector. However there can be no assurance that the investment objective of
the scheme will be achieved.
SCHEME FEATURES INVESTMENT OBJECTIVE
PORTFOLIO AS ON 31.12.2020
SCHEME PERFORMANCE
Company % of NAV
SECTOR ALLOCATION (% of NAV)
SchemeNifty Financial Services TRI*
Nifty Financial Services TRI*
Nifty 50 TRI** Nifty 50 TRI**Scheme
1 Year -2.09 4.73 16.09 9,790 10,474
21,426
11,614
18,023
3 Years 9,624 14,734 13,790
5 Years 7.13
-1.27
17.39
13.75
13.39
11.28
14,117 22,314 18,754
Since Inception 3.27 14.12 10.75 12,041
PeriodCAGR (%)
Value of lumpsum investment of 10,000/-₹invested on inception date
stAbove returns are as on 31 December, 2020. Different plans shall have a different expense structure. The performance details provided herein are of Regular plan - Growth
option. Mr. Yogesh Patil is managing the above scheme from 4th October 2018 and total no. of schemes managed by him is 11. Date of allotment is 27th March'2015. Past
performance may or may not be sustained in the future. Load is not taken into consideration for computation of performance. The Mutual Fund is not guaranteeing or promising
or forecasting any returns. * Benchmark, ** Additional Benchmark. NA : Not Available. The performance of the scheme is benchmarked to the Total Return variant of the index.
Scheme Type: An open ended equity scheme investing in banking & financial companies
Date of Allotment: March 27, 2015
Fund Size:
AUM as on 31/12/2020: ₹ 60.57 Cr
: 59.29 CrAverage AUM for December 2020 ₹
Benchmark: Nifty Financial Services TRI
Minimum Investment (lumpsum): ₹ 5,000/-
Fund Manager:Name: Mr. Yogesh PatilExperience: years11+
NAV as on December 31, 2020:NAV Regular Plan Direct Plan
Growth ₹ . ₹ .12 0407 12 7796
12 12 7341Dividend ₹ .0388 ₹ .
Expense Ratio:Regular: 2.62% Direct: 1.50%(for detailed bifurcation on TER, please see page no 32)
Annual Portfolio Turnover Ratio: 0.40 times
Risk Measures:Standard Deviation 8.56Portfolio Beta 0.96Sharpe Ratio -0.0036
stAbove returns are as on 31 December, 2020. Past performance may or may not be sustained in the future. # Nifty Financial Services TRI, ## Nifty 50 TRI. Assuming ₹ 10,000/- invested systematically on the first Business Day of every month over a period of time.
CAGR returns are computed after accounting for the cash by using XIRR method (investment internal rate of return) for Regular Plan - Growth Option. Load is not taken into consideration for computation of performance. The above investment simulation is for
illustrative purpose only and should not be construed as a promise on minimum returns and safeguard of capital. The Mutual Fund is not guaranteeing or promising or forecasting any returns. Since inception returns are assumed to be starting from the beginning of
the subsequent month from the date of inception. The performance of the scheme is benchmarked to the Total Return variant of the index.
SIP Investments 1 Year 3 Years 5 Years 10 Years7 Years Since Inception
Total Amount Invested ( )₹ 1,20,000 3,60,000
1,52,350 4,17,951
53.48 9.93
66.84 18.80
60.66 17.61
6,00,000 -- 6,90,000
Market Value as on December 31, 2020 ( ) ₹ 7,09,052 -- 8,22,226
Returns (CAGR) (%) 6.61 -- 6.02
Benchmark Returns (CAGR) (%) #
Additional Benchmark Returns (CAGR) (%) ##
17.94
14.89
--
--
17.15
13.98
SIP PERFORMANCE
8
Load Structure:
Entry Load - NIL
Exit Load
Ÿ 12% of the units allotted shall be redeemed or switched out without any exit load, on or before completion of 12 months from the date of allotment of units.
Ÿ 1% on remaining units if redeemed or switched out on or before completion of 12 months from the date of allotment of units.
Ÿ Nil, if redeemed or switched out after completion of 12 months from the date of allotment of units.
Top 10 holdings
75.95%
17.62%
Banks
Finance
Factsheet January, 2021
Equity Holdings
Banks 75.95%
HDFC Bank Ltd. 24.92%
ICICI Bank Ltd. 14.44%
Kotak Mahindra Bank Ltd. 11.67%
Axis Bank Ltd. 6.85%
City Union Bank Ltd. 5.22%
State Bank of India 5.12%
The Federal Bank Ltd. 4.98%
DCB Bank Ltd. 2.75%
Finance 17.62%
HDFC Ltd. 8.04%
ICICI Lombard General Insurance Co. Ltd. 2.55%
Bajaj Finance Ltd. 2.02%
Central Depository Services (I) Ltd. 1.73%
SBI Life Insurance Company Ltd. 1.65%
ICICI Prudential Life Insurance Co Ltd. 1.63%
Equity Holdings Total 93.56%
Cash & Other Receivables Total 6.44%
Grand Total 100.00%
stAbove returns are as on 31 December, 2020. Past performance may or may not be sustained in the future. # Nifty 500 TRI, ## Nifty 50 TRI. Assuming ₹ 10,000/- invested
systematically on the first Business Day of every month over a period of time.CAGR returns are computed after accounting for the cash by using XIRR method (investment
internal rate of return) for Regular Plan - Growth Option. Load is not taken into consideration for computation of performance. The above investment simulation is for illustrative
purpose only and should not be construed as a promise on minimum returns and safeguard of capital. The Mutual Fund is not guaranteeing or promising or forecasting any
returns. NA: Not Available. The performance of the scheme is benchmarked to the Total Return variant of the index. * Scheme data & TRI value of the Index are not available for
since inception, hence performance for such period is not available.
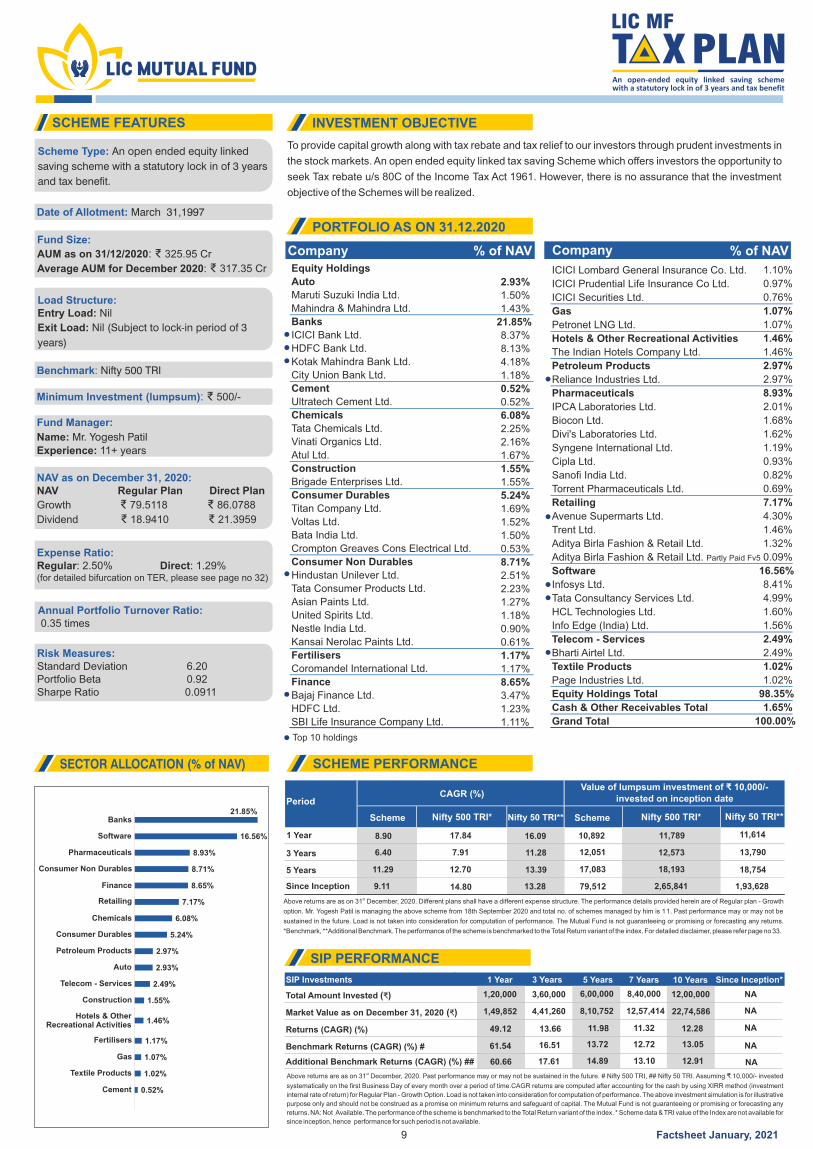
To provide capital growth along with tax rebate and tax relief to our investors through prudent investments in
the stock markets. An open ended equity linked tax saving Scheme which offers investors the opportunity to
seek Tax rebate u/s 80C of the Income Tax Act 1961. However, there is no assurance that the investment
objective of the Schemes will be realized.
SIP Investments 1 Year 3 Years 5 Years 7 Years 10 Years Since Inception*
Total Amount Invested ( )₹ 1,20,000 3,60,000 6,00,000 8,40,000 12,00,000 NA
NA
NA
NA
NA
Market Value as on December 31, 2020 ( ) ₹ 1,49,852 4,41,260 8,10,752 12,57,414 22,74,586
Returns (CAGR) (%) 49.12 13.66 11.98 11.32 12.28
Benchmark Returns (CAGR) (%) #
Additional Benchmark Returns (CAGR) (%) ##
61.54
60.66
16.51
17.61
13.72 12.72
14.89 13.10
13.05
12.91
SCHEME FEATURES INVESTMENT OBJECTIVE
PORTFOLIO AS ON 31.12.2020
SCHEME PERFORMANCE
SIP PERFORMANCE
Company % of NAV Company % of NAV
SECTOR ALLOCATION (% of NAV)
Scheme Nifty 500 TRI* Nifty 500 TRI*Nifty 50 TRI** Nifty 50 TRI**Scheme
1 Year 8.90 17.84 16.09 10,892
12,051
11,789 11,614
3 Years 6.40 7.91 11.28 12,573 13,790
5 Years 11.29 12.70 13.39 17,083 18,193 18,754
Since Inception 9.11 14.80 13.28 79,512 2,65,841 1,93,628
PeriodCAGR (%)
Value of lumpsum investment of 10,000/- ₹invested on inception date
stAbove returns are as on 31 December, 2020. Different plans shall have a different expense structure. The performance details provided herein are of Regular plan - Growth
option. Mr. Yogesh Patil is managing the above scheme from 18th September 2020 and total no. of schemes managed by him is 11. Past performance may or may not be
sustained in the future. Load is not taken into consideration for computation of performance. The Mutual Fund is not guaranteeing or promising or forecasting any returns.
*Benchmark, **Additional Benchmark. The performance of the scheme is benchmarked to the Total Return variant of the index. For detailed disclaimer, please refer page no 33.
Scheme Type: An open ended equity linked
saving scheme with a statutory lock in of 3 years
and tax benefit.
Date of Allotment: March 31,1997
Fund Size:
AUM as on 31/12/2020: ₹ 325.95 Cr
: 317.35 CrAverage AUM for December 2020 ₹
Load Structure:Entry Load: Nil
Exit Load: Nil (Subject to lock-in period of 3
years)
Benchmark: Nifty 500 TRI
Minimum Investment (lumpsum): ₹ 500/-
Fund Manager:
Name: Mr. Yogesh Patil
Experience: years11+
NAV as on December 31, 2020:NAV Regular Plan Direct Plan
Growth ₹ 79.5118 ₹ 86.0788
Dividend ₹ 18.9410 ₹ 21.3959
Expense Ratio:Regular: 2.50% Direct: 1.29%(for detailed bifurcation on TER, please see page no 32)
Annual Portfolio Turnover Ratio: 0.35 times
Risk Measures:Standard Deviation 6.20Portfolio Beta 0.92Sharpe Ratio 0.0911
9
Top 10 holdings
Factsheet January, 2021
21.85%
16.56%
8.93%
8.71%
8.65%
7.17%
6.08%
5.24%
2.97%
2.93%
2.49%
1.55%
1.46%
1.17%
1.07%
1.02%
0.52%
Banks
Software
Pharmaceuticals
Consumer Non Durables
Finance
Retailing
Chemicals
Consumer Durables
Petroleum Products
Auto
Telecom - Services
Construction
Hotels & OtherRecreational Activities
Fertilisers
Gas
Textile Products
Cement
Equity Holdings
Auto 2.93%
Maruti Suzuki India Ltd. 1.50%
Mahindra & Mahindra Ltd. 1.43%
Banks 21.85%
ICICI Bank Ltd. 8.37%
HDFC Bank Ltd. 8.13%
Kotak Mahindra Bank Ltd. 4.18%
City Union Bank Ltd. 1.18%
Cement 0.52%
Ultratech Cement Ltd. 0.52%
Chemicals 6.08%
Tata Chemicals Ltd. 2.25%
Vinati Organics Ltd. 2.16%
Atul Ltd. 1.67%
Construction 1.55%
Brigade Enterprises Ltd. 1.55%
Consumer Durables 5.24%
Titan Company Ltd. 1.69%
Voltas Ltd. 1.52%
Bata India Ltd. 1.50%
Crompton Greaves Cons Electrical Ltd. 0.53%
Consumer Non Durables 8.71%
Hindustan Unilever Ltd. 2.51%
Tata Consumer Products Ltd. 2.23%
Asian Paints Ltd. 1.27%
United Spirits Ltd. 1.18%
Nestle India Ltd. 0.90%
Kansai Nerolac Paints Ltd. 0.61%
Fertilisers 1.17%
Coromandel International Ltd. 1.17%
Finance 8.65%
Bajaj Finance Ltd. 3.47%
HDFC Ltd. 1.23%
SBI Life Insurance Company Ltd. 1.11%
ICICI Lombard General Insurance Co. Ltd. 1.10%
ICICI Prudential Life Insurance Co Ltd. 0.97%
ICICI Securities Ltd. 0.76%
Gas 1.07%
Petronet LNG Ltd. 1.07%
Hotels & Other Recreational Activities 1.46%
The Indian Hotels Company Ltd. 1.46%
Petroleum Products 2.97%
Reliance Industries Ltd. 2.97%
Pharmaceuticals 8.93%
IPCA Laboratories Ltd. 2.01%
Biocon Ltd. 1.68%
Divi's Laboratories Ltd. 1.62%
Syngene International Ltd. 1.19%
Cipla Ltd. 0.93%
Sanofi India Ltd. 0.82%
Torrent Pharmaceuticals Ltd. 0.69%
Retailing 7.17%
Avenue Supermarts Ltd. 4.30%
Trent Ltd. 1.46%
Aditya Birla Fashion & Retail Ltd. 1.32%
Aditya Birla Fashion & Retail Ltd. Partly Paid Fv5 0.09%
Software 16.56%
Infosys Ltd. 8.41%
Tata Consultancy Services Ltd. 4.99%
HCL Technologies Ltd. 1.60%
Info Edge (India) Ltd. 1.56%
Telecom - Services 2.49%
Bharti Airtel Ltd. 2.49%
Textile Products 1.02%
Page Industries Ltd. 1.02%
Equity Holdings Total 98.35%
Cash & Other Receivables Total 1.65%
Grand Total 100.00%
stAbove returns are as on 31 December, 2020. Past performance may or may not be sustained in the future. # Nifty Infrastructure TRI, ## Nifty 50 TRI. Assuming ₹ 10,000/-
invested systematically on the first Business Day of every month over a period of time.CAGR returns are computed after accounting for the cash by using XIRR method
(investment internal rate of return) for Regular Plan - Growth Option. Load is not taken into consideration for computation of performance. The above investment simulation is
for illustrative purpose only and should not be construed as a promise on minimum returns and safeguard of capital. The Mutual Fund is not guaranteeing or promising or
forecasting any returns. Since inception returns are assumed to be starting from the beginning of the subsequent month from the date of inception. The performance of the
scheme is benchmarked to the Total Return variant of the index.
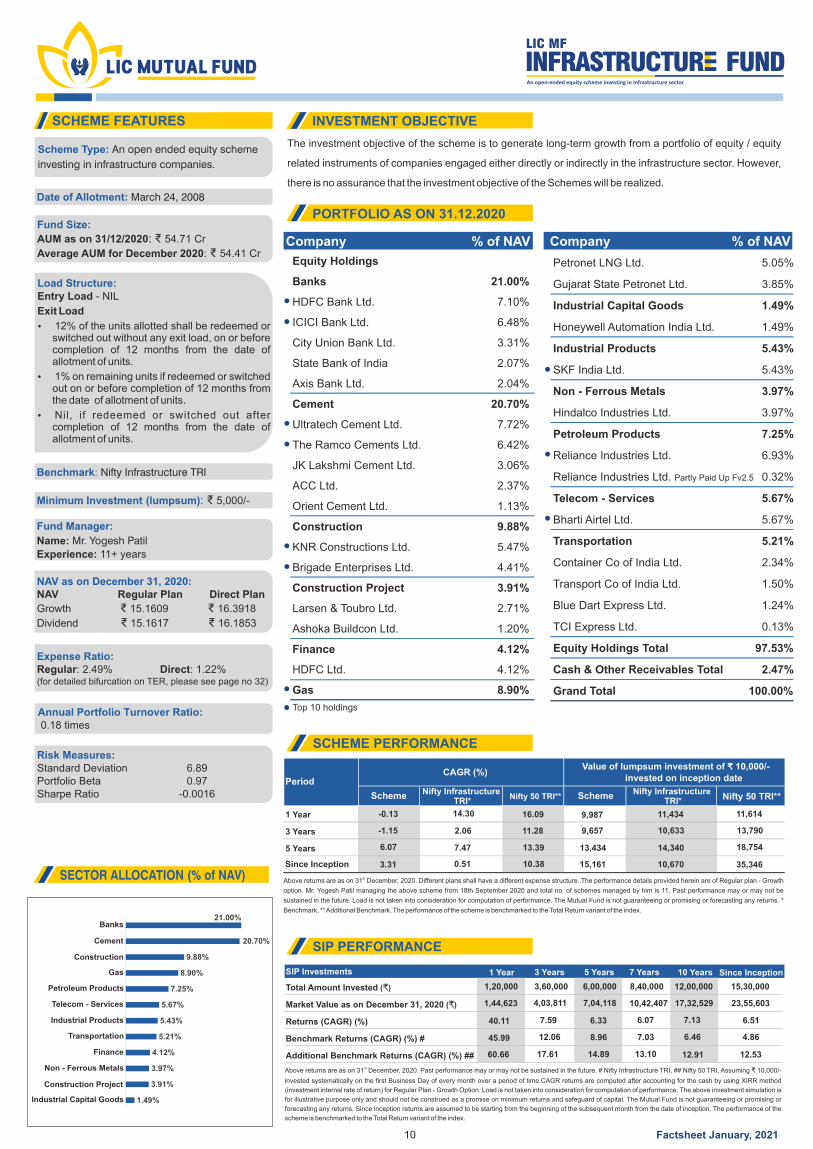
The investment objective of the scheme is to generate long-term growth from a portfolio of equity / equity
related instruments of companies engaged either directly or indirectly in the infrastructure sector. However,
there is no assurance that the investment objective of the Schemes will be realized.
SIP Investments 1 Year 3 Years 5 Years 7 Years 10 Years Since Inception
Total Amount Invested ( )₹ 1,20,000
1,44,623
40.11
45.99
60.66
3,60,000 6,00,000 8,40,000 15,30,00012,00,000
Market Value as on December 31, 2020 ( ) ₹ 4,03,811 7,04,118 10,42,407 23,55,60317,32,529
Returns (CAGR) (%) 7.59 6.33 6.07 6.517.13
Benchmark Returns (CAGR) (%) #
Additional Benchmark Returns (CAGR) (%) ##
12.06
17.61
8.96 7.03
14.89 13.10
4.866.46
12.5312.91
SCHEME FEATURES INVESTMENT OBJECTIVE
PORTFOLIO AS ON 31.12.2020
SCHEME PERFORMANCE
SIP PERFORMANCE
Company % of NAV Company % of NAV
SECTOR ALLOCATION (% of NAV)
SchemeNifty Infrastructure
TRI*Nifty Infrastructure
TRI*Nifty 50 TRI** Nifty 50 TRI**Scheme
1 Year -0.13 14.30 16.09 9,987 11,434 11,614
3 Years -1.15 2.06 11.28 9,657 10,633 13,790
5 Years 6.07 7.47 13.39 13,434 14,340 18,754
Since Inception 3.31 0.51 10.38 15,161 10,670 35,346
PeriodCAGR (%)
Value of lumpsum investment of 10,000/- ₹invested on inception date
stAbove returns are as on 31 December, 2020. Different plans shall have a different expense structure. The performance details provided herein are of Regular plan - Growth
option. Mr. Yogesh Patil managing the above scheme from 18th September 2020 and total no. of schemes managed by him is 11. Past performance may or may not be
sustained in the future. Load is not taken into consideration for computation of performance. The Mutual Fund is not guaranteeing or promising or forecasting any returns. *
Benchmark, ** Additional Benchmark. The performance of the scheme is benchmarked to the Total Return variant of the index.
Scheme Type: An open ended equity scheme
investing in infrastructure companies.
Date of Allotment: March 24, 2008
Fund Size:
AUM as on 31/12/2020: ₹ 54.71 Cr
: 54.41 CrAverage AUM for December 2020 ₹
Benchmark: Nifty Infrastructure TRI
Minimum Investment (lumpsum): ₹ 5,000/-
Fund Manager:
Name: Mr. Yogesh Patil
Experience: years11+
NAV as on December 31, 2020:NAV Regular Plan Direct Plan
Growth ₹ 15.1609 ₹ 16.3918
Dividend ₹ 15.1617 ₹ 16.1853
Expense Ratio:Regular: 2.49% Direct: 1.22%(for detailed bifurcation on TER, please see page no 32)
Annual Portfolio Turnover Ratio: 0.18 times
Risk Measures:Standard Deviation 6.89Portfolio Beta 0.97Sharpe Ratio -0.0016
10
Load Structure:Entry Load - NIL
Exit Load
Ÿ 12% of the units allotted shall be redeemed or switched out without any exit load, on or before completion of 12 months from the date of allotment of units.
Ÿ 1% on remaining units if redeemed or switched out on or before completion of 12 months from the date of allotment of units.
Ÿ Nil, if redeemed or switched out after completion of 12 months from the date of allotment of units.
Top 10 holdings
Factsheet January, 2021
21.00%
20.70%
9.88%
8.90%
7.25%
5.67%
5.43%
5.21%
4.12%
3.97%
3.91%
1.49%
Banks
Cement
Construction
Gas
Petroleum Products
Telecom - Services
Industrial Products
Transportation
Finance
Non - Ferrous Metals
Construction Project
Industrial Capital Goods
Equity Holdings
Banks 21.00%
HDFC Bank Ltd. 7.10%
ICICI Bank Ltd. 6.48%
City Union Bank Ltd. 3.31%
State Bank of India 2.07%
Axis Bank Ltd. 2.04%
Cement 20.70%
Ultratech Cement Ltd. 7.72%
The Ramco Cements Ltd. 6.42%
JK Lakshmi Cement Ltd. 3.06%
ACC Ltd. 2.37%
Orient Cement Ltd. 1.13%
Construction 9.88%
KNR Constructions Ltd. 5.47%
Brigade Enterprises Ltd. 4.41%
Construction Project 3.91%
Larsen & Toubro Ltd. 2.71%
Ashoka Buildcon Ltd. 1.20%
Finance 4.12%
HDFC Ltd. 4.12%
Gas 8.90%
Petronet LNG Ltd. 5.05%
Gujarat State Petronet Ltd. 3.85%
Industrial Capital Goods 1.49%
Honeywell Automation India Ltd. 1.49%
Industrial Products 5.43%
SKF India Ltd. 5.43%
Non - Ferrous Metals 3.97%
Hindalco Industries Ltd. 3.97%
Petroleum Products 7.25%
Reliance Industries Ltd. 6.93%
Reliance Industries Ltd. Partly Paid Up Fv2.5 0.32%
Telecom - Services 5.67%
Bharti Airtel Ltd. 5.67%
Transportation 5.21%
Container Co of India Ltd. 2.34%
Transport Co of India Ltd. 1.50%
Blue Dart Express Ltd. 1.24%
TCI Express Ltd. 0.13%
Equity Holdings Total 97.53%
Cash & Other Receivables Total 2.47%
Grand Total 100.00%
stAbove returns are as on 31 December, 2020. Past performance may or may not be sustained in the future. # S&P BSE SENSEX TRI, ## NIFTY 50 TRI. Assuming ₹ 10,000/-
invested systematically on the first Business Day of every month over a period of time.CAGR returns are computed after accounting for the cash by using XIRR method
(investment internal rate of return) for Regular Plan - Growth Option. Load is not taken into consideration for computation of performance. The above investment simulation is
for illustrative purpose only and should not be construed as a promise on minimum returns and safeguard of capital. The Mutual Fund is not guaranteeing or promising or
forecasting any returns. Since inception returns are assumed to be starting from the beginning of the subsequent month from the date of inception. The performance of the
scheme is benchmarked to the Total Return variant of the index.
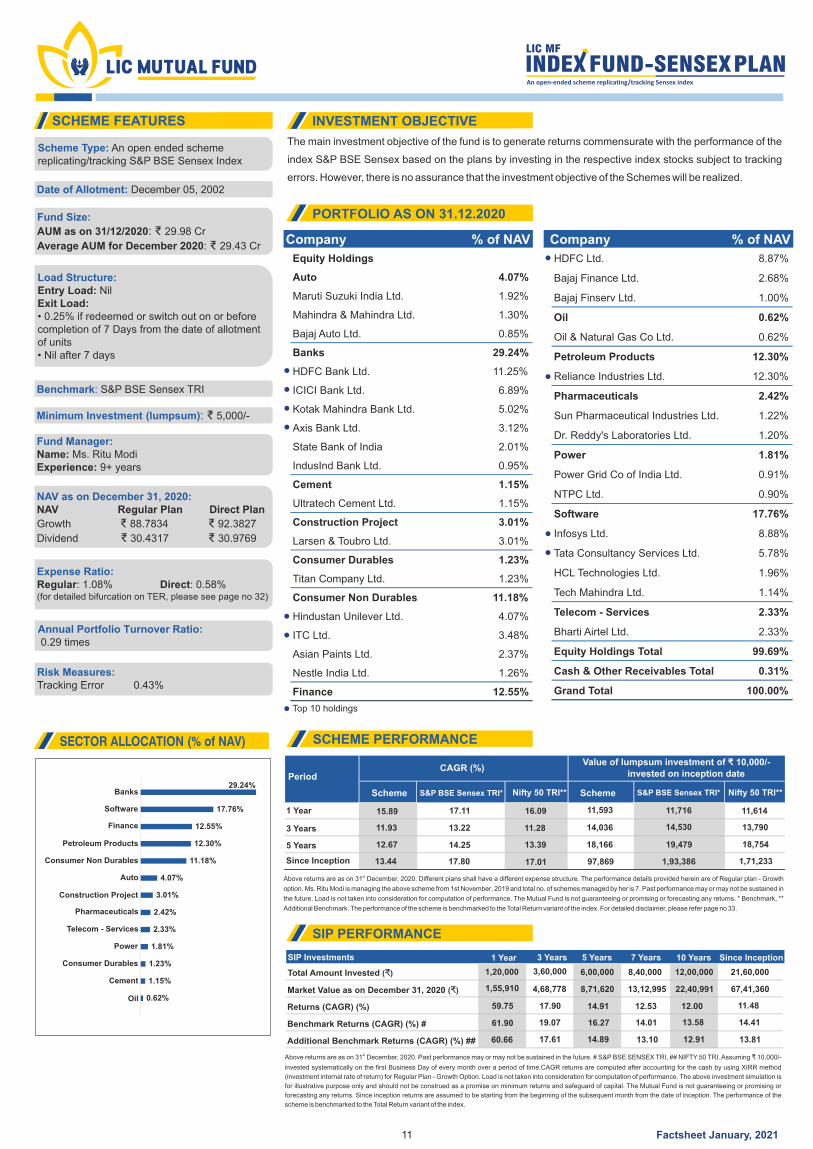
The main investment objective of the fund is to generate returns commensurate with the performance of the
index S&P BSE Sensex based on the plans by investing in the respective index stocks subject to tracking
errors. However, there is no assurance that the investment objective of the Schemes will be realized.
SIP Investments 1 Year 3 Years 5 Years 7 Years 10 Years Since Inception
Total Amount Invested ( )₹ 1,20,000 3,60,000 6,00,000 8,40,000 12,00,000 21,60,000
14.41
Market Value as on December 31, 2020 ( ) ₹ 1,55,910 4,68,778 8,71,620 13,12,995 22,40,991 67,41,360
Returns (CAGR) (%) 59.75 17.90 14.91 12.53 12.00 11.48
Benchmark Returns (CAGR) (%) #
Additional Benchmark Returns (CAGR) (%) ##
61.90
60.66
19.07
17.61
16.27 14.01
14.89 13.10
13.58
13.8112.91
SCHEME FEATURES INVESTMENT OBJECTIVE
PORTFOLIO AS ON 31.12.2020
SCHEME PERFORMANCE
SIP PERFORMANCE
Company % of NAV Company % of NAV
SECTOR ALLOCATION (% of NAV)
Scheme S&P BSE Sensex TRI* S&P BSE Sensex TRI*Nifty 50 TRI** Nifty 50 TRI**Scheme
1 Year 15.89 17.11 16.09 11,593 11,716 11,614
3 Years 11.93 13.22 11.28 14,036 14,530 13,790
5 Years
Since Inception
12.67 14.25 13.39 18,166 19,479 18,754
13.44 17.80 17.01 97,869 1,93,386 1,71,233
PeriodCAGR (%)
Value of lumpsum investment of 10,000/-₹invested on inception date
stAbove returns are as on 31 December, 2020. Different plans shall have a different expense structure. The performance details provided herein are of Regular plan - Growth
option. Ms. Ritu Modi is managing the above scheme from 1st November, 2019 and total no. of schemes managed by her is 7. Past performance may or may not be sustained in
the future. Load is not taken into consideration for computation of performance. The Mutual Fund is not guaranteeing or promising or forecasting any returns. * Benchmark, **
Additional Benchmark. The performance of the scheme is benchmarked to the Total Return variant of the index. For detailed disclaimer, please refer page no 33.
Scheme Type: An open ended scheme replicating/tracking S&P BSE Sensex Index
Date of Allotment: December 05, 2002
Fund Size:
AUM as on 31/12/2020: ₹ 29.98 Cr
: 29.43 CrAverage AUM for December 2020 ₹
Load Structure:Entry Load: NilExit Load: • 0.25% if redeemed or switch out on or before completion of 7 Days from the date of allotment of units• Nil after 7 days
Benchmark: S&P BSE Sensex TRI
Minimum Investment (lumpsum): ₹ 5,000/-
Fund Manager:Name: M . s Ritu ModiExperience: years9+
NAV as on December 31, 2020:NAV Regular Plan Direct Plan
Growth ₹ 88.7834 ₹ 92.3827
Dividend ₹ 30.4317 ₹ 30.9769
Expense Ratio:Regular: 1.08% Direct: 0.58%(for detailed bifurcation on TER, please see page no 32)
Annual Portfolio Turnover Ratio: 0.29 times
Risk Measures:Tracking Error 0.43%
11
Top 10 holdings
Factsheet January, 2021
29.24%
17.76%
12.55%
12.30%
11.18%
4.07%
3.01%
2.42%
2.33%
1.81%
1.23%
1.15%
0.62%
Banks
Software
Finance
Petroleum Products
Consumer Non Durables
Auto
Construction Project
Pharmaceuticals
Telecom - Services
Power
Consumer Durables
Cement
Oil
Equity Holdings
Auto 4.07%
Maruti Suzuki India Ltd. 1.92%
Mahindra & Mahindra Ltd. 1.30%
Bajaj Auto Ltd. 0.85%
Banks 29.24%
HDFC Bank Ltd. 11.25%
ICICI Bank Ltd. 6.89%
Kotak Mahindra Bank Ltd. 5.02%
Axis Bank Ltd. 3.12%
State Bank of India 2.01%
IndusInd Bank Ltd. 0.95%
Cement 1.15%
Ultratech Cement Ltd. 1.15%
Construction Project 3.01%
Larsen & Toubro Ltd. 3.01%
Consumer Durables 1.23%
Titan Company Ltd. 1.23%
Consumer Non Durables 11.18%
Hindustan Unilever Ltd. 4.07%
ITC Ltd. 3.48%
Asian Paints Ltd. 2.37%
Nestle India Ltd. 1.26%
Finance 12.55%
HDFC Ltd. 8.87%
Bajaj Finance Ltd. 2.68%
Bajaj Finserv Ltd. 1.00%
Oil 0.62%
Oil & Natural Gas Co Ltd. 0.62%
Petroleum Products 12.30%
Reliance Industries Ltd. 12.30%
Pharmaceuticals 2.42%
Sun Pharmaceutical Industries Ltd. 1.22%
Dr. Reddy's Laboratories Ltd. 1.20%
Power 1.81%
Power Grid Co of India Ltd. 0.91%
NTPC Ltd. 0.90%
Software 17.76%
Infosys Ltd. 8.88%
Tata Consultancy Services Ltd. 5.78%
HCL Technologies Ltd. 1.96%
Tech Mahindra Ltd. 1.14%
Telecom - Services 2.33%
Bharti Airtel Ltd. 2.33%
Equity Holdings Total 99.69%
Cash & Other Receivables Total 0.31%
Grand Total 100.00%
stAbove returns are as on 31 December, 2020. Past performance may or may not be sustained in the future. # NIFTY 50 TRI, ## S&P BSE SENSEX TRI. Assuming ₹ 10,000/-
invested systematically on the first Business Day of every month over a period of time. CAGR returns are computed after accounting for the cash by using XIRR method
(investment internal rate of return) for Regular Plan - Growth Option. Load is not taken into consideration for computation of performance. The above investment simulation is
for illustrative purpose only and should not be construed as a promise on minimum returns and safeguard of capital. The Mutual Fund is not guaranteeing or promising or
forecasting any returns. Since inception returns are assumed to be starting from the beginning of the subsequent month from the date of inception. The performance of the
scheme is benchmarked to the Total Return variant of the index.
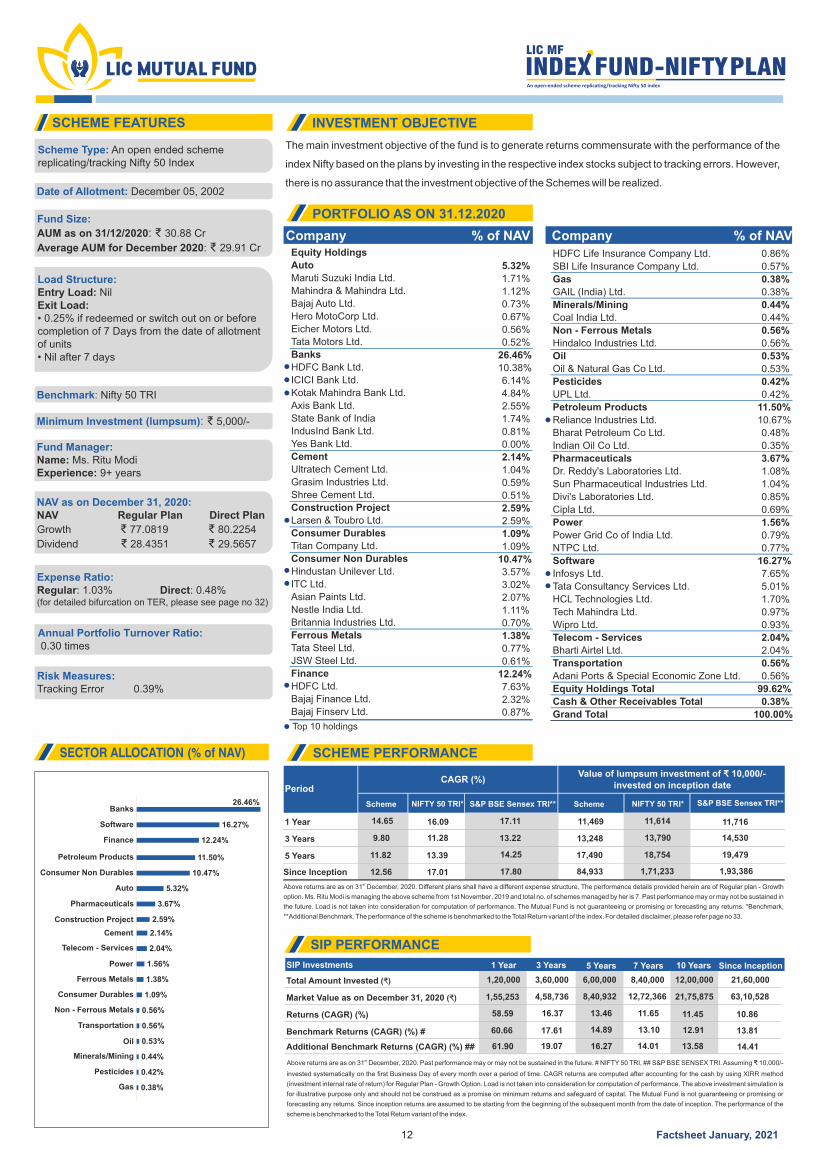
The main investment objective of the fund is to generate returns commensurate with the performance of the
index Nifty based on the plans by investing in the respective index stocks subject to tracking errors. However,
there is no assurance that the investment objective of the Schemes will be realized.
SIP Investments 1 Year 3 Years 5 Years 7 Years 10 Years Since Inception
Total Amount Invested ( )₹ 1,20,000 3,60,000 6,00,000 8,40,000 12,00,000 21,60,000
14.41
Market Value as on December 31, 2020 ( ) ₹ 1,55,253 4,58,736 8,40,932 12,72,366 21,75,875 63,10,528
Returns (CAGR) (%) 58.59 16.37 13.46 11.65 11.45 10.86
Benchmark Returns (CAGR) (%) #
Additional Benchmark Returns (CAGR) (%) ##
60.66
61.90
17.61
19.07
14.89 13.10
16.27 14.01
12.91 13.81
13.58
SCHEME FEATURES INVESTMENT OBJECTIVE
PORTFOLIO AS ON 31.12.2020
SCHEME PERFORMANCE
SIP PERFORMANCE
Company % of NAV Company % of NAV
SECTOR ALLOCATION (% of NAV)
Scheme NIFTY 50 TRI* NIFTY 50 TRI*S&P BSE Sensex TRI** S&P BSE Sensex TRI**Scheme
1 Year 14.65 16.09 17.11 11,469 11,614 11,716
3 Years 9.80 11.28 13.22 13,248 13,790 14,530
5 Years 11.82 13.39 14.25 17,490 18,754 19,479
Since Inception 12.56 17.01 17.80 84,933 1,71,233 1,93,386
PeriodCAGR (%)
Value of lumpsum investment of 10,000/- ₹invested on inception date
stAbove returns are as on 31 December, 2020. Different plans shall have a different expense structure. The performance details provided herein are of Regular plan - Growth
option. Ms. Ritu Modi is managing the above scheme from 1st November, 2019 and total no. of schemes managed by her is 7. Past performance may or may not be sustained in
the future. Load is not taken into consideration for computation of performance. The Mutual Fund is not guaranteeing or promising or forecasting any returns. *Benchmark,
**Additional Benchmark. The performance of the scheme is benchmarked to the Total Return variant of the index. For detailed disclaimer, please refer page no 33.
Scheme Type: An open ended scheme replicating/tracking Nifty 50 Index
Date of Allotment: December 05, 2002
Fund Size:
AUM as on 31/12/2020: ₹ 30.88 Cr
: 29.91 CrAverage AUM for December 2020 ₹
Load Structure:Entry Load: NilExit Load: • 0.25% if redeemed or switch out on or before completion of 7 Days from the date of allotment of units• Nil after 7 days
Benchmark: Nifty 50 TRI
Minimum Investment (lumpsum): ₹ 5,000/-
Fund Manager:Name: M . s Ritu ModiExperience: years9+
NAV as on December 31, 2020:NAV Regular Plan Direct Plan
Growth ₹ ₹ 77.0819 80.2254
28 4351 29 5657Dividend ₹ . ₹ .
Expense Ratio:Regular: 1.03% Direct: 0.48%(for detailed bifurcation on TER, please see page no 32)
Annual Portfolio Turnover Ratio: 0.30 times
Risk Measures:Tracking Error 0.39%
12
Top 10 holdings
Factsheet January, 2021
26.46%
16.27%
12.24%
11.50%
10.47%
5.32%
3.67%
2.59%
2.14%
2.04%
1.56%
1.38%
1.09%
0.56%
0.56%
0.53%
0.44%
0.42%
0.38%
Banks
Software
Finance
Petroleum Products
Consumer Non Durables
Auto
Pharmaceuticals
Construction Project
Cement
Telecom - Services
Power
Ferrous Metals
Consumer Durables
Non - Ferrous Metals
Transportation
Oil
Minerals/Mining
Pesticides
Gas
Equity Holdings
Auto 5.32%Maruti Suzuki India Ltd. 1.71%Mahindra & Mahindra Ltd. 1.12%Bajaj Auto Ltd. 0.73%Hero MotoCorp Ltd. 0.67%Eicher Motors Ltd. 0.56%Tata Motors Ltd. 0.52%Banks 26.46%HDFC Bank Ltd. 10.38%ICICI Bank Ltd. 6.14%Kotak Mahindra Bank Ltd. 4.84%Axis Bank Ltd. 2.55%State Bank of India 1.74%IndusInd Bank Ltd. 0.81%Yes Bank Ltd. 0.00%Cement 2.14%Ultratech Cement Ltd. 1.04%Grasim Industries Ltd. 0.59%Shree Cement Ltd. 0.51%Construction Project 2.59%Larsen & Toubro Ltd. 2.59%Consumer Durables 1.09%Titan Company Ltd. 1.09%Consumer Non Durables 10.47%Hindustan Unilever Ltd. 3.57%ITC Ltd. 3.02%Asian Paints Ltd. 2.07%Nestle India Ltd. 1.11%Britannia Industries Ltd. 0.70%Ferrous Metals 1.38%Tata Steel Ltd. 0.77%JSW Steel Ltd. 0.61%Finance 12.24%HDFC Ltd. 7.63%Bajaj Finance Ltd. 2.32%Bajaj Finserv Ltd. 0.87%
HDFC Life Insurance Company Ltd. 0.86%
SBI Life Insurance Company Ltd. 0.57%
Gas 0.38%
GAIL (India) Ltd. 0.38%
Minerals/Mining 0.44%
Coal India Ltd. 0.44%
Non - Ferrous Metals 0.56%
Hindalco Industries Ltd. 0.56%
Oil 0.53%
Oil & Natural Gas Co Ltd. 0.53%
Pesticides 0.42%
UPL Ltd. 0.42%
Petroleum Products 11.50%
Reliance Industries Ltd. 10.67%
Bharat Petroleum Co Ltd. 0.48%
Indian Oil Co Ltd. 0.35%
Pharmaceuticals 3.67%
Dr. Reddy's Laboratories Ltd. 1.08%
Sun Pharmaceutical Industries Ltd. 1.04%
Divi's Laboratories Ltd. 0.85%
Cipla Ltd. 0.69%
Power 1.56%
Power Grid Co of India Ltd. 0.79%
NTPC Ltd. 0.77%
Software 16.27%
Infosys Ltd. 7.65%
Tata Consultancy Services Ltd. 5.01%
HCL Technologies Ltd. 1.70%
Tech Mahindra Ltd. 0.97%
Wipro Ltd. 0.93%
Telecom - Services 2.04%
Bharti Airtel Ltd. 2.04%
Transportation 0.56%
Adani Ports & Special Economic Zone Ltd. 0.56%
Equity Holdings Total 99.62%
Cash & Other Receivables Total 0.38%
Grand Total 100.00%
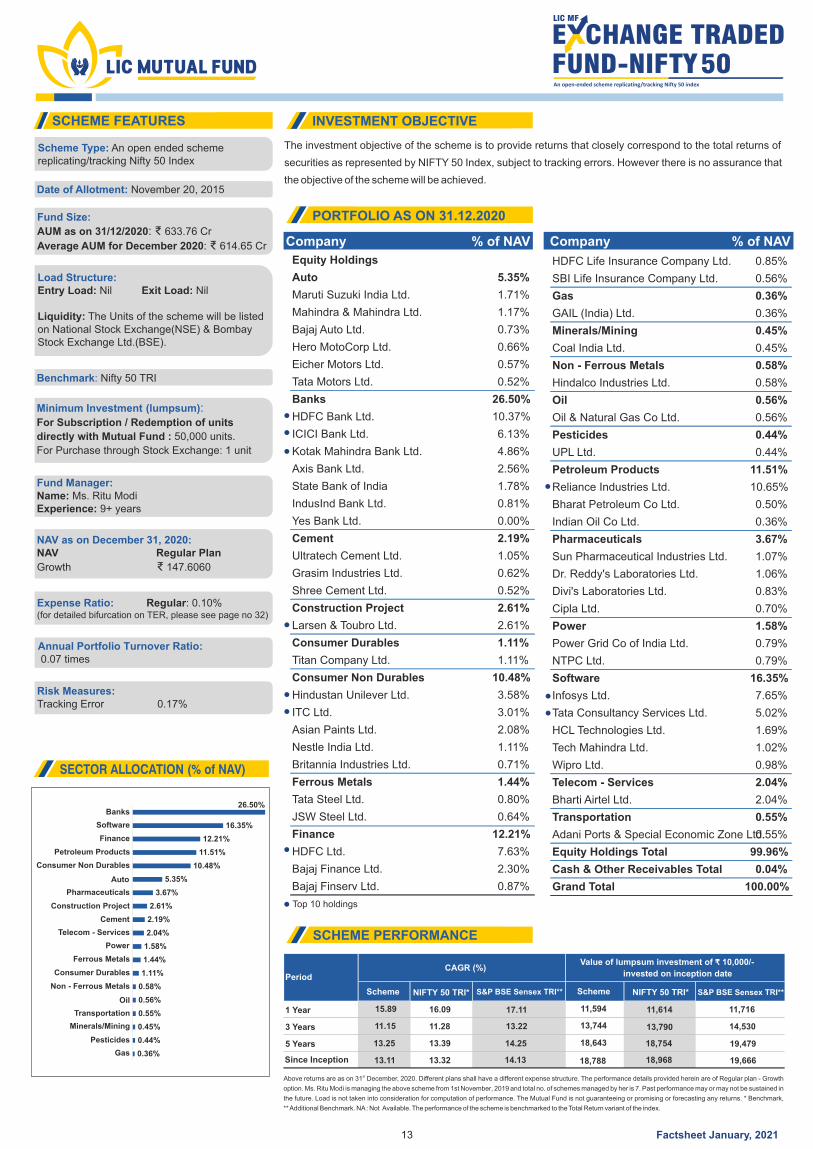
The investment objective of the scheme is to provide returns that closely correspond to the total returns of
securities as represented by NIFTY 50 Index, subject to tracking errors. However there is no assurance that
the objective of the scheme will be achieved.
SCHEME FEATURES INVESTMENT OBJECTIVE
PORTFOLIO AS ON 31.12.2020
SCHEME PERFORMANCE
Company % of NAV Company % of NAV
SECTOR ALLOCATION (% of NAV)
Scheme NIFTY 50 TRI* NIFTY 50 TRI*S&P BSE Sensex TRI** S&P BSE Sensex TRI**Scheme
1 Year 15.89
11.15
16.09
11.28
17.11
13.22
11,594
13,744
11,614
13,790
11,716
14,5303 Years
13.25 13.39 14.25 18,643 18,754 19,4795 Years
Since Inception 13.11 13.32 14.13 18,788 18,968 19,666
PeriodCAGR (%)
Value of lumpsum investment of 10,000/- ₹invested on inception date
stAbove returns are as on 31 December, 2020. Different plans shall have a different expense structure. The performance details provided herein are of Regular plan - Growth
option. Ms. Ritu Modi is managing the above scheme from 1st November, 2019 and total no. of schemes managed by her is 7. Past performance may or may not be sustained in
the future. Load is not taken into consideration for computation of performance. The Mutual Fund is not guaranteeing or promising or forecasting any returns. * Benchmark,
** Additional Benchmark. NA : Not Available. The performance of the scheme is benchmarked to the Total Return variant of the index.
Scheme Type: An open ended scheme replicating/tracking Nifty 50 Index
Date of Allotment: November 20, 2015
Fund Size:
AUM as on 31/12/2020: ₹ 633.76 Cr
: 614.65 CrAverage AUM for December 2020 ₹
Load Structure:Entry Load: Exit Load: Nil Nil
Liquidity: The Units of the scheme will be listed on National Stock Exchange(NSE) & Bombay Stock Exchange Ltd.(BSE).
Benchmark: Nifty 50 TRI
Minimum Investment (lumpsum): For Subscription / Redemption of units
directly with Mutual Fund : 50,000 units.
For Purchase through Stock Exchange: 1 unit
Fund Manager:Name: M . s Ritu ModiExperience: years9+
NAV as on December 31, 2020:NAV Regular Plan
Growth ₹ 147.6060
Expense Ratio: Regular: 0.10%(for detailed bifurcation on TER, please see page no 32)
Annual Portfolio Turnover Ratio: 0.07 times
Risk Measures:Tracking Error 0.17%
13
Top 10 holdings
Factsheet January, 2021
26.50%
16.35%
12.21%
11.51%
10.48%
5.35%
3.67%
2.61%
2.19%
2.04%
1.58%
1.44%
1.11%
0.58%
0.56%
0.55%
0.45%
0.44%
0.36%
Banks
Software
Finance
Petroleum Products
Consumer Non Durables
Auto
Pharmaceuticals
Construction Project
Cement
Telecom - Services
Power
Ferrous Metals
Consumer Durables
Non - Ferrous Metals
Oil
Transportation
Minerals/Mining
Pesticides
Gas
Equity Holdings
Auto 5.35%
Maruti Suzuki India Ltd. 1.71%
Mahindra & Mahindra Ltd. 1.17%
Bajaj Auto Ltd. 0.73%
Hero MotoCorp Ltd. 0.66%
Eicher Motors Ltd. 0.57%
Tata Motors Ltd. 0.52%
Banks 26.50%
HDFC Bank Ltd. 10.37%
ICICI Bank Ltd. 6.13%
Kotak Mahindra Bank Ltd. 4.86%
Axis Bank Ltd. 2.56%
State Bank of India 1.78%
IndusInd Bank Ltd. 0.81%
Yes Bank Ltd. 0.00%
Cement 2.19%
Ultratech Cement Ltd. 1.05%
Grasim Industries Ltd. 0.62%
Shree Cement Ltd. 0.52%
Construction Project 2.61%
Larsen & Toubro Ltd. 2.61%
Consumer Durables 1.11%
Titan Company Ltd. 1.11%
Consumer Non Durables 10.48%
Hindustan Unilever Ltd. 3.58%
ITC Ltd. 3.01%
Asian Paints Ltd. 2.08%
Nestle India Ltd. 1.11%
Britannia Industries Ltd. 0.71%
Ferrous Metals 1.44%
Tata Steel Ltd. 0.80%
JSW Steel Ltd. 0.64%
Finance 12.21%
HDFC Ltd. 7.63%
Bajaj Finance Ltd. 2.30%
Bajaj Finserv Ltd. 0.87%
HDFC Life Insurance Company Ltd. 0.85%
SBI Life Insurance Company Ltd. 0.56%
Gas 0.36%
GAIL (India) Ltd. 0.36%
Minerals/Mining 0.45%
Coal India Ltd. 0.45%
Non - Ferrous Metals 0.58%
Hindalco Industries Ltd. 0.58%
Oil 0.56%
Oil & Natural Gas Co Ltd. 0.56%
Pesticides 0.44%
UPL Ltd. 0.44%
Petroleum Products 11.51%
Reliance Industries Ltd. 10.65%
Bharat Petroleum Co Ltd. 0.50%
Indian Oil Co Ltd. 0.36%
Pharmaceuticals 3.67%
Sun Pharmaceutical Industries Ltd. 1.07%
Dr. Reddy's Laboratories Ltd. 1.06%
Divi's Laboratories Ltd. 0.83%
Cipla Ltd. 0.70%
Power 1.58%
Power Grid Co of India Ltd. 0.79%
NTPC Ltd. 0.79%
Software 16.35%
Infosys Ltd. 7.65%
Tata Consultancy Services Ltd. 5.02%
HCL Technologies Ltd. 1.69%
Tech Mahindra Ltd. 1.02%
Wipro Ltd. 0.98%
Telecom - Services 2.04%
Bharti Airtel Ltd. 2.04%
Transportation 0.55%
Adani Ports & Special Economic Zone Ltd.0.55%
Equity Holdings Total 99.96%
Cash & Other Receivables Total 0.04%
Grand Total 100.00%

The investment objective of the scheme is to provide returns that, closely correspond to the total returns of
the securities as represented by the S&P BSE SENSEX by holding S&P BSE SENSEX stocks in same
proportion, subject to tracking errors. However there is no assurance that the objective of the scheme will be
achieved.
SCHEME FEATURES INVESTMENT OBJECTIVE
PORTFOLIO AS ON 31.12.2020
SCHEME PERFORMANCE
Company % of NAV Company % of NAV
SECTOR ALLOCATION (% of NAV)
Scheme S&P BSE Sensex TRI* S&P BSE Sensex TRI*Nifty 50 TRI** Nifty 50 TRI**Scheme
1 Year 16.96 17.11 16.09 11,701
14,511
11,716
14,530
11,614
13,7903 Years 13.18 13.22 11.28
14.19 14.25 13.39 19,426 19,479 18,7545 Years
Since Inception 13.92 13.97 13.18 19,413 19,458 18,780
PeriodCAGR (%)
Value of lumpsum investment of 10,000/-₹invested on inception date
stAbove returns are as on 31 December, 2020. Different plans shall have a different expense structure. The performance details provided herein are of Regular plan - Growth
option. Ms. Ritu Modi is managing the above scheme from 1st November, 2019 and total no. of schemes managed by her is 7. Past performance may or may not be sustained in
the future. Load is not taken into consideration for computation of performance. The Mutual Fund is not guaranteeing or promising or forecasting any returns. * Benchmark,
** Additional Benchmark. NA : Not Available. The performance of the scheme is benchmarked to the Total Return variant of the index.
Scheme Type: An open ended scheme replicating/tracking Sensex Index
Date of Allotment: November 30, 2015
Fund Size:
AUM as on 31/12/2020: ₹ 513.07 Cr
: 496.85 CrAverage AUM for December 2020 ₹
Load Structure:Entry Load: Exit Load: Nil Nil
Liquidity: The Units of the scheme will be listed on National Stock Exchange(NSE) & Bombay Stock Exchange Ltd.(BSE).
Benchmark: S&P BSE Sensex TRI
Minimum Investment (lumpsum): For Subscription / Redemption of units
directly with Mutual Fund : ,000 units.2
For Purchase through Stock Exchange: 1 unit
Fund Manager:Name: M . s Ritu ModiExperience: years9+
NAV as on December 31, 2020:NAV Regular Plan
Growth ₹ 507.5588
Expense Ratio: Regular: 0.10%(for detailed bifurcation on TER, please see page no 32)
Annual Portfolio Turnover Ratio: 0.06 times
Risk Measures:Tracking Error 0.12%
14
Top 10 holdings
Factsheet January, 2021
29.36%
17.79%
12.49%
12.30%
11.29%
4.12%
3.01%
2.40%
2.37%
1.81%
1.26%
1.14%
0.62%
Banks
Software
Finance
Petroleum Products
Consumer Non Durables
Auto
Construction Project
Pharmaceuticals
Telecom - Services
Power
Consumer Durables
Cement
Oil
Equity Holdings
Auto 4.12%
Maruti Suzuki India Ltd. 1.95%
Mahindra & Mahindra Ltd. 1.32%
Bajaj Auto Ltd. 0.85%
Banks 29.36%
HDFC Bank Ltd. 11.21%
ICICI Bank Ltd. 7.09%
Kotak Mahindra Bank Ltd. 5.00%
Axis Bank Ltd. 3.12%
State Bank of India 2.00%
IndusInd Bank Ltd. 0.94%
Cement 1.14%
Ultratech Cement Ltd. 1.14%
Construction Project 3.01%
Larsen & Toubro Ltd. 3.01%
Consumer Durables 1.26%
Titan Company Ltd. 1.26%
Consumer Non Durables 11.29%
Hindustan Unilever Ltd. 4.13%
ITC Ltd. 3.48%
Asian Paints Ltd. 2.39%
Nestle India Ltd. 1.29%
Finance 12.49%
HDFC Ltd. 8.82%
Bajaj Finance Ltd. 2.66%
Bajaj Finserv Ltd. 1.01%
Oil 0.62%
Oil & Natural Gas Co Ltd. 0.62%
Petroleum Products 12.30%
Reliance Industries Ltd. 12.30%
Pharmaceuticals 2.40%
Sun Pharmaceutical Industries Ltd. 1.22%
Dr. Reddy's Laboratories Ltd. 1.18%
Power 1.81%
Power Grid Co of India Ltd. 0.92%
NTPC Ltd. 0.90%
Software 17.79%
Infosys Ltd. 8.84%
Tata Consultancy Services Ltd. 5.82%
HCL Technologies Ltd. 1.98%
Tech Mahindra Ltd. 1.15%
Telecom - Services 2.37%
Bharti Airtel Ltd. 2.37%
Equity Holdings Total 99.97%
Cash & Other Receivables Total 0.03%
Grand Total 100.00%
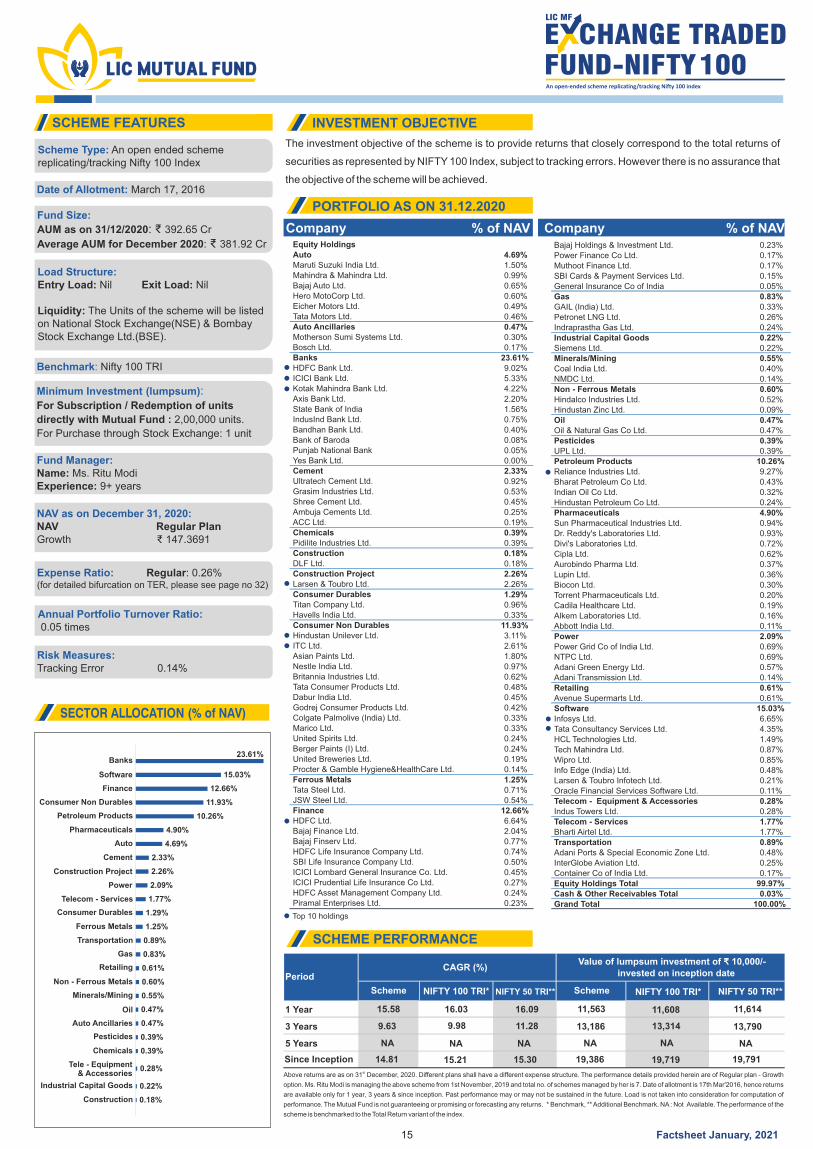
The investment objective of the scheme is to provide returns that closely correspond to the total returns of
securities as represented by NIFTY 100 Index, subject to tracking errors. However there is no assurance that
the objective of the scheme will be achieved.
SCHEME FEATURES INVESTMENT OBJECTIVE
PORTFOLIO AS ON 31.12.2020
SCHEME PERFORMANCE
Company % of NAV Company % of NAV
SECTOR ALLOCATION (% of NAV)
Scheme NIFTY 100 TRI* NIFTY 100 TRI*NIFTY 50 TRI** NIFTY 50 TRI**Scheme
1 Year 15.58
9.63
16.03
9.98
16.09
11.28
11,563
13,186
11,608
13,314
11,614
13,7903 Years
NA NA NA NA NA NA5 Years
Since Inception 14.81 15.21 15.30 19,386 19,719 19,791
PeriodCAGR (%)
Value of lumpsum investment of 10,000/- ₹invested on inception date
stAbove returns are as on 31 December, 2020. Different plans shall have a different expense structure. The performance details provided herein are of Regular plan - Growth
option. Ms. Ritu Modi is managing the above scheme from 1st November, 2019 and total no. of schemes managed by her is 7. Date of allotment is 17th Mar'2016, hence returns
are available only for 1 year, 3 years & since inception. Past performance may or may not be sustained in the future. Load is not taken into consideration for computation of
performance. The Mutual Fund is not guaranteeing or promising or forecasting any returns. * Benchmark, ** Additional Benchmark. NA : Not Available. The performance of the
scheme is benchmarked to the Total Return variant of the index.
Scheme Type: An open ended scheme replicating/tracking Nifty 100 Index
Date of Allotment: March 17, 2016
Fund Size:
AUM as on 31/12/2020: ₹ 392.65 Cr
: 381.92 CrAverage AUM for December 2020 ₹
Load Structure:Entry Load: Exit Load: Nil Nil
Liquidity: The Units of the scheme will be listed on National Stock Exchange(NSE) & Bombay Stock Exchange Ltd.(BSE).
Benchmark: Nifty 100 TRI
Minimum Investment (lumpsum): For Subscription / Redemption of units
directly with Mutual Fund : 0,000 units.2,0
For Purchase through Stock Exchange: 1 unit
Fund Manager:Name: M . s Ritu ModiExperience: years9+
NAV as on December 31, 2020:NAV Regular Plan Growth ₹ 147.3691
Expense Ratio: Regular: 0.26%(for detailed bifurcation on TER, please see page no 32)
Annual Portfolio Turnover Ratio: 0.05 times
Risk Measures:Tracking Error 0.14%
15
Top 10 holdings
Factsheet January, 2021
23.61%
15.03%
12.66%
11.93%
10.26%
4.90%
4.69%
2.33%
2.26%
2.09%
1.77%
1.29%
1.25%
0.89%
0.83%
0.61%
0.60%
0.55%
0.47%
0.47%
0.39%
0.39%
0.28%
0.22%
0.18%
Banks
Software
Finance
Consumer Non Durables
Petroleum Products
Pharmaceuticals
Auto
Cement
Construction Project
Power
Telecom - Services
Consumer Durables
Ferrous Metals
Transportation
Gas
Retailing
Non - Ferrous Metals
Minerals/Mining
Oil
Auto Ancillaries
Pesticides
Chemicals
Tele - Equipment& Accessories
Industrial Capital Goods
Construction
Equity HoldingsAuto 4.69%Maruti Suzuki India Ltd. 1.50%Mahindra & Mahindra Ltd. 0.99%Bajaj Auto Ltd. 0.65%Hero MotoCorp Ltd. 0.60%Eicher Motors Ltd. 0.49%Tata Motors Ltd. 0.46%Auto Ancillaries 0.47%Motherson Sumi Systems Ltd. 0.30%Bosch Ltd. 0.17%Banks 23.61%HDFC Bank Ltd. 9.02%ICICI Bank Ltd. 5.33%Kotak Mahindra Bank Ltd. 4.22%Axis Bank Ltd. 2.20%State Bank of India 1.56%IndusInd Bank Ltd. 0.75%Bandhan Bank Ltd. 0.40%Bank of Baroda 0.08%Punjab National Bank 0.05%Yes Bank Ltd. 0.00%Cement 2.33%Ultratech Cement Ltd. 0.92%Grasim Industries Ltd. 0.53%Shree Cement Ltd. 0.45%Ambuja Cements Ltd. 0.25%ACC Ltd. 0.19%Chemicals 0.39%Pidilite Industries Ltd. 0.39%Construction 0.18%DLF Ltd. 0.18%Construction Project 2.26%Larsen & Toubro Ltd. 2.26%Consumer Durables 1.29%Titan Company Ltd. 0.96%Havells India Ltd. 0.33%Consumer Non Durables 11.93%Hindustan Unilever Ltd. 3.11%ITC Ltd. 2.61%Asian Paints Ltd. 1.80%Nestle India Ltd. 0.97%Britannia Industries Ltd. 0.62%Tata Consumer Products Ltd. 0.48%Dabur India Ltd. 0.45%Godrej Consumer Products Ltd. 0.42%Colgate Palmolive (India) Ltd. 0.33%Marico Ltd. 0.33%United Spirits Ltd. 0.24%Berger Paints (I) Ltd. 0.24%United Breweries Ltd. 0.19%Procter & Gamble Hygiene&HealthCare Ltd. 0.14%Ferrous Metals 1.25%Tata Steel Ltd. 0.71%JSW Steel Ltd. 0.54%Finance 12.66%HDFC Ltd. 6.64%Bajaj Finance Ltd. 2.04%Bajaj Finserv Ltd. 0.77%HDFC Life Insurance Company Ltd. 0.74%SBI Life Insurance Company Ltd. 0.50%ICICI Lombard General Insurance Co. Ltd. 0.45%ICICI Prudential Life Insurance Co Ltd. 0.27%HDFC Asset Management Company Ltd. 0.24%Piramal Enterprises Ltd. 0.23%
Bajaj Holdings & Investment Ltd. 0.23%Power Finance Co Ltd. 0.17%Muthoot Finance Ltd. 0.17%SBI Cards & Payment Services Ltd. 0.15%General Insurance Co of India 0.05%Gas 0.83%GAIL (India) Ltd. 0.33%Petronet LNG Ltd. 0.26%Indraprastha Gas Ltd. 0.24%Industrial Capital Goods 0.22%Siemens Ltd. 0.22%Minerals/Mining 0.55%Coal India Ltd. 0.40%NMDC Ltd. 0.14%Non - Ferrous Metals 0.60%Hindalco Industries Ltd. 0.52%Hindustan Zinc Ltd. 0.09%Oil 0.47%Oil & Natural Gas Co Ltd. 0.47%Pesticides 0.39%UPL Ltd. 0.39%Petroleum Products 10.26%Reliance Industries Ltd. 9.27%Bharat Petroleum Co Ltd. 0.43%Indian Oil Co Ltd. 0.32%Hindustan Petroleum Co Ltd. 0.24%Pharmaceuticals 4.90%Sun Pharmaceutical Industries Ltd. 0.94%Dr. Reddy's Laboratories Ltd. 0.93%Divi's Laboratories Ltd. 0.72%Cipla Ltd. 0.62%Aurobindo Pharma Ltd. 0.37%Lupin Ltd. 0.36%Biocon Ltd. 0.30%Torrent Pharmaceuticals Ltd. 0.20%Cadila Healthcare Ltd. 0.19%Alkem Laboratories Ltd. 0.16%Abbott India Ltd. 0.11%Power 2.09%Power Grid Co of India Ltd. 0.69%NTPC Ltd. 0.69%Adani Green Energy Ltd. 0.57%Adani Transmission Ltd. 0.14%Retailing 0.61%Avenue Supermarts Ltd. 0.61%Software 15.03%Infosys Ltd. 6.65%Tata Consultancy Services Ltd. 4.35%HCL Technologies Ltd. 1.49%Tech Mahindra Ltd. 0.87%Wipro Ltd. 0.85%Info Edge (India) Ltd. 0.48%Larsen & Toubro Infotech Ltd. 0.21%Oracle Financial Services Software Ltd. 0.11%Telecom - Equipment & Accessories 0.28%Indus Towers Ltd. 0.28%Telecom - Services 1.77%Bharti Airtel Ltd. 1.77%Transportation 0.89%Adani Ports & Special Economic Zone Ltd. 0.48%InterGlobe Aviation Ltd. 0.25%Container Co of India Ltd. 0.17%Equity Holdings Total 99.97%Cash & Other Receivables Total 0.03%Grand Total 100.00%
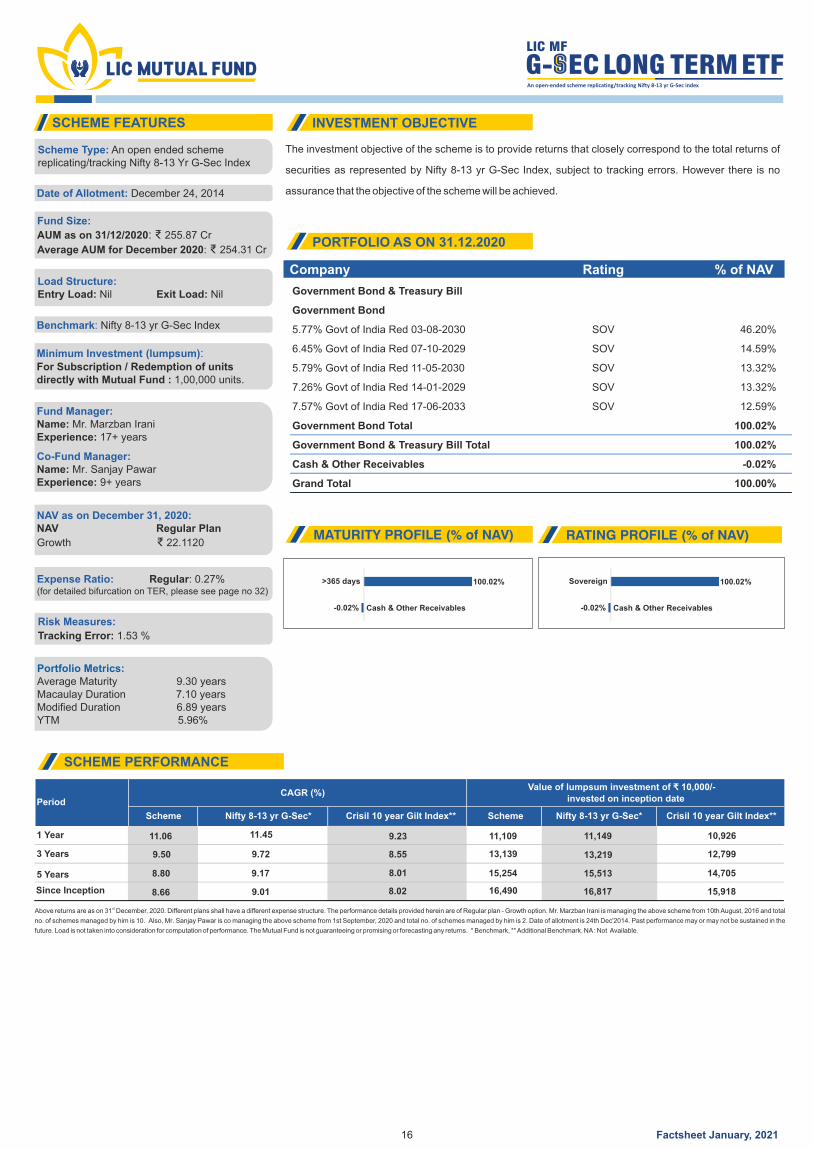
The investment objective of the scheme is to provide returns that closely correspond to the total returns of
securities as represented by Nifty 8-13 yr G-Sec Index, subject to tracking errors. However there is no
assurance that the objective of the scheme will be achieved.
Company Rating % of NAV
100.02%
-0.02%
>365 days
Cash & Other Receivables
SCHEME FEATURES INVESTMENT OBJECTIVE
PORTFOLIO AS ON 31.12.2020
SCHEME PERFORMANCE
MATURITY PROFILE (% of NAV) RATING PROFILE (% of NAV)
Scheme Nifty 8-13 yr G-Sec* Crisil 10 year Gilt Index** Crisil 10 year Gilt Index**Scheme Nifty 8-13 yr G-Sec*
1 Year 11.06 11.45 9.23 11,109 11,149 10,926
3 Years 9.50 9.72 8.55 13,139 13,219 12,799
8.80 9.17 8.01 15,254 15,513 14,7055 Years
Since Inception 8.66 9.01 8.02 16,490 16,817 15,918
PeriodCAGR (%)
Value of lumpsum investment of 10,000/- ₹invested on inception date
stAbove returns are as on 31 December, 2020. Different plans shall have a different expense structure. The performance details provided herein are of Regular plan - Growth option. Mr. Marzban Irani is managing the above scheme from 10th August, 2016 and total
no. of schemes managed by him is 10. Also, Mr. Sanjay Pawar is co managing the above scheme from 1st September, 2020 and total no. of schemes managed by him is 2. Date of allotment is 24th Dec'2014. Past performance may or may not be sustained in the
future. Load is not taken into consideration for computation of performance. The Mutual Fund is not guaranteeing or promising or forecasting any returns. * Benchmark, ** Additional Benchmark. NA : Not Available.
Scheme Type: An open ended scheme replicating/tracking Nifty 8-13 Yr G-Sec Index
Date of Allotment: December 24, 2014
Fund Size:
AUM as on 31/12/2020: ₹ 255.87 Cr
: 254.31 CrAverage AUM for December 2020 ₹
Load Structure:Entry Load: Exit Load: Nil Nil
Benchmark: Nifty 8-13 yr G-Sec Index
Minimum Investment (lumpsum):For Subscription / Redemption of units directly with Mutual Fund : 1,00,000 units.
Fund Manager:Name: Mr. Marzban IraniExperience: years17+
NAV as on December 31, 2020:NAV Regular Plan
Growth ₹ . 22 1120
Expense Ratio: Regular: 0.27%(for detailed bifurcation on TER, please see page no 32)
Risk Measures:
Tracking Error: 1.53 %
Portfolio Metrics:Average Maturity 9.30 yearsMacaulay Duration 7.10 yearsModified Duration 6.89 yearsYTM 5.96%
16
Co-Fund Manager:Name: Mr. Sanjay PawarExperience: 9+ years
100.02%
-0.02%
Sovereign
Cash & Other Receivables
Factsheet January, 2021
Government Bond & Treasury Bill
Government Bond
5.77% Govt of India Red 03-08-2030 SOV 46.20%
6.45% Govt of India Red 07-10-2029 SOV 14.59%
5.79% Govt of India Red 11-05-2030 SOV 13.32%
7.26% Govt of India Red 14-01-2029 SOV 13.32%
7.57% Govt of India Red 17-06-2033 SOV 12.59%
Government Bond Total 100.02%
Government Bond & Treasury Bill Total 100.02%
Cash & Other Receivables -0.02%
Grand Total 100.00%
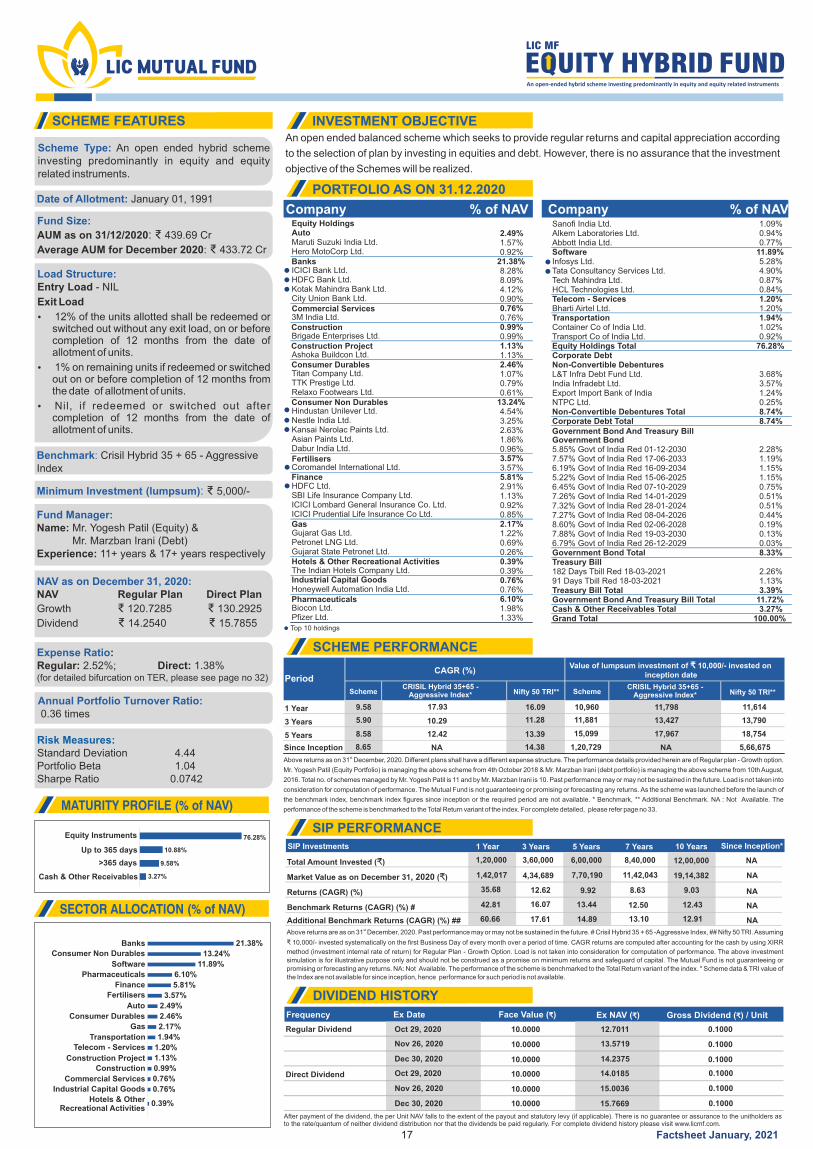
An open ended balanced scheme which seeks to provide regular returns and capital appreciation according
to the selection of plan by investing in equities and debt. However, there is no assurance that the investment
objective of the Schemes will be realized.
stAbove returns are as on 31 December, 2020. Past performance may or may not be sustained in the future. # Crisil Hybrid 35 + 65 -Aggressive Index, ## Nifty 50 TRI. Assuming
₹ 10,000/- invested systematically on the first Business Day of every month over a period of time. CAGR returns are computed after accounting for the cash by using XIRR
method (investment internal rate of return) for Regular Plan - Growth Option. Load is not taken into consideration for computation of performance. The above investment
simulation is for illustrative purpose only and should not be construed as a promise on minimum returns and safeguard of capital. The Mutual Fund is not guaranteeing or
promising or forecasting any returns. NA: Not Available. The performance of the scheme is benchmarked to the Total Return variant of the index. * Scheme data & TRI value of
the Index are not available for since inception, hence performance for such period is not available.
Frequency Ex Date Face Value ( )₹ Ex NAV ( )₹ Gross Dividend ( ) / Unit₹
Regular Dividend
Dec 30, 2020
Dec 30, 2020
10.0000
10.0000
10.0000
14.2375 0.1000
Direct Dividend
10.0000
10.0000
10.0000
15.7669 0.1000
10.88%
3.27%
9.58%
76.28%
Cash & Other Receivables
Up to 365 days
Equity Instruments
>365 days
SIP Investments 1 Year 3 Years 5 Years 7 Years 10 Years Since Inception*
Total Amount Invested ( )₹ 1,20,000 3,60,000 6,00,000 8,40,000 12,00,000 NA
NA
NA
NA
NA
Market Value as on December 31, 2020 ( ) ₹ 1,42,017 4,34,689 7,70,190 11,42,043 19,14,382
Returns (CAGR) (%) 35.68 12.62 9.92 8.63 9.03
Benchmark Returns (CAGR) (%) #
Additional Benchmark Returns (CAGR) (%) ##
42.81
60.66
16.07
17.61
13.44 12.50
14.89 13.10
12.43
12.91
SCHEME FEATURES INVESTMENT OBJECTIVE
PORTFOLIO AS ON 31.12.2020
SCHEME PERFORMANCE
SIP PERFORMANCE
MATURITY PROFILE (% of NAV)
DIVIDEND HISTORY
Company % of NAV Company % of NAV
SECTOR ALLOCATION (% of NAV)
SchemeCRISIL Hybrid 35+65 -
Aggressive Index*CRISIL Hybrid 35+65 -
Aggressive Index*SchemeNifty 50 TRI** Nifty 50 TRI**
1 Year 9.58 17.93 16.09 10,960 11,798 11,614
3 Years 5.90 10.29 11.28 11,881 13,427 13,790
5 Years 8.58 12.42 13.39 15,099 17,967 18,754
Since Inception 8.65 NA 14.38 1,20,729 NA 5,66,675
PeriodCAGR (%)
Value of lumpsum investment of 10,000/- invested on ₹inception date
stAbove returns as on 31 December, 2020. Different plans shall have a different expense structure. The performance details provided herein are of Regular plan - Growth option.
Mr. Yogesh Patil (Equity Portfolio) is managing the above scheme from 4th October 2018 & Mr. Marzban Irani (debt portfolio) is managing the above scheme from 10th August,
2016. Total no. of schemes managed by Mr. Yogesh Patil is 11 and by Mr. Marzban Irani is 10. Past performance may or may not be sustained in the future. Load is not taken into
consideration for computation of performance. The Mutual Fund is not guaranteeing or promising or forecasting any returns. As the scheme was launched before the launch of
the benchmark index, benchmark index figures since inception or the required period are not available. * Benchmark, ** Additional Benchmark. NA : Not Available. The
performance of the scheme is benchmarked to the Total Return variant of the index. For complete detailed, please refer page no 33.
After payment of the dividend, the per Unit NAV falls to the extent of the payout and statutory levy (if applicable). There is no guarantee or assurance to the unitholders as to the rate/quantum of neither dividend distribution nor that the dividends be paid regularly. For complete dividend history please visit www.licmf.com.
Scheme Type: An open ended hybrid scheme investing predominantly in equity and equity related instruments.
Date of Allotment: January 01, 1991
Fund Size:
AUM as on 31/12/2020: ₹ 439.69 Cr
: 433.72 CrAverage AUM for December 2020 ₹
Benchmark: Crisil Hybrid 35 + 65 - Aggressive Index
Minimum Investment (lumpsum): ₹ 5,000/-
Fund Manager:Name: Mr. (Equity) &Yogesh Patil Mr. Marzban Irani (Debt)Experience: years & 1 years respectively11+ 7+
NAV as on December 31, 2020:NAV Regular Plan Direct Plan
Growth ₹ 120.7285 ₹ 130.2925
Dividend ₹ 14.2540 ₹ 15.7855
Expense Ratio: Regular: 2.52%; Direct: 1.38%
(for detailed bifurcation on TER, please see page no 32)
Annual Portfolio Turnover Ratio: 0.36 times
Risk Measures:Standard Deviation 4.44Portfolio Beta 1.04 Sharpe Ratio 0.0742
17
Load Structure:Entry Load - NIL
Exit Load
Ÿ 12% of the units allotted shall be redeemed or switched out without any exit load, on or before completion of 12 months from the date of allotment of units.
Ÿ 1% on remaining units if redeemed or switched out on or before completion of 12 months from the date of allotment of units.
Ÿ Nil, if redeemed or switched out after completion of 12 months from the date of allotment of units.
Top 10 holdings
0.1000
0.1000
0.1000
0.1000
Oct 29, 2020 12.7011
Oct 29, 2020 14.0185
Factsheet January, 2021
Nov 26, 2020 15.0036
Nov 26, 2020 13.5719
21.38%
13.24%
11.89%
6.10%
5.81%
3.57%
2.49%
2.46%
2.17%
1.94%
1.20%
1.13%
0.99%
0.76%
0.76%
0.39%
Banks
Consumer Non Durables
Software
Pharmaceuticals
Finance
Fertilisers
Auto
Consumer Durables
Gas
Transportation
Telecom - Services
Construction Project
Construction
Commercial Services
Industrial Capital Goods
Hotels & OtherRecreational Activities
Equity HoldingsAuto 2.49%Maruti Suzuki India Ltd. 1.57%Hero MotoCorp Ltd. 0.92%Banks 21.38%ICICI Bank Ltd. 8.28%HDFC Bank Ltd. 8.09%Kotak Mahindra Bank Ltd. 4.12%City Union Bank Ltd. 0.90%Commercial Services 0.76%3M India Ltd. 0.76%Construction 0.99%Brigade Enterprises Ltd. 0.99%Construction Project 1.13%Ashoka Buildcon Ltd. 1.13%Consumer Durables 2.46%Titan Company Ltd. 1.07%TTK Prestige Ltd. 0.79%Relaxo Footwears Ltd. 0.61%Consumer Non Durables 13.24%Hindustan Unilever Ltd. 4.54%Nestle India Ltd. 3.25%Kansai Nerolac Paints Ltd. 2.63%Asian Paints Ltd. 1.86%Dabur India Ltd. 0.96%Fertilisers 3.57%Coromandel International Ltd. 3.57%Finance 5.81%HDFC Ltd. 2.91%SBI Life Insurance Company Ltd. 1.13%ICICI Lombard General Insurance Co. Ltd. 0.92%ICICI Prudential Life Insurance Co Ltd. 0.85%Gas 2.17%Gujarat Gas Ltd. 1.22%Petronet LNG Ltd. 0.69%Gujarat State Petronet Ltd. 0.26%Hotels & Other Recreational Activities 0.39%The Indian Hotels Company Ltd. 0.39%Industrial Capital Goods 0.76%Honeywell Automation India Ltd. 0.76%Pharmaceuticals 6.10%Biocon Ltd. 1.98%Pfizer Ltd. 1.33%
Sanofi India Ltd. 1.09%Alkem Laboratories Ltd. 0.94%Abbott India Ltd. 0.77%Software 11.89%Infosys Ltd. 5.28%Tata Consultancy Services Ltd. 4.90%Tech Mahindra Ltd. 0.87%HCL Technologies Ltd. 0.84%Telecom - Services 1.20%Bharti Airtel Ltd. 1.20%Transportation 1.94%Container Co of India Ltd. 1.02%Transport Co of India Ltd. 0.92%Equity Holdings Total 76.28%Corporate DebtNon-Convertible DebenturesL&T Infra Debt Fund Ltd. 3.68%India Infradebt Ltd. 3.57%Export Import Bank of India 1.24%NTPC Ltd. 0.25%Non-Convertible Debentures Total 8.74%Corporate Debt Total 8.74%Government Bond And Treasury BillGovernment Bond5.85% Govt of India Red 01-12-2030 2.28%7.57% Govt of India Red 17-06-2033 1.19%6.19% Govt of India Red 16-09-2034 1.15%5.22% Govt of India Red 15-06-2025 1.15%6.45% Govt of India Red 07-10-2029 0.75%7.26% Govt of India Red 14-01-2029 0.51%7.32% Govt of India Red 28-01-2024 0.51%7.27% Govt of India Red 08-04-2026 0.44%8.60% Govt of India Red 02-06-2028 0.19%7.88% Govt of India Red 19-03-2030 0.13%6.79% Govt of India Red 26-12-2029 0.03%Government Bond Total 8.33%Treasury Bill182 Days Tbill Red 18-03-2021 2.26%91 Days Tbill Red 18-03-2021 1.13%Treasury Bill Total 3.39%Government Bond And Treasury Bill Total 11.72%Cash & Other Receivables Total 3.27%Grand Total 100.00%
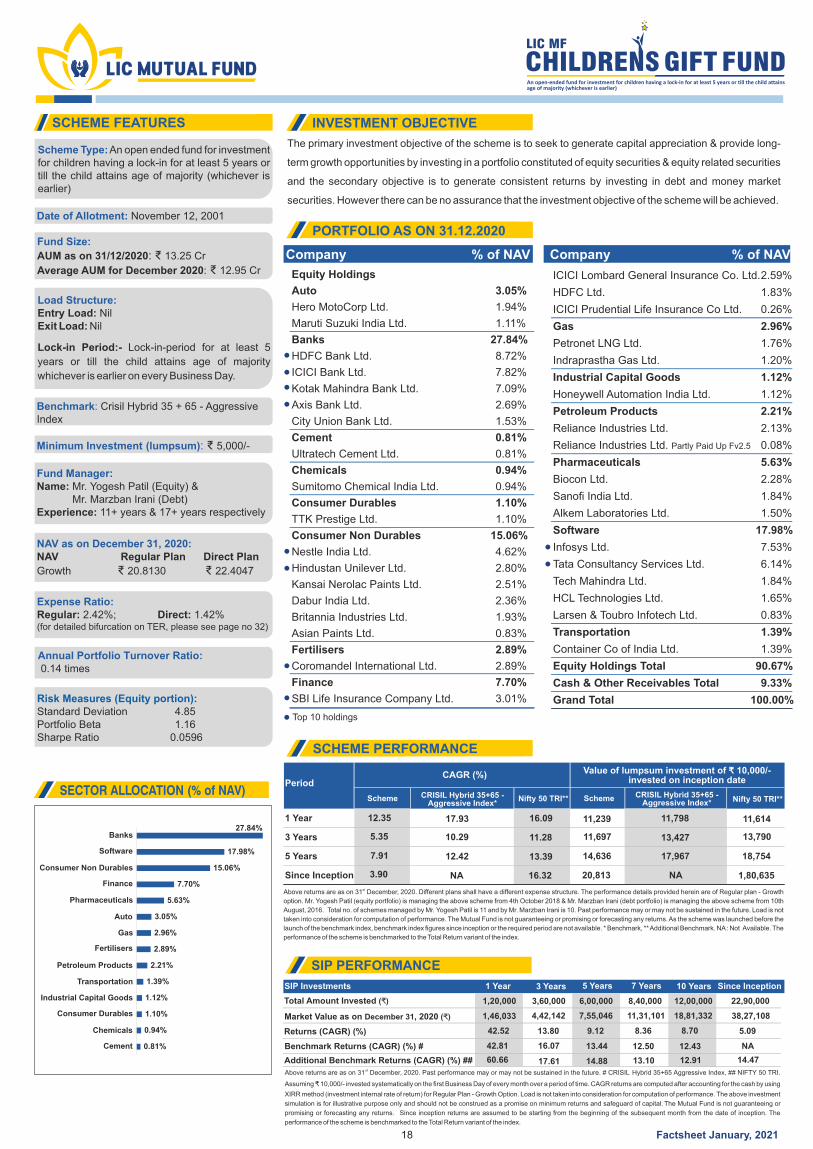
The primary investment objective of the scheme is to seek to generate capital appreciation & provide long-
term growth opportunities by investing in a portfolio constituted of equity securities & equity related securities
and the secondary objective is to generate consistent returns by investing in debt and money market
securities. However there can be no assurance that the investment objective of the scheme will be achieved.
SCHEME FEATURES INVESTMENT OBJECTIVE
PORTFOLIO AS ON 31.12.2020
SCHEME PERFORMANCE
SECTOR ALLOCATION (% of NAV)Scheme CRISIL Hybrid 35+65 -
Aggressive Index*CRISIL Hybrid 35+65 -
Aggressive Index*SchemeNifty 50 TRI** Nifty 50 TRI**
1 Year 12.35 17.93 16.09 11,239 11,798 11,614
3 Years 5.35 10.29 11.28 11,697 13,427 13,790
5 Years 7.91 12.42 13.39 14,636 17,967 18,754
Since Inception 3.90 NA 16.32 20,813 NA 1,80,635
PeriodCAGR (%) Value of lumpsum investment of 10,000/- ₹
invested on inception date
stAbove returns are as on 31 December, 2020. Different plans shall have a different expense structure. The performance details provided herein are of Regular plan - Growth
option. Mr. Yogesh Patil (equity portfolio) is managing the above scheme from 4th October 2018 & Mr. Marzban Irani (debt portfolio) is managing the above scheme from 10th
August, 2016. Total no. of schemes managed by Mr. Yogesh Patil is 11 and by Mr. Marzban Irani is 10. Past performance may or may not be sustained in the future. Load is not
taken into consideration for computation of performance. The Mutual Fund is not guaranteeing or promising or forecasting any returns. As the scheme was launched before the
launch of the benchmark index, benchmark index figures since inception or the required period are not available. * Benchmark, ** Additional Benchmark. NA : Not Available. The
performance of the scheme is benchmarked to the Total Return variant of the index.
Scheme Type: An open ended fund for investment for children having a lock-in for at least 5 years or till the child attains age of majority (whichever is earlier)
Date of Allotment: November 12, 2001
Fund Size:
AUM as on 31/12/2020: ₹ 13.25 Cr
: 12.95 CrAverage AUM for December 2020 ₹
Load Structure:Entry Load: NilExit Load: Nil
Lock-in Period:- Lock-in-period for at least 5
years or till the child attains age of majority
whichever is earlier on every Business Day.
Benchmark: Crisil Hybrid 35 + 65 - Aggressive Index
Minimum Investment (lumpsum): ₹ 5,000/-
Fund Manager:Name: Mr. (Equity) &Yogesh Patil Mr. Marzban Irani (Debt)Experience: years & 1 years respectively11+ 7+
NAV as on December 31, 2020:NAV Regular Plan Direct Plan
Growth ₹ 20.8130 ₹ 22.4047
Expense Ratio: Regular: 2.42%; Direct: 1.42%
(for detailed bifurcation on TER, please see page no 32)
Annual Portfolio Turnover Ratio: 0.14 times
Risk Measures (Equity portion):Standard Deviation 4.85
1.16Portfolio Beta Sharpe Ratio 0. 0596
Company % of NAV Company % of NAV
18
stAbove returns are as on 31 December, 2020. Past performance may or may not be sustained in the future. # CRISIL Hybrid 35+65 Aggressive Index, ## NIFTY 50 TRI.
Assuming ₹ 10,000/- invested systematically on the first Business Day of every month over a period of time. CAGR returns are computed after accounting for the cash by using
XIRR method (investment internal rate of return) for Regular Plan - Growth Option. Load is not taken into consideration for computation of performance. The above investment
simulation is for illustrative purpose only and should not be construed as a promise on minimum returns and safeguard of capital. The Mutual Fund is not guaranteeing or
promising or forecasting any returns. Since inception returns are assumed to be starting from the beginning of the subsequent month from the date of inception. The
performance of the scheme is benchmarked to the Total Return variant of the index.
SIP Investments 1 Year 3 Years 5 Years 7 Years 10 Years Since Inception
Total Amount Invested ( )₹ 1,20,000 3,60,000 6,00,000 8,40,000 12,00,000 22,90,000
Market Value as on December 31, 2020 ( ) ₹ 1,46,033 4,42,142 7,55,046 11,31,101 18,81,332 38,27,108
Returns (CAGR) (%) 42.52 13.80 9.12 8.36 8.70 5.09
Benchmark Returns (CAGR) (%) #
Additional Benchmark Returns (CAGR) (%) ##
42.81 16.07 13.44 12.50 12.43
60.66 17.61 14.88 13.10 12.91
NA
14.47
SIP PERFORMANCE
Top 10 holdings
Factsheet January, 2021
27.84%
17.98%
15.06%
7.70%
5.63%
3.05%
2.96%
2.89%
2.21%
1.39%
1.12%
1.10%
0.94%
0.81%
Banks
Software
Consumer Non Durables
Finance
Pharmaceuticals
Auto
Gas
Fertilisers
Petroleum Products
Transportation
Industrial Capital Goods
Consumer Durables
Chemicals
Cement
Equity Holdings
Auto 3.05%
Hero MotoCorp Ltd. 1.94%
Maruti Suzuki India Ltd. 1.11%
Banks 27.84%
HDFC Bank Ltd. 8.72%
ICICI Bank Ltd. 7.82%
Kotak Mahindra Bank Ltd. 7.09%
Axis Bank Ltd. 2.69%
City Union Bank Ltd. 1.53%
Cement 0.81%
Ultratech Cement Ltd. 0.81%
Chemicals 0.94%
Sumitomo Chemical India Ltd. 0.94%
Consumer Durables 1.10%
TTK Prestige Ltd. 1.10%
Consumer Non Durables 15.06%
Nestle India Ltd. 4.62%
Hindustan Unilever Ltd. 2.80%
Kansai Nerolac Paints Ltd. 2.51%
Dabur India Ltd. 2.36%
Britannia Industries Ltd. 1.93%
Asian Paints Ltd. 0.83%
Fertilisers 2.89%
Coromandel International Ltd. 2.89%
Finance 7.70%
SBI Life Insurance Company Ltd. 3.01%
ICICI Lombard General Insurance Co. Ltd.2.59%
HDFC Ltd. 1.83%
ICICI Prudential Life Insurance Co Ltd. 0.26%
Gas 2.96%
Petronet LNG Ltd. 1.76%
Indraprastha Gas Ltd. 1.20%
Industrial Capital Goods 1.12%
Honeywell Automation India Ltd. 1.12%
Petroleum Products 2.21%
Reliance Industries Ltd. 2.13%
Reliance Industries Ltd. Partly Paid Up Fv2.5 0.08%
Pharmaceuticals 5.63%
Biocon Ltd. 2.28%
Sanofi India Ltd. 1.84%
Alkem Laboratories Ltd. 1.50%
Software 17.98%
Infosys Ltd. 7.53%
Tata Consultancy Services Ltd. 6.14%
Tech Mahindra Ltd. 1.84%
HCL Technologies Ltd. 1.65%
Larsen & Toubro Infotech Ltd. 0.83%
Transportation 1.39%
Container Co of India Ltd. 1.39%
Equity Holdings Total 90.67%
Cash & Other Receivables Total 9.33%
Grand Total 100.00%
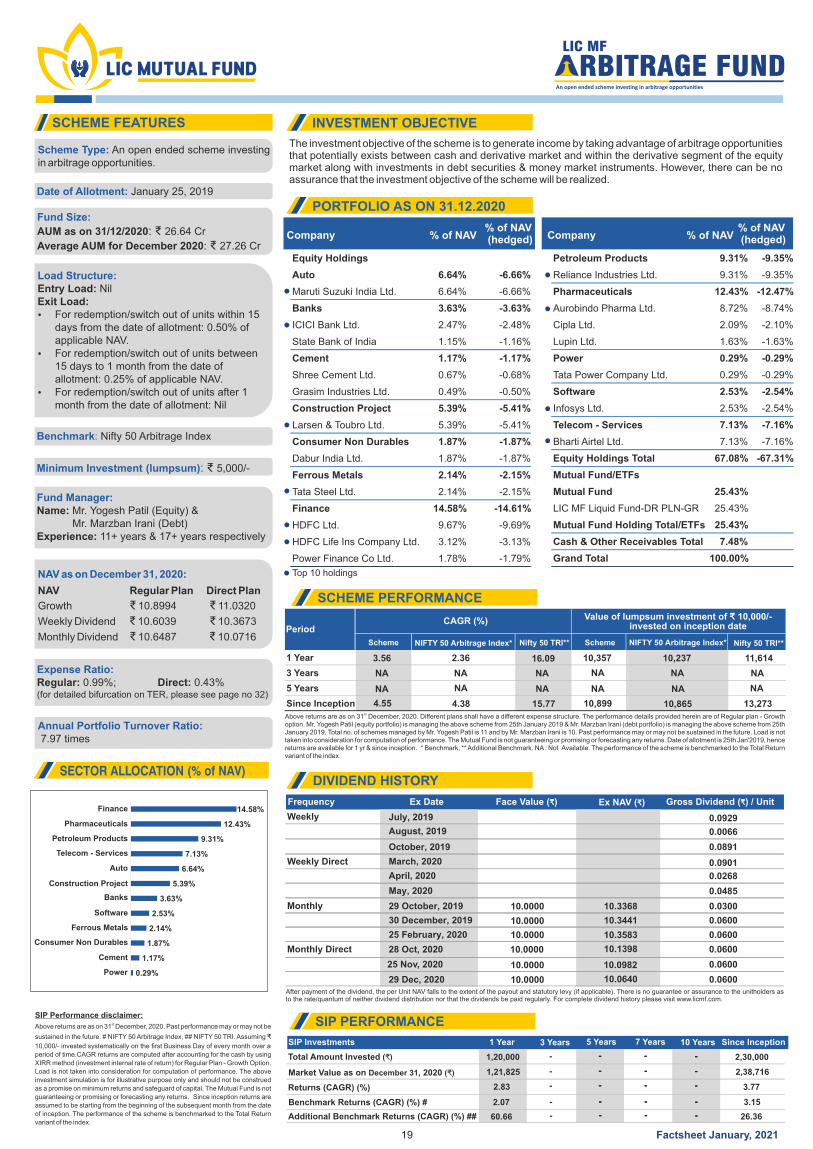
The investment objective of the scheme is to generate income by taking advantage of arbitrage opportunities that potentially exists between cash and derivative market and within the derivative segment of the equity market along with investments in debt securities & money market instruments. However, there can be no assurance that the investment objective of the scheme will be realized.
SCHEME FEATURES INVESTMENT OBJECTIVE
PORTFOLIO AS ON 31.12.2020
SECTOR ALLOCATION (% of NAV)
Scheme Type: An open ended scheme investing in arbitrage opportunities.
Date of Allotment: January 25, 2019
Fund Size:
AUM as on 31/12/2020: ₹ 26.64 Cr
: 27.26 CrAverage AUM for December 2020 ₹
Load Structure:Entry Load: NilExit Load: Ÿ For redemption/switch out of units within 15
days from the date of allotment: 0.50% of applicable NAV.
Ÿ For redemption/switch out of units between 15 days to 1 month from the date of allotment: 0.25% of applicable NAV.
Ÿ For redemption/switch out of units after 1 month from the date of allotment: Nil
Benchmark: Nifty 50 Arbitrage Index
Minimum Investment (lumpsum): ₹ 5,000/-
Fund Manager:Name: Mr. (Equity) &Yogesh Patil Mr. Marzban Irani (Debt)Experience: years & 1 years respectively11+ 7+
Expense Ratio: Regular: 0.99%; Direct: 0.43%
(for detailed bifurcation on TER, please see page no 32)
Annual Portfolio Turnover Ratio: 7.97 times
19
LIC MF
An open ended scheme investing in arbitrage opportunities
RBITRAGE FUND
NAV as on :December 31, 2020
NAV Regular Plan Direct Plan
Growth ₹ 10.8994 ₹ 11.0320
Weekly Dividend ₹ 10.6039 ₹ 10.3673
Monthly Dividend ₹ 10.6487 ₹ 10.0716
Company Company% of NAV % of NAV% of NAV (hedged)
% of NAV (hedged)
Frequency Ex Date Face Value ( )₹ Ex NAV ( )₹ Gross Dividend ( ) / Unit₹
Weekly
Weekly Direct
Monthly
Monthly Direct
May, 2020
October, 2019
August, 2019
July, 2019
29 Dec, 2020
29 October, 2019
25 February, 2020
30 December, 2019
0.0891
0.0066
0.0929
0.0485
0.0600
0.0300
0.0600
0.0600
10.0640
10.3368
10.3583
10.3441
10.0000
10.0000
10.0000
10.0000
10.0000
10.0000
DIVIDEND HISTORY
After payment of the dividend, the per Unit NAV falls to the extent of the payout and statutory levy (if applicable). There is no guarantee or assurance to the unitholders as to the rate/quantum of neither dividend distribution nor that the dividends be paid regularly. For complete dividend history please visit www.licmf.com.
Top 10 holdings
SCHEME PERFORMANCE
Scheme NIFTY 50 Arbitrage Index* NIFTY 50 Arbitrage Index*SchemeNifty 50 TRI** Nifty 50 TRI**
1 Year 3.56 2.36 16.09 10,357 10,237 11,614
3 Years NA NA NA NA NA NA
5 Years NA NA NA NA NA NA
Since Inception 4.55 4.38 15.77 10,899 10,865 13,273
PeriodCAGR (%) Value of lumpsum investment of 10,000/- ₹
invested on inception date
stAbove returns are as on 31 December, 2020. Different plans shall have a different expense structure. The performance details provided herein are of Regular plan - Growth option. Mr. Yogesh Patil (equity portfolio) is managing the above scheme from 25th January 2019 & Mr. Marzban Irani (debt portfolio) is managing the above scheme from 25th January 2019. Total no. of schemes managed by Mr. Yogesh Patil is 11 and by Mr. Marzban Irani is 10. Past performance may or may not be sustained in the future. Load is not taken into consideration for computation of performance. The Mutual Fund is not guaranteeing or promising or forecasting any returns. Date of allotment is 25th Jan'2019, hence returns are available for 1 yr & since inception. * Benchmark, ** Additional Benchmark. NA : Not Available. The performance of the scheme is benchmarked to the Total Return variant of the index.
stAbove returns are as on 31 December, 2020. Past performance may or may not be
sustained in the future. # NIFTY 50 Arbitrage Index, ## NIFTY 50 TRI. Assuming ₹
10,000/- invested systematically on the first Business Day of every month over a
period of time.CAGR returns are computed after accounting for the cash by using
XIRR method (investment internal rate of return) for Regular Plan - Growth Option.
Load is not taken into consideration for computation of performance. The above
investment simulation is for illustrative purpose only and should not be construed
as a promise on minimum returns and safeguard of capital. The Mutual Fund is not
guaranteeing or promising or forecasting any returns. Since inception returns are
assumed to be starting from the beginning of the subsequent month from the date
of inception. The performance of the scheme is benchmarked to the Total Return
variant of the index.
SIP Investments 1 Year 3 Years 5 Years 7 Years 10 Years Since Inception
Total Amount Invested ( )₹ 1,20,000 - 2,30,000
Market Value as on December 31, 2020 ( ) ₹ 1,21,825 2,38,716
Returns (CAGR) (%) 2.83 3.77
Benchmark Returns (CAGR) (%) #
Additional Benchmark Returns (CAGR) (%) ##
2.07
60.66
3.15
26.36
SIP PERFORMANCE
-
-
-
-
-
-
-
-
-
-
-
-
-
-
-
-
-
-
-
-
-
-
-
-
-
-
-
-
-
-
-
-
-
-
SIP Performance disclaimer:
March, 2020 0.0901
April, 2020 0.0268
0.0600
0.0600
28 Oct, 2020 10.1398
Factsheet January, 2021
25 Nov, 2020 10.0982
14.58%
12.43%
9.31%
7.13%
6.64%
5.39%
3.63%
2.53%
2.14%
1.87%
1.17%
0.29%
Finance
Pharmaceuticals
Petroleum Products
Telecom - Services
Auto
Construction Project
Banks
Software
Ferrous Metals
Consumer Non Durables
Cement
Power
Equity Holdings
Auto 6.64% -6.66%
Maruti Suzuki India Ltd. 6.64% -6.66%
Banks 3.63% -3.63%
ICICI Bank Ltd. 2.47% -2.48%
State Bank of India 1.15% -1.16%
Cement 1.17% -1.17%
Shree Cement Ltd. 0.67% -0.68%
Grasim Industries Ltd. 0.49% -0.50%
Construction Project 5.39% -5.41%
Larsen & Toubro Ltd. 5.39% -5.41%
Consumer Non Durables 1.87% -1.87%
Dabur India Ltd. 1.87% -1.87%
Ferrous Metals 2.14% -2.15%
Tata Steel Ltd. 2.14% -2.15%
Finance 14.58% -14.61%
HDFC Ltd. 9.67% -9.69%
HDFC Life Ins Company Ltd. 3.12% -3.13%
Power Finance Co Ltd. 1.78% -1.79%
Petroleum Products 9.31% -9.35%
Reliance Industries Ltd. 9.31% -9.35%
Pharmaceuticals 12.43% -12.47%
Aurobindo Pharma Ltd. 8.72% -8.74%
Cipla Ltd. 2.09% -2.10%
Lupin Ltd. 1.63% -1.63%
Power 0.29% -0.29%
Tata Power Company Ltd. 0.29% -0.29%
Software 2.53% -2.54%
Infosys Ltd. 2.53% -2.54%
Telecom - Services 7.13% -7.16%
Bharti Airtel Ltd. 7.13% -7.16%
Equity Holdings Total 67.08% -67.31%
Mutual Fund/ETFs
Mutual Fund 25.43%
LIC MF Liquid Fund-DR PLN-GR 25.43%
Mutual Fund Holding Total/ETFs 25.43%
Cash & Other Receivables Total 7.48%
Grand Total 100.00%

The primary objective of the scheme is to generate credit risk free and reasonable returns for its investors
through investments in sovereign securities issued by the central and /or state Government and/or any
security unconditionally guaranteed by the central/ state government for repayment of Principal and interest
and/or reverse repos in such securities as and when permitted by RBI. However, there is no assurance that
the investment objective of the Schemes will be realized.
Company Rating % of NAV
Frequency Ex Date Face Value ( )₹ Ex NAV ( )₹ Gross Dividend ( ) / Unit₹
Quarterly (Regular) 10.0000 0.1500
10.0000 0.1500
December 28, 2017
September 29, 2017
June 29, 2017
March 27, 2018
December 28, 2017
September 29, 2017
10.0000 10.4179
10.8006
10.9665
0.1500
Quarterly (Direct) 10.0000 0.1500
10.0000 0.1500
10.0000 10.9575
10.9013
11.2701
0.1500
Quarterly (PF) December 27, 2012 10.0000 11.1882 0.2500
March 28, 2013 10.0000 10.1606 1.0000
June 26, 2013 10.0000 10.0868 0.3000
86.89%>365 days
94.49%
5.51%
Sovereign
Cash & Other Receivables
SCHEME FEATURES INVESTMENT OBJECTIVE
PORTFOLIO AS ON 31.12.2020
SCHEME PERFORMANCE
DIVIDEND HISTORY
MATURITY PROFILE (% of NAV)
RATING PROFILE (% of NAV)
Scheme I-Sec Composite Index*
Crisil 10 yr Gilt Index**
Crisil 10 yr Gilt Index**
Scheme I-Sec Composite Index*
1 Year 10.94 9.23 11,097 10,926
3 Years 9.94 8.55 13,298 12,799
5 Years 8.86 8.01 15,292 14,705
Since Inception 7.75 NA
9.60
10.24
11.85
NA 48,232 NA
15,825
13,409
11,188
NA
PeriodCAGR (%)
Value of lumpsum investment of 10,000/- ₹invested on inception date
stAbove returns are as on 31 December, 2020. Different plans shall have a different expense structure. The performance details provided herein are of Regular plan - Growth
option. Mr. Marzban Irani is managing the above scheme from 10th August, 2016 and total no. of schemes managed by him is 10. Past performance may or may not be
sustained in the future. Load is not taken into consideration for computation of performance. The Mutual Fund is not guaranteeing or promising or forecasting any returns. As the
scheme was launched before the launch of the benchmark index, benchmark index figures since inception or the required period are not available. * Benchmark, ** Additional
Benchmark. NA : Not Available.
After payment of the dividend, the per Unit NAV falls to the extent of the payout and statutory levy (if applicable). There is no guarantee or assurance to the unitholders as to the rate/quantum of neither dividend distribution nor that the dividends be paid regularly. For complete dividend history please visit www.licmf.com.
Scheme Type: An open ended debt scheme investing in government securities across maturity.
Date of Allotment: December 10, 1999
Fund Size:
AUM as on 31/12/2020: ₹ 65.43 Cr
: 67.98 CrAverage AUM for December 2020 ₹
Load Structure:Entry Load: Nil
Exit Load: 0.25% if exit within 30 days from date of
allotment of units
Benchmark: I-Sec Composite Index
Minimum Investment (lumpsum): ₹ 10,000/-
Fund Manager:Name: Mr. Marzban IraniExperience: years17+
Expense Ratio:Regular: 1.48; Direct: 0.76%(for detailed bifurcation on TER, please see page no 32)
Portfolio Metrics:Average Maturity 6.18 yearsMacaulay Duration 5.02 yearsModified Duration 4.88 yearsYTM 5.21%
NAV as on :December 31, 2020
NAV Regular Plan Direct Plan PF
Growth ₹ 48.2322 ₹ 51.4427 ₹ 27.8571
Dividend ₹ 13.9029 ₹ 14.8346 ₹18.0264
20
7.59%Up to 365 days
Factsheet January, 2021
5.51%Cash & Other Receivables
Government Bond & Treasury Bill
Government Bond
5.85% Govt of India Red 01-12-2030 SOV 30.68%
7.17% Govt of India Red 08-01-2028 SOV 28.45%
5.22% Govt of India Red 15-06-2025 SOV 15.42%
5.15% Govt of India Red 09-11-2025 SOV 12.34%
Government Bond Total 86.89%
Treasury Bill
91 Days Tbill Red 18-03-2021 SOV 7.59%
Treasury Bill Total 7.59%
Government Bond & Treasury Bill Total 94.49%
Cash & Other Receivables 5.51%
Grand Total 100.00%
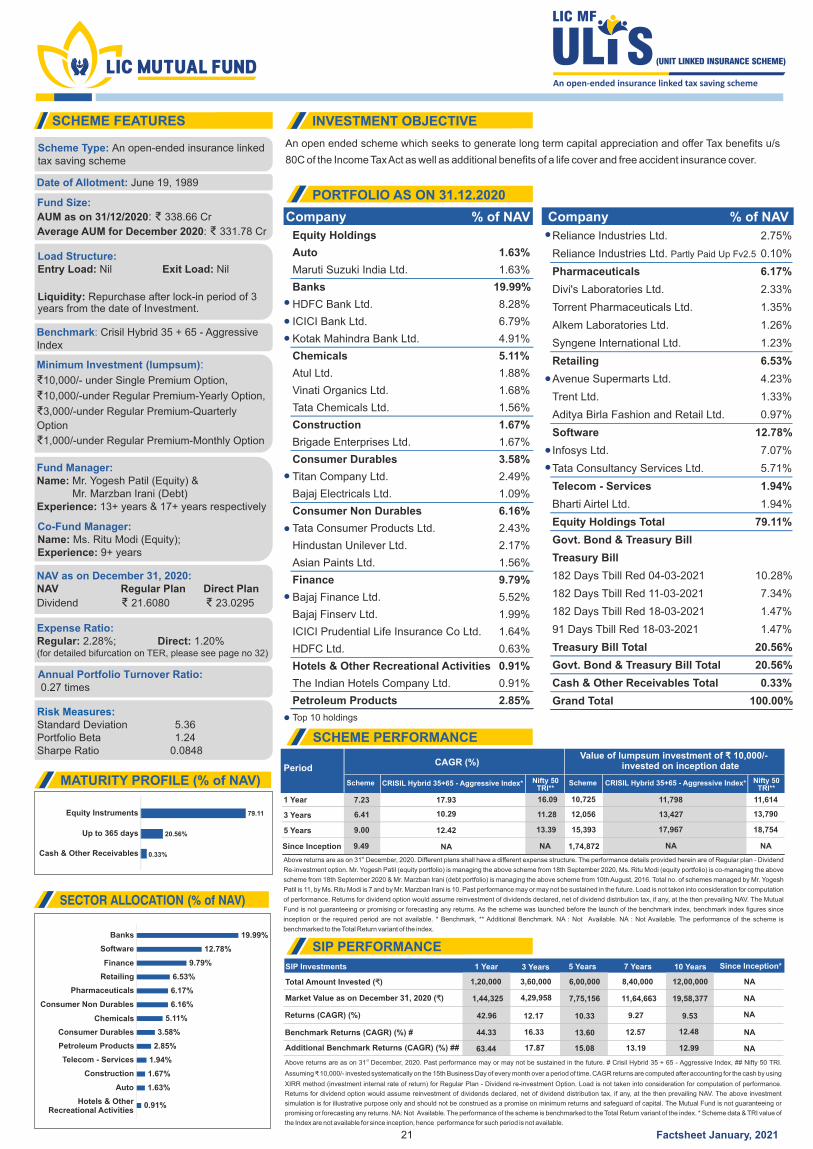
An open ended scheme which seeks to generate long term capital appreciation and offer Tax benefits u/s
80C of the Income Tax Act as well as additional benefits of a life cover and free accident insurance cover.
stAbove returns are as on 31 December, 2020. Past performance may or may not be sustained in the future. # Crisil Hybrid 35 + 65 - Aggressive Index, ## Nifty 50 TRI.
Assuming ₹ 10,000/- invested systematically on the 15th Business Day of every month over a period of time. CAGR returns are computed after accounting for the cash by using
XIRR method (investment internal rate of return) for Regular Plan - Dividend re-investment Option. Load is not taken into consideration for computation of performance.
Returns for dividend option would assume reinvestment of dividends declared, net of dividend distribution tax, if any, at the then prevailing NAV. The above investment
simulation is for illustrative purpose only and should not be construed as a promise on minimum returns and safeguard of capital. The Mutual Fund is not guaranteeing or
promising or forecasting any returns. NA: Not Available. The performance of the scheme is benchmarked to the Total Return variant of the index. * Scheme data & TRI value of
the Index are not available for since inception, hence performance for such period is not available.
79.11
0.33%
20.56%Up to 365 days
Equity Instruments
Cash & Other Receivables
SIP Investments 1 Year 3 Years 5 Years 7 Years 10 Years Since Inception*
Total Amount Invested ( )₹ 1,20,000 3,60,000 6,00,000 8,40,000 12,00,000 NA
NA
NA
NA
NA
Market Value as on December 31, 2020 ( ) ₹ 1,44,325 4,29,958 7,75,156 11,64,663 19,58,377
Returns (CAGR) (%) 42.96 12.17 10.33 9.27 9.53
Benchmark Returns (CAGR) (%) #
Additional Benchmark Returns (CAGR) (%) ##
44.33
63.44
16.33
17.87
13.60 12.57
15.08 13.19
12.48
12.99
SCHEME FEATURES INVESTMENT OBJECTIVE
PORTFOLIO AS ON 31.12.2020
SCHEME PERFORMANCE
SIP PERFORMANCE
MATURITY PROFILE (% of NAV)
Company % of NAV Company % of NAV
SECTOR ALLOCATION (% of NAV)
Scheme CRISIL Hybrid 35+65 - Aggressive Index* CRISIL Hybrid 35+65 - Aggressive Index*SchemeNifty 50TRI**
Nifty 50 TRI**
1 Year 7.23 17.93 16.09 10,725 11,798 11,614
3 Years 6.41 10.29 11.28 12,056 13,427 13,790
5 Years 9.00 12.42 13.39 15,393 17,967 18,754
Since Inception 9.49 NA NA 1,74,872 NA NA
PeriodCAGR (%)
Value of lumpsum investment of 10,000/- ₹invested on inception date
stAbove returns are as on 31 December, 2020. Different plans shall have a different expense structure. The performance details provided herein are of Regular plan - Dividend
Re-investment option. Mr. Yogesh Patil (equity portfolio) is managing the above scheme from 18th September 2020, Ms. Ritu Modi (equity portfolio) is co-managing the above
scheme from 18th September 2020 & Mr. Marzban Irani (debt portfolio) is managing the above scheme from 10th August, 2016. Total no. of schemes managed by Mr. Yogesh
Patil is 11, by Ms. Ritu Modi is 7 and by Mr. Marzban Irani is 10. Past performance may or may not be sustained in the future. Load is not taken into consideration for computation
of performance. Returns for dividend option would assume reinvestment of dividends declared, net of dividend distribution tax, if any, at the then prevailing NAV. The Mutual
Fund is not guaranteeing or promising or forecasting any returns. As the scheme was launched before the launch of the benchmark index, benchmark index figures since
inception or the required period are not available. * Benchmark, ** Additional Benchmark. NA : Not Available. NA : Not Available. The performance of the scheme is
benchmarked to the Total Return variant of the index.
Scheme Type: An open-ended insurance linked tax saving scheme
Date of Allotment: June 19, 1989
Fund Size:
AUM as on 31/12/2020: ₹ 338.66 Cr
: 331.78 CrAverage AUM for December 2020 ₹
Load Structure:Entry Load: Exit Load: Nil Nil
Liquidity: Repurchase after lock-in period of 3 years from the date of Investment.
Benchmark: Crisil Hybrid 35 + 65 - Aggressive Index
Minimum Investment (lumpsum):
₹10,000/- under Single Premium Option,
₹10,000/-under Regular Premium-Yearly Option,
₹3,000/-under Regular Premium-Quarterly
Option
₹1,000/-under Regular Premium-Monthly Option
Fund Manager:Name: Mr. (Equity) &Yogesh Patil Mr. Marzban Irani (Debt)Experience: years & 1 years respectively13+ 7+
NAV as on December 31, 2020:NAV Regular Plan Direct Plan
Dividend ₹ 21.6080 ₹ 23.0295
Expense Ratio: Regular: 2.28%; Direct: 1.20%
(for detailed bifurcation on TER, please see page no 32)
Annual Portfolio Turnover Ratio: 0.27 times
Risk Measures:Standard Deviation 5.36Portfolio Beta 1.24Sharpe Ratio 0.0848
21
Top 10 holdings
Co-Fund Manager:Name: Ms. Ritu Modi (Equity);Experience: 9+ years
Factsheet January, 2021
19.99%
12.78%
9.79%
6.53%
6.17%
6.16%
5.11%
3.58%
2.85%
1.94%
1.67%
1.63%
0.91%
Banks
Software
Finance
Retailing
Pharmaceuticals
Consumer Non Durables
Chemicals
Consumer Durables
Petroleum Products
Telecom - Services
Construction
Auto
Hotels & OtherRecreational Activities
Equity Holdings
Auto 1.63%
Maruti Suzuki India Ltd. 1.63%
Banks 19.99%
HDFC Bank Ltd. 8.28%
ICICI Bank Ltd. 6.79%
Kotak Mahindra Bank Ltd. 4.91%
Chemicals 5.11%
Atul Ltd. 1.88%
Vinati Organics Ltd. 1.68%
Tata Chemicals Ltd. 1.56%
Construction 1.67%
Brigade Enterprises Ltd. 1.67%
Consumer Durables 3.58%
Titan Company Ltd. 2.49%
Bajaj Electricals Ltd. 1.09%
Consumer Non Durables 6.16%
Tata Consumer Products Ltd. 2.43%
Hindustan Unilever Ltd. 2.17%
Asian Paints Ltd. 1.56%
Finance 9.79%
Bajaj Finance Ltd. 5.52%
Bajaj Finserv Ltd. 1.99%
ICICI Prudential Life Insurance Co Ltd. 1.64%
HDFC Ltd. 0.63%
Hotels & Other Recreational Activities 0.91%
The Indian Hotels Company Ltd. 0.91%
Petroleum Products 2.85%
Reliance Industries Ltd. 2.75%
Reliance Industries Ltd. Partly Paid Up Fv2.5 0.10%
Pharmaceuticals 6.17%
Divi's Laboratories Ltd. 2.33%
Torrent Pharmaceuticals Ltd. 1.35%
Alkem Laboratories Ltd. 1.26%
Syngene International Ltd. 1.23%
Retailing 6.53%
Avenue Supermarts Ltd. 4.23%
Trent Ltd. 1.33%
Aditya Birla Fashion and Retail Ltd. 0.97%
Software 12.78%
Infosys Ltd. 7.07%
Tata Consultancy Services Ltd. 5.71%
Telecom - Services 1.94%
Bharti Airtel Ltd. 1.94%
Equity Holdings Total 79.11%
Govt. Bond & Treasury Bill
Treasury Bill
182 Days Tbill Red 04-03-2021 10.28%
182 Days Tbill Red 11-03-2021 7.34%
182 Days Tbill Red 18-03-2021 1.47%
91 Days Tbill Red 18-03-2021 1.47%
Treasury Bill Total 20.56%
Govt. Bond & Treasury Bill Total 20.56%
Cash & Other Receivables Total 0.33%
Grand Total 100.00%

The investment objective of the Scheme is to generate regular income by investing mainly in a portfolio of
quality debt securities and money market instruments. It also seeks to generate capital appreciation by
investing some percentage in a mix of equity instruments. However, there is no assurance that the
investment objective of the Schemes will be realized.
The Dhanvarsha - 12 Scheme has been converted into an open-ended monthly income plan w.e.f. 1/6/03.
Frequency Ex Date Face Value ( )₹ Ex NAV ( )₹ Gross Dividend ( ) / Unit₹
Yearly 10.0000
10.0000
March 26, 2019
March 27, 2018
April 28, 2017
10.0000 10.8612
11.2243
11.3750
0.8400
0.6000
0.6000
Yearly Direct 10.0000
10.0000
0.6000
March 26, 2019
March 27, 2018
April 28, 2017
10.0000 11.3539
11.6343
11.7005
0.8400
0.6000
Monthly 10.0000
10.0000
Dec 29, 2020 10.0000 11.6263 0.0200
Monthly Direct 10.0000
10.0000
10.0000
Dec 29, 2020 11.2990 0.0600
Quarterly 10.0000
Sept 30, 2020 10.0000
10.0000
11.1426 0.1800
0.1800
0.1800
Quarterly Direct 10.0000
June 28, 2018
March 27, 2018
Dec 28, 2017
10.0000
10.0000
10.8458
11.0687
11.2582
0.1500
0.1500
0.1500
58.22%
22.70%
18.22%
>365 days
Up to 365 days
Equity Instruments
SCHEME FEATURES INVESTMENT OBJECTIVE
PORTFOLIO AS ON 31.12.2020
SCHEME PERFORMANCE
MATURITY PROFILE (% of NAV)
RATING PROFILE (% of NAV)
DIVIDEND HISTORY
Company % of NAV Company % of NAV
Scheme CRISIL Hybrid 85+15-Conservative Index*
CRISIL Hybrid 85+15-Conservative Index*
CRISIL 10 year Gilt Index**
CRISIL 10 year Gilt Index**Scheme
1 Year 9.86 14.15 9.23 10,989 11,419 10,926
3 Years 6.61 9.99 8.55 12,122 13,319 12,799
5 Years 7.32 10.15 8.01 14,244 16,223 14,705
Since Inception 8.50 NA NA 63,185 NA NA
Period
CAGR (%) Value of lumpsum investment of 10,000/- ₹invested on inception date
stAbove returns are as on 31 December, 2020. Different plans shall have a different expense structure. The performance details provided herein are of Regular plan - Growth
option. Mr. Yogesh Patil (equity portfolio) is managing the scheme from 4th October 2018 & Mr. Marzban Irani (debt portfolio) is managing the scheme from 10th August, 2016.
Total no. of schemes managed by Mr. Yogesh Patil is 11 and by Mr. Marzban Irani is 10. Past performance may or may not be sustained in the future. Load is not taken into
consideration for computation of performance. The Mutual Fund is not guaranteeing or promising or forecasting any returns. As the scheme was launched before the launch of
the benchmark index, benchmark index figures since inception or the required period are not available. * Benchmark, ** Additional Benchmark. NA : Not Available. The
performance of the scheme is benchmarked to the Total Return variant of the index.
69.21%
22.70%
7.23%
0.85%
AAA/A1+ and Equivalent
Sovereign
Equity Instruments
Cash & Other Receivables
After payment of the dividend, the per Unit NAV falls to the extent of the payout and statutory levy (if applicable). There is no guarantee or assurance to the unitholders as to the rate/quantum of neither dividend distribution nor that the dividends be paid regularly. For complete dividend history please visit www.licmf.com.
Scheme Type: An open ended hybrid scheme investing predominantly In debt instruments
Date of Allotment: June 01, 1998
Fund Size:
AUM as on 31/12/2020: ₹ 81.82 Cr
: 81.16 CrAverage AUM for December 2020 ₹
Benchmark: Crisil Hybrid 85 + 15 - Conservative Index
Minimum Investment (lumpsum): ₹ 5,000/-
Fund Manager:Name: Mr. Marzban Irani (Debt) & Mr. Yogesh Patil (Equity); Experience: 17+ years & 11+ years respectively
Expense Ratio:Regular: 2.25%; Direct: 1.50%(for detailed bifurcation on TER, please see page no 32)
Portfolio Metrics:Average Maturity 3.91 yearsMacaulay Duration 3.19 yearsModified Duration 3.09 yearsYTM 4.49 %
NAV as on :December 31, 2020
NAV Regular Plan Direct Plan
Growth ₹ 63.1854 ₹ 67.1963
Monthly Dividend ₹ 11.6576 ₹ 11.3298
Quarterly Dividend ₹ 11.7782 ₹ 13.5766
Yearly Dividend ₹ 12.7338 ₹ 13.4750
22
Load Structure:Entry Load - NIL
Exit Load
Ÿ 12% of the units allotted shall be redeemed or switched out without any exit load, on or before completion of 12 months from the date of allotment of units.
Ÿ 1% on remaining units if redeemed or switched out on or before completion of 12 months from the date of allotment of units.
Ÿ Nil, if redeemed or switched out after completion of 12 months from the date of allotment of units.
Top 10 holdings
December 31, 2019 11.0677
0.0600
0.0600
0.0500
0.85%Cash & Other Receivables
June 26, 2020 11.1417
Oct 28, 2020 11.0067
Sept 29, 2020 11.0728
Factsheet January, 2021
Nov 25, 2020 11.1463
Nov 25, 2020 11.4357 0.0400
Equity Holdings
Auto 0.87%
Mahindra & Mahindra Ltd. 0.87%
Banks 5.39%
ICICI Bank Ltd. 3.99%
HDFC Bank Ltd. 1.40%
Chemicals 0.50%
Sumitomo Chemical India Ltd. 0.50%
Consumer Durables 0.55%
Johnson Controls-Hitachi AC India Ltd. 0.55%
Consumer Non Durables 3.45%
Nestle India Ltd. 1.73%
Hindustan Unilever Ltd. 1.72%
Gas 0.61%
Petronet LNG Ltd. 0.61%
Petroleum Products 1.26%
Reliance Industries Ltd. 1.21%
Reliance Industries Ltd. Partly Paid Up Fv2.5 0.05%
Pharmaceuticals 1.32%
Sanofi India Ltd. 0.93%
Abbott India Ltd. 0.39%
Software 8.19%
Infosys Ltd. 4.60%
Larsen & Toubro Infotech Ltd. 2.40%
Tech Mahindra Ltd. 1.19%
Telecom - Services 0.56%
Bharti Airtel Ltd. 0.56%
Equity Holdings Total 22.70%
Corporate Debt
Non-Convertible Debentures
State Bank of India-Tier II Bonds (Under Basel III) 7.15%
NTPC Ltd. 0.09%
Non-Convertible Debentures Total 7.23%
Corporate Debt Total 7.23%
Govt. Bond & Treasury Bill
Government Bond
7.32% Govt of India Red 28-01-2024 34.04%
5.85% Govt of India Red 01-12-2030 12.27%
5.77% Govt of India Red 03-08-2030 3.10%
8.30% Govt of India Red 02-07-2040 0.90%
7.26% Govt of India Red 14-01-2029 0.68%
Govternment Bond Total 50.99%
Treasury Bill
182 Days Tbill Red 18-03-2021 18.22%
Treasury Bill Total 18.22%
Govt. Bond & Treasury Bill Total 69.21%
Cash & Other Receivables Total 0.85%
Grand Total 100.00%
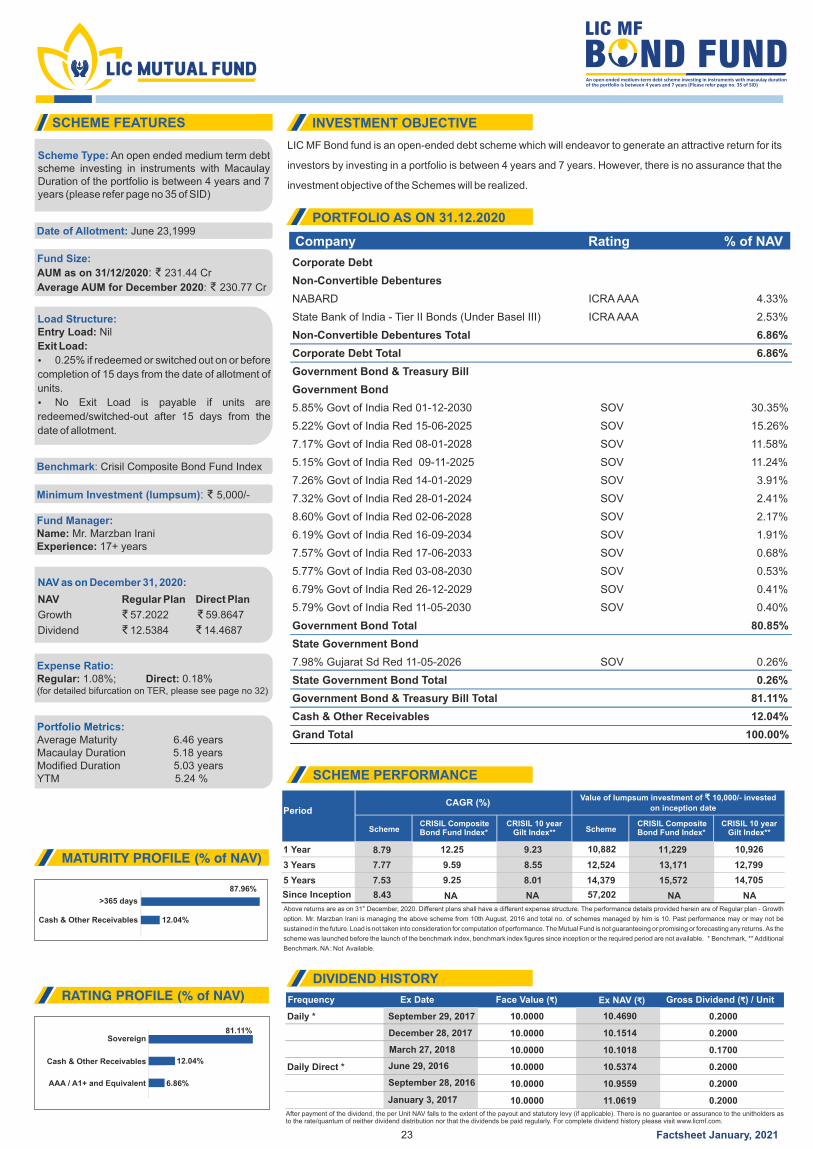
LIC MF Bond fund is an open-ended debt scheme which will endeavor to generate an attractive return for its
investors by investing in a portfolio is between 4 years and 7 years. However, there is no assurance that the
investment objective of the Schemes will be realized.
Frequency Ex Date Face Value ( )₹ Ex NAV ( )₹ Gross Dividend ( ) / Unit₹
Daily * 10.0000 0.2000
10.0000 0.2000
March 27, 2018
December 28, 2017
September 29, 2017
10.0000 10.1018
10.1514
10.4690
0.1700
Daily Direct * June 29, 2016 10.0000 10.5374 0.2000
September 28, 2016 10.0000 10.9559 0.2000
January 3, 2017 10.0000 11.0619 0.2000
Company Rating % of NAV
87.96%
>365 days
81.11%
12.04%
6.86%AAA / A1+ and Equivalent
Sovereign
Cash & Other Receivables
SCHEME FEATURES INVESTMENT OBJECTIVE
PORTFOLIO AS ON 31.12.2020
SCHEME PERFORMANCE
DIVIDEND HISTORY
MATURITY PROFILE (% of NAV)
RATING PROFILE (% of NAV)
SchemeCRISIL Composite Bond Fund Index*
CRISIL 10 year Gilt Index**
CRISIL 10 year Gilt Index**Scheme
CRISIL Composite Bond Fund Index*
1 Year 8.79 12.25 9.23 10,882 11,229 10,926
3 Years 7.77 9.59 8.55 12,524 13,171 12,799
5 Years 7.53 9.25 8.01 14,379 15,572 14,705
Since Inception 8.43 NA NA 57,202 NA NA
PeriodCAGR (%)
Value of lumpsum investment of 10,000/- invested ₹on inception date
stAbove returns are as on 31 December, 2020. Different plans shall have a different expense structure. The performance details provided herein are of Regular plan - Growth
option. Mr. Marzban Irani is managing the above scheme from 10th August, 2016 and total no. of schemes managed by him is 10. Past performance may or may not be
sustained in the future. Load is not taken into consideration for computation of performance. The Mutual Fund is not guaranteeing or promising or forecasting any returns. As the
scheme was launched before the launch of the benchmark index, benchmark index figures since inception or the required period are not available. * Benchmark, ** Additional
Benchmark. NA : Not Available.
After payment of the dividend, the per Unit NAV falls to the extent of the payout and statutory levy (if applicable). There is no guarantee or assurance to the unitholders as to the rate/quantum of neither dividend distribution nor that the dividends be paid regularly. For complete dividend history please visit www.licmf.com.
Scheme Type: An open ended medium term debt scheme investing in instruments with Macaulay Duration of the portfolio is between 4 years and 7 years (please refer page no 35 of SID)
Date of Allotment: June 23,1999
Fund Size:
AUM as on 31/12/2020: ₹ 231.44 Cr
: 230.77 CrAverage AUM for December 2020 ₹
Load Structure:Entry Load: Nil
Exit Load:
Ÿ 0.25% if redeemed or switched out on or before
completion of 15 days from the date of allotment of
units.
Ÿ No Exit Load is payable if units are
redeemed/switched-out after 15 days from the
date of allotment.
Benchmark: Crisil Composite Bond Fund Index
Minimum Investment (lumpsum): ₹ 5,000/-
Fund Manager:Name: Mr. Marzban IraniExperience: years17+
Expense Ratio:Regular: 1.08%; Direct: 0.18%(for detailed bifurcation on TER, please see page no 32)
Portfolio Metrics:Average Maturity 6.46 yearsMacaulay Duration 5.18 yearsModified Duration 5.03 yearsYTM 5.24 %
NAV as on :December 31, 2020
NAV Regular Plan Direct Plan
Growth ₹ 57.2022 ₹ 59.8647
Dividend ₹ 12.5384 ₹ 14.4687
23
An open-ended medium-term debt scheme investing in instruments with macaulay duration of the portfolio is between 4 years and 7 years (Please refer page no. 35 of SID)
12.04%Cash & Other Receivables
Factsheet January, 2021
Corporate Debt
Non-Convertible Debentures
NABARD ICRA AAA 4.33%
State Bank of India - Tier II Bonds (Under Basel III) ICRA AAA 2.53%
Non-Convertible Debentures Total 6.86%
Corporate Debt Total 6.86%
Government Bond & Treasury Bill
Government Bond
5.85% Govt of India Red 01-12-2030 SOV 30.35%
5.22% Govt of India Red 15-06-2025 SOV 15.26%
7.17% Govt of India Red 08-01-2028 SOV 11.58%
5.15% Govt of India Red 09-11-2025 SOV 11.24%
7.26% Govt of India Red 14-01-2029 SOV 3.91%
7.32% Govt of India Red 28-01-2024 SOV 2.41%
8.60% Govt of India Red 02-06-2028 SOV 2.17%
6.19% Govt of India Red 16-09-2034 SOV 1.91%
7.57% Govt of India Red 17-06-2033 SOV 0.68%
5.77% Govt of India Red 03-08-2030 SOV 0.53%
6.79% Govt of India Red 26-12-2029 SOV 0.41%
5.79% Govt of India Red 11-05-2030 SOV 0.40%
Government Bond Total 80.85%
State Government Bond
7.98% Gujarat Sd Red 11-05-2026 SOV 0.26%
State Government Bond Total 0.26%
Government Bond & Treasury Bill Total 81.11%
Cash & Other Receivables 12.04%
Grand Total 100.00%
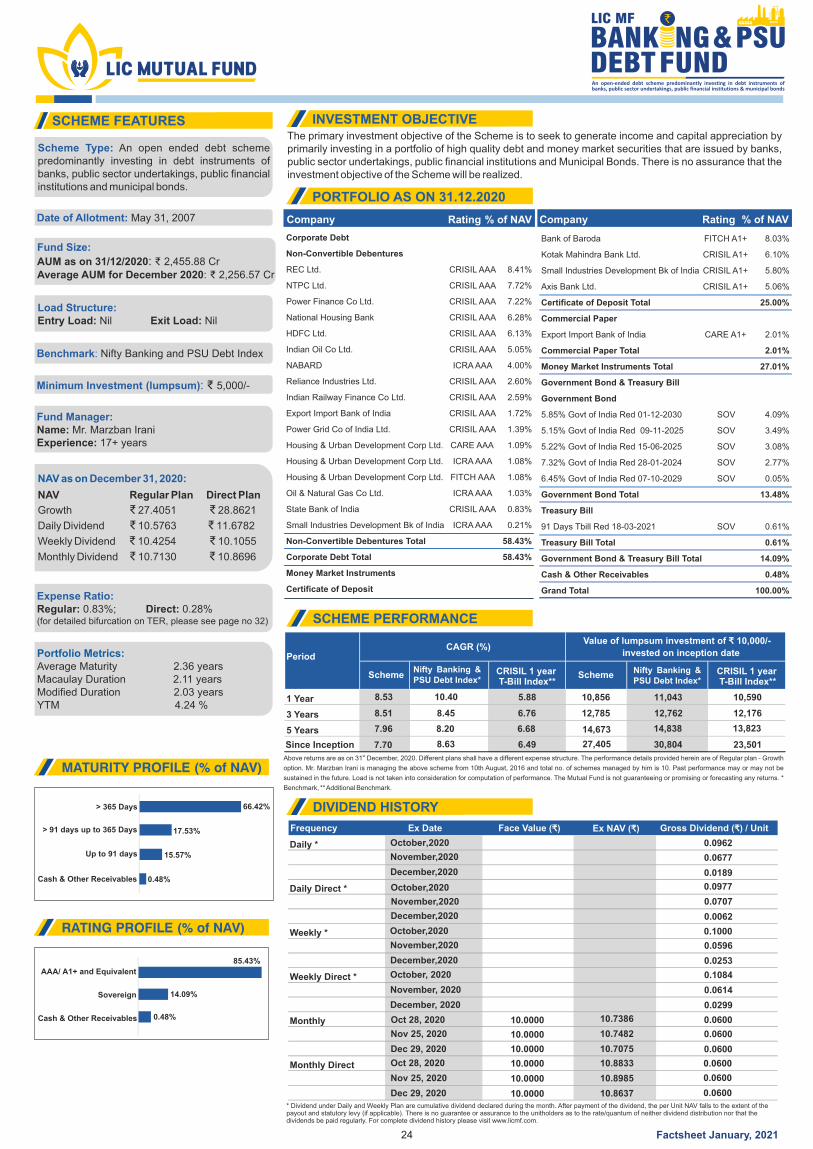
The primary investment objective of the Scheme is to seek to generate income and capital appreciation by primarily investing in a portfolio of high quality debt and money market securities that are issued by banks, public sector undertakings, public financial institutions and Municipal Bonds. There is no assurance that the investment objective of the Scheme will be realized.
Frequency Ex Date Face Value ( )₹ Ex NAV ( )₹ Gross Dividend ( ) / Unit₹
Daily *
December,2020 0.0189
Daily Direct *
December,2020 0.0062
Weekly *
December,2020 0.0253
Weekly Direct *
December, 2020 0.0299
Monthly
Dec 29, 2020 10.0000
10.0000
10.0000
10.7075 0.0600
Monthly Direct
Dec 29, 2020 10.0000
10.0000
10.0000
10.8637 0.0600
0.0600
66.42%
17.53%
15.57%Up to 91 days
Cash & Other Receivables
> 365 Days
85.43%
14.09%
0.48%
AAA/ A1+ and Equivalent
Sovereign
Cash & Other Receivables
SCHEME FEATURES INVESTMENT OBJECTIVE
PORTFOLIO AS ON 31.12.2020
SCHEME PERFORMANCE
DIVIDEND HISTORY
MATURITY PROFILE (% of NAV)
RATING PROFILE (% of NAV)
SchemeNifty Banking & PSU Debt Index*
Nifty Banking & PSU Debt Index*
CRISIL 1 year T-Bill Index**
CRISIL 1 year T-Bill Index**
Scheme
1 Year 8.53 10.40 5.88 10,856 11,043 10,590
3 Years 8.51 8.45 6.76 12,785 12,762 12,176
5 Years 7.96 8.20 6.68 14,673 14,838 13,823
Since Inception 7.70 8.63 6.49 27,405 30,804 23,501
PeriodCAGR (%)
Value of lumpsum investment of 10,000/- ₹invested on inception date
stAbove returns are as on 31 December, 2020. Different plans shall have a different expense structure. The performance details provided herein are of Regular plan - Growth
option. Mr. Marzban Irani is managing the above scheme from 10th August, 2016 and total no. of schemes managed by him is 10. Past performance may or may not be
sustained in the future. Load is not taken into consideration for computation of performance. The Mutual Fund is not guaranteeing or promising or forecasting any returns. *
Benchmark, ** Additional Benchmark.
* Dividend under Daily and Weekly Plan are cumulative dividend declared during the month. After payment of the dividend, the per Unit NAV falls to the extent of the payout and statutory levy (if applicable). There is no guarantee or assurance to the unitholders as to the rate/quantum of neither dividend distribution nor that the dividends be paid regularly. For complete dividend history please visit www.licmf.com.
Scheme Type: An open ended debt scheme predominantly investing in debt instruments of banks, public sector undertakings, public financial institutions and municipal bonds.
Date of Allotment: May 31, 2007
Fund Size:
AUM as on 31/12/2020: ₹ 2,455.88 Cr: ₹ 2,256.57 CrAverage AUM for December 2020
Load Structure:Entry Load: Exit Load: Nil Nil
Benchmark: Nifty Banking and PSU Debt Index
Minimum Investment (lumpsum): ₹ 5,000/-
Fund Manager:Name: Mr. Marzban Irani Experience: 17+ years
Expense Ratio:Regular: 0.83%; Direct: 0.28%(for detailed bifurcation on TER, please see page no 32)
Portfolio Metrics:Average Maturity 2.36 yearsMacaulay Duration 2.11 yearsModified Duration 2.03 yearsYTM 4.24 %
NAV as on :December 31, 2020
NAV Regular Plan Direct Plan
Growth ₹ 27.4051 ₹ 28.8621
Daily Dividend ₹ 10.5763 ₹ 11.6782
Weekly Dividend ₹ 10.4254 ₹ 10.1055
Monthly Dividend ₹ 10.7130 ₹ 10.8696
24
Company CompanyRating Rating% of NAV % of NAV
0.48%
> 91 days up to 365 Days
0.0600
0.0600
0.0600
October,2020 0.0977
Oct 28, 2020 10.8833
October, 2020 0.1084
Oct 28, 2020 10.7386
October,2020 0.1000
Factsheet January, 2021
November,2020 0.0707
Nov 25, 2020 10.8985
November, 2020 0.0614
October,2020 0.0962
November,2020 0.0677
Nov 25, 2020 10.7482
November,2020 0.0596
Corporate Debt
Non-Convertible Debentures
REC Ltd. CRISIL AAA 8.41%
NTPC Ltd. CRISIL AAA 7.72%
Power Finance Co Ltd. CRISIL AAA 7.22%
National Housing Bank CRISIL AAA 6.28%
HDFC Ltd. CRISIL AAA 6.13%
Indian Oil Co Ltd. CRISIL AAA 5.05%
NABARD ICRA AAA 4.00%
Reliance Industries Ltd. CRISIL AAA 2.60%
Indian Railway Finance Co Ltd. CRISIL AAA 2.59%
Export Import Bank of India CRISIL AAA 1.72%
Power Grid Co of India Ltd. CRISIL AAA 1.39%
Housing & Urban Development Corp Ltd. CARE AAA 1.09%
Housing & Urban Development Corp Ltd. ICRA AAA 1.08%
Housing & Urban Development Corp Ltd. FITCH AAA 1.08%
Oil & Natural Gas Co Ltd. ICRA AAA 1.03%
State Bank of India CRISIL AAA 0.83%
Small Industries Development Bk of India ICRA AAA 0.21%
Non-Convertible Debentures Total 58.43%
Corporate Debt Total 58.43%
Money Market Instruments
Certificate of Deposit
Bank of Baroda FITCH A1+ 8.03%
Kotak Mahindra Bank Ltd. CRISIL A1+ 6.10%
Small Industries Development Bk of India CRISIL A1+ 5.80%
Axis Bank Ltd. CRISIL A1+ 5.06%
Certificate of Deposit Total 25.00%
Commercial Paper
Export Import Bank of India CARE A1+ 2.01%
Commercial Paper Total 2.01%
Money Market Instruments Total 27.01%
Government Bond & Treasury Bill
Government Bond
5.85% Govt of India Red 01-12-2030 SOV 4.09%
5.15% Govt of India Red 09-11-2025 SOV 3.49%
5.22% Govt of India Red 15-06-2025 SOV 3.08%
7.32% Govt of India Red 28-01-2024 SOV 2.77%
6.45% Govt of India Red 07-10-2029 SOV 0.05%
Government Bond Total 13.48%
Treasury Bill
91 Days Tbill Red 18-03-2021 SOV 0.61%
Treasury Bill Total 0.61%
Government Bond & Treasury Bill Total 14.09%
Cash & Other Receivables 0.48%
Grand Total 100.00%
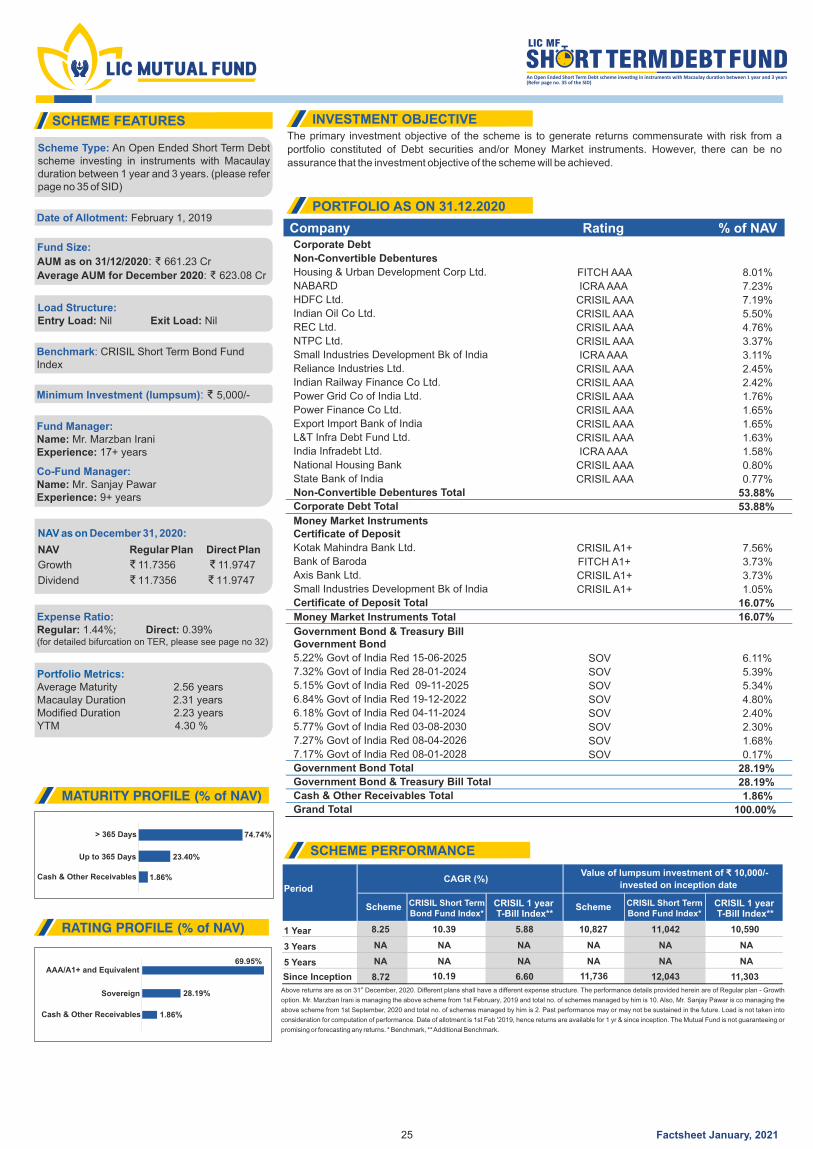
The primary investment objective of the scheme is to generate returns commensurate with risk from a
portfolio constituted of Debt securities and/or Money Market instruments. However, there can be no
assurance that the investment objective of the scheme will be achieved.
74.74%
23.40%
1.86%Cash & Other Receivables
> 365 Days
Up to 365 Days
SCHEME FEATURES INVESTMENT OBJECTIVE
PORTFOLIO AS ON 31.12.2020
MATURITY PROFILE (% of NAV)
RATING PROFILE (% of NAV)
Company Rating % of NAV
Scheme Type: An Open Ended Short Term Debt scheme investing in instruments with Macaulay duration between 1 year and 3 years. (please refer page no 35 of SID)
Date of Allotment: February 1, 2019
Fund Size:
AUM as on 31/12/2020: ₹ 661.23 Cr
: 623.08 CrAverage AUM for December 2020 ₹
Load Structure:Entry Load: Exit Load: Nil Nil
Benchmark: CRISIL Short Term Bond Fund Index
Minimum Investment (lumpsum): ₹ 5,000/-
Fund Manager:Name: Mr. Marzban Irani Experience: 17+ years
Expense Ratio:Regular: 1.44%; Direct: 0.39%(for detailed bifurcation on TER, please see page no 32)
Portfolio Metrics:Average Maturity 2.56 yearsMacaulay Duration 2.31 yearsModified Duration 2.23 yearsYTM 4.30 %
NAV as on :December 31, 2020
NAV Regular Plan Direct Plan
Growth ₹ 11.7356 ₹ 11.9747
Dividend ₹ 11.7356 ₹ 11.9747
25
69.95%
28.19%
1.86%
AAA/A1+ and Equivalent
Cash & Other Receivables
Sovereign
SCHEME PERFORMANCE
Scheme CRISIL Short TermBond Fund Index*
CRISIL Short TermBond Fund Index*
CRISIL 1 year T-Bill Index**
CRISIL 1 year T-Bill Index**
Scheme
1 Year 8.25 10.39 5.88 10,827 11,042 10,590
3 Years NA NA
NA NA
NA NA
NA NA
NA NA
NA NA5 Years
Since Inception 8.72 10.19 6.60 11,736 12,043 11,303
PeriodCAGR (%)
Value of lumpsum investment of 10,000/- ₹invested on inception date
stAbove returns are as on 31 December, 2020. Different plans shall have a different expense structure. The performance details provided herein are of Regular plan - Growth
option. Mr. Marzban Irani is managing the above scheme from 1st February, 2019 and total no. of schemes managed by him is 10. Also, Mr. Sanjay Pawar is co managing the
above scheme from 1st September, 2020 and total no. of schemes managed by him is 2. Past performance may or may not be sustained in the future. Load is not taken into
consideration for computation of performance. Date of allotment is 1st Feb '2019, hence returns are available for 1 yr & since inception. The Mutual Fund is not guaranteeing or
promising or forecasting any returns. * Benchmark, ** Additional Benchmark.
Co-Fund Manager:Name: Mr. Sanjay PawarExperience: 9+ years
Factsheet January, 2021
Corporate Debt
Non-Convertible Debentures
Housing & Urban Development Corp Ltd. FITCH AAA 8.01%
NABARD ICRA AAA 7.23%
HDFC Ltd. CRISIL AAA 7.19%
Indian Oil Co Ltd. CRISIL AAA 5.50%
REC Ltd. CRISIL AAA 4.76%
NTPC Ltd. CRISIL AAA 3.37%
Small Industries Development Bk of India ICRA AAA 3.11%
Reliance Industries Ltd. CRISIL AAA 2.45%
Indian Railway Finance Co Ltd. CRISIL AAA 2.42%
Power Grid Co of India Ltd. CRISIL AAA 1.76%
Power Finance Co Ltd. CRISIL AAA 1.65%
Export Import Bank of India CRISIL AAA 1.65%
L&T Infra Debt Fund Ltd. CRISIL AAA 1.63%
India Infradebt Ltd. ICRA AAA 1.58%
National Housing Bank CRISIL AAA 0.80%
State Bank of India CRISIL AAA 0.77%
Non-Convertible Debentures Total 53.88%
Corporate Debt Total 53.88%
Money Market InstrumentsCertificate of Deposit
Kotak Mahindra Bank Ltd. CRISIL A1+ 7.56%
Bank of Baroda FITCH A1+ 3.73%
Axis Bank Ltd. CRISIL A1+ 3.73%
Small Industries Development Bk of India CRISIL A1+ 1.05%
Certificate of Deposit Total 16.07%
Money Market Instruments Total 16.07%
Government Bond & Treasury BillGovernment Bond
5.22% Govt of India Red 15-06-2025 SOV 6.11%
7.32% Govt of India Red 28-01-2024 SOV 5.39%
5.15% Govt of India Red 09-11-2025 SOV 5.34%
6.84% Govt of India Red 19-12-2022 SOV 4.80%
6.18% Govt of India Red 04-11-2024 SOV 2.40%
5.77% Govt of India Red 03-08-2030 SOV 2.30%
7.27% Govt of India Red 08-04-2026 SOV 1.68%
7.17% Govt of India Red 08-01-2028 SOV 0.17%
Government Bond Total 28.19%
Government Bond & Treasury Bill Total 28.19%
Cash & Other Receivables Total 1.86%
Grand Total 100.00%
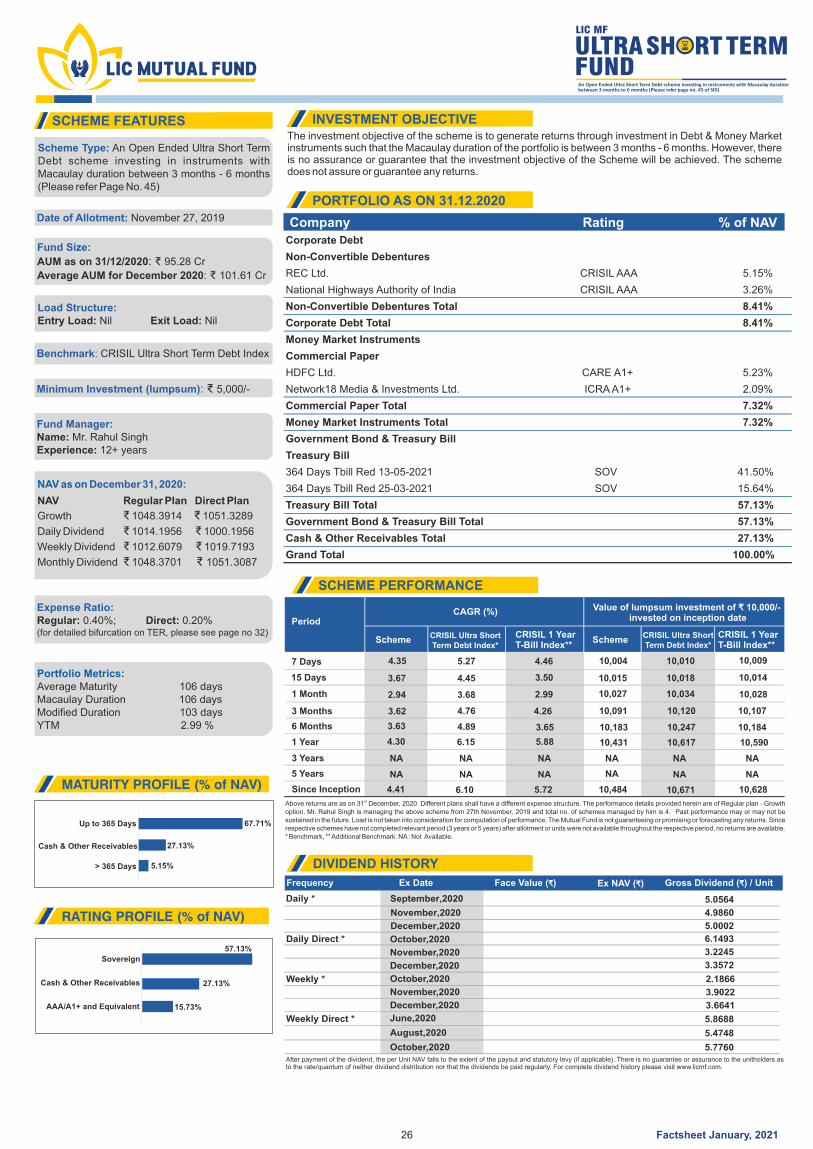
The investment objective of the scheme is to generate returns through investment in Debt & Money Market instruments such that the Macaulay duration of the portfolio is between 3 months - 6 months. However, there is no assurance or guarantee that the investment objective of the Scheme will be achieved. The scheme does not assure or guarantee any returns.
67.71%
27.13%
5.15%
Cash & Other Receivables
> 365 Days
Up to 365 Days
SCHEME FEATURES INVESTMENT OBJECTIVE
PORTFOLIO AS ON 31.12.2020
MATURITY PROFILE (% of NAV)
RATING PROFILE (% of NAV)
Company Rating % of NAV
Scheme Type: An Open Ended Ultra Short Term Debt scheme investing in instruments with Macaulay duration between 3 months - 6 months (Please refer Page No. 45)
Date of Allotment: November 27, 2019
Fund Size:
AUM as on 31/12/2020: ₹ 95.28 Cr
: 101.61 CrAverage AUM for December 2020 ₹
Load Structure:Entry Load: Exit Load: Nil Nil
Benchmark: CRISIL Ultra Short Term Debt Index
Minimum Investment (lumpsum): ₹ 5,000/-
Fund Manager:Name: Mr. Rahul Singh Experience: 12+ years
Expense Ratio:Regular: 0.40%; Direct: 0.20%(for detailed bifurcation on TER, please see page no 32)
Portfolio Metrics:Average Maturity 106 daysMacaulay Duration 106 daysModified Duration 103 daysYTM 2.99 %
26
57.13%
27.13%
AAA/A1+ and Equivalent
Sovereign
NAV as on :December 31, 2020
NAV Regular Plan Direct Plan
Growth ₹ 1048.3914 ₹ 1051.3289
Daily Dividend ₹ 1014.1956 ₹ 1000.1956
Weekly Dividend ₹ 1012.6079 ₹ 1019.7193
Monthly Dividend ₹ 1048.3701 ₹ 1051. 3087
Frequency Ex Date Face Value ( )₹ Ex NAV ( )₹ Gross Dividend ( ) / Unit₹
DIVIDEND HISTORY
After payment of the dividend, the per Unit NAV falls to the extent of the payout and statutory levy (if applicable). There is no guarantee or assurance to the unitholders as to the rate/quantum of neither dividend distribution nor that the dividends be paid regularly. For complete dividend history please visit www.licmf.com.
SCHEME PERFORMANCE
SchemeCRISIL Ultra ShortTerm Debt Index*
CRISIL Ultra ShortTerm Debt Index*
CRISIL 1 Year T-Bill Index**
CRISIL 1 Year T-Bill Index**
Scheme
1 Year
7 Days
3 Years
15 Days
10,431
NA
10,183
10,004
10,015
10,027
10,091
NA
4.30
NA
3.63
4.35
3.67
2.94
3.62
NA
10,617
NA
10,247
10,010
10,018
10,034
10,120
NA
6.15
NA
4.89
5.27
4.45
3.68
4.76
NA
10,590
NA
10,184
10,009
10,014
10,028
10,107
NA
5.88
NA
3.65
4.46
3.50
2.99
4.26
NA5 Years
1 Month
3 Months
6 Months
Since Inception 4.41 6.10 5.72 10,484 10,671 10,628
PeriodCAGR (%)
invested on inception date
stAbove returns are as on 31 December, 2020. Different plans shall have a different expense structure. The performance details provided herein are of Regular plan - Growth option. Mr. Rahul Singh is managing the above scheme from 27th November, 2019 and total no. of schemes managed by him is 4. Past performance may or may not be sustained in the future. Load is not taken into consideration for computation of performance. The Mutual Fund is not guaranteeing or promising or forecasting any returns. Since respective schemes have not completed relevant period (3 years or 5 years) after allotment or units were not available throughout the respective period, no returns are available. * Benchmark, ** Additional Benchmark. NA : Not Available.
Value of lumpsum investment of 10,000/- ₹
Daily *
December,2020 5.0002
Daily Direct *
December,2020
October,2020
3.3572
5.7760
Weekly *
Weekly Direct *
15.73%
Cash & Other Receivables
December,2020 3.6641
An Open Ended Ultra Short Term Debt scheme investing in instruments with Macaulay duration between 3 months to 6 months (Please refer page no. 45 of SID)
June,2020 5.8688
August,2020 5.4748
October,2020 6.1493
September,2020 5.0564
October,2020 2.1866
Factsheet January, 2021
November,2020 3.2245
November,2020 4.9860
November,2020 3.9022
Corporate Debt
Non-Convertible Debentures
REC Ltd. CRISIL AAA 5.15%
National Highways Authority of India CRISIL AAA 3.26%
Non-Convertible Debentures Total 8.41%
Corporate Debt Total 8.41%
Money Market Instruments
Commercial Paper
HDFC Ltd. CARE A1+ 5.23%
Network18 Media & Investments Ltd. ICRA A1+ 2.09%
Commercial Paper Total 7.32%
Money Market Instruments Total 7.32%
Government Bond & Treasury Bill
Treasury Bill
364 Days Tbill Red 13-05-2021 SOV 41.50%
364 Days Tbill Red 25-03-2021 SOV 15.64%
Treasury Bill Total 57.13%
Government Bond & Treasury Bill Total 57.13%
Cash & Other Receivables Total 27.13%
Grand Total 100.00%

Presenting
Your LIC Premium due dates
No need to remember
MUTUAL FUND INVESTMENTS ARE SUBJECT TO MARKET RISKS, READ ALL SCHEME RELATED DOCUMENTS CAREFULLY.
/LICMutual /company/LICMutual/LICMutual 1800-258-5678Connect with us: www.licmf.com
Eligible schemes for premium deduction
∗
∗
A convenient and better way to pay your
LIC Premium through LIC Mutual Fund
Ÿ Regular income for short termŸ Investment in debt / money market instruments with
maturity of upto 91 days. Ÿ Risk - Low to Moderate
Ÿ Regular Income for short termŸ A fund that focuses on low duration securities.Ÿ Risk - Moderate to Moderate
Please go through the terms and conditions on the mandate form carefully before registering. For further details, consult your financial advisor or nearest LIC MF branch.
Ÿ Invest in LIC MF Schemes (Liquid Fund, Savings Fund or Banking &
PSU Debt Fund under Growth Option) in your name.
Ÿ To register for Auto-SWP Facility, fill up the mandate form completely.
Ÿ Submit the mandate form to the LIC MF Investor Service Centre
Ÿ Premiums for the registered LIC policies will be directly paid to LIC from your LIC
MF Schemes.
Ÿ Once registered, no hassle to remember due dates of various policies.
Ÿ Risk of policy lapsation is eliminated.
Ÿ Avail benefit of a grace period too.
Ÿ Periodic SMS/ Email alert to the investor.
Low
Low toModerate
Moderate ModeratelyHigh
High
Very High
RISKOMETER HIGHLOW
Investors understand that their principalwill be at Moderate risk
Low
Low toModerate
Moderate ModeratelyHigh
High
Very High
RISKOMETER HIGHLOW
Investors understand that their principalwill be at Low to Moderate risk
Ÿ Regular income for medium term capital appreciation with current income
Ÿ An income fund that invests predominantly in debt and money market instruments issued by Banks, Public Sector Undertakings, Public Financial Institutions and Municipal Bonds.
Ÿ Risk - Moderate

The investment objective of the Scheme is to generate income by investing in a portfolio of quality short term debt securities. However, there is no assurance that the investment objective of the Schemes will be realized.
Frequency Ex Date Face Value ( )₹ Ex NAV ( )₹ Gross Dividend ( ) / Unit₹
Daily *
Daily Direct *
December,2020 0.0270
Weekly *
December,2020 0.0274
Weekly Direct *
March,2020
May,2019
0.0056
0.0641
Monthly 10.0000
September 29, 2020 10.0000
10.0000
10.6050 0.0600
Monthly Direct July 24, 2013 10.0000 10.0500 0.0025
August 27, 2013 10.0000 10.1434 0.0913
September 1, 2013 10.0000 10.0631 0.1319
41.91%
36.88%
19.56%
1.64%
Up to 91 days
> 365 Days
> 91 days up to 365 Days
Cash & Other Receivables
SCHEME FEATURES INVESTMENT OBJECTIVE
PORTFOLIO AS ON 31.12.2020
SCHEME PERFORMANCE
MATURITY PROFILE (% of NAV)
RATING PROFILE (% of NAV)DIVIDEND HISTORY
65.10%
32.16%
1.64%
AAA/A1+ and Equivalent
Sovereign
Cash & Other Receivables
SchemeCRISIL Low
Duration Debt Index*CRISIL Low
Duration Debt Index*CRISIL 1 Year T-Bill Index**
CRISIL 1 Year T-Bill Index**
Scheme
1 Year
6 Months
3 Months
1 Month
15 Days
7 Days
6.96
6.60
4.90
2.36
3.78
5.26
7.45
5.94
5.99
3.45
4.34
4.99
5.88
3.65
4.26
2.99
3.50
4.46
10,697
10,332
10,123
10,022
10,016
10,010
10,747
10,300
10,151
10,032
10,018
10,010
10,59010,184
10,107
10,028
10,014
10,009
3 Years 5.86 7.91 6.76 11,870 12,574 12,176
5 Years 6.47 7.91 6.68 13,689 14,637 13,823
Since Inception 6.65 7.37 6.06 30,981 34,912 28,142
PeriodCAGR (%)
Value of lumpsum investment of 10,000/- ₹invested on inception date
stAbove returns are as on 31 December, 2020. Different plans shall have a different expense structure. The performance details provided herein are of Regular plan - Growth option. Mr. Rahul Singh is managing the above scheme from 7th September, 2015 and total no. of schemes managed by him is 4. Past performance may or may not be sustained in the future. Load is not taken into consideration for computation of performance. The Mutual Fund is not guaranteeing or promising or forecasting any returns. *Benchmark, **Additional Benchmark.
* Dividend under Daily and Weekly Plan are cumulative dividend declared during the month. After payment of the dividend, the per Unit NAV falls to the extent of the payout and statutory levy (if applicable). There is no guarantee or assurance to the unitholders as to the rate/quantum of neither dividend distribution nor that the dividends be paid regularly. For complete dividend history please visit www.licmf.com.
Scheme Type: An open ended low duration debt scheme investing in instruments with Macaulay Duration of the portfolio is between 6 months and 12 months (please refer page no 27 of SID)
Date of Allotment: June 09, 2003
Fund Size:
AUM as on 31/12/2020: ₹ 955.39 Cr: ₹1,048.71 CrAverage AUM for December 2020
Load Structure:Entry Load: Nil Exit Load: Nil, w.e.f. 15th October 2019
Benchmark: CRISIL Low Duration Debt Index
Minimum Investment (lumpsum): ₹ 5,000/-
Fund Manager:Name: Mr. Rahul Singh
12+ yearsExperience:
Expense Ratio:Regular: 0.83%; Direct: 0.29%(for detailed bifurcation on TER, please see page no 32)
Portfolio Metrics:Average Maturity 271 daysMacaulay Duration 262 daysModified Duration 251 daysYTM 3.62 %
NAV as on :December 31, 2020
NAV Regular Plan Direct Plan
Growth ₹ 30.9808 ₹ 32.6828
Daily Dividend ₹ 10.4547 ₹ 10.1000
Weekly Dividend ₹ 10.8119 ₹ 11.3908
Monthly Dividend ₹ 10.7398 ₹ 17. 0774
28
Valuation haircut deviation. The details available on AMC Website under the link:https://www.licmf.com/assets/pdf/statuary_disclosure_new/38/1561125176-Update-on-Exposures-in-Dewan-Housing-F inance-Corporat ion-L imi ted-(DHFL)-21.06.2019.pdf
Security Desc
11.55% DEWAN
HSG FIN 12-09-19
P 12-09-17
Face Value Receivable 2,500.00
Interest Receivable 128.95
Total Receivable 2,628.95
% of NAV as on 31.12.2020 2.75%
Securities in default beyond its maturity date:
# Disclaimer
# Disclaimer
February,2020 0.0287
December,2020 0.0230
1.10%AA+/AA
Company CompanyRating Rating% of NAV % of NAV
0.0600July 29, 2020 10.6709
0.060010.6351August 27, 2020
October,2020 0.0582
October,2020 0.0561
October,2020 0.0618
Factsheet January, 2021
November,2020 0.0520
November,2020 0.0437
November,2020 0.0431
Corporate Debt
Non-Convertible Debentures
HDFC Ltd. CRISIL AAA 8.48%
Bajaj Finance Ltd. CRISIL AAA 5.43%
REC Ltd. CRISIL AAA 4.77%
National Housing Bank CRISIL AAA 2.79%
National Highways Authority of India CRISIL AAA 2.38%
HDB Financial Services Ltd. CRISIL AAA 1.70%
State Bank of India - AdditionalTier I Bonds (Under Basel III)
CRISIL AA+ 0.98%
Mahindra & Mahindra Fin Serv Ltd. CARE AAA 0.58%
Power Finance Co Ltd. CRISIL AAA 0.36%
HDFC Bank Ltd. - AdditionalTier I Bonds (Under Basel III)
CRISIL AA+ 0.13%
Non-Convertible Debentures Total 27.61%
Corporate Debt Total 27.61%
Money Market Instruments
Certificate of Deposit
Bank of Baroda FITCH A1+ 7.75%
Export Import Bank of India CARE A1+ 5.20%
Axis Bank Ltd. CRISIL A1+ 2.53%
Certificate of Deposit Total 15.49%
Commercial Paper
Hero Fincorp Ltd. CRISIL A1+ 5.14%
Tata Motors Finance Ltd. ICRA A1+ 5.01%
Berger Paints (I) Ltd. CRISIL A1+ 2.61%
Larsen & Toubro Ltd. CRISIL A1+ 2.60%
Reliance Industries Ltd. CRISIL A1+ 2.58%
Power Finance Co Ltd. CRISIL A1+ 2.56%
HDFC Ltd. CARE A1+ 1.57%
Network18 Media & Investments Ltd. ICRA A1+ 1.04%
Commercial Paper Total 23.10%
Money Market Instruments Total 38.59%
Government Bond & Treasury Bill
Treasury Bill
364 Days Tbill Red 13-05-2021 SOV 16.56%
182 Days Tbill Red 25-03-2021 SOV 10.40%
182 Days Tbill Red 04-03-2021 SOV 5.21%
Treasury Bill Total 32.16%
Government Bond & Treasury Bill Total 32.16%
Cash & Other Receivables Total 1.64%
Grand Total 100.00%
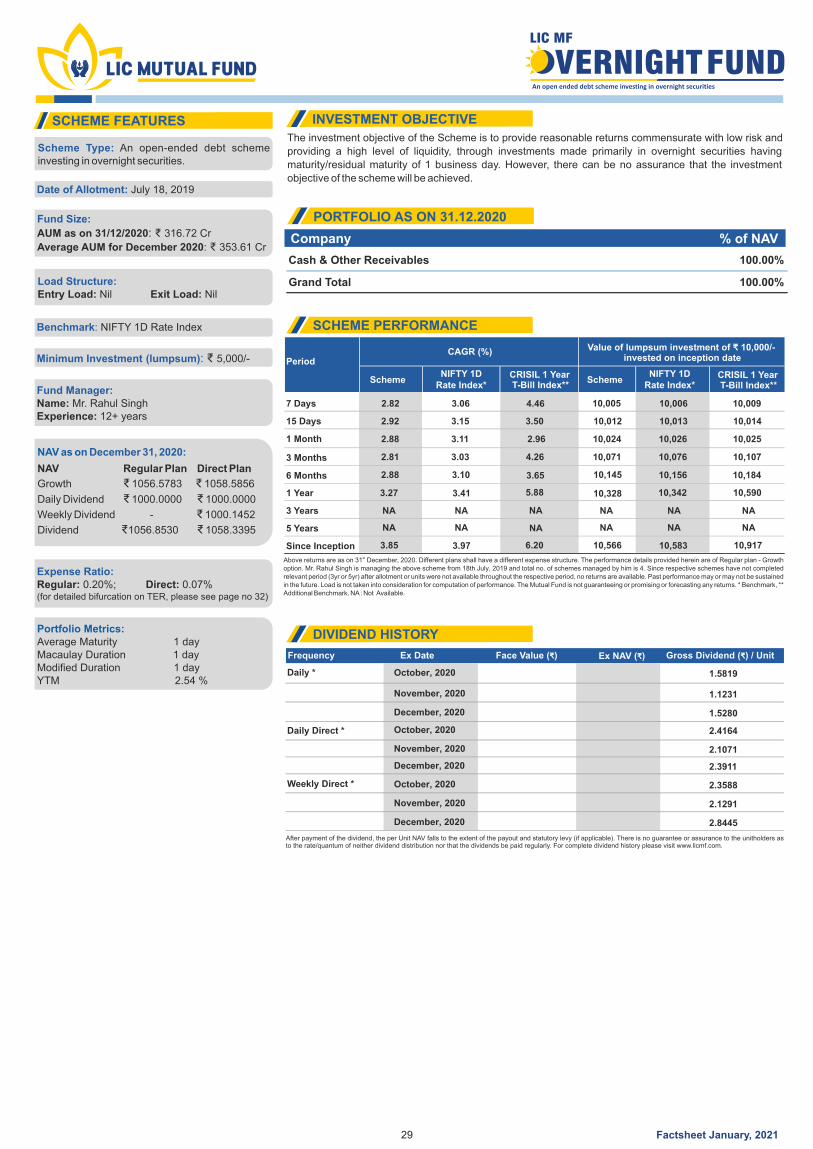
The investment objective of the Scheme is to provide reasonable returns commensurate with low risk and
providing a high level of liquidity, through investments made primarily in overnight securities having
maturity/residual maturity of 1 business day. However, there can be no assurance that the investment
objective of the scheme will be achieved.
SCHEME FEATURES INVESTMENT OBJECTIVE
PORTFOLIO AS ON 31.12.2020
Company % of NAV
Scheme Type: An open-ended debt scheme investing in overnight securities.
Date of Allotment: July 18, 2019
Fund Size:
AUM as on 31/12/2020: ₹ 316.72 Cr
: 353.61 CrAverage AUM for December 2020 ₹
Load Structure:Entry Load: Exit Load: Nil Nil
Benchmark: NIFTY 1D Rate Index
Minimum Investment (lumpsum): ₹ 5,000/-
Fund Manager:Name: Mr. Rahul Singh
12+ yearsExperience:
Expense Ratio:Regular: 0.20%; Direct: 0.07%(for detailed bifurcation on TER, please see page no 32)
Portfolio Metrics:Average Maturity 1 dayMacaulay Duration 1 dayModified Duration 1 dayYTM 2.54 %
29
An open ended debt scheme investing in overnight securities
LIC MF
FUNDVERNIGHT
NAV as on :December 31, 2020
NAV Regular Plan Direct Plan
Growth ₹ 1056.5783 ₹ 1058.5856
Daily Dividend ₹ 1000.0000 ₹ 1000.0000
Weekly Dividend - ₹ 1000.1452
Dividend ₹1056.8530 ₹ 1058.3395
Frequency Ex Date Face Value ( )₹ Ex NAV ( )₹ Gross Dividend ( ) / Unit₹
Daily *
Daily Direct *
Weekly Direct *
December, 2020
December, 2020
December, 2020
1.5280
2.8445
2.3911
DIVIDEND HISTORY
After payment of the dividend, the per Unit NAV falls to the extent of the payout and statutory levy (if applicable). There is no guarantee or assurance to the unitholders as to the rate/quantum of neither dividend distribution nor that the dividends be paid regularly. For complete dividend history please visit www.licmf.com.
SCHEME PERFORMANCE
SchemeNIFTY 1D
Rate Index*NIFTY 1D
Rate Index*CRISIL 1 Year T-Bill Index**
CRISIL 1 Year T-Bill Index**
Scheme
1 Year
7 Days 2.82 3.06 4.46 10,005 10,006 10,009
3 Years
15 Days 2.92 10,012
10,024
10,071
10,328
NA
10,145
NA
2.88
2.81
3.27
NA
2.88
NA
3.15 10,013
10,026
10,076
10,342
NA
10,156
NA
3.11
3.03
3.41
NA
3.10
NA
3.50 10,014
10,025
10,107
10,590
NA
10,184
NA
2.96
4.26
5.88
NA
3.65
NA5 Years
1 Month
3 Months
6 Months
Since Inception 3.85 3.97 6.20 10,566 10,583 10,917
PeriodCAGR (%)
invested on inception date
stAbove returns are as on 31 December, 2020. Different plans shall have a different expense structure. The performance details provided herein are of Regular plan - Growth option. Mr. Rahul Singh is managing the above scheme from 18th July, 2019 and total no. of schemes managed by him is 4. Since respective schemes have not completed relevant period (3yr or 5yr) after allotment or units were not available throughout the respective period, no returns are available. Past performance may or may not be sustained in the future. Load is not taken into consideration for computation of performance. The Mutual Fund is not guaranteeing or promising or forecasting any returns. * Benchmark, ** Additional Benchmark. NA : Not Available.
Value of lumpsum investment of 10,000/- ₹
75.57%
24.43%Up to 365 days
Cash & Other Receivables
75.57%
24.43%AAA/A1+ and Equivalent
Cash & Other Receivables
MATURITY PROFILE (% of NAV)
RATING PROFILE (% of NAV)
Cash & Other Receivables 100.00%
Grand Total 100.00%
October, 2020 2.4164
October, 2020 2.3588
October, 2020 1.5819
Factsheet January, 2021
November, 2020 1.1231
November, 2020 2.1291
November, 2020 2.1071

An open ended scheme which seeks to generate reasonable returns with low risk and high liquidity through
judicious mix of investment in money market instruments and quality debt instruments. However, there is no
assurance that the investment objective of the Schemes will be realized.
Frequency Ex Date Face Value ( )₹ Ex NAV ( )₹ Gross Dividend ( ) / Unit₹
Daily *
December, 2020 2.6787
Daily Direct *
December, 2020 2.8095
46.34%
36.02%
Up to 60 days
> 60 Days
SCHEME FEATURES INVESTMENT OBJECTIVE
PORTFOLIO AS ON 31.12.2020
SCHEME PERFORMANCE
DIVIDEND HISTORY
MATURITY PROFILE (% of NAV)
RATING PROFILE (% of NAV)
36.02%
35.41%AAA/A1+ and Equivalent
Sovereign
Cash & Other Receivables
28.56%
SchemeCRISIL Liquid Fund Index*
CRISIL Liquid Fund Index*
CRISIL 1 Year T-Bill Index**
CRISIL 1 Year T-Bill Index**
Scheme
1 Year
7 Days
4.27
3.42
4.60
3.62
5.88
4.46
10,428
10,007
10,461
10,007
10,590
10,009
3 Years
15 Days
6.02
3.25
6.34
3.58
6.77
3.50
11,919
10,013
12,026
10,015
12,172
10,014
5 Years
1 Month
3 Months
6 Months
6.45
2.88
3.06
3.14
6.63
3.26
3.60
3.79
6.68
2.96
4.26
3.65
13,673
10,024
10,077
10,159
13,788
10,028
10,091
10,191
13,823
10,025
10,107
10,184
Since Inception 7.17 NA 6.09 36,743 NA 30,382
PeriodCAGR (%)
invested on inception date
stAbove returns are as on 31 December, 2020. Different plans shall have a different expense structure. The performance details provided herein are of Regular plan - Growth option. Mr. Rahul Singh is managing the above scheme from 5th October, 2015 and total no. of schemes managed by him is 4. Past performance may or may not be sustained in the future. Load is not taken into consideration for computation of performance. The Mutual Fund is not guaranteeing or promising or forecasting any returns. As the scheme was launched before the launch of the benchmark index, benchmark index figures since inception or the required period are not available. * Benchmark, ** Additional Benchmark. NA : Not Available.
* Dividend under Daily and Weekly Plan are cumulative dividend declared during the month. After payment of the dividend, the per Unit NAV falls to the extent of the payout and statutory levy (if applicable). There is no guarantee or assurance to the unitholders as to the rate/quantum of neither dividend distribution nor that the dividends be paid regularly. For complete dividend history please visit www.licmf.com.
Scheme Type: An open-ended liquid scheme
Date of Allotment: March 18, 2002
Fund Size:
AUM as on 31/12/2020: ₹ 6,406.82 Cr: ₹ 6,405.13 CrAverage AUM for December 2020
Load Structure:Entry Load: Nil Exit Load:
Benchmark: Crisil Liquid Fund Index
Minimum Investment (lumpsum): ₹ 5,000/-
Fund Manager:Name: Mr. Rahul Singh
12+ yearsExperience:
Expense Ratio:Regular: 0.25%; Direct: 0.11%(for detailed bifurcation on TER, please see page no 32)
Portfolio Metrics:Average Maturity 32 daysMacaulay Duration 32 daysModified Duration 31 daysYTM 2.99 %
NAV as on :December 31, 2020
NAV Regular Plan Direct Plan
Growth ₹ 3674.2913 ₹ 3706.7438
Dividend ₹ 1098.0000 ₹ 1098.0000
30
Company CompanyRating Rating% of NAV % of NAV
Value of lumpsum investment of 10,000/- ₹
Investor exit uponSubscription
Exit load as a % ofredemption / switch out
proceeds
Day 1 0.0070%
Day 2 0.0065%
Day 3 0.0060%
Day 4 0.0055%
Day 5 0.0050%
Day 6 0.0045%
Day 7 onwards 0.0000%
w.e.f. 20th October 2019
October, 2020 3.0956
October, 2020 2.9779
17.63%
Cash & Other Receivables
Factsheet January, 2021
November, 2020 2.9023
November, 2020 2.7773
Money Market Instruments
Certificate of Deposit
ICICI Bank Ltd. CARE A1+ 1.95%
NABARD CRISIL A1+ 1.95%
Small Industries Devl Bk of India CRISIL A1+ 1.17%
Axis Bank Ltd. CRISIL A1+ 0.78%
Certificate of Deposit Total 5.84%
Commercial Paper
Axis Finance Ltd. FITCH A1+ 5.44%
Birla Group Holdings Pvt Ltd. CRISIL A1+ 4.63%
Larsen & Toubro Ltd. CRISIL A1+ 4.28%
Reliance Retail Ventures Ltd. CRISIL A1+ 3.12%
Chennai Petroleum Co Ltd. ICRA A1+ 3.11%
NABARD CRISIL A1+ 2.72%
HDFC Ltd. CARE A1+ 2.03%
Chambal Fertilizers & Chem Ltd. CRISIL A1+ 1.56%
Sundaram Home Finance Ltd. CRISIL A1+ 1.55%
Network18 Media & InvestmentsLtd.
ICRA A1+0.75%
Berger Paints (I) Ltd. CRISIL A1+0.39%
Commercial Paper Total 29.57%
Money Market Instruments Total 35.41%
Government Bond & Treasury Bill
Treasury Bill
91 Days Tbill Red 04-02-2021 SOV 6.23%
91 Days Tbill Red 25-03-2021 SOV 5.56%
182 Days Tbill Red 18-02-2021 SOV 5.44%
91 Days Tbill Red 11-02-2021 SOV 3.89%
91 Days Tbill Red 01-04-2021 SOV 3.10%
91 Days Tbill Red 11-03-2021 SOV 2.33%
364 Days Tbill Red 25-03-2021 SOV 2.02%
Treasury Bill Total 28.56%
Government Bond & Treasury Bill Total 28.56%
Cash & Other Receivables 36.02%
Grand Total 100.00%
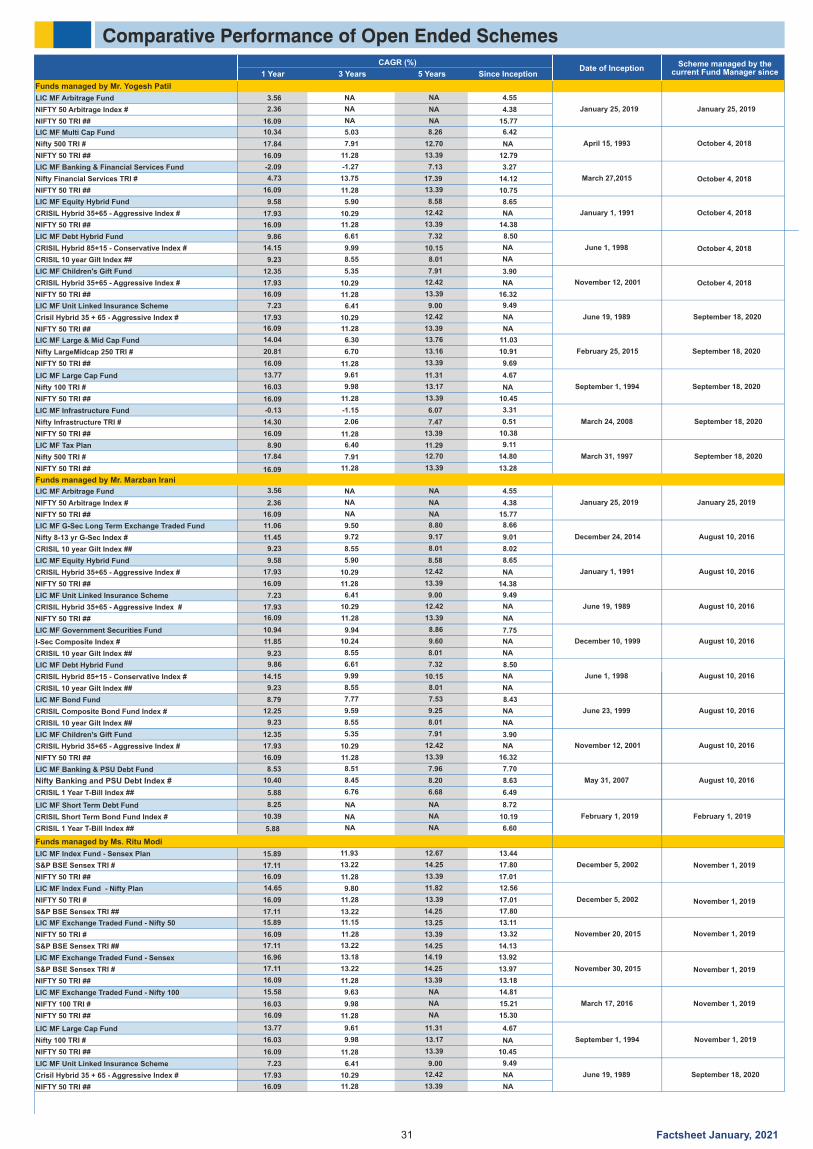
Comparative Performance of Open Ended Schemes
1 Year 3 Years 5 Years Since Inception
LIC MF Multi Cap Fund
LIC MF Arbitrage Fund
LIC MF Arbitrage Fund
10.34
3.56
3.56
5.03
NA
NA
6.42
4.55
4.55
8.26
NA
NA
Nifty 500 TRI #
NIFTY 50 Arbitrage Index #
NIFTY 50 Arbitrage Index #
17.84
2.36
2.36
7.91
NA
NA
NA
4.38
4.38
12.70
NA
NA
NIFTY 50 TRI ##
NIFTY 50 TRI ##
NIFTY 50 TRI ##
16.09
16.09
16.09
11.28
NA
NA
12.79
15.77
15.77
13.39
NA
NA
LIC MF Banking & Financial Services Fund -2.09 7.13-1.27 3.27
Nifty Financial Services TRI # 4.73 17.3913.75 14.12
NIFTY 50 TRI ## 16.09 13.3911.28 10.75
LIC MF Index Fund - Sensex Plan 15.89 11.93 13.4412.67
S&P BSE Sensex TRI # 17.11 13.22 17.8014.25
NIFTY 50 TRI ## 16.09 11.28 17.0113.39
LIC MF Index Fund - Nifty Plan 14.65 9.80 12.5611.82
NIFTY 50 TRI # 16.09 11.28 17.0113.39
S&P BSE Sensex TRI ## 17.11 13.22 17.8014.25
LIC MF Equity Hybrid Fund 9.58 5.90 8.658.58
CRISIL Hybrid 35+65 - Aggressive Index # 17.93 10.29 NA12.42
NIFTY 50 TRI ## 16.09 11.28 14.3813.39
LIC MF Debt Hybrid Fund 9.86 6.61 8.507.32
CRISIL Hybrid 85+15 - Conservative Index # 14.15 9.99 NA10.15
CRISIL 10 year Gilt Index ## 9.23 8.55 NA8.01
LIC MF Children's Gift Fund 12.35 5.35 3.907.91
CRISIL Hybrid 35+65 - Aggressive Index # 17.93 10.29 NA12.42
NIFTY 50 TRI ## 16.09 11.28 16.3213.39
LIC MF G-Sec Long Term Exchange Traded Fund 11.06 9.50 8.668.80
Nifty 8-13 yr G-Sec Index # 11.45 9.72 9.019.17
CRISIL 10 year Gilt Index ## 9.23 8.55 8.028.01
LIC MF Equity Hybrid Fund 9.58 5.90 8.658.58
CRISIL Hybrid 35+65 - Aggressive Index # 17.93 10.29 NA12.42
NIFTY 50 TRI ## 16.09 11.28 14.3813.39
LIC MF Unit Linked Insurance Scheme 7.23 6.41 9.499.00
CRISIL Hybrid 35+65 - Aggressive Index # 17.93 10.29 NA12.42
NIFTY 50 TRI ## 16.09 11.28 NA13.39
LIC MF Government Securities Fund 10.94 9.94 7.758.86
I-Sec Composite Index # 11.85 10.24 NA9.60
CRISIL 10 year Gilt Index ## 9.23 8.55 NA8.01
LIC MF Debt Hybrid Fund 9.86 6.61 8.507.32
CRISIL Hybrid 85+15 - Conservative Index # 14.15 9.99 NA10.15
CRISIL 10 year Gilt Index ## 9.23 8.55 NA8.01
LIC MF Bond Fund 8.79 7.77 8.437.53
CRISIL Composite Bond Fund Index # 12.25 9.59 NA9.25
CRISIL 10 year Gilt Index ## 9.23 8.55 NA8.01
LIC MF Children's Gift Fund 12.35 5.35 3.907.91
CRISIL Hybrid 35+65 - Aggressive Index # 17.93 10.29 NA12.42
NIFTY 50 TRI ## 16.09 11.28 16.3213.39
LIC MF Banking & PSU Debt Fund 8.53 8.51 7.707.96
Nifty Banking and PSU Debt Index # 10.40 8.45 8.638.20
CRISIL 1 Year T-Bill Index ## 5.88 6.76 6.496.68
LIC MF Large Cap Fund 13.77 9.61 4.6711.31
Nifty 100 TRI # 16.03 9.98 NA13.17
NIFTY 50 TRI ## 16.09 11.28 10.4513.39
LIC MF Large & Mid Cap Fund 14.04 6.30 11.0313.76
Nifty LargeMidcap 250 TRI # 20.81 6.70 10.9113.16
NIFTY 50 TRI ## 16.09 11.28 9.6913.39
LIC MF Infrastructure Fund -0.13 -1.15 3.316.07
Nifty Infrastructure TRI # 14.30 2.06 0.517.47
NIFTY 50 TRI ## 16.09 11.28 10.3813.39
LIC MF Tax Plan 8.90 6.40 9.1111.29
Nifty 500 TRI # 17.84 7.91 14.8012.70
NIFTY 50 TRI ## 16.09 11.28 13.2813.39
LIC MF Exchange Traded Fund - Nifty 50 15.89 11.15 13.1113.25
NIFTY 50 TRI # 16.09 11.28 13.3213.39
S&P BSE Sensex TRI ## 17.11 13.22 14.1314.25
LIC MF Exchange Traded Fund - Sensex 16.96 13.18 13.9214.19
S&P BSE Sensex TRI # 17.11 13.22 13.9714.25
NIFTY 50 TRI ## 16.09 11.28 13.1813.39
LIC MF Exchange Traded Fund - Nifty 100 15.58 9.63 14.81NA
NIFTY 100 TRI # 16.03 9.98 15.21NA
NIFTY 50 TRI ## 16.09 11.28 15.30NA
LIC MF Unit Linked Insurance Scheme 7.23 6.41 9.499.00
Crisil Hybrid 35 + 65 - Aggressive Index # 17.93 10.29 NA12.42
NIFTY 50 TRI ## 16.09 11.28 NA13.39
CAGR (%)
September 18, 2020
September 18, 2020
August 10, 2016
August 10, 2016
August 10, 2016
September 18, 2020
September 18, 2020
September 18, 2020
Funds managed by Ms. Ritu Modi
August 10, 2016
August 10, 2016
August 10, 2016
August 10, 2016
August 10, 2016
November 12, 2001
May 31, 2007
September 1, 1994
February 25, 2015
December 24, 2014
January 1, 1991
June 19, 1989
December 10, 1999
Scheme managed by the current Fund Manager since
October 4, 2018
January 25, 2019
January 25, 2019
October 4, 2018
November 1, 2019
November 1, 2019
November 1, 2019
November 1, 2019
November 1, 2019
October 4, 2018
October 4, 2018
October 4, 2018
Funds managed by Mr. Yogesh Patil
March 24, 2008
March 31, 1997
November 20, 2015
November 30, 2015
March 17, 2016
June 19, 1989
June 23, 1999
Date of Inception
April 15, 1993
January 25, 2019
January 25, 2019
June 1, 1998
March 27,2015
December 5, 2002
December 5, 2002
January 1, 1991
June 1, 1998
November 12, 2001
Funds managed by Mr. Marzban Irani
LIC MF Short Term Debt Fund 8.25 NA 8.72NA
CRISIL Short Term Bond Fund Index # 10.39 NA 10.19NA
CRISIL 1 Year T-Bill Index ## 5.88 NA 6.60NA
February 1, 2019February 1, 2019
31 Factsheet October, 2020
LIC MF Large Cap Fund 13.77 9.61 4.6711.31
Nifty 100 TRI # 16.03 9.98 NA13.17
NIFTY 50 TRI ## 16.09 11.28 10.4513.39
November 1, 2019September 1, 1994
LIC MF Unit Linked Insurance Scheme 7.23 6.41 9.499.00
Crisil Hybrid 35 + 65 - Aggressive Index # 17.93 10.29 NA12.42
NIFTY 50 TRI ## 16.09 11.28 NA13.39
September 18, 2020June 19, 1989
31 Factsheet January, 2021
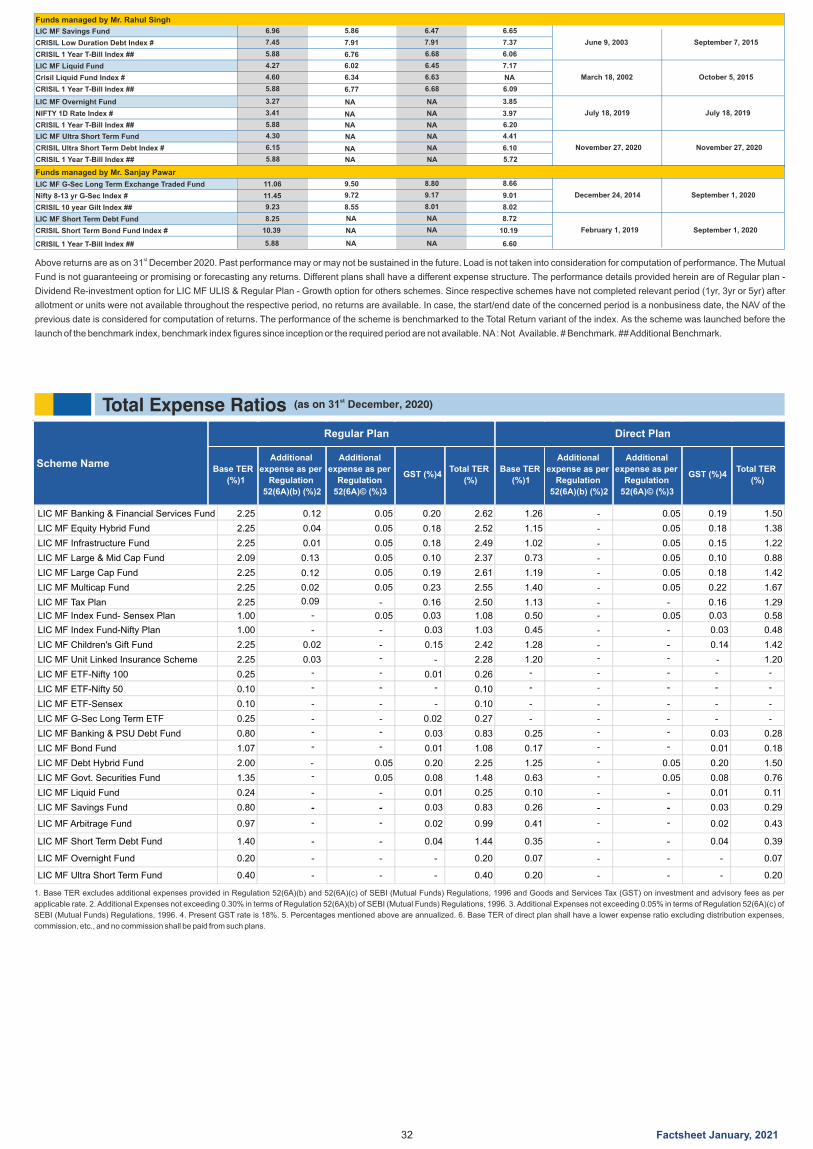
stAbove returns are as on 31 December 2020. Past performance may or may not be sustained in the future. Load is not taken into consideration for computation of performance. The Mutual
Fund is not guaranteeing or promising or forecasting any returns. Different plans shall have a different expense structure. The performance details provided herein are of Regular plan -
Dividend Re-investment option for LIC MF ULIS & Regular Plan - Growth option for others schemes. Since respective schemes have not completed relevant period (1yr, 3yr or 5yr) after
allotment or units were not available throughout the respective period, no returns are available. In case, the start/end date of the concerned period is a nonbusiness date, the NAV of the
previous date is considered for computation of returns. The performance of the scheme is benchmarked to the Total Return variant of the index. As the scheme was launched before the
launch of the benchmark index, benchmark index figures since inception or the required period are not available. NA : Not Available. # Benchmark. ## Additional Benchmark.
Total Expense Ratios st(as on 31 December, 2020)
1. Base TER excludes additional expenses provided in Regulation 52(6A)(b) and 52(6A)(c) of SEBI (Mutual Funds) Regulations, 1996 and Goods and Services Tax (GST) on investment and advisory fees as per
applicable rate. 2. Additional Expenses not exceeding 0.30% in terms of Regulation 52(6A)(b) of SEBI (Mutual Funds) Regulations, 1996. 3. Additional Expenses not exceeding 0.05% in terms of Regulation 52(6A)(c) of
SEBI (Mutual Funds) Regulations, 1996. 4. Present GST rate is 18%. 5. Percentages mentioned above are annualized. 6. Base TER of direct plan shall have a lower expense ratio excluding distribution expenses,
commission, etc., and no commission shall be paid from such plans.
Scheme NameBase TER
(%)1
Additional
expense as per
Regulation
52(6A)(b) (%)2
Additional
expense as per
Regulation
52(6A)© (%)3
GST (%)4Total TER
(%)
Base TER
(%)1
Additional
expense as per
Regulation
52(6A)(b) (%)2
Additional
expense as per
Regulation
52(6A)© (%)3
GST (%)4Total TER
(%)
Regular Plan Direct Plan
LIC MF Banking & Financial Services Fund 2.25 0.12 0.05
0.20 2.62
1.26 - 0.05 0.19 1.50
LIC MF Equity Hybrid Fund 2.25 0.04
0.05
0.18
2.52
1.15
- 0.05 0.18 1.38
LIC MF Infrastructure Fund 2.25 0.01
0.05
0.18
2.49
1.02
- 0.05 0.15 1.22
LIC MF Large & Mid Cap Fund 2.09
0.13
0.12
0.09
0.05
0.10
2.37
0.73
- 0.05 0.10 0.88
LIC MF Large Cap Fund 2.25
0.05
0.19
2.61
1.19
- 0.05 0.18 1.42
LIC MF Multicap Fund 2.25 0.02
0.05
0.23
2.55
1.40
- 0.05 0.22 1.67
LIC MF Tax Plan 2.25
-
0.16
2.50
1.13
- - 0.16 1.29
LIC MF Index Fund- Sensex Plan 1.00
- 0.03
0.05
1.08
0.50
- 0.030.05 0.58
LIC MF Index Fund-Nifty Plan 1.00
-
- 0.03
1.03
0.45
- - 0.03 0.48
LIC MF Children's Gift Fund 2.25 0.02
-
0.15
2.42
1.28
- - 0.14 1.42
LIC MF Unit Linked Insurance Scheme 2.25 0.03
-
-
2.28
1.20
- - - 1.20
LIC MF ETF-Nifty 100 0.25
-
- 0.01
0.26
-
- - - -
LIC MF ETF-Nifty 50 0.10
-
- -
0.10
-
- - - -
LIC MF ETF-Sensex 0.10 - - - 0.10 - - - - -
LIC MF G-Sec Long Term ETF 0.25 - - 0.02 0.27 - - - - -
LIC MF Banking & PSU Debt Fund 0.80 - - 0.03 0.83 0.25 - - 0.03 0.28
LIC MF Bond Fund 1.07 - - 0.01 1.08 0.17 - - 0.01 0.18
LIC MF Debt Hybrid Fund 2.00 - 0.05 0.20 2.25 1.25 - 0.05 0.20 1.50
LIC MF Govt. Securities Fund 1.35 - 0.05 0.08 1.48 0.63 - 0.05 0.08 0.76
LIC MF Liquid Fund 0.24 -
-
-
-
0.01 0.25 0.10 -
-
-
-
0.01 0.11
LIC MF Savings Fund
LIC MF Arbitrage Fund
LIC MF Short Term Debt Fund
LIC MF Overnight Fund
LIC MF Ultra Short Term Fund
0.80
0.97
1.40
0.20
0.40
-
-
-
-
-
-
-
-
-
-
0.03
0.02
0.04
-
-
0.83
0.99
1.44
0.20
0.40
0.26
0.41
0.35
0.07
0.20
-
-
-
-
-
-
-
-
-
-
0.03
0.02
0.04
-
-
0.29
0.43
0.39
0.07
0.20
32
Funds managed by Mr. Sanjay Pawar
LIC MF Savings Fund 6.96 5.86 6.656.47
CRISIL Low Duration Debt Index # 7.45 7.91 7.377.91
CRISIL 1 Year T-Bill Index ## 5.88 6.76 6.066.68
LIC MF Liquid Fund 4.27 6.02 7.176.45
Crisil Liquid Fund Index # 4.60 6.34 NA6.63
CRISIL 1 Year T-Bill Index ## 5.88 6.77 6.096.68
October 5, 2015
September 7, 2015
Funds managed by Mr. Rahul Singh
June 9, 2003
March 18, 2002
LIC MF Overnight Fund 3.27 3.85
NIFTY 1D Rate Index # 3.41 3.97
CRISIL 1 Year T-Bill Index ## 5.88 6.20
July 18, 2019
NA NA
NA NA
NA NA
July 18, 2019
LIC MF G-Sec Long Term Exchange Traded Fund 11.06 9.50 8.668.80
Nifty 8-13 yr G-Sec Index # 11.45 9.72 9.019.17
CRISIL 10 year Gilt Index ## 9.23 8.55 8.028.01
September 1, 2020December 24, 2014
LIC MF Short Term Debt Fund 8.25 NA 8.72NA
CRISIL Short Term Bond Fund Index # 10.39 NA 10.19NA
CRISIL 1 Year T-Bill Index ## 5.88 NA 6.60NA
September 1, 2020February 1, 2019
LIC MF Ultra Short Term Fund 4.30 4.41
CRISIL Ultra Short Term Debt Index # 6.15 6.10
CRISIL 1 Year T-Bill Index ## 5.88 5.72
November 27, 2020
NA NA
NA NA
NA NA
November 27, 2020
Factsheet January, 2021
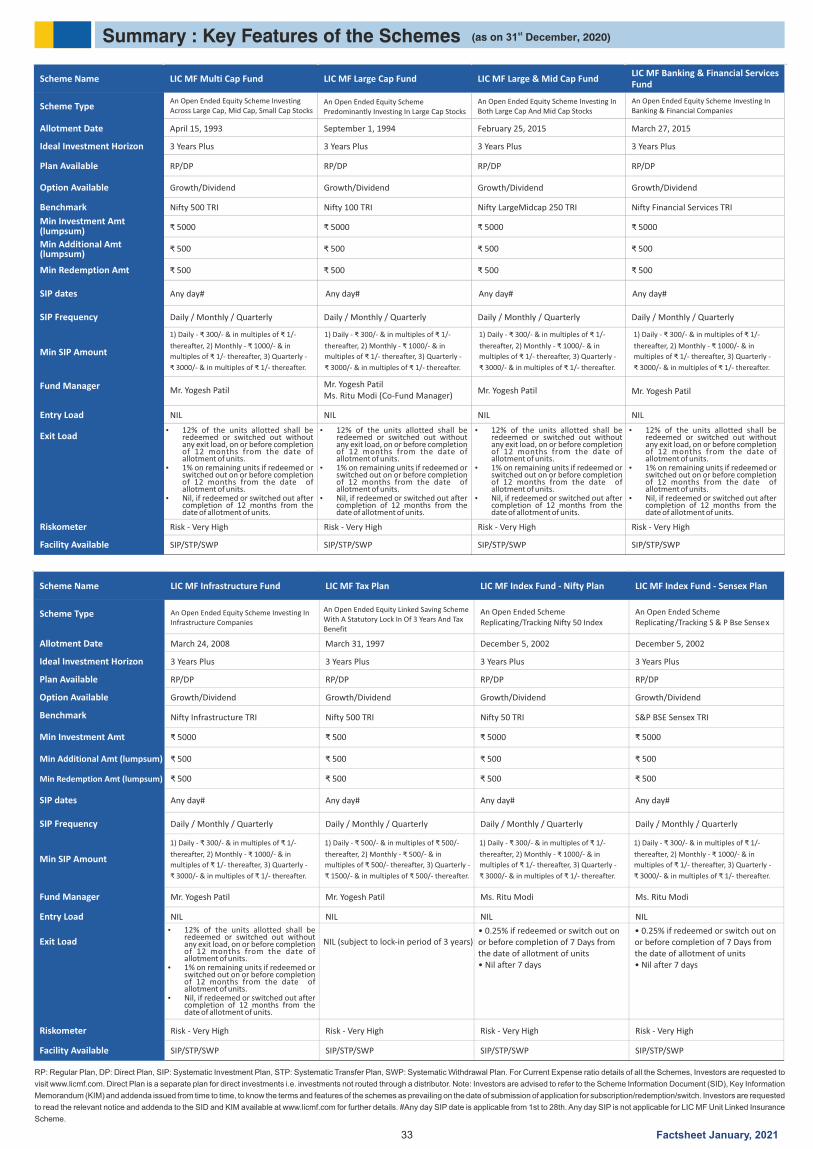
Summary : Key Features of the Schemes st(as on 31 December, 2020)
RP: Regular Plan, DP: Direct Plan, SIP: Systematic Investment Plan, STP: Systematic Transfer Plan, SWP: Systematic Withdrawal Plan. For Current Expense ratio details of all the Schemes, Investors are requested to
visit www.licmf.com. Direct Plan is a separate plan for direct investments i.e. investments not routed through a distributor. Note: Investors are advised to refer to the Scheme Information Document (SID), Key Information
Memorandum (KIM) and addenda issued from time to time, to know the terms and features of the schemes as prevailing on the date of submission of application for subscription/redemption/switch. Investors are requested
to read the relevant notice and addenda to the SID and KIM available at www.licmf.com for further details. #Any day SIP date is applicable from 1st to 28th. Any day SIP is not applicable for LIC MF Unit Linked Insurance
Scheme.
Scheme Name LIC MF Multi Cap Fund LIC MF Large Cap Fund LIC MF Large & Mid Cap FundLIC MF Banking & Financial ServicesFund
Scheme TypeAn Open Ended Equity Scheme Investing Across Large Cap, Mid Cap, Small Cap Stocks
An Open Ended Equity Scheme Predominantly Investing In Large Cap Stocks
An Open Ended Equity Scheme Investing In Both Large Cap And Mid Cap Stocks
An Open Ended Equity Scheme Investing In Banking & Financial Companies
Allotment Date April 15, 1993 September 1, 1994 February 25, 2015 March 27, 2015
Ideal Investment Horizon 3 Years Plus 3 Years Plus 3 Years Plus 3 Years Plus
Plan Available RP/DP RP/DP RP/DP RP/DP
Option Available Growth/Dividend Growth/Dividend Growth/Dividend Growth/Dividend
Benchmark Nifty 500 TRI Nifty 100 TRI Nifty LargeMidcap 250 TRI Nifty Financial Services TRI
Min Investment Amt(lumpsum) ₹ 5000 ₹ 5000 ₹ 5000 ₹ 5000
Min Additional Amt(lumpsum)
₹ 500 ₹ 500 ₹ 500 ₹ 500
Min Redemption Amt ₹ 500 ₹ 500 ₹ 500 ₹ 500
SIP dates Any day# Any day# Any day# Any day#
SIP Frequency Daily / Monthly / Quarterly Daily / Monthly / Quarterly Daily / Monthly / Quarterly Daily / Monthly / Quarterly
Min SIP Amountthereafter, 2) Monthly - ₹ 1000/- & in
1) Daily - ₹ 300/- & in multiples of ₹ 1/-
multiples of ₹ 1/- thereafter, 3) Quarterly -
₹ 3000/- & in multiples of ₹ 1/- thereafter.
thereafter, 2) Monthly - ₹ 1000/- & in
1) Daily - ₹ 300/- & in multiples of ₹ 1/-
multiples of ₹ 1/- thereafter, 3) Quarterly -
₹ 3000/- & in multiples of ₹ 1/- thereafter.
thereafter, 2) Monthly - ₹ 1000/- & in
1) Daily - ₹ 300/- & in multiples of ₹ 1/-
multiples of ₹ 1/- thereafter, 3) Quarterly -
₹ 3000/- & in multiples of ₹ 1/- thereafter.
thereafter, 2) Monthly - ₹ 1000/- & in
1) Daily - ₹ 300/- & in multiples of ₹ 1/-
multiples of ₹ 1/- thereafter, 3) Quarterly -
₹ 3000/- & in multiples of ₹ 1/- thereafter.
Fund Manager Mr. Yogesh PatilMr. Yogesh PatilMs. Ritu Modi (Co-Fund Manager)
Mr. Yogesh Patil Mr. Yogesh Patil
Entry Load NIL NIL NIL NIL
Exit Load
• 0.25% if redeemed or switch out onor before completion of 7 Days fromthe date of allotment of units• Nil after 7 days
Riskometer Risk - Very High Risk - Very High Risk - Very High Risk - Very High
Facility Available SIP/STP/SWP SIP/STP/SWP SIP/STP/SWP SIP/STP/SWP
Scheme Name LIC MF Infrastructure Fund LIC MF Tax Plan LIC MF Index Fund - Nifty Plan LIC MF Index Fund - Sensex Plan
Scheme Type An Open Ended Equity Scheme Investing In Infrastructure Companies
An Open Ended Equity Linked Saving Scheme With A Statutory Lock In Of 3 Years And Tax Benefit
An Open Ended Scheme Replicating/Tracking Nifty 50 Index
An Open Ended Scheme Replicating/Tracking S & P Bse Sensex
Allotment Date March 24, 2008 March 31, 1997 December 5, 2002 December 5, 2002
Ideal Investment Horizon 3 Years Plus 3 Years Plus 3 Years Plus 3 Years Plus
Plan Available RP/DP RP/DP RP/DP RP/DP
Option Available Growth/Dividend Growth/Dividend Growth/Dividend Growth/Dividend
Benchmark Nifty Infrastructure TRI Nifty 500 TRI Nifty 50 TRI S&P BSE Sensex TRI
Min Investment Amt ₹ 5000 ₹ 500 ₹ 5000 ₹ 5000
Min Additional Amt (lumpsum) ₹ 500 ₹ 500 ₹ 500 ₹ 500
Min Redemption Amt (lumpsum) ₹ 500 ₹ 500 ₹ 500 ₹ 500
SIP dates Any day# Any day# Any day# Any day#
SIP Frequency Daily / Monthly / Quarterly Daily / Monthly / Quarterly Daily / Monthly / Quarterly Daily / Monthly / Quarterly
Min SIP Amount
Fund Manager Mr. Yogesh Patil Mr. Yogesh Patil Ms. Ritu Modi Ms. Ritu Modi
Entry Load NIL NIL NIL NIL
Exit Load NIL (subject to lock-in period of 3 years)
Riskometer Risk - Very High Risk - Very High Risk - Very High Risk - Very High
Facility Available SIP/STP/SWP SIP/STP/SWP SIP/STP/SWP SIP/STP/SWP
thereafter, 2) Monthly - ₹ 1000/- & in
1) Daily - ₹ 300/- & in multiples of ₹ 1/-
multiples of ₹ 1/- thereafter, 3) Quarterly -
₹ 3000/- & in multiples of ₹ 1/- thereafter.
thereafter, 2) Monthly - ₹ 500/- & in
1) Daily - ₹ 500/- & in multiples of ₹ 500/-
multiples of ₹ 500/- thereafter, 3) Quarterly -
₹ 1500/- & in multiples of ₹ 500/- thereafter.
thereafter, 2) Monthly - ₹ 1000/- & in
1) Daily - ₹ 300/- & in multiples of ₹ 1/-
multiples of ₹ 1/- thereafter, 3) Quarterly -
₹ 3000/- & in multiples of ₹ 1/- thereafter.
thereafter, 2) Monthly - ₹ 1000/- & in
1) Daily - ₹ 300/- & in multiples of ₹ 1/-
multiples of ₹ 1/- thereafter, 3) Quarterly -
₹ 3000/- & in multiples of ₹ 1/- thereafter.
33
Ÿ 12% of the units allotted shall be redeemed or switched out without any exit load, on or before completion of 12 months from the date of allotment of units.
Ÿ 1% on remaining units if redeemed or switched out on or before completion of 12 months from the date of allotment of units.
Ÿ Nil, if redeemed or switched out after completion of 12 months from the date of allotment of units.
• 0.25% if redeemed or switch out onor before completion of 7 Days fromthe date of allotment of units• Nil after 7 days
Factsheet January, 2021

Summary : Key Features of the Schemes st(as on 31 December, 2020)
RP: Regular Plan, DP: Direct Plan, SIP: Systematic Investment Plan, STP: Systematic Transfer Plan, SWP: Systematic Withdrawal Plan. For Current Expense ratio details of all the Schemes, Investors are requested to
visit www.licmf.com. Direct Plan is a separate plan for direct investments i.e. investments not routed through a distributor. Note: Investors are advised to refer to the Scheme Information Document (SID), Key Information
Memorandum (KIM) and addenda issued from time to time, to know the terms and features of the schemes as prevailing on the date of submission of application for subscription/redemption/switch. Investors are requested
to read the relevant notice and addenda to the SID and KIM available at www.licmf.com for further details. #Any day SIP date is applicable from 1st to 28th. Any day SIP is not applicable for LIC MF Unit Linked Insurance
Scheme.
Scheme NameLIC MF Exchange Traded Fund - Nifty 100
LIC MF Exchange Traded Fund - Nifty 50
LIC MF Exchange Traded Fund - Sensex
Scheme TypeAn Open Ended Scheme Replicating/Tracking Nifty 100 Index
An Open Ended Scheme Replicating/Tracking Nifty 50 Index
An Open Ended Scheme Replicating/Tracking Sensex Index
Allotment Date March 17, 2016 November 20, 2015 November 30, 2015
Ideal Investment Horizon 3 Years Plus 3 Years Plus 3 Years Plus
Plan Available RP RP RP
Option Available Growth Growth Growth
Benchmark Nifty 100 TRI Nifty 50 TRI S&P BSE Sensex TRI
Min Investment Amt(lumpsum)
For Subscription / Redemption of units directly with MF : 2,00,000 units. For purchase through Stock Exchange : 1 unit
For Subscription / Redemption of units directly with MF : 50,000 units. For purchase through Stock Exchange : 1 unit
For Subscription/ Redemption of units directly with MF : 2,000 units. For purchase through Stock Exchange : 1 unit
Min Additional Amt(lumpsum)Min Redemption Amt(lumpsum)
SIP dates
SIP Frequency
Min SIP Amount
Fund Manager Ms. Ritu Modi Ms. Ritu Modi Ms. Ritu Modi
Entry Load NIL
- - -
-
-
- - -
- -
- -
-
-
-
-
-
-
NIL NIL
Exit Load NIL NIL NIL
Riskometer Risk - Very High Risk - Very High Risk - Very High
Facility Available
Scheme Name LIC MF Equity Hybrid Fund LIC MF Debt Hybrid FundLIC MF Unit Linked InsuranceScheme
LIC MF Children's Gift Fund
Scheme TypeAn Open Ended Hybrid Scheme Investing Predominantly In Equity And Equity Related Instruments
An Open Ended Hybrid Scheme Investing Predominantly In Debt Instruments
An Open-Ended Insurance Linked Tax Saving Scheme
An Open Ended Fund For Investment For Children Having A Lock-In for at least 5 Years Or Till The Child Attains Age Of Majority (Whichever Is Earlier)
Allotment Date January 01, 1991 June 01, 1998 June 19, 1989 November 12, 2001
Ideal Investment Horizon 3 Years Plus 1 Year Plus 3 Years Plus 5 Years Plus
Plan Available RP/DP RP/DP RP/DP RP/DP
Option Available Growth/Dividend Growth/Dividend Dividend Reinvestment Growth
Benchmark Crisil Hybrid 35 + 65 - Aggressive Index Crisil Hybrid 35 + 65 - Aggressive Index Crisil Hybrid 35 + 65 - Aggressive IndexCrisil Hybrid 85 + 15 - Conservative Index
Min Investment Amt(lumpsum)
₹ 5000 ₹ 5000
₹ 10,000/- under Single Premium Option, ₹ 10,000/- under Regular Premium - Yearly option, ₹ 1,000/- under Regular Premium - Monthly Option
₹ 5000
Min Additional Amt (lumpsum) ₹ 500 ₹ 500 ₹ 500
Min Redemption Amt (lumpsum) ₹ 500 ₹ 500 ₹ 1000 ₹ 500
SIP dates Any day# Any day# 15th Any day#
SIP Frequency Daily / Monthly / Quarterly Daily / Monthly / Quarterly Monthly / Quarterly Daily / Monthly / Quarterly
Min SIP Amount1) Monthly - ₹ 1000/- 2) Quarterly - ₹ 3000/-
Fund ManagerMr. Yogesh Patil (Equity), Mr. Marzban Irani (Debt)
Mr. Marzban Irani (Debt), Mr. Yogesh Patil (Equity)
Mr. Yogesh Patil (Equity)Ms. Ritu Modi (Equity, Co-Fund Manager)Mr. Marzban Irani (Debt)
Mr. Marzban Irani (Debt), Mr. Yogesh Patil (Equity)
Entry Load NIL NIL NIL NIL
Exit Load NIL (subject to lock-in period of 3 years) NILLock-in Period:- at least 5 years or till the child attains age of majority whichever is earlier on every Business Day).
Riskometer Risk - Very High Risk - Moderately High Risk - Very High Risk - Very High
Facility Available SIP/STP/SWP SIP/STP/SWP SIP SIP/STP/SWP
thereafter, 2) Monthly - ₹ 1000/- & in
1) Daily - ₹ 300/- & in multiples of ₹ 1/-
multiples of ₹ 1/- thereafter, 3) Quarterly -
₹ 3000/- & in multiples of ₹ 1/- thereafter.
thereafter, 2) Monthly - ₹ 1000/- & in
1) Daily - ₹ 300/- & in multiples of ₹ 1/-
multiples of ₹ 1/- thereafter, 3) Quarterly -
₹ 3000/- & in multiples of ₹ 1/- thereafter.
thereafter, 2) Monthly - ₹ 1000/- & in
1) Daily - ₹ 300/- & in multiples of ₹ 1/-
multiples of ₹ 1/- thereafter, 3) Quarterly -
₹ 3000/- & in multiples of ₹ 1/- thereafter.
LIC MF Government Securities Fund
An Open Ended Debt Scheme Investing in Government Securities Across Maturity
December 10, 1999
3 Years Plus
RP/DP
Growth/Dividend/PF
I-Sec Composite Index
₹ 10000
₹ 500
₹ 500
Any day#
Monthly / Quarterly
1) Monthly - ₹ 1000/- & in multiples of ₹ 1/- thereafter, 2) Quarterly - ₹ 3000/- & in multiples of ₹ 1/- thereafter
Mr. Marzban Irani
NIL
0.25% if exit within 30 days from the date of allotment of units
Risk - Moderate
SIP/STP
LIC MF G-Sec Long Term Exchange
Traded Fund
An Open Ended Scheme Replicating / Tracking Nifty 8-13 Yr G-Sec Index
December 24, 2014
3 Years Plus
RP
-
-
-
-
-
-
Growth
Nifty 8-13 yr G-Sec Index
For Subscription / Redemption of units directly with MF : 1,00,000 units. For purchase through Stock Exchange : 1 unit
Mr. Marzban Irani
NIL
NIL
Risk - Moderate
34
Ÿ 12% of the units allotted shall be redeemed or switched out without any exit load, on or before completion of 12 months from the date of allotment of units.
Ÿ 1% on remaining units if redeemed or switched out on or before completion of 12 months from the date of allotment of units.
Ÿ Nil, if redeemed or switched out after completion of 12 months from the date of allotment of units.
Mr. Sanjay Pawar (Co-Fund Manager)
Factsheet January, 2021

Summary : Key Features of the Schemes
RP: Regular Plan, DP: Direct Plan, SIP: Systematic Investment Plan, STP: Systematic Transfer Plan, SWP: Systematic Withdrawal Plan. For Current Expense ratio details of all the Schemes, Investors are requested to visit www.licmf.com. Direct Plan is a separate plan for direct investments i.e. investments not routed through a distributor. Note: Investors are advised to refer to the Scheme Information Document (SID), Key Information Memorandum (KIM) and addenda issued from time to time, to know the terms and features of the schemes as prevailing on the date of submission of application for subscription/redemption/switch. Investors are requested to read the relevant notice and addenda to the SID and KIM available at www.licmf.com for further details. #Any day SIP date is applicable from 1st to 28th. Any day SIP is not applicable for LIC MF Unit Linked Insurance Scheme.
Scheme Name
Scheme Name
LIC MF Liquid Fund
LIC MF Arbitrage Fund LIC MF Short Term Debt Fund LIC MF Overnight Fund
LIC MF Savings Fund LIC MF Banking & PSU Debt Fund
Scheme Type
Scheme Type
An Open-Ended Liquid Scheme
An open ended scheme investing in arbitrage opportunities
An Open Ended Short Term Debt scheme investing in instruments with Macaulay duration between 1 year and 3 years (Please refer Page No 35 of SID)
An open-ended debt scheme investing in overnight securities.
An Open Ended Low Duration Debt Scheme Investing In Instruments With Macaulay Duration Of The Portfolio Is Between 6 Months And 12 Months (Please refer Page No.27)
An Open Ended Debt Scheme Predominantly Investing In Debt Instruments Of Banks, Public Sector Undertakings, Public Financial Institutions And Municipal Bonds
Allotment Date
Allotment Date
March 18, 2002
January 25, 2019 February 01, 2019 July 18, 2019
June 09, 2003 May 31, 2007
Ideal Investment Horizon
Ideal Investment Horizon
1 Day Plus
1 Day Plus1 Year Plus 3 Years Plus
6 Months Plus 3 Years Plus
Plan Available
Plan Available
RP/DP
RP/DP RP/DP RP/DP
RP/DP RP/DP
Option Available
Option Available
Growth/Dividend
Growth/Dividend Growth/Dividend Growth/Dividend
Growth/Dividend Growth/Dividend
Benchmark
Benchmark
Crisil Liquid Fund Index
Nifty 50 Arbitrage Index Crisil Short Term Bond Fund Index NIFTY 1D Rate Index
CRISIL Low Duration Debt Index Nifty Banking and PSU Debt Index
Min Investment Amt (lumpsum)
Min Investment Amt (lumpsum)
₹ 5000
₹ 5000 ₹ 5000 ₹ 5000
₹ 5000 ₹ 5000
Min Additional Amt (lumpsum)
Min Additional Amt (lumpsum)
₹ 500
₹ 500 ₹ 500 ₹ 500
₹ 500 ₹ 500
Min Redemption Amt (lumpsum)
Min Redemption Amt (lumpsum)
₹ 500
₹ 500 ₹ 500 ₹ 500
₹ 500 ₹ 500
SIP dates
SIP dates
Any day#
Any day# Any day# Any day#
Any day# Any day#
SIP Frequency
SIP Frequency
Monthly / Quarterly
Daily / Monthly / Quarterly Daily / Monthly / Quarterly Daily / Monthly / Quarterly
Monthly / Quarterly Monthly / Quarterly
Min SIP Amount
Min SIP Amount
1) Monthly - ₹ 1000/- & in multiples of ₹ 1/- thereafter, 2) Quarterly - & 3000/- & in multiples of ₹ 1/- thereafter
1) Daily - ₹ 300/- & in multiples of ₹ 1/- thereafter, 2) Monthly - ₹ 1000/- & in multiples of ₹ 1/- thereafter, 3) Quarterly - & 3000/- & in multiples of ₹ 1/- thereafter
1) Daily - ₹ 300/- & in multiples of ₹ 1/- thereafter,2) Monthly - ₹ 1000/- & in multiples of ₹ 1/- thereafter, 3) Quarterly - & 3000/- & in multiples of ₹ 1/- thereafter
1) Daily - ₹ 300/- & in multiples of ₹ 1/- thereafter, 2) Monthly - ₹ 1000/- & in multiples of ₹ 1/- thereafter, 3) Quarterly - & 3000/- & in multiples of ₹ 1/- thereafter
1) Monthly - ₹ 1000/- & in multiples of ₹ 1/- thereafter, 2) Quarterly - ₹ 3000/- & in multiples of ₹ 1/- thereafter
1) Monthly - ₹ 1000/- & in multiples of ₹ 1/- thereafter, 2) Quarterly - ₹ 3000/- & in multiples of ₹ 1/- thereafter
Fund Manager
Fund Manager
Mr. Rahul Singh Mr. Rahul Singh Mr. Marzban Irani
Entry Load
Entry Load
NIL
NIL NIL NIL
NIL NIL
NIL
NIL
NIL
Exit Load
Exit Load
See below note* NIL
Riskometer
Riskometer
Risk - Low to Moderate
Risk - Low Risk - Moderate Risk - Low
Risk - Low to Moderate Risk - Moderate
Facility Available
*LIC MF Liquid Fund Exit Load :
Facility Available
SIP/STP/SWP
SIP/STP/SWP SIP/STP/SWP SIP/STP/SWP
SIP/STP/SWP SIP/STP/SWP
35
Mr. Yogesh Patil (Equity), Mr. Marzban Irani (Debt) Mr. Marzban IraniMr. Sanjay Pawar (Co-Fund Manager)
Mr. Rahul Singh
Ÿ For redemption/switch out of units within 15 days from the date of allotment: 0.50% of applicable NAV.
Ÿ For redemption/switch out of units between 15 days to 1 month from the date of allotment: 0.25% of applicable NAV.
Ÿ For redemption/switch out of units after 1 month from the date of allotment: Nil
st(as on 31 December, 2020)
Investor exit upon Subscription Day 1 Day 2 Day 3 Day 4 Day 5 Day 6 Day 7 onwards
Exit load as a % of redemption/switch out proceeds 0.0070% 0.0065% 0.0060% 0.0055% 0.0050% 0.0045% 0.0000%
Factsheet January, 2021
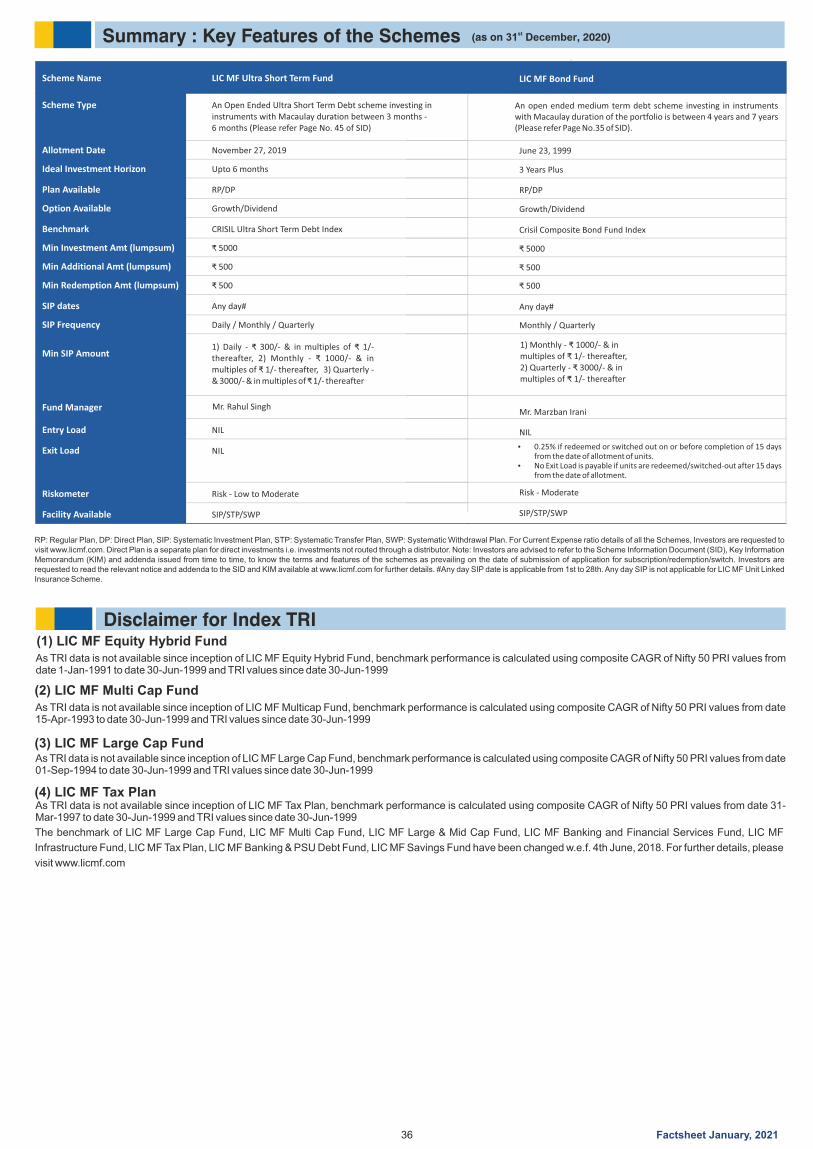
Summary : Key Features of the Schemes
RP: Regular Plan, DP: Direct Plan, SIP: Systematic Investment Plan, STP: Systematic Transfer Plan, SWP: Systematic Withdrawal Plan. For Current Expense ratio details of all the Schemes, Investors are requested to visit www.licmf.com. Direct Plan is a separate plan for direct investments i.e. investments not routed through a distributor. Note: Investors are advised to refer to the Scheme Information Document (SID), Key Information Memorandum (KIM) and addenda issued from time to time, to know the terms and features of the schemes as prevailing on the date of submission of application for subscription/redemption/switch. Investors are requested to read the relevant notice and addenda to the SID and KIM available at www.licmf.com for further details. #Any day SIP date is applicable from 1st to 28th. Any day SIP is not applicable for LIC MF Unit Linked Insurance Scheme.
Scheme Name LIC MF Ultra Short Term Fund
Scheme Type An Open Ended Ultra Short Term Debt scheme investing in instruments with Macaulay duration between 3 months - 6 months (Please refer Page No. 45 of SID)
Allotment Date November 27, 2019
Ideal Investment Horizon Upto 6 months
Plan Available RP/DP
Option Available Growth/Dividend
Benchmark CRISIL Ultra Short Term Debt Index
Min Investment Amt (lumpsum) ₹ 5000
Min Additional Amt (lumpsum) ₹ 500
Min Redemption Amt (lumpsum) ₹ 500
SIP dates Any day#
SIP Frequency Daily / Monthly / Quarterly
Min SIP Amount1) Daily - ₹ 300/- & in multiples of ₹ 1/- thereafter, 2) Monthly - ₹ 1000/- & in multiples of ₹ 1/- thereafter, 3) Quarterly - & 3000/- & in multiples of ₹ 1/- thereafter
Fund Manager
Entry Load NIL
Exit Load
Riskometer Risk - Low to Moderate
Facility Available SIP/STP/SWP
36
Mr. Rahul Singh
st(as on 31 December, 2020)
NIL
1) Monthly - ₹ 1000/- & in multiples of ₹ 1/- thereafter, 2) Quarterly - ₹ 3000/- & in multiples of ₹ 1/- thereafter
LIC MF Bond Fund
An open ended medium term debt scheme investing in instruments with Macaulay duration of the portfolio is between 4 years and 7 years (Please refer Page No.35 of SID).
June 23, 1999
3 Years Plus
RP/DP
Growth/Dividend
Crisil Composite Bond Fund Index
₹ 5000
₹ 500
₹ 500
Any day#
Monthly / Quarterly
Mr. Marzban Irani
NIL
Risk - Moderate
SIP/STP/SWP
Ÿ 0.25% if redeemed or switched out on or before completion of 15 days from the date of allotment of units.
Ÿ No Exit Load is payable if units are redeemed/switched-out after 15 days from the date of allotment.
Disclaimer for Index TRI
As TRI data is not available since inception of LIC MF Equity Hybrid Fund, benchmark performance is calculated using composite CAGR of Nifty 50 PRI values from date 1-Jan-1991 to date 30-Jun-1999 and TRI values since date 30-Jun-1999
(1) LIC MF Equity Hybrid Fund
(2) LIC MF Multi Cap Fund
(3) LIC MF Large Cap Fund
(4) LIC MF Tax Plan
As TRI data is not available since inception of LIC MF Multicap Fund, benchmark performance is calculated using composite CAGR of Nifty 50 PRI values from date 15-Apr-1993 to date 30-Jun-1999 and TRI values since date 30-Jun-1999
As TRI data is not available since inception of LIC MF Large Cap Fund, benchmark performance is calculated using composite CAGR of Nifty 50 PRI values from date 01-Sep-1994 to date 30-Jun-1999 and TRI values since date 30-Jun-1999
As TRI data is not available since inception of LIC MF Tax Plan, benchmark performance is calculated using composite CAGR of Nifty 50 PRI values from date 31-Mar-1997 to date 30-Jun-1999 and TRI values since date 30-Jun-1999
The benchmark of LIC MF Large Cap Fund, LIC MF Multi Cap Fund, LIC MF Large & Mid Cap Fund, LIC MF Banking and Financial Services Fund, LIC MF
Infrastructure Fund, LIC MF Tax Plan, LIC MF Banking & PSU Debt Fund, LIC MF Savings Fund have been changed w.e.f. 4th June, 2018. For further details, please
visit www.licmf.com
Factsheet January, 2021
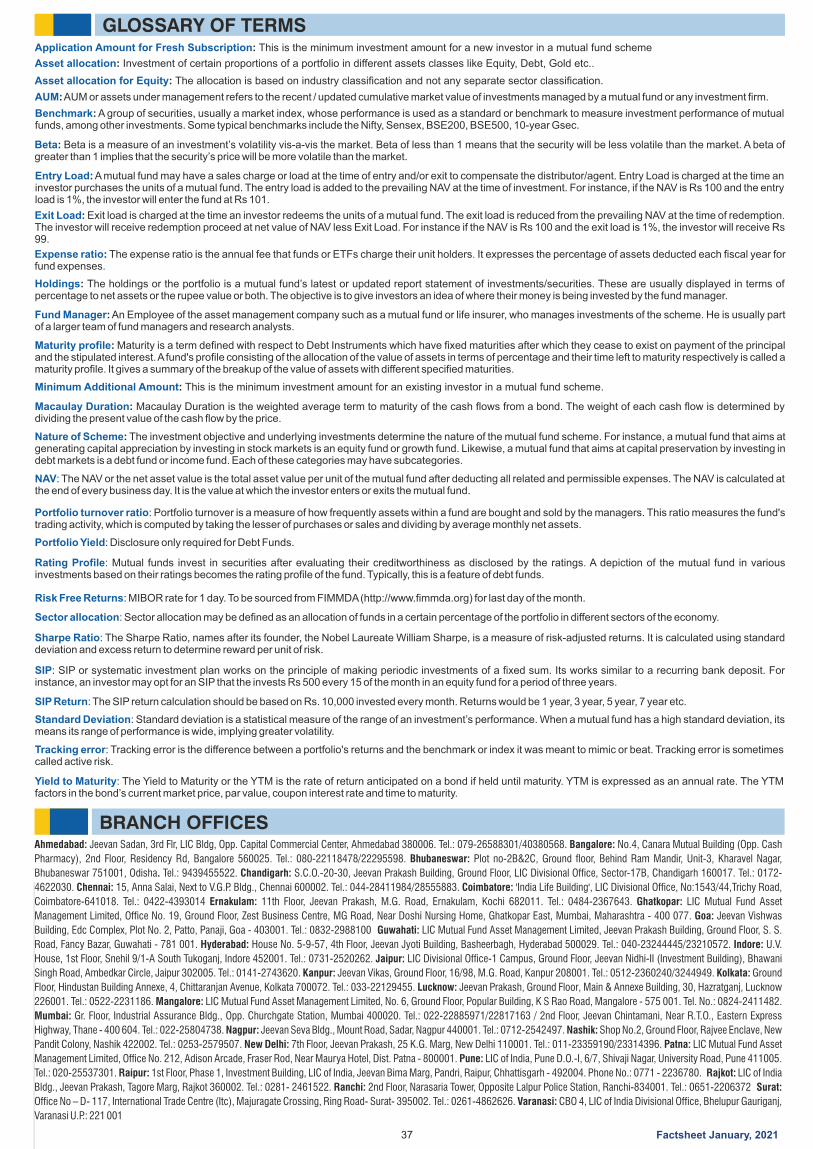
37
GLOSSARY OF TERMSApplication Amount for Fresh Subscription: This is the minimum investment amount for a new investor in a mutual fund scheme
Asset allocation: Investment of certain proportions of a portfolio in different assets classes like Equity, Debt, Gold etc..
Asset allocation for Equity: The allocation is based on industry classification and not any separate sector classification.
AUM: AUM or assets under management refers to the recent / updated cumulative market value of investments managed by a mutual fund or any investment firm.
Benchmark: A group of securities, usually a market index, whose performance is used as a standard or benchmark to measure investment performance of mutual funds, among other investments. Some typical benchmarks include the Nifty, Sensex, BSE200, BSE500, 10-year Gsec.
Beta: Beta is a measure of an investment’s volatility vis-a-vis the market. Beta of less than 1 means that the security will be less volatile than the market. A beta of greater than 1 implies that the security’s price will be more volatile than the market.
Entry Load: A mutual fund may have a sales charge or load at the time of entry and/or exit to compensate the distributor/agent. Entry Load is charged at the time an investor purchases the units of a mutual fund. The entry load is added to the prevailing NAV at the time of investment. For instance, if the NAV is Rs 100 and the entry load is 1%, the investor will enter the fund at Rs 101.
Exit Load: Exit load is charged at the time an investor redeems the units of a mutual fund. The exit load is reduced from the prevailing NAV at the time of redemption. The investor will receive redemption proceed at net value of NAV less Exit Load. For instance if the NAV is Rs 100 and the exit load is 1%, the investor will receive Rs 99.
Expense ratio: The expense ratio is the annual fee that funds or ETFs charge their unit holders. It expresses the percentage of assets deducted each fiscal year for fund expenses.
Fund Manager: An Employee of the asset management company such as a mutual fund or life insurer, who manages investments of the scheme. He is usually part of a larger team of fund managers and research analysts.
Maturity profile: Maturity is a term defined with respect to Debt Instruments which have fixed maturities after which they cease to exist on payment of the principal and the stipulated interest. A fund's profile consisting of the allocation of the value of assets in terms of percentage and their time left to maturity respectively is called a maturity profile. It gives a summary of the breakup of the value of assets with different specified maturities.
Holdings: The holdings or the portfolio is a mutual fund’s latest or updated report statement of investments/securities. These are usually displayed in terms of percentage to net assets or the rupee value or both. The objective is to give investors an idea of where their money is being invested by the fund manager.
Minimum Additional Amount: This is the minimum investment amount for an existing investor in a mutual fund scheme.
Macaulay Duration: Macaulay Duration is the weighted average term to maturity of the cash flows from a bond. The weight of each cash flow is determined by dividing the present value of the cash flow by the price.
Nature of Scheme: The investment objective and underlying investments determine the nature of the mutual fund scheme. For instance, a mutual fund that aims at generating capital appreciation by investing in stock markets is an equity fund or growth fund. Likewise, a mutual fund that aims at capital preservation by investing in debt markets is a debt fund or income fund. Each of these categories may have subcategories.
NAV: The NAV or the net asset value is the total asset value per unit of the mutual fund after deducting all related and permissible expenses. The NAV is calculated at the end of every business day. It is the value at which the investor enters or exits the mutual fund.
Portfolio turnover ratio: Portfolio turnover is a measure of how frequently assets within a fund are bought and sold by the managers. This ratio measures the fund's trading activity, which is computed by taking the lesser of purchases or sales and dividing by average monthly net assets.
Portfolio Yield: Disclosure only required for Debt Funds.
Rating Profile: Mutual funds invest in securities after evaluating their creditworthiness as disclosed by the ratings. A depiction of the mutual fund in various investments based on their ratings becomes the rating profile of the fund. Typically, this is a feature of debt funds.
Risk Free Returns: MIBOR rate for 1 day. To be sourced from FIMMDA (http://www.fimmda.org) for last day of the month.
Sector allocation: Sector allocation may be defined as an allocation of funds in a certain percentage of the portfolio in different sectors of the economy.
Sharpe Ratio: The Sharpe Ratio, names after its founder, the Nobel Laureate William Sharpe, is a measure of risk-adjusted returns. It is calculated using standard deviation and excess return to determine reward per unit of risk.
SIP: SIP or systematic investment plan works on the principle of making periodic investments of a fixed sum. Its works similar to a recurring bank deposit. For instance, an investor may opt for an SIP that the invests Rs 500 every 15 of the month in an equity fund for a period of three years.
SIP Return: The SIP return calculation should be based on Rs. 10,000 invested every month. Returns would be 1 year, 3 year, 5 year, 7 year etc.
Standard Deviation: Standard deviation is a statistical measure of the range of an investment’s performance. When a mutual fund has a high standard deviation, its means its range of performance is wide, implying greater volatility.
Tracking error: Tracking error is the difference between a portfolio's returns and the benchmark or index it was meant to mimic or beat. Tracking error is sometimes called active risk.
Yield to Maturity: The Yield to Maturity or the YTM is the rate of return anticipated on a bond if held until maturity. YTM is expressed as an annual rate. The YTM factors in the bond’s current market price, par value, coupon interest rate and time to maturity.
BRANCH OFFICES Ahmedabad: Jeevan Sadan, 3rd Flr, LIC Bldg, Opp. Capital Commercial Center, Ahmedabad 380006. Tel.: 079-26588301/40380568. Bangalore: No.4, Canara Mutual Building (Opp. Cash
Pharmacy), 2nd Floor, Residency Rd, Bangalore 560025. Tel.: 080-22118478/22295598. Bhubaneswar: Plot no-2B&2C, Ground floor, Behind Ram Mandir, Unit-3, Kharavel Nagar,
Bhubaneswar 751001, Odisha. Tel.: 9439455522. Chandigarh: S.C.O.-20-30, Jeevan Prakash Building, Ground Floor, LIC Divisional Office, Sector-17B, Chandigarh 160017. Tel.: 0172-
4622030. Chennai: 15, Anna Salai, Next to V.G.P. Bldg., Chennai 600002. Tel.: 044-28411984/28555883. Coimbatore: 'India Life Building', LIC Divisional Office, No:1543/44,Trichy Road,
Coimbatore-641018. Tel.: 0422-4393014 Ernakulam: 11th Floor, Jeevan Prakash, M.G. Road, Ernakulam, Kochi 682011. Tel.: 0484-2367643. Ghatkopar: LIC Mutual Fund Asset
Management Limited, Office No. 19, Ground Floor, Zest Business Centre, MG Road, Near Doshi Nursing Home, Ghatkopar East, Mumbai, Maharashtra - 400 077. Goa: Jeevan Vishwas
Building, Edc Complex, Plot No. 2, Patto, Panaji, Goa - 403001. Tel.: 0832-2988100 Guwahati: LIC Mutual Fund Asset Management Limited, Jeevan Prakash Building, Ground Floor, S. S.
Road, Fancy Bazar, Guwahati - 781 001. Hyderabad: House No. 5-9-57, 4th Floor, Jeevan Jyoti Building, Basheerbagh, Hyderabad 500029. Tel.: 040-23244445/23210572. Indore: U.V.
House, 1st Floor, Snehil 9/1-A South Tukoganj, Indore 452001. Tel.: 0731-2520262. Jaipur: LIC Divisional Office-1 Campus, Ground Floor, Jeevan Nidhi-II (Investment Building), Bhawani
Singh Road, Ambedkar Circle, Jaipur 302005. Tel.: 0141-2743620. Kanpur: Jeevan Vikas, Ground Floor, 16/98, M.G. Road, Kanpur 208001. Tel.: 0512-2360240/3244949. Kolkata: Ground
Floor, Hindustan Building Annexe, 4, Chittaranjan Avenue, Kolkata 700072. Tel.: 033-22129455. Lucknow: Jeevan Prakash, Ground Floor, Main & Annexe Building, 30, Hazratganj, Lucknow
226001. Tel.: 0522-2231186. Mangalore: LIC Mutual Fund Asset Management Limited, No. 6, Ground Floor, Popular Building, K S Rao Road, Mangalore - 575 001. Tel. No.: 0824-2411482.
Mumbai: Gr. Floor, Industrial Assurance Bldg., Opp. Churchgate Station, Mumbai 400020. Tel.: 022-22885971/22817163 / 2nd Floor, Jeevan Chintamani, Near R.T.O., Eastern Express
Highway, Thane - 400 604. Tel.: 022-25804738. Nagpur: Jeevan Seva Bldg., Mount Road, Sadar, Nagpur 440001. Tel.: 0712-2542497. Nashik: Shop No.2, Ground Floor, Rajvee Enclave, New
Pandit Colony, Nashik 422002. Tel.: 0253-2579507. New Delhi: 7th Floor, Jeevan Prakash, 25 K.G. Marg, New Delhi 110001. Tel.: 011-23359190/23314396. Patna: LIC Mutual Fund Asset
Management Limited, Office No. 212, Adison Arcade, Fraser Rod, Near Maurya Hotel, Dist. Patna - 800001. Pune: LIC of India, Pune D.O.-I, 6/7, Shivaji Nagar, University Road, Pune 411005.
Tel.: 020-25537301. Raipur: 1st Floor, Phase 1, Investment Building, LIC of India, Jeevan Bima Marg, Pandri, Raipur, Chhattisgarh - 492004. Phone No.: 0771 - 2236780. Rajkot: LIC of India
Bldg., Jeevan Prakash, Tagore Marg, Rajkot 360002. Tel.: 0281- 2461522. Ranchi: 2nd Floor, Narasaria Tower, Opposite Lalpur Police Station, Ranchi-834001. Tel.: 0651-2206372 Surat:
Office No – D- 117, International Trade Centre (Itc), Majuragate Crossing, Ring Road- Surat- 395002. Tel.: 0261-4862626. Varanasi: CBO 4, LIC of India Divisional Office, Bhelupur Gauriganj,
Varanasi U.P.: 221 001
Factsheet January, 2021

38
Agartala: Ols Rms Chowmuhani, Mantri Bari Road,1St Floor, Near Traffic Point, Tripura West, Agartala, Tripura, 799001 / 0381-2317519; Agra: House No. 17/2/4, 2Nd Floor, Deepak Wasan Plaza, Behind Hotel Holiday
Inn, Sanjay Place, In The City Of Agra, Agra, Uttar Pradesh, 282002 / 7518801801; Ahmedabad: 201/202 Shail Complex, Opp: Madhusudan House, B/H Girish Cold Drink, Off C G Road, Navrangpura, Ahmedabad,
Gujarat, 380006 / 9081903021; Ajmer: 302, 3Rd Floor, Ajmer Auto Building, Opposite City Power House, Jaipur Road; Ajmer, Rajasthan, 305001 / 0145-5120725; Akola: Yamuna Tarang Complex, Shop No 30, Ground
Floor, N.H. No- 06, Murtizapur Road, Opp Radhakrishna Talkies, Akola, Maharashthra, 444004 / 0724-2451874; Aligarh: Sebti Complex Centre Point, In The City Of Aligarh, Aligarh, Uttar Pradesh, 202001 / 7518801802;
Allahabad: Meena Bazar" 2Nd Floor, 10, S. P. Marg, Civil Lines, Subhash Chauraha, In The City Of Allahabad, Allahabad, Uttar Pradesh, 211001 / 7518801803; Alleppy: 1St Floor, Jp Towers, Mullackal, Ksrtc Bus Stand,
Alleppy, Kerala, 688011 / 0477 2263055; Alwar: Office Number 137, First Floor, Jai Complex Road No – 2, Alwar, Rajasthan, 301001 / 0144-2335550 / 0144-2335551; Amaravathi: Shop No. 21, 2Nd Floor, Gulshan
Tower, Near Panchsheel Talkies, Jaistambh Square, Amaravathi, Maharashthra, 444601 / 0721 2569198; Ambala: 6349,2Nd Floor, Nicholson Road, Adjacent Kos Hospitalambala Cant, Ambala, Haryana, 133001 /
7518801804; Amritsar: 72-A, Taylor'S Road, Opp Aga Heritage Club, Amritsar, Punjab, 143001 / 0183-5053802; Anand: B-42 Vaibhav Commercial Center, Nr Tvs Down Town Shrow Room, Grid Char Rasta, Anand,
Gujarat, 380001 / 9081903038; Ananthapur: Plot No: 12-313, Balaji Towers, Srinagar, Ananthapur Village, Anantapur, Andhra Pradesh, 515001 / 8554244449; Asansol: 114/71 G T Road, Bhanga Panchil Near Nokia
Care, Asansol, West Bengal, 713303 / 0341-2220077; Aurangabad: Shop No B 38, Motiwala Trade Centre, Nirala Bazar, Aurangabad, Maharashthra, 431005 / 0240-2343414; Azamgarh: House No. 290, Ground Floor,
Civil Lines, Near Sahara Office, In The City Of Azamgarh, Azamgarh, Uttar Pradesh, 276001 / 7518801805; Balasore: 1-B. 1St Floor, Kalinga Hotel Lane, Baleshwa, Baleshwar Sadar, Balasore, Orissa, 756001 / 06782-
260503; Bangalore: 59, Skanda Puttanna Road, Basavanagudi, Bangalore, Karnataka, 560004 / 080-26602852; Bankura: Plot Nos- 80/1/A,Natunchati Mahalla, 3Rd Floor,, Ward No-24, Opposite P.C Chandra,
Bankura Town, Bankura, West Bengal, 722101 / 9434480586; Bareilly: 54-Civil Lines, Ayub Khan Chauraha, Civil Lines Road, In The City Of Deoria, , Bareilly, Uttar Pradesh, 243001 / 7518801806; Barhampore (Wb):
Thakur Market Complex, Gorabazar, Post Berhampore Dist Murshidabad, 72 No Nayasarak Road, Barhampore (Wb), West Bengal, 742101 / 0348- 2274494; Baroda: 203, Corner Point, Jetalpur Road, Baroda, Gujarat,
Baroda, Gujarat, 390007 / 0265-2353506; Begusarai: C/O Dr Hazari Prasad Sahu, Ward No 13, Behind Alka Cinema, Begusarai (Bihar), Begusarai, Bihar, 851117 / 7518801807; Belgaum: Cts No 3939/ A2 A1, Above
Raymonds Show Room |Beside Harsha Appliances, Club Road, Belgaum, Karnataka, 590001 / 0831 2402544; Bellary: Shree Gayathri Towers, #4, 1St Floor, K.H.B.Colony, Gopalaswamy Mudaliar Road,, Gandhi
Nagar-Bellary, Karnataka, 583103 / 08392 – 254750; Berhampur (Or): Opp Divya Nandan Kalyan Mandap, 3Rd Lane Dharam Nagar, Near Lohiya Motor, Berhampur (Or), Orissa, 760001 / 0680-2228106; Betul:
107,1St Floor, Hotel Utkarsh, J. H. College Road, Betul, Madhya Pradesh, 460001 / 07141 - 231301; Bhagalpur: 2Nd Floor, Chandralok Complex, Near Ghanta Ghar, In The City Of Bhagalpur, Bihar, Bhagalpur, Bihar,
812001 / 7518801808; Bharuch: 123 Nexus Business Hub, Near Gangotri Hotel, B/S Rajeshwari Petroleum, Makampur Road, Bharuch, Gujarat, 392001 / 9081903042; Bhatinda: Second Floor, Mcb -2-3-01043
Goniana Road, Opp: Nippon India Mf Gt Rode, Near Hanuman Chowk Bhatinda, Bhatinda, Punjab, 161001 / 0164- 5006725; Bhavnagar: 303, Sterling Point, Waghawadi Road, Bhavnagar, Gujarat, 364001 / 278-
3003149; Bhilai: Shop No -1, First Floor Plot No -1, Commercial Complex Nehru Nagar - East, Bhilai, Chatisgarh, 490020 / 0788-2289499 / 2295332; Bhilwara: Shop No. 27-28, 1St Floor, Heera Panna Market, Pur
Road, Bhilwara, Rajasthan, 311001 / 01482-246362 / 246364; Bhopal: Gurukripa Plaza, Plot No. 48A, Opposite City, Hospital, Zone-2, M P Nagar, Bhopal, Madhya Pradesh, Bhopal, Madhya Pradesh, 462011 / 0755-
4092712,0755-4092715; Bhubaneswar: A/181, Saheed Nagar, Janardan House, Room #: 07; 3Rd Floor, Bhubaneswar, Orissa, 751007 / 0674-2548981; Bikaner: 70-71, 2Nd Floor | Dr.Chahar Building, Panchsati
Circle, Sadul Ganj, Bikaner, Rajasthan, 334003 / 0151-2200014; Bilaspur: Shop No -225,226 & 227,2Nd Floor, Narayan Plaza, Link Road, Bilaspur, Chatisgarh, 495001 / 07752-470070; Bokaro: City Centre, Plot No.
He-07, Sector-Iv; Bokaro Steel City, Bokaro, Jharkhand, 827004 / 7542979444; Borivali: Gomati Smuti,Ground Floor, Jambli Gully, Near Railway Station, Borivali, Mumbai, Maharashtra, 400 092 / 022- 28916319;
Burdwan: Anima Bhavan, 1St Floor, Holding No.-42, Sreepally, G. T. Road, West Bengal, Burdwan, West Bengal, 713103 / 0342-2665140; Calicut: Second Floor, Manimuriyil Centre, Bank Road, Kasaba Village,
Calicut, Kerala, 673001 / 0495-4022480; Chandigarh: Sco- 2423-2424, Above Mirchi Restaurent, New Aroma Hotel, First Floor, Sector 22-C, Chandigarh, Union Territory, 160022 / 0172-5101342; Chandrapur: Shop
No-6 Office No-2, 1St Floor Rauts Raghuvanshi Complex, Beside Azad Garden Main Road, Chandrapur, Maharashthra, 442402 / 07172-270262; Chembur: Shop No 4, Ground Floor, Shram Saflya Bldg, N G Acharya
Marg, Chembur, Mumbai, Maharashtra, , 022-662215536; Chennai: F-11, Akshaya Plaza, 1St Floor, 108, Adhithanar Salai, Egmore, Opp To Chief Metropolitan Court, Chennai, Tamil Nadu, 600002 / 044-42028512;
Chinsura: 96, Doctors Lane; Po: Chinsurah; Dt: Hooghly, , Chinsurah, West Bengal, 712101 / 033-26810164; Cochin: Ali Arcade, 1St Floor,Kizhavana Road, Panampilly Nagar, Near Atlantis Junction, Ernakualm,
Kerala, 682036 / 0484 - 4025059; Coimbatore: 3Rd Floor, Jaya Enclave, 1057 Avinashi Road, , Coimbatore, Tamil Nadu, 641018 / 0422 - 4388011; Cuttack: Shop No-45,2Nd Floor, Netaji Subas Bose Arcade, (Big Bazar
Building), Adjacent To Reliance Trends, Dargha Bazar, Cuttack, Orissa, 753001 / 8658691094; Darbhanga: Jaya Complex,2Nd Floor, Above Furniture Planet,Donar, Chowk, Darbhanga, Bihar, 846003 / 7518801809;
Davangere: D.No 162/6 , 1St Floor, 3Rd Main, P J Extension, Davangere Taluk,, Davangere Mandal,Davangere, Davangere, Karnataka, 577002 / 0819-2258714; Dehradun: Kaulagarh Road, Near Sirmaur Margabove,
Reliance Webworld, Dehradun, Uttaranchal, 248001 / 7518801810; Deoria: K. K. Plaza, Above Apurwa Sweets, Deoria, Uttar pradesh, 274001 / 7518801811; Dewas: 27 Rmo House, Station Road, Above Maa
Chamunda Gaes Agency, Dewas, Madhya Pradesh, 455001 / 07272-426010; Dhanbad: 208 New Market 2Nd Floor, Bank More, Dhanbad, Jharkhand, 826001 / 9264445981; Dharwad: 307/9-A 1St Floor, Nagarkar
Colony, Elite Business Center, Nagarkar Colony,P B Road, Dharwad, Karnataka, 580001 / 0836- 2744207; Dhule: Ground Floor Ideal Laundry, Lane No 4, Khol Galli, Near Muthoot Finance, Opp Bhavasar General Store,
Dhule, Maharashthra, 424001 / 02562-282823; Dindigul: No 59B New Pensioner Street, Opp Gomathi Lodge, Palani Road, Dindigul, Dindigul, Tamil Nadu, 624001 / 0451- 2436177; Durgapur: Mwav-16 Bengal
Ambuja, 2Nd Floor City Centre, Distt. Burdwan, Durgapur-16, Durgapur, West Bengal, 713216 / 0343-6512111; Eluru: House No 22B-12-1/1, Ground Floor, Gade Vari Street, Power Peta, Eluru 2, Eluru-West Godavari,
Eluru, Andhra Pradesh, 534002 / 08812-227851 / 52 / 53 / 54; Erode: No: 4, Veerappan Traders Complex, Address No 38/1, Sathy Road, (Vctv Main Road),, Sorna Krishna Complex,Ground Floor, Erode, Tamil Nadu,
638003 / 0424-4021212; Faridabad: A-2B 2Nd Floor, Neelam Bata Road Peerki Mazar, Nehru Ground Nit, Faridabad, Haryana, 121001 / 7518801812; Ferozpur: The Mall Road, Chawla Bulding, Ist Floor, Opp. Centrail
Jail, Near Hanuman Mandir, Ferozepur, Punjab, 152002 / 01632-241814; Gandhidham: Shop # 12, Shree Ambica Arcade, Plot # 300, Ward 12. Opp. Cg High School, Near Hdfc Bank, Gandhidham, Gujarat, 370201 /
9081903027; Gandhinagar: 123, First Floor, Megh Malhar Complex, Opp. Vijay Petrol Pump, Sector - 11, Gandhinagar, Gujarat, 382011 / 079 23244955; Gaya: 54 Lal Kothi Compound, Shree Krishna Road, 2Nd Floor,
North Side, Near Royal Surya Hotel, Gaya, Bihar, 823001 / 0631-2220065; Ghaziabad: Ff - 31, Konark Building, Rajnagar, Lohia Nagar, Ghaziabad, Uttar Pradesh, 201003 / 7518801813; Ghazipur: House No. 148/19,
Mahua Bagh, In The City Of Ghazipur, Ghazipur, Uttar Pradesh, 233001 / 7518801814; Gonda: Shri Market, Sahabgunj, Station Road, Gonda, Uttar Pradesh, 271001 / 7518801815; Gorakhpur: Above V.I.P. House
Ajdacent, A.D. Girls College, Bank Road, Gorakpur, Uttar Pradesh, 273001 / 7518801816; Gulbarga: H No 2-231, Krishna Complex, 2Nd Floor Opp. Municipal Corporation Office, Jagat, Station Main Road, Kalaburagi,
Gulbarga, Karnataka, 585105 / 8088934338; Guntur: 2Nd Shatter, 1St Floor. Hno. 6-14-48, 14/2 Lane, Arundal Pet, Guntur, Andhra Pradesh, 522002 / 0863-2339094; Gurgaon: 2Nd Floor, Vipul Agora, M. G. Road, In
The City Of Gurgaon, Gurgaon, Haryana, 122001 / 7518801817; Guwahati: 1St Floor, Bajrangbali Building, Near Bora Service Station, Gs Road, Guwahati, Assam, 781007 / 8811036746; Gwalior: City Centre, Near
Axis Bank, In The City Of Gwalior, Madhya Pradesh, Gwalior, Madhya Pradesh, 474009 / 7518801818; Haldwani: Above Kapilaz, Sweet House, Opp Lic Building, Pilikothi, Kaladhungi Road, Haldwani, Uttaranchal,
263139 / 7518801819; Haridwar: Shop No. - 17, Bhatia Complex, Near Jamuna Palace, Haridwar (Uttarakhand.), Haridwar, Uttaranchal, 249410 / 7518801820; Hassan: Sas No-212, Ground Floor, Sampige Road 1St
Cross, Near Hotel Souther Star, K R Puram, Hassan, Karnataka, 573201 / 08172 262065; Hissar: Shop No. 20, Ground Floor, R D City Centre, Railway Road, In The City Of Hissar, Hissar, Haryana, 125001 /
7518801821; Hoshiarpur: 1St Floor, The Mall Tower, Opp Kapila Hospital, Sutheri Road, Hoshiarpur, Punjab, 146001 / 01882-500143; Hubli: Ctc No.483/A1/A2, Ground Floor, Shri Ram Palza, Behind Kotak Mahindra
Bank, Club Road, Hubli, Karnataka, 580029 / 0836-2252444; Hyderabad: 303, Vamsee Estates, Opp Bigbazaar, Ameerpet, Hyderabad-16, Telangana-, Hyderabad, Telangana, 500034 / 040-44857874 / 75 / 76; Indore:
101, Diamond Trade Centre, Indore, Madhya Pradesh - Indore, Nearcurewell Hospital, Janjeerwala Square Indore, Indore, Madhya Pradesh, 452001 / 0731-4266828/4218902; Jabalpur: 3Rd Floor, R.R. Tower.5,
Lajpatkunj, Near Tayabali Petrol Pump, Jabalpur, Madhya Pradesh, 482001 / 0761-4923301; Jaipur: Office Number 101, 1St Floor, Okay Plus Tower, Next To Kalyan Jewellers, Government Hostel Circle, Ajmer Road,
Jaipur, Rajasthan, 302001 / 01414167715/17; Jalandhar: 1St Floor,Shanti Towers, Sco No. 37, Puda Complex,, Opposite Tehsil Complex, Jalandhar, Punjab, 144001 / 0181-5094410; Jalgaon: 3Rd Floor, 22
Yashodhan Ring Road, Jalgaon, Jalgaon, Maharashthra, 425001 / 9421521406; Jalpaiguri: D B C Road Opp Nirala Hotel, Opp Nirala Hotel, Opp Nirala Hotel, Jalpaiguri, West Bengal, 735101 / 03561-222136; Jammu:
Gupta'S Tower, 2Nd Floor, Cb-12, Rail Head Complex, Jammu, Jammu & Kashmir, 180012 / 0191-2458820 / 2458818; Jamnagar: 136-137-138 Madhav Palaza, Opp Sbi Bank, Nr Lal Bunglow, Jamnagar, Gujarat,
361001 / 0288 3065810; Jamshedpur: 2Nd Floor, R R Square, Sb Shop Area,Near Reliance Foot Print & Hotel- Bs Park Plaza, Main Road, Bistupur, Jamshedpur, Jharkhand, 831001 / 0657-6655003/ 6655004/
6655005/ 6655006/ 6655007; Jaunpur: R. N. Complex, Opposite Pathak Honda, Above Oriental Bank Of Commerce, In The City Of Jaunpur, Jaunpur, Uttar Pradesh, 222002 / 7518801822; Jhansi: 1St Floor, Puja
Tower, Near 48 Chambers, In The City Of Jhansi, Jhansi, Uttar Pradesh, 284001 / 7518801823; Jodhpur: Shop No. 6, Ground Floor, Gang Tower, Opposite Arora Moter Service Centre, Near Bombay Moter Circle,
Jodhpur, Jodhpur, Rajasthan, 342001 / 7737014590; Junagadh: 124-125 Punit Shopping Center, M.G Road, Ranavav Chowk, Junagadh, Gujarat, 362001 / 0285-2652220; Kannur: 2 Nd Floor, Prabhath Complex, Fort
Road, Nr.Icici Bank, Kannur, Kerala, 670001 / 0497-2764190; Kanpur: 15/46, B, Ground Floor, Opp : Muir Mills, Civil Lines, Kanpur, Uttar Pradesh, 208001 / 7518801824; Karimnagar: D.No: 2-10-1298,2Nd Floor,
Rathnam Arcade, Jyothi Nagar, Karimnagar, Telangana, 505001 / 0878-2244773; Karnal: 18/369, Char Chaman, Kunjpura Road, Behind Miglani Hospital, Karnal, Haryana, 132001 / 0184-2252524; Karur: No 88/11 B B
Plaza, Nrmp Street, K S Mess Back Side, Karur, Tamil Nadu, 639002 / 04324-241755; Khammam: 11-4-3/3, Shop No. S-9, Srivenkata Sairam Arcade, Old Cpi Office, Near Priyadarshini College,Nehru Nagar,,
Khammam, Telangana, 507002 / 8008865802; Kharagpur: Sbi Building, Malancha Road, Po: Kharagpur, Ps: Kharagpur, Holding No 254/220, Ward No.16, Dist: Paschim Medinipur, Kharagpur, West Bengal, 721304 /
03222-253380; Kolhapur: 605/1/4 E Ward, Shahupuri 2Nd Lane, Laxmi Niwas, Near Sultane Chambers, Kolhapur, Maharashthra, 416001 / 0231 2653656; Kolkata: Apeejay House (Beside Park Hotel), C Block,3Rd
Floor, 15 Park Street, Kolkata, West Bengal, 700016 / 033 66285900; Kollam: Ground Floor,A Narayanan Shopping Complex, Kausthubhsree Block, Kadapakada, Kollam, Kerala, 691008 / 474-2747055; Korba: Nidhi
Biz Complex, Plot No 5, Near Patidar Bhawan, T. P. Nagar, In The City Of Korba, Korba, Chatisgarh, 495677 / 7518801826; Kota: D-8, Shri Ram Complex, Opposite Multi, Purpose School, Gumanpura, Kota, Kota,
Rajasthan, 324007 / 0744-5100964; Kottayam: 1St Floor Csiascension Square, Railway Station Road, Collectorate P O, Kottayam, Kerala, 686002 / 0481-2300868/2302420; Kurnool: Shop No:47, 2Nd Floor, S Komda
Shoping Mall, Kurnool, Andhra Pradesh, 518004 / 08518-228550; Lucknow: Ist Floor, A. A. Complex, 5 Park Road, Hazratganj, Thaper House, Lucknow, Uttar Pradesh, 226001 / 7518801830; Ludhiana: Sco - 136, 1St
Floor Above Airtel Showroom, Feroze Gandhi Market, Ludhiana, Punjab, 141001 / 0161-4648747; Madurai: Rakesh Towers, 30-C, Ist Floor, Bye Pass Road, Opp Nagappa Motors, Madurai, Tamil Nadu, 625010 / 0452-
2605856; Malappuram: First Floor, Peekays Arcade, Down Hill, Malappuram, Kerala, 676505 / 0483-2731480; Malda: Ram Krishna Pally, No.1 Govt Colony, Ground Floor, English Bazar; Malda, West Bengal, 732101 /
03512-223763; Mandi: House No. 99/11, 3Rd Floor, Opposite Gss Boy School, School Bazar, In The City Of Mandi, Mandi, Uttar Pradesh, 175001 / 7518801833; Mangalore: Mahendra Arcade Opp Court Road,
Fin Technologies Private Limited OfficesK
Factsheet January, 2021

Investment Manager:LIC MUTUAL FUND ASSET MANAGEMENT LIMITED
Fax : +91 22 2283 5606 E-mail: [email protected] Floor, Industrial Assurance Bldg., Opp. Churchgate Station, Mumbai 400 020. Board : +91 22 6601 6000
MUTUAL FUND INVESTMENTS ARE SUBJECT TO MARKET RISKS, READ ALL SCHEME RELATED DOCUMENTS CAREFULLY.
/LICMutual /company/LICMutual/LICMutual 1800-258-5678Connect with us: www.licmf.com
Karangal Padi, , Mangalore, Karnataka, 575003 / 0824-2496289; Margao: 2Nd Floor, Dalal Commercial Complex, Pajifond, Margao, Goa, 403601 / 0832-2731823; Mathura: Shop No. 9, Ground Floor, Vihari Lal Plaza,
Opposite Brijwasi Centrum, Near New Bus Stand, In The City Of Mathura, Mathura, Uttar Pradesh, 281001 / 7518801834; Meerut: H No 5, Purva Eran, Opp Syndicate Bank, Hapur Road, Meerut, Meerut, Uttar Pradesh,
250002 / 7518801835; Mehsana: Ff-21 Someshwar Shopping Mall, Modhera Char Rasta, Mehsana, Gujarat, 384002 / 02762-242950; Mirzapur: House No. 404, Ward No. 8, Dankeenganj, Mirzapur, , Mirzapur, Uttar
Pradesh, 231001 / 7518801836;Moga: 1St Floor,Dutt Road, Mandir Wali Gali, Civil Lines, Barat Ghar, Moga, Punjab, 142001 / 01636 - 230792; Moradabad: Chadha Complex, G. M. D. Road, Near Tadi Khana, Chowk, In
The City Of Moradabad, Moradabad, Uttar Pradesh, 244001 / 7518801837; Morena: House No. Hig 959, Near Court, Front Of Dr. Lal Lab, Old Housing Board Colony, Morena, Madhya Pradesh, 476001 / 7518801838;
Mumbai: 24/B, Raja Bahadur Compound, Ambalal Doshi Marg, Behind Bse Bldg, Fort, Maharashthra, 400001 / 022-66235353; Muzaffarpur: First Floor Saroj Complex, Diwam Road, Near Kalyani Chowk, Muzaffarpur,
Muzaffarpur, Bihar, 842001 / 7518801839; Mysore: L-350, Silver Tower, Ashoka Road, Opp.Clock Tower, Mysore, Karnataka, 570001 / 0821-2438006; Nadiad: 311-3Rd Floor City Center, Near Paras Circle, Nadiad,
Gujarat, 387001 / 0268-2563245; Nagerkoil: Hno 45,1St Floor, East Car Street, Nagercoil, Tamil Nadu, 629001 / 04652 - 233552; Nagpur: Plot No. 2, Survey No. 1032 And 1033 Of Gagdakhare Town, Dharampeth,, ,
Nagpur, Maharashthra, 440010 / 0712-2533040; Nanded: Shop No.4, Santakripa Market, G G Road, Opp.Bank Of India, Nanded, Maharashthra, 431601 / 02462-237885; Nashik: S-9, Second Floor, Suyojit Sankul,
Sharanpur Road, Nasik, Maharashthra, 422002 / 0253-6608999; Navsari: 103, 1St Floore Landmark Mall, Near Sayaji Library, Navsari Gujarat, Navsari, Gujarat, 396445 / 9081903040; Nellore: D No:16-5-66 Ramarao
Complex No:2Shop No:305, 3Rd Floor Nagula Mitta Rode, Opp Bank Of Baroda. Nellore, Nellore, Andhra Pradesh, 524001 / 0861 2349940; New Delhi: 305 New Delhi House, 27 Barakhamba Road, New Delhi, New
Delhi, 110001 / 011- 43681700; Nizamabad: H No:5-6-430, Above Bank Of Baroda First Floor, Beside Hdfc Bank,Hyderabad Road, Nizamabad, Telangana, 503003 / 08462-224366; Noida: F - 21, Sector - 18, In The City
Of Noida, , Noida, Uttar Pradesh, 201301 / 7518801840; Palghat: No: 20 & 21, Metro Complex H.P.O.Road Palakkad, H.P.O.Road, Palakkad, Kerala, 678001 / 9895968533; Panipat: 3Rd Floor Preet Tower, Behind
Akash Institute, Gt Road-Panipat, Panipat, Haryana, 132103 / 7518801841; Panjim: Flat No.1-A, H. No. 13/70, Timotio Bldg, Heliodoro Salgado Road, Next To Navhind Bhavan (Market Area), Panjim, Goa, 403001 /
0832-2426874; Pathankot: 2Nd Floor, Sahni Arcade Complex, Adj.Indra Colony Gate Railway Road, Pathankot, Pathankot, Punjab, 145001 / 0186-5080188; Patiala: Sco 27 D, Chotti Baradari, Near Car Bazaar, Patiala,
Punjab, 147001 / 0175-5004349; Patna: 3A, 3Rd Floor Anand Tower, Exhibition Road, Opp Icici Bank, Patna, Bihar, 800001 / 0612-4323066; Pollachi: 1St Floor, Mkg Complex, Opp To Gowri Shankar Hotel, Pollachi,
Tamil Nadu, 642002 / 04259- 235111; Pondicherry: Building No:7, 1St Floor, Thiayagaraja Street, Pondicherry, Pondicherry, 605001 / 0413-45490253; Proddatur: D.No: 4/625, Bhairavi Complex, Bhairavi Complex,
Upstairs Karur Vysya Bank, Gandhi Road, Proddatur, Andhra Pradesh, 516360 / 08564 - 242898; Pune: Office No 207-210, 2Nd Floor, Kamla Arcade, Jangli Maharaj Road, Opposite Balgandharva, Shivaji Nagar, Pune,
Maharashthra, 411005 / 020 -66210449; Raipur: Office No S-13, Second Floor, Reheja Tower, Fafadih Chowk, Jail Road, Raipur, Chatisgarh, 492001 / 0771-4912611; Rajahmundry: D.No.6-1-4, Rangachary Street,
T.Nagar, Near Axis Bank Street, Rajahmundry, Andhra Pradesh, 533101 / 0883-2434468/70; Rajkot: 302, Metro Plaza, Near Moti Tanki Chowk, Rajkot, Rajkot, Gujarat, 360001 / 9081903025; Ranchi: Room No 307 3Rd
Floor, Commerce Tower, Beside Mahabir Tower, Ranchi, Jharkhand, 834001 / 0651-2331320; Ratlam: 1 Nagpal Bhawan Free Ganj Road, Do Batti, Near Nokia Care, Ratlam, Madhya Pradesh, 457001 / 07412-320398;
Renukoot: C/O Mallick Medical Store, Bangali Katra, Main Road, Renukoot, (Dist. Sonebhadra ), Renukoot, Uttar Pradesh, 231217 / 7518801842; Rewa: In Front Of Teerth Memorial Hospital, In The City Of Reewa, ,
Rewa, Madhya Pradesh, 486001 / 7518801843; Rohtak: Shop No 14, Ground Floor, Ashoka Plaza,Delhi Road, , Rohtak, Haryana, 124001 / 7518801844; Roorkee: Shree Ashadeep Complex 16, Tyagi Dairy Road, Civil
Lines,Near Income Tax Office, , Roorkee, Uttaranchal, 247667 / 7518801845; Rourkela: 2Nd Floor, Main Road, Udit Nagar, Rourkela, Sundargarh, Rourekla, Orissa, 769012 / 0661-2500005; Sagar: Ii Floor, Above Shiva
Kanch Mandir., 5 Civil Lines, Sagar, Sagar, Madhya Pradesh, 470002 / 07582-402404; Saharanpur: 18 Mission Market, Court Road, Saharanpur, Uttar Pradesh, 247001 / 7518801846; Salem: No 3/250, Brindavan
Road, 6Th Cross,Perumal Kovil Back Side, Fairland'S, Salem, Tamil Nadu, 636016 / 0427-4020300; Sambalpur: Sahej Plaza; First Floor, Shop No. 219; Golebazar, Sambalpur, Sambalpur, Orissa, 768001 / 0663-
2533437; Satna: Jainam Market, Purana Power House Chauraha, Panni Lal Chowk, In The City Of Satna, Rewa Road, Satna, Madhya Pradesh, 485001 / 7518801847; Shillong: Annex Mani Bhawan, Lower Thana
Road, Near R K M Lp School, Shillong, Meghalaya, 793001 / 0364 - 2506106; Shimla: Triveni Building, By Pas Chowkkhallini, Shimla, Himachal Pradesh, 171002 / 7518801849; Shimoga: Sri Matra Naika Complex, 1St
Floor, Above Shimoga Diagnostic Centre, Llr Road, Durgigudi, Shimoga, Karnataka, 577201 / 08182-228799; Shivpuri: Near Hotel Vanasthali, In Front Of Sawarkar Park, A. B. Road, In The City Of Shivpuri, Shivpuri,
Madhya Pradesh, 473551 / 7518801850; Sikar: First Floor, Super Tower, Behind Ram Mandir Near Taparya Bagichi, Sikar, Rajasthan, 332001 / 01572-250398; Silchar: N.N. Dutta Road, Chowchakra Complex,
Premtala, Silchar, Assam, 788001 / 3842261714; Siliguri: Nanak Complex, Sevoke Road, Siliguri, West Bengal, 734001 / 0353-2522579; Sitapur: 12/12, Surya Complex, Station Road, Sitapur, Sitapur, Uttar Pradesh,
261001 / 7518801851; Solan: Disha Complex, 1St Floor, Above Axis Bank, Rajgarh Road, In The City Of Solan, Solan, Himachal Pradesh, 173212 / 7518801852; Solapur: Block No 06, Vaman Nagar, Opp D-Mart, Jule
Solapur, Solapur, Maharashthra, 413004 / 0217-2300021 / 2300318; Sonepat: 2Nd Floor, Dp Tower, Model Town, Near Subhash Chowk, Sonepat, Haryana, 131001 / 7518801853; Sri Ganganagar: Address Shop No. 5,
Opposite Bihani Petrol Pump, Near Baba Ramdev Mandir Nh - 15, Sri Ganganagar, Rajasthan, 335001 / 0154-2470177; Srikakulam: D No 4-4-97, First Floor, Behind Sri Vijayaganapathi Temple, Pedda Relli Veedhi,
Palakonda Road, Srikakulam, Andhra Pradesh, 532001 / 8942229925; Sultanpur: 1077/3, Civil Lines Opp Bus Stand, Civil Lines, Sultanpur, Uttar Pradesh, 228001 / 7518801854; Surat: Office No: -516, 5Th Floor,
Empire State Building, Near Udhna Darwaja, Ring Road, Surat, Gujarat, 395002 / 9081903041; T Nagar: No 23, Cathedral Garden Road Nungambakkam, Chennai, Tamilnadu, 600 017 / 044 - 28151034; Thanjavur: No
1, Underground,Nallaiyah Complex,, Srinivasam Pillai Road,, , Tanjore, Tamil Nadu, 613001 / 04362-275415; Tirunelveli: 55/18, Jeney Building, S N Road, Near Aravind Eye Hospital, Tirunelveli, Tamil Nadu, 627001 /
0462-4001416; Tirupathi: H.No:10-13-425, 1St Floor , Tilak Road,, Opp: Sridevi Complex ,, Tirupathi, Andhra Pradesh, 517501 / 9885995544 / 0877-2255797; Tirupur: No 669A,Kamaraj Road, Near Old Collector
Office, , Tirupur, Tamil Nadu, 641604 / 0421-4202780; Tiruvalla: 2Nd Floor,Erinjery Complex, Ramanchira, Opp Axis Bank, Thiruvalla, Kerala, 689107 / 04862-211209; Trichur: 2Nd Floor,Brothers Complex, Naikkanal
Junction,Shornur Road, Near Dhanalakshmi Bank H O, Thrissur, Kerala, 680001 / 0487- 6999987; Trichy: No 23C/1 E V R Road, Near Vekkaliamman Kalyana Mandapam, Putthur, Trichy, Tamil Nadu, 620017 / 0431-
4020227; Trivandrum: 2Nd Floor, Akshaya Tower, Sasthamangalam, Trivandrum, Kerala, 695010 / 0471 - 2725728; Tuticorin: 4B/A-10Mani Nagar, Mangal Mall,, Palayamkottai Road, Tuticorin, Tamil Nadu, 628003 /
0461-2334603; Udaipur: Shop No. 202, 2Nd Floor Business Centre, 1C Madhuvan, Udaipur, Udaipur, Rajasthan, 313001 / 0294 2429370; Ujjain: Heritage Shop No. 227, 87 Vishvavidhyalaya Marg, Station Road, Near
Icici Bank Above Vishal Megha Mart, Ujjain, Madhya Pradesh, 456010 / 0734-4250007 / 08; Valsad: 406 Dreamland Arcade, Opp Jade Blue, Tithal Road, Tithal Road, Valsad, Gujarat, 396001 / 02632-258481; Vapi: A-8,
First Floor, Solitaire Business Centre, Opp Dcb Bank, Gidc Char Rasta, Silvassa Road, Vapi, Gujarat, 396191 / 9081903028; Varanasi: D-64/132, 2Nd Floor, Ka, Mauza, Shivpurwa, Settlement Plot No 478, Pargana :
Dehat Amanat, Mohalla Sigra, Varanasi, Uttar Pradesh, 221010 / 7518801855; Vashi: C, Wing Flat NO. 324, 1st Floor, Vashi Plaza, Sector 17 Vashi, Navi Mumbai, Maharashtra, 400 703 / 22-27802684; Vellore: No. 6,
Nexus Towers, 2Nd Floor, Officer'S Line, Above Peter England & Bata Showroom Opp. To Voorhees School, Vellore, Tamil Nadu, 632001 / 0416-41603806; Vijayanagaram: D No : 20-20-29, 1St Floor, Surya Nagar,
Kalavapuvvu Meda, Near Ayodhya Stadium, Dharmapuri Road, Vizianagaram, Vizianagaram, Andhra Pradesh, 535002 / 08922-236965; Vijayawada: Address-1Stfloor, Hno26-23-,
Sundarammastreet,Gandhinagar,Vijayawada,Krishna Ap, Labbipet, Vijayawada, Andhra Pradesh, 520010 / 0866-6604032/39/40; Vile Parle: Shop No.1 Ground Floor, Dipti Jyothi Co-operative Housing Society, Near
MTNL office P M Road, Vile Parle East, Mumbai, Maharashtra / 022 26100967; Visakhapatnam: Ground Floor, 48-10-40, Sri Nagar Colony, Visakhapatnam, Andhra Pradesh, 530016 / 0891-2714125; Warangal: Shop
No22, Ground Floor Warangal, City Center,15-1-237, Mulugu Road Junction, Warangal, Telangana, 506001 / 0870-2441513; Yamuna Nagar: B-V, 185/A, 2Nd Floor, Jagadri Road, Near Dav Girls College, (Uco Bank
Building) Pyara Chowk, Yamuna Nagar, Haryana, 135001 / 7518801857;

Invest in
Less taxing!
Making your journey great
Tax benefit u/s 80c*
MUTUAL FUND INVESTMENTS ARE SUBJECT TO MARKET RISKS, READ ALL SCHEME RELATED DOCUMENTS CAREFULLY.
/LICMutual /company/LICMutual/LICMutual 1800-258-5678Connect with us: www.licmf.com
1800-258-5678
Call Toll FreeTo know more, please consult your Financial Advisor
OR
This product is suitable for investors who are seeking*:
• Long-term capital growth.
• Investment in equity and equity-related securities.
• Risk - Very High *Investors should consult their financial advisors if in
doubt about whether the product is suitable for them.
* Subject to ₹ 1.5 lakh under Section 80 C of the Income Tax Act, 1961(As per prevailing tax laws in India).
Investors understand that their principalwill be at Very High risk
Low
Low toModerate
Moderate ModeratelyHigh
High
Very High
RISKOMETER HIGHLOW


