Download - ONGC Investor Presentation Vff

8/9/2019 ONGC Investor Presentation Vff
http://slidepdf.com/reader/full/ongc-investor-presentation-vff 1/32
Investor Presentation
Strictly Private & Confidentia
November 2014

8/9/2019 ONGC Investor Presentation Vff
http://slidepdf.com/reader/full/ongc-investor-presentation-vff 2/32
Disclaimer
This presentation is issued by Oil and Natural Gas Corporation Limited (the “Company” or “ONGC”) for general information purposes only, without regard to specific objectives, suitability, financial
situations and needs of any particular person and does not constitute any recommendation or form part of any offer or invitation or inducement to sell or issue, or any solicitation of any offer to purchase or
subscribe for, any securities of the Company, nor shall it or any part of it or the fact of its distribution form the basis of, or be relied on in connection with, any contract or commitment therefor. This
presentation does not solicit any action based on the material contained herein. Nothing in this presentation is intended by the Company to be construed as legal, accounting or tax advice.
The presentation contains various financial data and business related data concerning the Company (including reserves and production capacity). Unless otherwise specified, all such data is on a
consolidated basis, i.e., the Company and all its subsidiaries taken together. Further, such data / figures may have been rounded off to the nearest integer.
This presentation may not be copied or disseminated, in whole or in part, and in any manner or for any purpose. No person is authorized to give any information or to make any representation not
contained in or inconsistent with this presentation and if given or made, such information or representation must not be relied upon as having been authorized by any person. Failure to comply with this
restriction may constitute a violation of applicable laws. Neither this document nor any part or copy of it may be distributed, directly or indirectly, in the United States or to any U.S. persons within the
definition set out in Regulation S under the Securities Act of 1933, as amended (the “Securities Act”). The distribution of this document in certain jurisdictions may be restricted by law and persons into
whose possession this presentation comes should inform themselves about and observe any such restrictions. By reviewing this presentation, you agree to be bound by the foregoing limitations.
You further represent and agree that (i) (A) you are located outside the United States and you are permitted under the laws of your jurisdiction to receive this presentation or (B) you are located in the
United States and are a “qualified institutional buyer” (as defined in Rule 144A under the Securities Act) and (ii) you are not, and you are not acting on behalf of, a “Benefit Plan Investor" as defined in the
Employee Retirement Income Security Act of 1974, as amended (“ERISA”), (a “Relevant Person”). This presentation is only directed at Relevant Persons and any person who is not a Relevant Person
should not act or rely on this presentation or any of its contents.
This presentation is not an offer to sell or a solicitation of any offer to buy the securities of the Company in the United States or in any other jurisdiction where such offer or sale would be unlawful.
Securities may not be offered, sold, resold, pledged, delivered, distributed or transferred, directly or indirectly, in to or within the United States absent registration under the Securities Act, except pursuantto an exemption from, or in a transaction not subject to, the registration requirements of the Securities Act and in compliance with any applicable securities laws of any state or other jurisdiction of the
United States. The Company’s securities have not been and will not be registered under the Securities Act.
This presentation has been prepared by the Company based upon information available in the public domain. This presentation has not been approved and will not or may not be reviewed or approved by
any statutory or regulatory authority in India or by any stock exchange in India. This presentation includes statements which may constitute forward-looking statements relating to the business, financial
performance, strategy and results of the Company and/or the industry in which it operates. Forward-looking statements are statements concerning future circumstances and results, and any other
statements that are not historical facts, sometimes identified by the words "believes", "expects", "predicts", "intends", "projects", "plans", "estimates", "aims", "foresees", "anticipates", "targets", and similar
expressions. The forward-looking statements, including those cited from third party sources, contained in this presentation are based on numerous assumptions and are uncertain and subject to risks. The
actual results could differ materially from those projected in any such forward-looking statements because of various factors, including, but not limited to, changes in demand, competition and technology.
Neither the Company nor its affiliates or advisors or representatives nor any of its or their parent or subsidiary undertakings or any such person's officers or employees guarantees that the assumptions
underlying such forward-looking statements are free from errors nor do any of such persons accept any responsibility for the future accuracy of the forward-looking statements contained in this
presentation or the actual occurrence of the forecasted or targeted developments nor do they assume any responsibility to publicly amend, modify or revise any forward-looking statements, on the basis of
any subsequent developments, information or events, or otherwise. Forward-looking statements speak only as of the date of this presentation.
The information contained in these materials has not been independently verified. None of the Company, its directors, promoter or affiliates, nor any of its or their respective employees, advisers or
representatives or any other person accepts any responsibility or liability whatsoever, whether arising in tort, contract or otherwise, for any errors, omissions or inaccuracies in such information or opinions
or for any loss, cost or damage suffered or incurred howsoever arising, directly or indirectly, from any use of this document or its contents or otherwise in connection with this document, and makes no
representation or warranty, express or implied, for the contents of this document including its accuracy, fairness, completeness or verification or for any other statement made or purported to be made by
any of them, or on behalf of them, and nothing in this document or at this presentation shall be relied upon as a promise or representation in this respect, whether as to the past or the future. Past
performance is not a guide for future performance. The information contained in this presentation is current, and if not stated otherwise, made as of the date of this presentation. The Company undertake
no obligation to update or revise any information in this presentation as a result of new information, future events or otherwise. Any person/ party intending to provide finance/ invest in the shares/
businesses of the Company shall do so after seeking their own professional advice and after carrying out their own due diligence procedure to ensure that they are making an informed decision.
1
8/9/2019 ONGC Investor Presentation Vff
http://slidepdf.com/reader/full/ongc-investor-presentation-vff 3/32
Table of Contents
1. Introduction 2
2. Key Investment Highlights 6
3. Robust Financial Profile 214. Key Risks 24
Appendix

8/9/2019 ONGC Investor Presentation Vff
http://slidepdf.com/reader/full/ongc-investor-presentation-vff 4/32
1. Introduction

8/9/2019 ONGC Investor Presentation Vff
http://slidepdf.com/reader/full/ongc-investor-presentation-vff 5/32
(1) Directorate General of Hydrocarbons, India as of 1 Apr 2013.(2) Market Data as of 14 th November, 2014. Based on FX: 1USD = 60 INR(3) BSE as of October 31, 2014.(4) Revenue includes other income
ONGC: An Introduction
Rich Heritage
Integrated O&G Player
Dominant Position inIndia and Expanding
Global Presence
Fully Self Serviced E&PCompany
Strong Reserve Base
Strong Financials
Over 50 years of experience
Discovered 6 out of 7 producing basins of India(1)
83% of India’s in place Oil and Gas discovered by ONGC(1)
Integrated presence across hydrocarbon value chain
Dominant E&P business
Largest exploration acreage (49%) and mining lease (81%)
holder in India(1)
Strong track record of overseas growth
World-class infrastructure and in-house expertise
Integration benefits – low cost of discovery and operations
Total 2P Reserves: 1,667 MMTOE, 3P Reserves: 2,004
MMTOE as of Mar 2014
3P Reserve replacement of over 100% for 9 years
Market Cap: US$56.1 billion(2) (3)
FY14 Revenue
(4)
: US$30.2 billion; FY14 PAT: US$4.4 billion
India’s Flagship Oil & Gas “Maharatna” Company Engaged in the Exploration & Production, Transportation andRefining of Crude Oil and Natural Gas
Note: All financials are as per company filings with the stock exchanges. Mmboe: million barrels of oil equivalent
2 Introduction

8/9/2019 ONGC Investor Presentation Vff
http://slidepdf.com/reader/full/ongc-investor-presentation-vff 6/32
ONGC: Demonstrated Track Record of Delivering Value
1950 1960
50+ Years of Experience in the Oil & Gas Sector
Source: Company ReportsNote: Graph is representative; not to scale.
1970 1980 1990 2000 2010
1955:Inception
1958: First Oilin Cambay
1965: Hydrocarbons IndiaLimited (HIL) incorporated
1970: FirstOffshore Well
1974: MumbaiHigh Discovered
1984: GAILformed out of
ONGC
1997: NavratnaStatus
1994: Convertedinto LimitedCompany
1999: EquitySwap ONGC,
IOC, GAIL
2003: Acquired MRPL;1st Equity O&G Investment
– Sudan / Vietnam
2004: GoI Divests10% stake
2004-07: Investment inDiversification – OMPL,MSEZ, OTPC, DSEZ
2010: MaharatnaStatus
2010: CBMProduction
2011: EstablishedShale GasPresence
2012 :MRPL 15MMTPA Capacity;
OTPC Starts
2012: GOI Divests4.91%
2012: PP2030Launched
2013: Investment in Azerbaijan,
Mozambique & Brazil
2014
3 Introduction

8/9/2019 ONGC Investor Presentation Vff
http://slidepdf.com/reader/full/ongc-investor-presentation-vff 7/32
Note: Market Data as of 14 th Nov 2014. FX: 1 USD = 60 INR; 1) Largest in terms of initial in-place domestic resources and domestic ultimate reserves; 2) ONGC directly holds 46%,and MRPL holds 3%; 3) Envisaged stake; 4) Generationof power already started from first unit; 2nd unit to be operational by end Nov’14; 5) Damodar Valley Raniganj Block, West Bengal
ONGC: Leading Presence Across the Value Chain
Petrochemicals and Refinery Value Chain
Vertical Integration Across Energy Value Chain
Exploration Production Downstream / Refining
Domestic Presence: Largest(1) O&G
player with domestic 3P reserve of1,331 MMTOE
International Presence: US$ 22bn
invested in 35 projects in 16 countries
– inorganic expansion focus
New Discoveries: 14 Oil & Gas
discoveries in FY14. 3P Reserve
replacement ratio >100% for past 9
years
FY14 Domestic Production
FY14 Overseas Production
– Oil & Gas – 8.4 MMTOE
28,139 km of pipelines
MRPL – FY14 throughput 14.59 MMT
– Current capacity – 15MMTPA; potential to enhance to18MMTPA
– ONGC 71.62% equity stake; Market Cap – US$ 1.7bn
Petronet LNG – 10 MMTPA LNG Terminal
– JV with IOCL, GAIL and BPCL; Market Cap – US$ 2.5bn
OPaL – 1.1 MMTPA Ethylene Cracker & Polymer Plant
– Pre-commissioning activities started, commercial operationscheduled June’15
– ONGC – 26%(3) equity stake
OMPL – Aromatics Petrochemicals Complex
– Plant commissioned, production commenced for Benzene
and Para-xylene – ONGC 49%(2) equity stake
Shale Gas: Drilled first well in 2011(5)
Coal Bed Methane: Commenced production in 2010. Operating in 4
blocks with established in-place resources of 83 BCM
Renewable Energy: 51MW wind energy plant commissioned in Gujarat
in 2008, 102MW being commissioned in Rajasthan
Continued Investment in Complementary Infrastructure
OTPC: 2 units totaling 726.6MW(4) (363.3 MW unit operational)gas based combined cycle power plant. ONGC stake ~50%.
Petronet MHB : Pipeline for transport of finished refinery goods
ONGC Teri Biotech: Biotechnological energy solutions
Dahej / Mangalore SEZ: Special Economic Zones
Pawanhans Helicopters: Offshore Transportation
Standalone with JVs
Oil 22.25 25.99 MMT
Gas 23.28 24.85 BCM
Unconventional & Alternate Energy Other Businesses
4 Introduction

8/9/2019 ONGC Investor Presentation Vff
http://slidepdf.com/reader/full/ongc-investor-presentation-vff 8/32
ONGC: Shareholding Structure
Listed on BSE on 29th July 1995 / NSE on 20 July 1995
Number of shares: 8,555 mn
Market Cap: US$56,073mn
Share Price (52Wk High/Low): Rs.472 (9 th June’14) /Rs. 263.30 (13th Nov’13)
FY14 Dividend/Share: Rs. 9.50
Top Shareholders other than GoI % Shareholding
LIC 7.7%
IOCL 7.7%
GAIL 2.4%
Franklin Resources 1.0%
Vanguard Group 0.6%
Note: Market Data as of 14th November, 2014; Shareholding Data as of 31st October 2014. FX Used: 1USD = 60INR
Govt. of India69%
FIIs7%
DIIs10%
Bodies
Corporate12%
Individuals2%
Source: BSE Website, Bloomberg
5 Introduction

8/9/2019 ONGC Investor Presentation Vff
http://slidepdf.com/reader/full/ongc-investor-presentation-vff 9/32
2. Key Investment Highlights

8/9/2019 ONGC Investor Presentation Vff
http://slidepdf.com/reader/full/ongc-investor-presentation-vff 10/32
Key Investment Highlights
India – StableRegulatory and
Attractive IndustryDynamics
Dominant India Position – Largest E&P Player in
India
Significant InternationalPresence Ensuring
India’s Energy Security
Fully Integrated In-houseExecution Capabilities
and Infrastructure
Increasing Value Capturefrom Downstream
Unlocking AlternateEnergy Potential
Best-in-classManagement & GoI
Parentage
Increasing RegulatoryClarity to Drive Growth &
Profitability
1
2
3
45
6
7
8
6 Key Investment Highlights
N G t h A l t d R f A d
8/9/2019 ONGC Investor Presentation Vff
http://slidepdf.com/reader/full/ongc-investor-presentation-vff 11/32
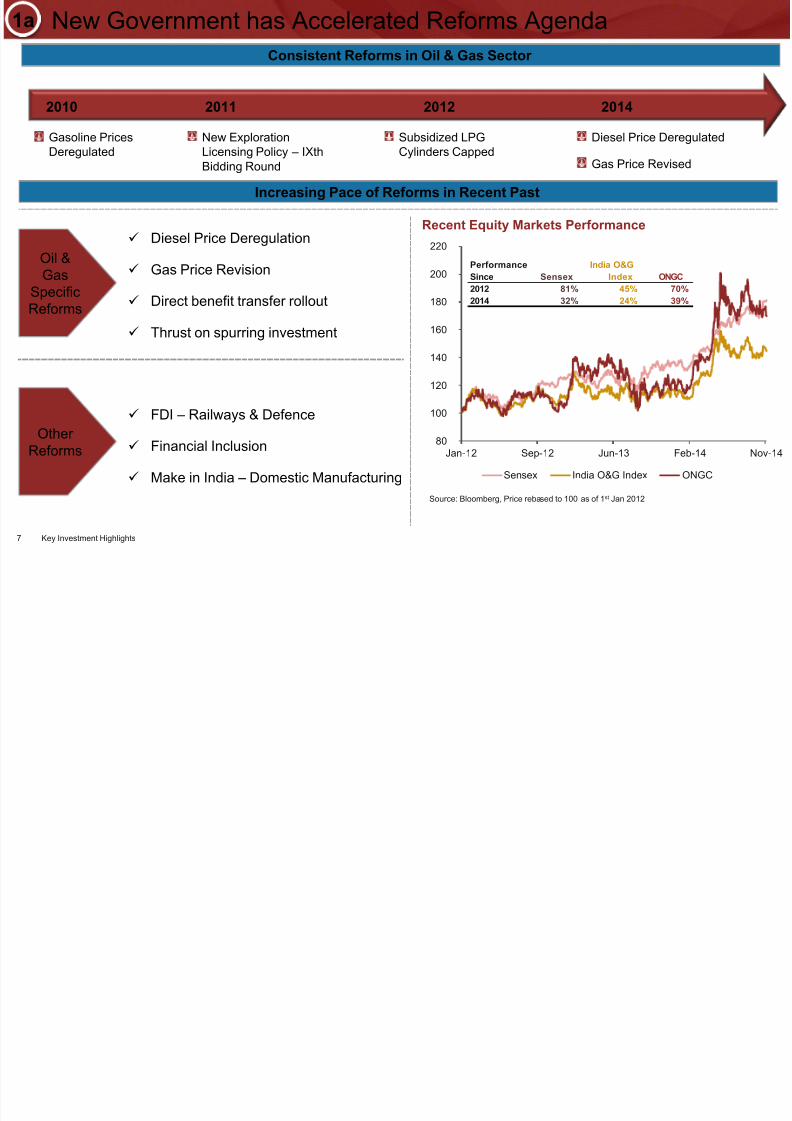
New Government has Accelerated Reforms Agenda
2010 2011 2012 2014
80
100
120
140
160
180
200
220
Jan-12 Sep-12 Jun-13 Feb-14 Nov-1
Sensex India O&G Index ONGC
Recent Equity Markets Performance
Source: Bloomberg, Price rebased to 100 as of 1st Jan 2012
Oil &
GasSpecificReforms
OtherReforms
Diesel Price Deregulation
Gas Price Revision
Direct benefit transfer rollout
Thrust on spurring investment
FDI – Railways & Defence
Financial Inclusion
Make in India – Domestic Manufacturing
Gasoline PricesDeregulated New ExplorationLicensing Policy – IXthBidding Round
Subsidized LPGCylinders Capped Diesel Price Deregulated
Gas Price Revised
Increasing Pace of Reforms in Recent Past
Performance
Since Sensex
India O&G
Index ONGC2012 81% 45% 70%
2014 32% 24% 39%
Consistent Reforms in Oil & Gas Sector
1a
7 Key Investment Highlights
I di Att ti F d t l D i
1b
8/9/2019 ONGC Investor Presentation Vff
http://slidepdf.com/reader/full/ongc-investor-presentation-vff 12/32
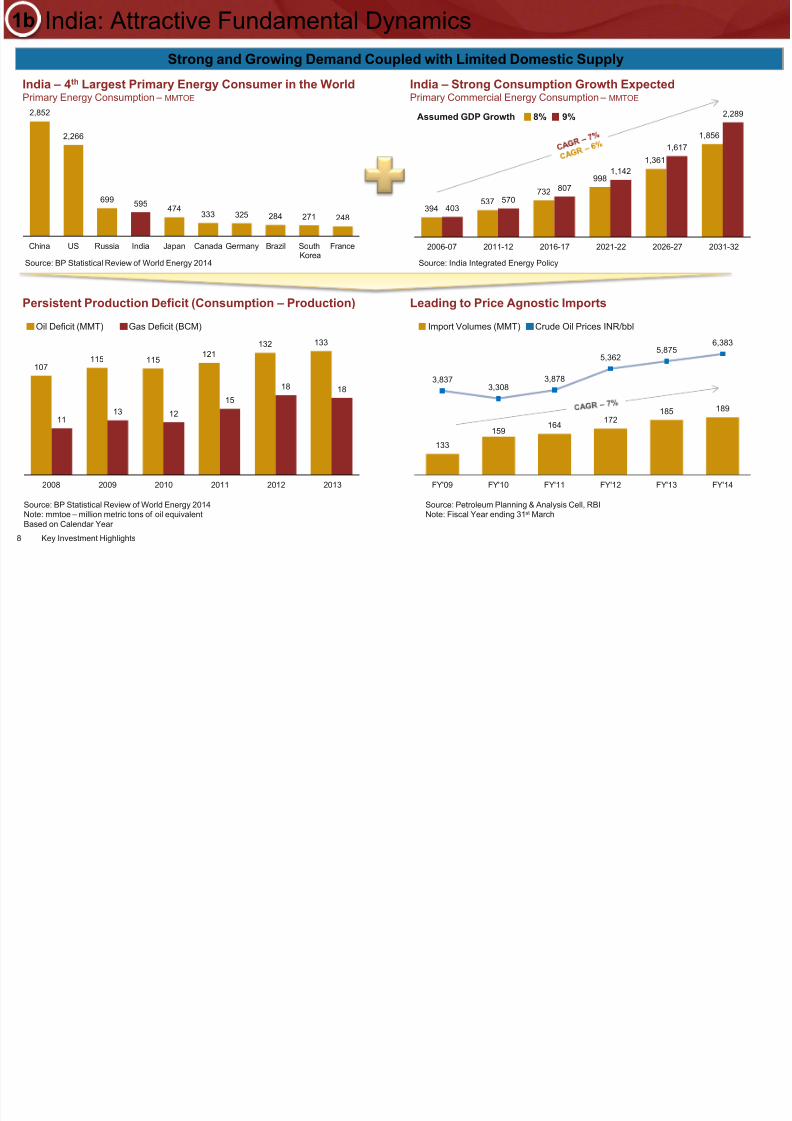
India: Attractive Fundamental Dynamics
India – 4th Largest Primary Energy Consumer in the WorldPrimary Energy Consumption – MMTOE
India – Strong Consumption Growth ExpectedPrimary Commercial Energy Consumption – MMTOE
Persistent Production Deficit (Consumption – Production)
Oil Deficit (MMT) Gas Deficit (BCM)
Leading to Price Agnostic Imports
Import Volumes (MMT) Crude Oil Prices INR/bbl
Source: BP Statistical Review of World Energy 2014 Source: India Integrated Energy Policy
Source: BP Statistical Review of World Energy 2014Note: mmtoe – million metric tons of oil equivalentBased on Calendar Year
Source: Petroleum Planning & Analysis Cell, RBINote: Fiscal Year ending 31st March
Strong and Growing Demand Coupled with Limited Domestic Supply
2,852
2,266
699595
474333 325 284 271 248
China US Russia India Japan Canada Germany Brazil South Korea
France
394537
732
998
1,361
1,856
403570
807
1,142
1,617
2,289
2006-07 2011-12 2016-17 2021-22 2026-27 2031-32
107115 115
121132 133
1113
12
15
18 18
2008 2009 2010 2011 2012 2013
Assumed GDP Growth 8% 9%
133
159164 172
185 189
3,8373,308
3,878
5,3625,875
6,383
FY'09 FY'10 FY'11 FY'12 FY'13 FY'14
1b
8 Key Investment Highlights
I di C ti B k t I i Sh f Oil & G
1

8/9/2019 ONGC Investor Presentation Vff
http://slidepdf.com/reader/full/ongc-investor-presentation-vff 13/32
India Consumption Basket – Increasing Share of Oil & Gas
2013 Primary Energy Consumption Basket
World – 2013 India – 2013
Source: BP Statistical Review of World Energy 2014
1P Reserves (MMTOE) 2P Reserves (MMTOE)
Oil
29%
Natural Gas8%Coal
55%
Nuclear 1%
Hydro5% Renewables
2%
3P Reserves (MMTOE)
Oil33%
Natural Gas24%
Coal30%
Nuclear 4%
Hydro7% Renewables
2%
ONGC – Large & Growing Oil & Gas Reserve Base
India’s primary energy consumption is
disproportionately dependent on Coal
Oil & Gas expected to take a larger portion of
consumption going forward
ONGC has the largest Oil & Gas reserve base in
India
Source: Management EstimatesNote: MMTOE – million metric tons of oil equivalent
770 773 755
193 196 207
963 969 962
FY12 FY13 FY14
Domestic Overseas
1,033 1,055 1,066
393 396601
1,426 1,451
1,667
FY12 FY13 FY14
Domestic Overseas
1,287 1,327 1,367
426 433637
1,713 1,760
2,004
FY12 FY13 FY14
Domestic Overseas
1c
9 Key Investment Highlights
ONGC Dominant India Position
2

8/9/2019 ONGC Investor Presentation Vff
http://slidepdf.com/reader/full/ongc-investor-presentation-vff 14/32
ONGC: Dominant India Position
ONGC67%
Oil India11%
Others22%
ONGC49%
Reliance27%
Caim India2%
Oil India2%
Others20%
63.868.9
83.0 83.6 84.1 84.8 85.0
1.32x
1.44x
1.73x1.76x
1.79x1.84x
1.87x
FY08 FY09 FY10 FY11 FY12 FY13 FY14
Ultimate Reserves (MToE) RRR
ONGC81%
Reliance7%
Caim India6%
Oil India1%
Others6%
ONGC69%
OIL9%
Others21%
Leadership in Reserves and Exploration
Ultimate Reserves
Petroleum Exploration License Area
Mining Lease Area
Leading to Strong and Sustained Performance
Consistent Production Track RecordMMTOE
Dominant Share of Production
Strong Reserve Accretion and Robust Reserve Replacement Ratio
NELP Blocks – 4
Nomination
Blocks – 10
Offshore – 7
New Prospects Discovery
KGOSN041NANL #1 Gas
KGOSN041NANL#2 Gas
Seripalem-1(SRM-AA) Gas
MBOS51NAA#1 Gas
Mandapetta South # 1 Gas
NW-B173A-8 O&G
New Pool Discovery
GK-28 # 9 Gas
GK-42 # 3 Gas
Gandhar # 686 O&G
SB#300 (SBCG) Gas
Gedanapalli#3 (GLAC) Oil
KG982NA-M#3 O&G
Khubal#7 (KHBJ) Gas
Nandasan-111 (NNBC) Oil
14 O&G Discoveries in FY14
Source: Directorate General of Hydrocarbons, India as of 1 Apr 2013. Source: Company Filings & Management Estimates. Based on 3P
Source: Directorate General of Hydrocarbons Indiaas of 1 Apr 2013.
2
10 Key Investment Highlights
ONGC: Medium & Short Term Plans for Domestic Business
2
8/9/2019 ONGC Investor Presentation Vff
http://slidepdf.com/reader/full/ongc-investor-presentation-vff 15/32
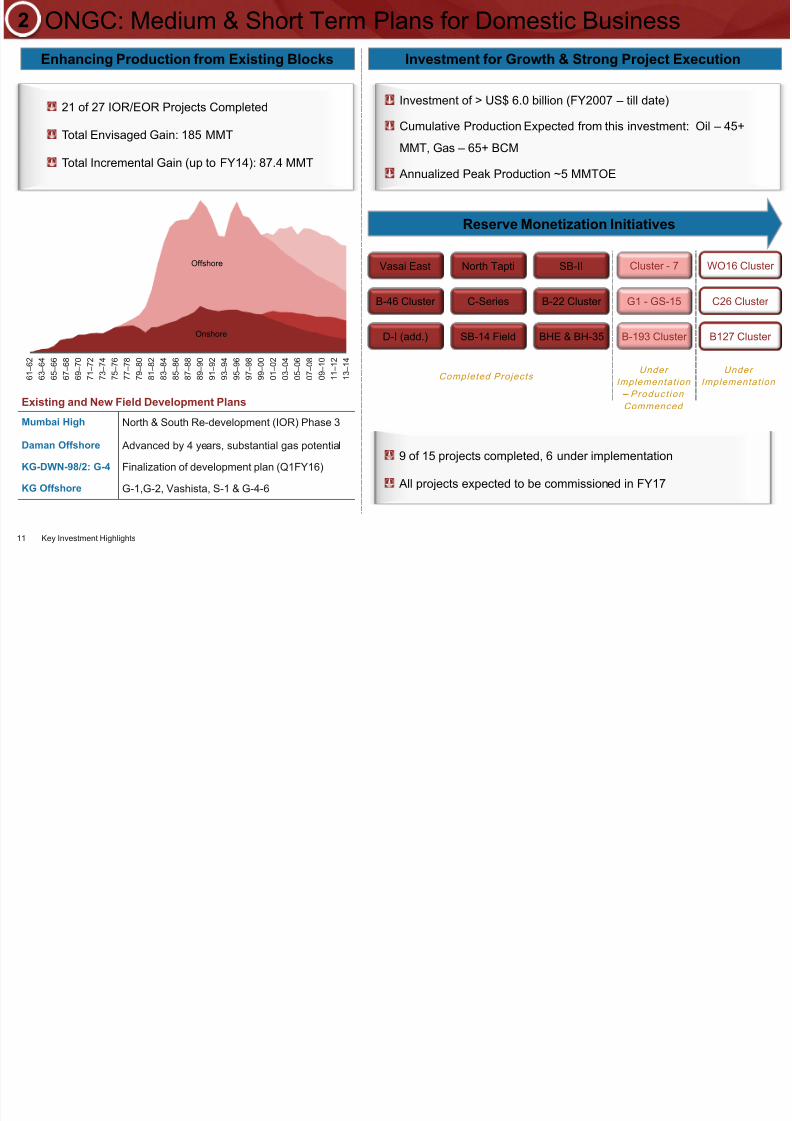
ONGC: Medium & Short Term Plans for Domestic Business
Enhancing Production from Existing Blocks Investment for Growth & Strong Project Execution
Reserve Monetization Initiatives
Investment of > US$ 6.0 billion (FY2007 – till date)
Cumulative Production Expected from this investment: Oil – 45+
MMT, Gas – 65+ BCM
Annualized Peak Production ~5 MMTOE
Vasai East North Tapti SB-II
B-46 Cluster B-22 ClusterC-Series
SB-14 FieldD-I (add.) BHE & BH-35
Cluster - 7 WO16 Cluster
G1 - GS-15
B-193 Cluster
C26 Cluster
B127 Cluster
9 of 15 projects completed, 6 under implementation
All projects expected to be commissioned in FY17
Completed Projects 6 1 –
6 2
6 3 –
6 4
6 5 –
6 6
6 7 –
6 8
6 9 –
7 0
7 1 –
7 2
7 3 –
7 4
7 5 –
7 6
7 7 –
7 8
7 9 –
8 0
8 1 –
8 2
8 3 –
8 4
8 5 –
8 6
8 7 –
8 8
8 9 –
9 0
9 1 –
9 2
9 3 –
9 4
9 5 –
9 6
9 7 –
9 8
9 9 –
0 0
0 1 –
0 2
0 3 –
0 4
0 5 –
0 6
0 7 –
0 8
0 9 –
1 0
1 1 –
1 2
1 3 –
1 4
Onshore
Offshore
Under
Implementat ion
– Product ion
Commenced
Under
Implementat ion
21 of 27 IOR/EOR Projects Completed
Total Envisaged Gain: 185 MMT
Total Incremental Gain (up to FY14): 87.4 MMT
Existing and New Field Development Plans
Mumbai High North & South Re-development (IOR) Phase 3
Daman Offshore Advanced by 4 years, substantial gas potential
KG-DWN-98/2: G-4 Finalization of development plan (Q1FY16)
KG Offshore G-1,G-2, Vashista, S-1 & G-4-6
2
11 Key Investment Highlights
Strong International Acquisition Focus
3
8/9/2019 ONGC Investor Presentation Vff
http://slidepdf.com/reader/full/ongc-investor-presentation-vff 16/32
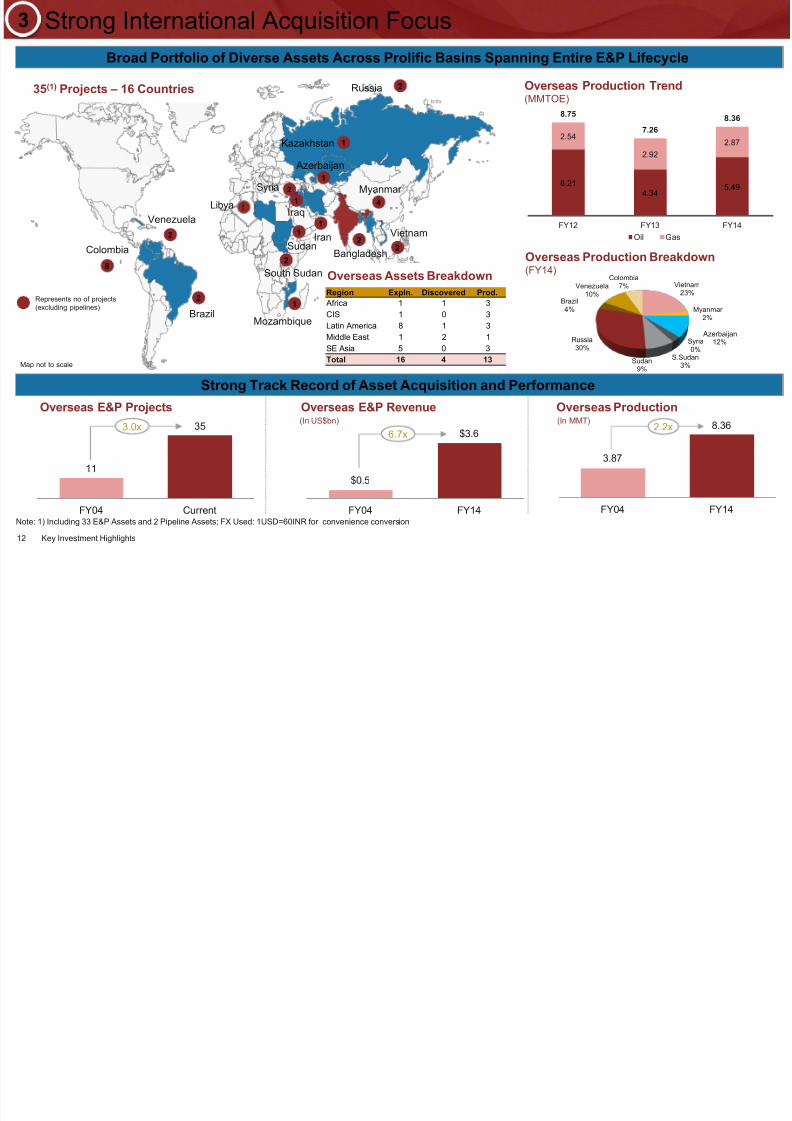
Strong International Acquisition Focus
2
2
2
1
8
2
1
2
1
Russia
Kazakhstan
Brazil
Colombia
Venezuela
Libya
Mozambique
South Sudan
4
Vietnam
Myanmar1
11
Azerbaijan
Iran
Iraq
2Syria
1
Represents no of projects(excluding pipelines)
2
Bangladesh
Region Expln. Discovered Prod.
Africa 1 1 3
CIS 1 0 3
Latin America 8 1 3
Middle East 1 2 1
SE Asia 5 0 3
Total 16 4 13
$0.5
$3.6
FY04 FY14
3.87
8.36
FY04 FY14
Overseas E&P Projects Overseas E&P Revenue
2.2x6.7x
(In US$bn)
11
35
FY04 Current
3.0x
Overseas Production(In MMT)
Strong Track Record of Asset Acquisition and Performance
35(1) Projects – 16 Countries
Broad Portfolio of Diverse Assets Across Prolific Basins Spanning Entire E&P Lifecycle
Note: 1) Including 33 E&P Assets and 2 Pipeline Assets; FX Used: 1USD=60INR for convenience conversion
Overseas Assets Breakdown
Map not to scale
Vietnam23%
Myanmar 2%
Azerbaijan12%Syria
0%S.Sudan
3%Sudan
9%
Russia30%
Brazil4%
Venezuela10%
Colombia7%
Overseas Production Trend(MMTOE)
6.214.34
5.49
2.54
2.922.87
8.75
7.26
8.36
FY12 FY13 FY14
Oil Gas
3
Overseas Production Breakdown(FY14)
12 Key Investment Highlights
Sudan
Recent International E&P Acquisitions
3

8/9/2019 ONGC Investor Presentation Vff
http://slidepdf.com/reader/full/ongc-investor-presentation-vff 17/32
Recent International E&P Acquisitions
Azerbaijan – Maiden Venture
Acquired Hess Corp’s 2.7% stake in Azerbaijan Sector (ACG) & 2.4% interest in BTC
pipeline in 2013
ACG is one of the largest oil field in the Azerbaijan sector of the Caspian basin
Average Daily Production ~700,000 bpd, OVL’s share – 0.9 MMTPA
Mozambique – Rovuma Area 1Offshore Block
Acquired 16% participating interest in early 2014
Large gas discovery in offshore East Africa. Recoverable reserves 50-70 TCF (EffectiveOVL’s reserves 8-11 TCF)
Potential to become one of the world’s leading LNG producing hubs, production
expected by 2018
Brazil – Increasing
Stake
Acquired additional 12% stake in BC-10 from Petrobras (total stake 27%) in 2013
Net reserves increased by 33 MMBOE through the acquisition
OVL’s share – 8,300 bpd (current); 20,000 bpd (peak expected)
P r o d u c t i o n
E x p l o
r a t i o n
Bangladesh Bid Round 2013 Awarded 2 shallow water blocks in Bangladesh Bid Round (with OIL)
Myanmar Bid Rounds 2013
Colombia Bid Round 2012
New Zealand & Vietnam
Awarded 2 onshore blocks in Myanmar: B2 & EP-3
Awarded Block Gua Off-2 in Guajira Basin adjacent to Block RC-10
Block LLA-69 in on land Llanos Basin with Sinopec (in MECL)
Has submitted bid for New Zealand exploration block and actively pursuing 2-3exploration blocks in Vietnam
3
13 Key Investment Highlights
Strong Domestic Asset Base and E&P Capabilities
4

8/9/2019 ONGC Investor Presentation Vff
http://slidepdf.com/reader/full/ongc-investor-presentation-vff 18/32
Strong Domestic Asset Base and E&P Capabilities
Offshore Installations215 Onshore Installations
250
Pipelines
28,139 Km
OSVs/MSVs16 + 36(1)
Well StimulationVessel1 + 1(1)
Seismic Crews23 + 4(VSP)
Drilling Rigs77 + 31(1)
Work-over Rigs57 + 25(1)
Well Logging Units27 + 52(1)
Well StimulationUnits: 116
Institutes / Centers ofExcellence Units: 11
ProcessInstallations: 13
Diversified Talent:33,911 (72%Technical)
Note: Production figures for FY13-14;1) Charter-hired; 2) Production contract (PSC) Joint Venture Share
Rajahmundry & EOAOil: 0.323 MMT
Gas: 1.276 BCM
KaraikalOil: 0.226 MMT
Gas: 1.304 BCM
Ravva(2)
Oil: 0.414 MMTGas: 0.180 BCM
Tripura
Gas: 0.822 BCM
AssamOil: 1.265 MMT
Gas: 0.459 BCM
Rajasthan(2)
Oil: 2.751 MMT
Gas: 0.163 BCM
AhmedabadOil: 1.396 MMT
Gas: 0.221 BCM
MehasanaOil: 2.310 MMT
Gas: 0.205 BCM
AnkleshwarOil: 1.050 MMT
Gas: 1.107 BCM
Cambay(2)
Oil: 0.161 MMTGas: 0.011 BCM
Mumbai Offshore
Oil: 15.515 MMTGas: 17.86 BCM
Panna-Mukta-Tapti(2)
Oil: 0.396 MMT
Gas: 1.107 BCM
Map not to scale
4
14 Key Investment Highlights
Increasing Downstream Presence
5

8/9/2019 ONGC Investor Presentation Vff
http://slidepdf.com/reader/full/ongc-investor-presentation-vff 19/32
Increasing Downstream Presence
Increasing Focusing on Capturing Larger Share of Downstream Value
Enhanced Refinery Capacity of 15 MMTPA. ONGC Equity Holding – 71.62%, Market Cap – US$1.7bn
Plans underway to increase the capacity to 18 MMTPA
Flexibility to process crudes of various API and with high degree of automation
FY14 throughput of 14.59 MMTPA; Turnover of US$12.5bn; PAT of US$100mn
Planned 1.1 MMTPA Ethylene Cracker & Polymer plant. ONGC Equity Holding – 26%(1)
Utilizing in-house production of Naphtha and C2-C3 from various units of ONGC
One of the biggest in Asia, pre-commissioning started, mechanical completion expected Feb’15
Pre-commissioning activities started; commercial operation scheduled June’15
726.6 MW gas based combined cycle power plant in Tripura. ONGC Equity Holding – 50%
Aims to monetize discovered gas in Tripura 1st unit became operational; ONGC gas supply started to OTPC 2nd unit
Aromatic Petrochemical Complex (Para-xylene & Benzene). ONGC Holding – 49%(2)
A value addition project to monetize MRPL’s aromatic streams
Plant commissioned; Test production of Benzene & Para-xylene started
LNG receiving and re-gasification terminal. ONGC Equity Holding – 12.5%
10 MTPA capacity existing in Dahej – Gujarat, setting up another 5 MTPA terminal at Kochi - Kerala
A JV with HPCL, pipeline company that transports MRPL products to hinterland of Karnataka.
ONGC Equity Holding – 28.77%; Market Cap – US$2.5bn
JV with The Energy Research Institute. ONGC Equity Holding – ~50%
Addressing Bioremediation, Microbial EOR and prevention of wax deposition in tubulars for E&P
Note: Market data as of 14th November 2014; FX: 1USD = 60INR; 1) Envisaged stake 2) ONGC directly holds 46%,and MRPL holds 3%
R e f i n i n g
P e t r o c h e m i c a l s
L N G
P i p e l i n e
P o w
e r
O t h e r
5
15 Key Investment Highlights
Unconventional & Alternate Energy Initiatives
6
8/9/2019 ONGC Investor Presentation Vff
http://slidepdf.com/reader/full/ongc-investor-presentation-vff 20/32
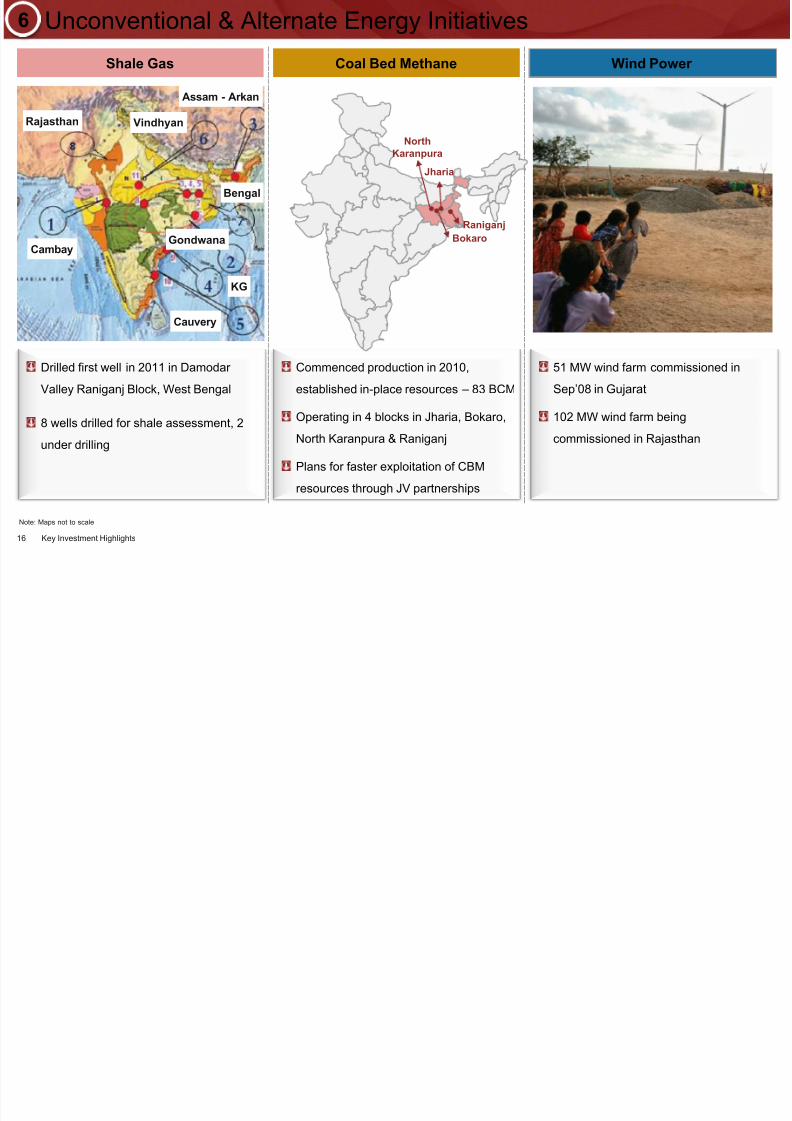
Unconventional & Alternate Energy Initiatives
Shale Gas Coal Bed Methane Wind Power
Rajasthan
Cambay
Cauvery
KG
Gondwana
Bengal
Assam - Arkan
Vindhyan
Drilled first well in 2011 in Damodar
Valley Raniganj Block, West Bengal
8 wells drilled for shale assessment, 2
under drilling
Commenced production in 2010,
established in-place resources – 83 BCM
Operating in 4 blocks in Jharia, Bokaro,North Karanpura & Raniganj
Plans for faster exploitation of CBM
resources through JV partnerships
51 MW wind farm commissioned in
Sep’08 in Gujarat
102 MW wind farm beingcommissioned in Rajasthan
Jharia
Bokaro
NorthKaranpura
Raniganj
Note: Maps not to scale
6
16 Key Investment Highlights
Strong Management & Government of India Parentage
7

8/9/2019 ONGC Investor Presentation Vff
http://slidepdf.com/reader/full/ongc-investor-presentation-vff 21/32
3,797 4,0824,633 4,938 4,781
8861,214
1,7481,875 1,982
$4,683$5,296
$6,381$6,813 $6,763
FY10 FY11 FY12 FY13 FY14
Central Government State Government
Government of India owns 69% stake in ONGC, two
government nominee directors
Significant & consistent contribution to exchequer (US$ mn)
Dinesh K Saraf
Chairman & MD
>30 years experience
Diverse experience in Oil & Gas Industry
Instrumental in OVL’s foreign acquisition
strategy
Received Best CFO Award in Oil & Gas in
‘09 and ‘11 by CNBC
AK Banerjee
Director (Finance)
>30 years experience
Varied experience in Financial Managementand Strategic Planning in upstream Oil andGas Industry
Fellow member of the Institute of Chartered Accountants of India
Received Best CFO Award in Oil & Gas in’13 by CNBC
Shashi Shanker
Director (T&FS)
>30 years experience
Wide exposure in diverse E&P activities
Received various awards – “Young
Engineer Award”
TK Sengupta
Director (Offshore)
33 years experience
Balanced exposure to both onshore andoffshore operations across geographies
Instrumental in executing severalproduction enhancement projects
Ashok Varma
Director (Onshore)
37 years experience
Previously, head of Eastern Offshore Asset
CEO of Imperial Energy in RussiaPart of senior management of OVL between1996-2006
DD Misra
Director (HR)
29 years experience
Rich exposure and diverse experience inleading HR teams in various regions forONGC
Masters in Public Administration from theUniversity of Lucknow
Strong Management & Government of India Parentage
Best in Class Management Team in Place Strong GoI Support
Awarded ‘Maharatna’ Status in 2010
Numerous Awards & Recognition
FortuneGlobal 500
(2013)
3
Platts Survey(2013)
4Forbes
Global 2000(2014)
2FortuneMost Admired
List (2014)
1
“Maharatna”status
Note: 1) Only major Indian energy company under “Mining, Crude Oil Production” category; 2) Ranked
176th among Forbes Global 2000 companies; 3) Ranked 369th among Fortune Global 500 (2013); 4)Ranked 21st as per Platt Rankings 2014
Source: Annual Report, Standalone basis; FX Used: 1USD = 60INR
7
17 Key Investment Highlights
Regulatory Reforms – Diesel Price Deregulation
8

8/9/2019 ONGC Investor Presentation Vff
http://slidepdf.com/reader/full/ongc-investor-presentation-vff 22/32
Regulatory Reforms Diesel Price Deregulation
Source: Petroleum and Natural Gas statistics, Oil India filings. FX Used: 1USD=60INR
ONGC being the Largest Player in O&G Space, will Benefit the Most from Diesel Price Deregulation
Total Under Recovery Split by Product
ONGC Subsidy Share & Impact on PAT
Subsidy % Sharing(US$ bn)
(US$ bn) (US$ per bbl)Realized Price
13.5 15.310.5
4.71.9
5.0
6.6
7.7
3.14.1
4.6
4.9
5.1
2.32.5
$23.1
$26.8
$23.3
$10.2$8.5
FY12 FY13 FY14 1HFY14 1HFY15
Diesel LPG Kerosene
$7.4$8.2
$9.4
$4.4 $4.5$4.3$4.7
$5.3
$2.5 $2.5
FY12 FY13 FY14 1HFY14 1HFY15
ONGC Contribution Impact on PAT
80.8% 82.4% 84.1% 82.5% 84.1%
13.4% 13.2% 13.0% 13.2% 12.8%5.8%
4.5% 2.8% 4.4% 3.1%
FY12 FY13 FY14 H1FY14 H1FY15
ONGC Oil India GAIL
$55 $48 $41 $43 $44
$63$63
$66 $63 $62
$117$111 $107 $106 $106
FY12 FY13 FY14 1HFY14 1HFY15
Net Realization Discount
18 Key Investment Highlights
Regulatory Reforms – Gas Price Revision
8

8/9/2019 ONGC Investor Presentation Vff
http://slidepdf.com/reader/full/ongc-investor-presentation-vff 23/32
Regulatory Reforms Gas Price Revision
In October 2014, the government also announced revision of the Gas prices with effect from 1st November2014
The new price set at US$5.05/mmbtu on a gross calorific value which is equivalent to US$5.6/mmbtu on aNet Calorific Value basis vs. 2010 price of US$4.2/mmbtu (on net calorific value basis)
Gas Price Revision
Policy Clarity
Financial Impact
According to the new framework, the prices will be reviewed on a half-yearly basis using the data of thepreceding 12 months with a one-quarter lag (next review expected in April 2015)
Revised gas price based on:
Removal of overhang
A quarterly review of prices will have significant positive impact on the share price overhang, whichwas due to lack of policy clarity
Being the largest player in the Indian O&G space, ONCG is expected to gain the most from arevision in gas prices
Sales price fordomestic gas
(US+Mexico)Henry Hub
Price
VolumeWeighted
Average of
(Canada)Alberta Hub
Price
(EU & FSU)Excluding
Russia
(Russia)Actual Price
Any improvement in the gas price has a significant
contribution to the bottom-line
Assuming NCV of 9,000 kcal/scm and FY14 Gas sales
18.26 BCM, the impact on headline for US$1 increase
in gas price is ~US$ 652mn
$652
$392
Revenue PAT
Impact of US$1 change in Gas Price(US$ mn)
Note: FX used 1USD = 60INR
19 Key Investment Highlights
Perspective 2030

8/9/2019 ONGC Investor Presentation Vff
http://slidepdf.com/reader/full/ongc-investor-presentation-vff 24/32
6 x Increase inInternational
E&PProduction5 Non E&P
Verticals
4 x Growthin Market
Cap
3 x Increase
Revenue &EBITDA
2 x IncreaseE&PProduction
p
The Roadmap for ONGC's Growth over the Next Two Decades
Grow overseas E&P to source 60 MMTOE per year of O+OEG
Unlock more than 400 MMTOE from domestic yet-to-find reserves
Accelerate 300-400 MMTOE of (re)-developments
Secure alliance for new resource types
Build non-E&P business to 30% of group revenue
1
2
3
4
5
2014 20302030 Plan
20 Key Investment Highlights
Note: The above perspective plan 2030 is as per company document as approved by the board on 29 th May 2012. There can be no assurance that these plans will be met. Please also refer to the Key Risks onpage 24 of the presentation.

8/9/2019 ONGC Investor Presentation Vff
http://slidepdf.com/reader/full/ongc-investor-presentation-vff 25/32
3. Robust Financial Profile
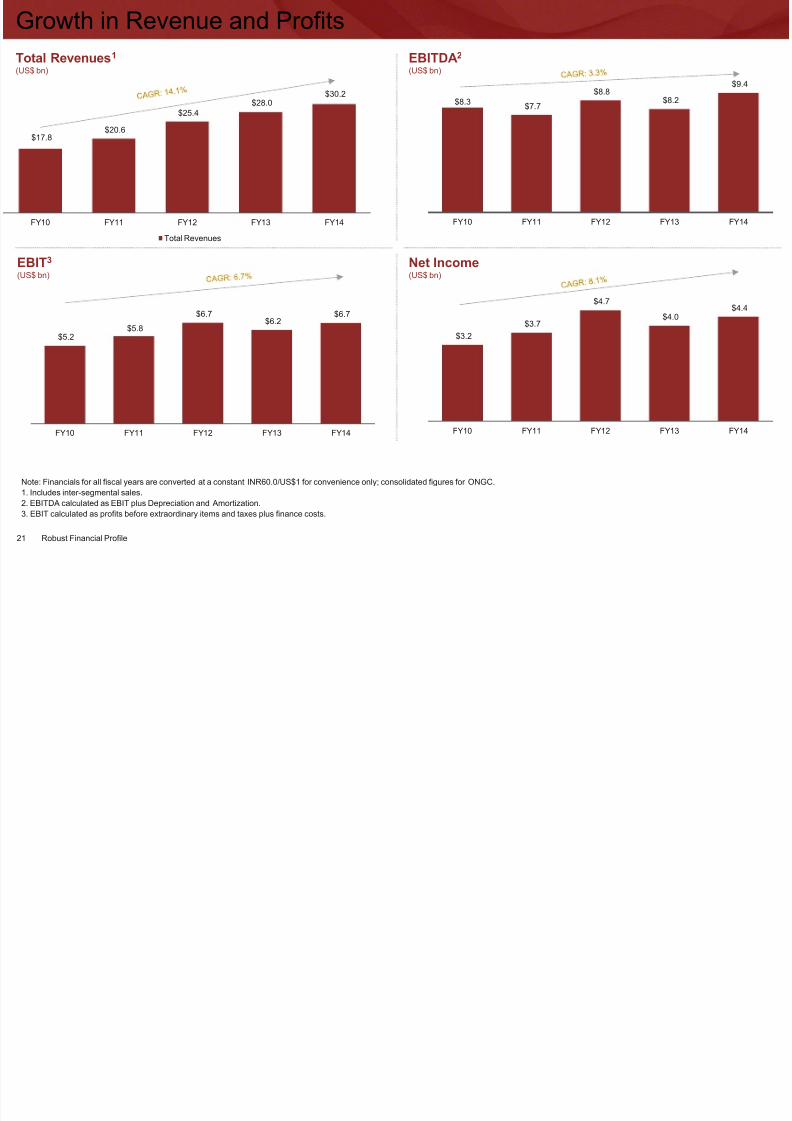
Growth in Revenue and Profits
8/9/2019 ONGC Investor Presentation Vff
http://slidepdf.com/reader/full/ongc-investor-presentation-vff 26/32
Total Revenues1 (US$ bn)
EBITDA2
(US$ bn)
Note: Financials for all fiscal years are converted at a constant INR60.0/US$1 for convenience only; consolidated figures for ONGC.
1. Includes inter-segmental sales.
2. EBITDA calculated as EBIT plus Depreciation and Amortization.
3. EBIT calculated as profits before extraordinary items and taxes plus finance costs.
EBIT3
(US$ bn)
Net Income(US$ bn)
$8.3$7.7
$8.8$8.2
$9.4
FY10 FY11 FY12 FY13 FY14
$5.2$5.8
$6.7$6.2
$6.7
FY10 FY11 FY12 FY13 FY14
$3.2
$3.7
$4.7
$4.0$4.4
FY10 FY11 FY12 FY13 FY14
$17.8$20.6
$25.4$28.0
$30.2
FY10 FY11 FY12 FY13 FY14
Total Revenues
21 Robust Financial Profile
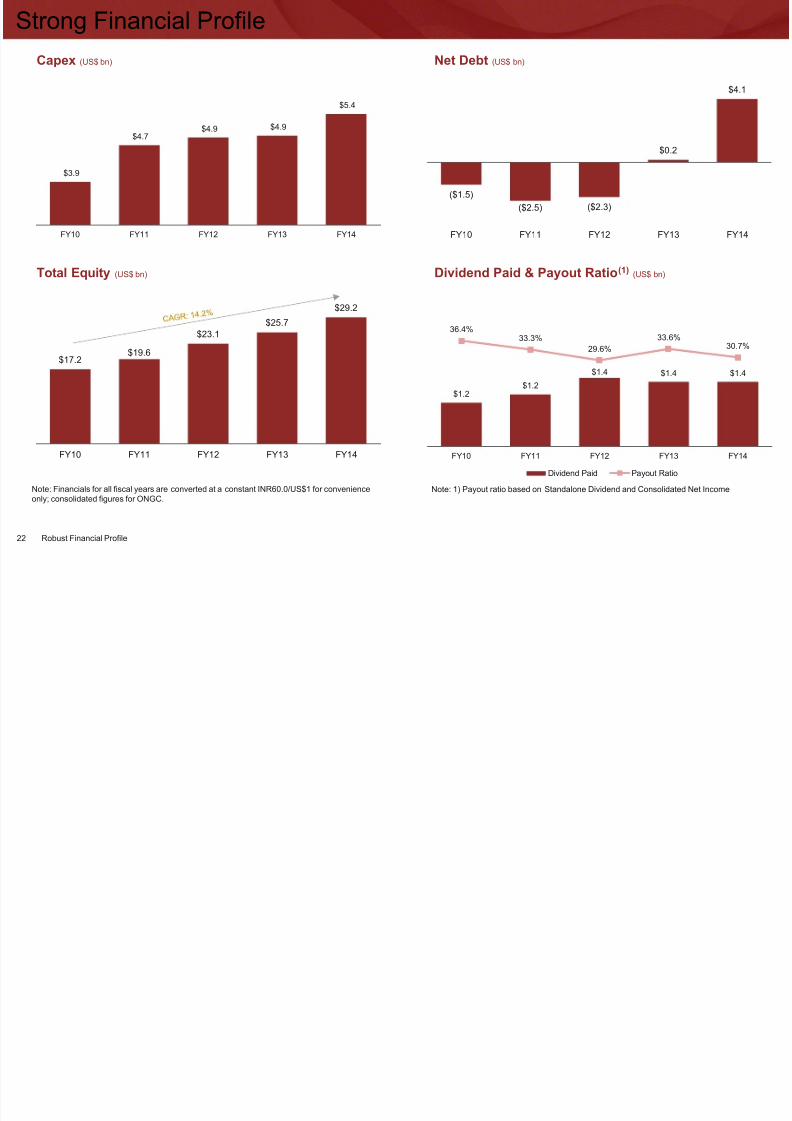
Strong Financial Profile
8/9/2019 ONGC Investor Presentation Vff
http://slidepdf.com/reader/full/ongc-investor-presentation-vff 27/32
Capex (US$ bn)
Total Equity (US$ bn) Dividend Paid & Payout Ratio(1) (US$ bn)
Net Debt (US$ bn)
$3.9
$4.7$4.9 $4.9
$5.4
FY10 FY11 FY12 FY13 FY14
($1.5)
($2.5) ($2.3)
$0.2
$4.1
FY10 FY11 FY12 FY13 FY14
$17.2$19.6
$23.1
$25.7
$29.2
FY10 FY11 FY12 FY13 FY14
$1.2$1.2
$1.4 $1.4 $1.4
36.4%33.3%
29.6%
33.6%30.7%
FY10 FY11 FY12 FY13 FY14
Dividend Paid Payout Ratio
Note: Financials for all fiscal years are converted at a constant INR60.0/US$1 for convenienceonly; consolidated figures for ONGC.
Note: 1) Payout ratio based on Standalone Dividend and Consolidated Net Income
22 Robust Financial Profile
Stable Half Year Standalone Performance

8/9/2019 ONGC Investor Presentation Vff
http://slidepdf.com/reader/full/ongc-investor-presentation-vff 28/32
Gross Revenues1 (US$ bn)
EBITDA2
(US$ bn)
Note: Financials for all fiscal years are converted at a constant INR60.0/US$1 for convenience only; Standalone figures for ONGC.
1. Income from operations and other operating income
2. EBITDA calculated as EBIT plus Depreciation and Amortization.
3. EBIT calculated as profits before extraordinary items and taxes plus finance costs.
EBIT3
(US$ bn)
Net Income(US$ bn)
$2.48 $2.52
H1FY14 H1FY15
$2.48 $2.52
H1FY14 H1FY15
$1.68 $1.70
H1FY14 H1FY15
23 Robust Financial Profile
Increase in Crude oil production
H1 FY15: 10.32 MMT (1.2% growth over H1
FY14 production of 10.20 MMT)
Q2 FY15: 5.21 MMT (2.1% growth over Q2
FY14 production of 5.10 MMT)
Stable Financial Performance
Post discount crude realization of $44.16 /
bbl in H1 FY15 vs $42.58 / bbl in H1 FY14
H1 FY15 Gross Revenue growth of 1.4%
over H1 FY14
H1 FY15 Net Income growth of 1.5% over
H1 FY14
Standalone Operating Highlights
Standalone Financial Highlights
8/9/2019 ONGC Investor Presentation Vff
http://slidepdf.com/reader/full/ongc-investor-presentation-vff 29/32
4. Key Risks
Key Risks

8/9/2019 ONGC Investor Presentation Vff
http://slidepdf.com/reader/full/ongc-investor-presentation-vff 30/32
Failure to acquire or find and develop additional reserves and failure to redevelop existing fields may lead to a decline in reserves,production and profitability
Fluctuations in crude oil and natural gas prices
Certain Indian and international interests are located in politically, economically and socially unstable areas
Limited global presence in the field of exploration, development and production in comparison to global oil majors
Capital intensive business involving numerous risks including finding commercially non viable reserves post substantial investments,risks associated with delays, cost-overruns, dependence on third parties, etc.
Crude oil and natural gas reserve information based on Company estimates which has not been independently verified. Reserve
information based on multiple assumptions, which may prove to be incorrect over time. Actual production may also differ from estimates
Impact of the government subsidy
Risk associated with expansion and diversification of business into non-core areas
Delays in land acquisitions may affect E&P activities
Risks associated with new ventures, e.g. Shale gas/non-conventional gas
Risks in relation to grant and renewal of environmental approvals, petroleum exploratory licenses and government approvals on a timelybasis and logistical risks associated with operations in remote areas
24 Key Risks

8/9/2019 ONGC Investor Presentation Vff
http://slidepdf.com/reader/full/ongc-investor-presentation-vff 31/32
Appendix
ONGC: Organization Structure Overview

8/9/2019 ONGC Investor Presentation Vff
http://slidepdf.com/reader/full/ongc-investor-presentation-vff 32/32
(71.62%)(100.0%)
(49.5%)
(28.77%)
(49.0%)
E&P DomesticOperations
Overseas E&P
Associates
Refinery
Note: 1. ONGC directly holds 46%,and MRPL holds 3%.2. Envisaged stake
Subsidiaries
Petrochemicals
(49%)(1)(26%)(2)
Joint Ventures
Pipeline
Power
Services
(~50%)
SEZ
(23%) (26%)
Services LNG
(12.5%)
25 Appendix


