Download - Online Teaching Best Practices

Online Best Practices for Teaching May 19, 2016 | 3:00pm – 5:00pm | 365 Grace Dodge Hall
Kristen Sosulski, Ed.D Associate Professor of Information Systems Director of Education, W.R. Berkley Innovation Lab @sosulski | kristensosulski.com | [email protected]

The foundation for this workshop

What are the differences between online teaching and face-to-face classroom teaching? What are the differences between online teaching and and online course design?
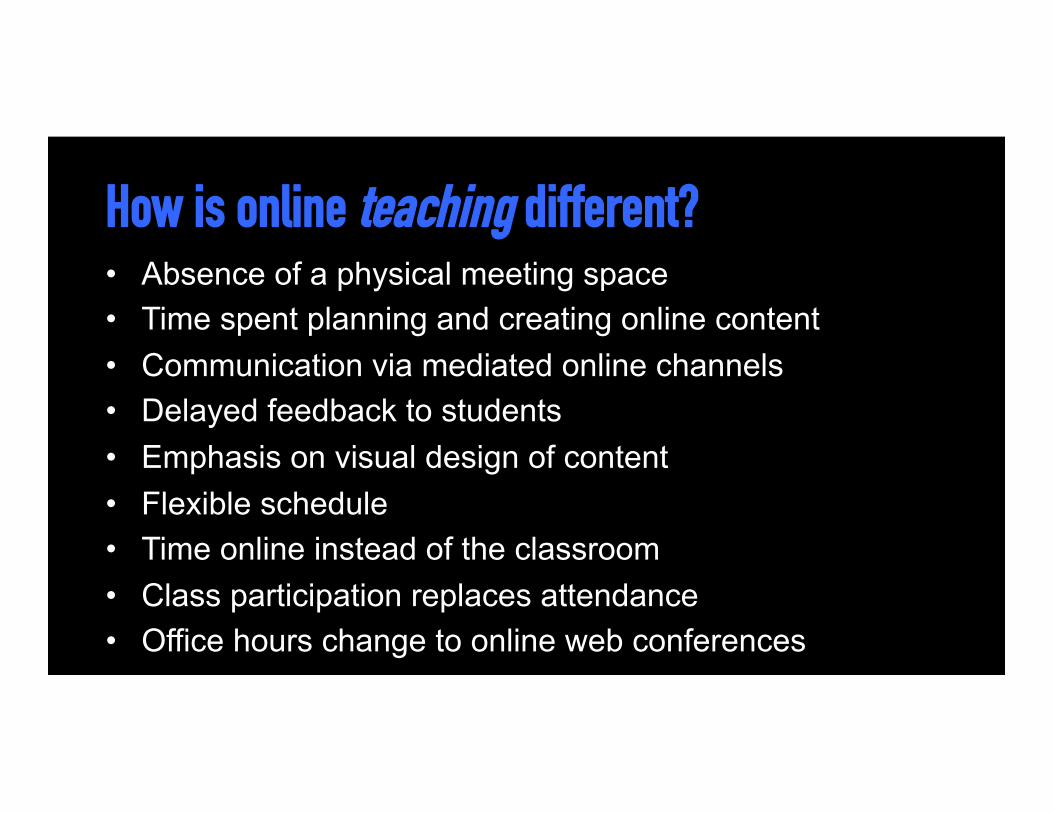
How is online teaching different? • Absence of a physical meeting space • Time spent planning and creating online content • Communication via mediated online channels • Delayed feedback to students • Emphasis on visual design of content • Flexible schedule • Time online instead of the classroom • Class participation replaces attendance • Office hours change to online web conferences

What good online learning is not • Self-paced • Primarily a set of recorded videos • Anti-social • Boring • Devoid of an instructor

It’s not bringing others into the physical classroom
Cisco Telepresence

Or, sharing your recorded in-class lectures
ECO 360
Or, giving a students a bunch of tasks • Read chapter 1
– Complete assignment 1 • Read chapter 2
– Complete assignment 2 • Read chapter 3
– Complete assignment 3

What makes a great educational experience?
A class, course, activity, etc.

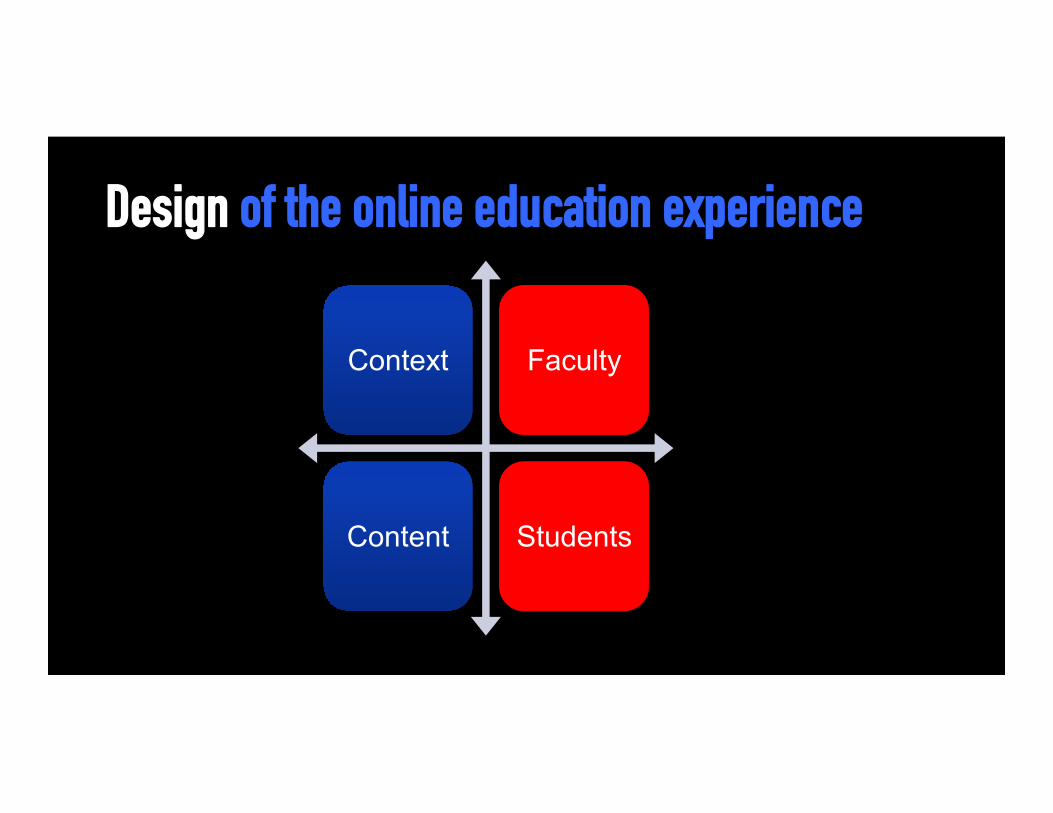
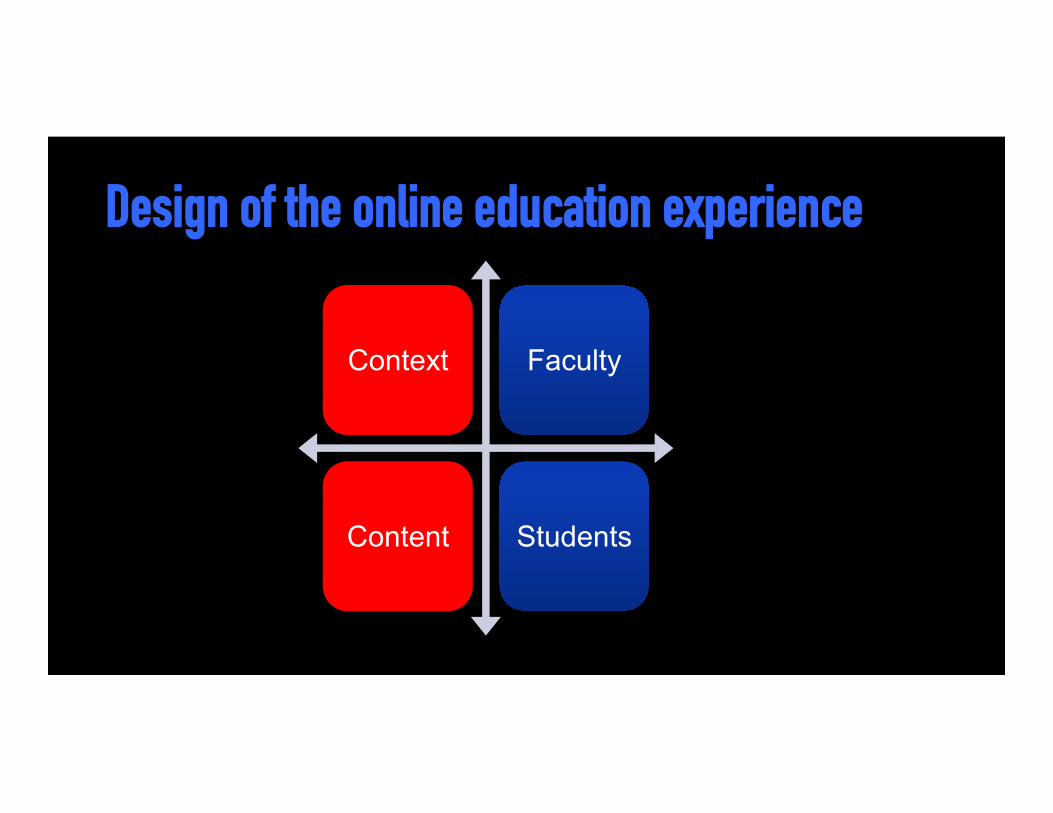
Design of the online education experience
Context Faculty
Content Students
Design of the online education experience
Context Faculty
Content Students

Define the roles of the teacher and the learners Teacher • Designing the course • Teaching in the course
– Modeling – Coaching – Scaffolding – Providing feedback – Assessing student progress – Contributing to conversation – …
Student • Engaging in assignments
and activities • Collaborating with peers • Asking questions of peers
and the instructor • Reflecting • Sharing experiences • ….

STRATEGY: Learn more about your students

Assess student prior knowledge to inform your course design Learn more about your students’ prior knowledge and preconceptions before class.

EXAMPLE

Pre-class survey
• Students have diverse experiences and knowledge.
• Learn more about what they know and what they don’t by asking a pre-course survey.
• Incorporate the findings into the class discussion and lecture.
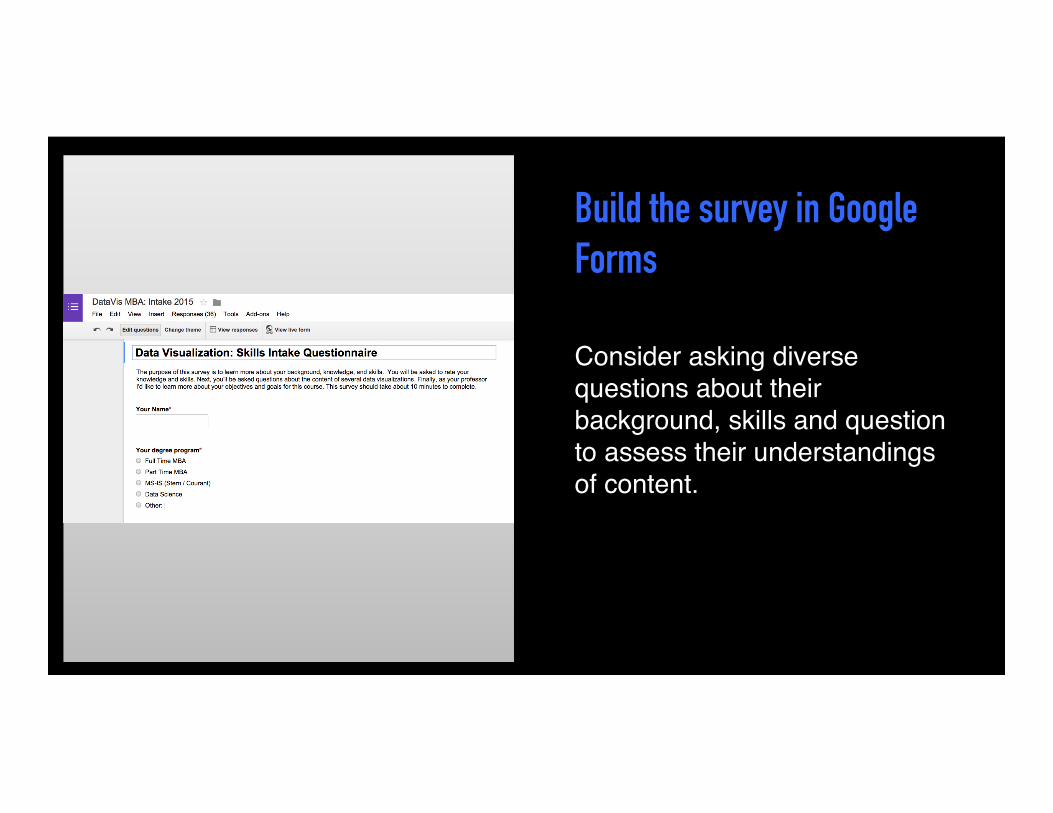
Build the survey in Google Forms
Consider asking diverse questions about their background, skills and question to assess their understandings of content.

Types of questions 1) Perception questions: For example, “how confident are you in using the following technologies: Python, R, PowerPoint, and Excel? 2) Content questions: For example, “which of the following data visualization chart types is most appropriate to show time series data: pie, line, histogram, or scatterplot?” 3) Open ended questions: For example, “Define data visualization.” Open-ended questions allow students to share their understandings of the content in their own words.

Distribute the link to students
• Add the link to the first module.
• Send an email with the link in advance of class or during class.
Complete the following survey: http://bit.ly/datavismba2015

Share results • The instructor can see data
presented in spreadsheet form or summary form
• Summary pages can show students where they rank in class

Incorporate the results
• Incorporate student responses into the online content and discussion.
• Show students where they rank in relation to the class.
• Use results to modify your content.
What is data visualization?

How to • Go to GoogleDrive• Select New > Google Forms• Add title, form description, and
begin entering questions. Select from a wide-array of question types.
• When finished select > Send• Copy URL or enter email
addresses• Share with students• View results by selecting >
Responses on the form
What is data visualization?

STRATEGY: Instructor Presence

Strategies to stay present and keep students engaged • Greet the class with a welcome message • Post weekly announcements • Introduce new topics
– Deadline reminders – Reflections on the progress of the class as a whole
• Provide frequent feedback on student work • Contribute to online discussions • Advertise and promote your availability for office hours • Respond to questions in a timely fashion
– Clear guidelines for communication

EXAMPLE
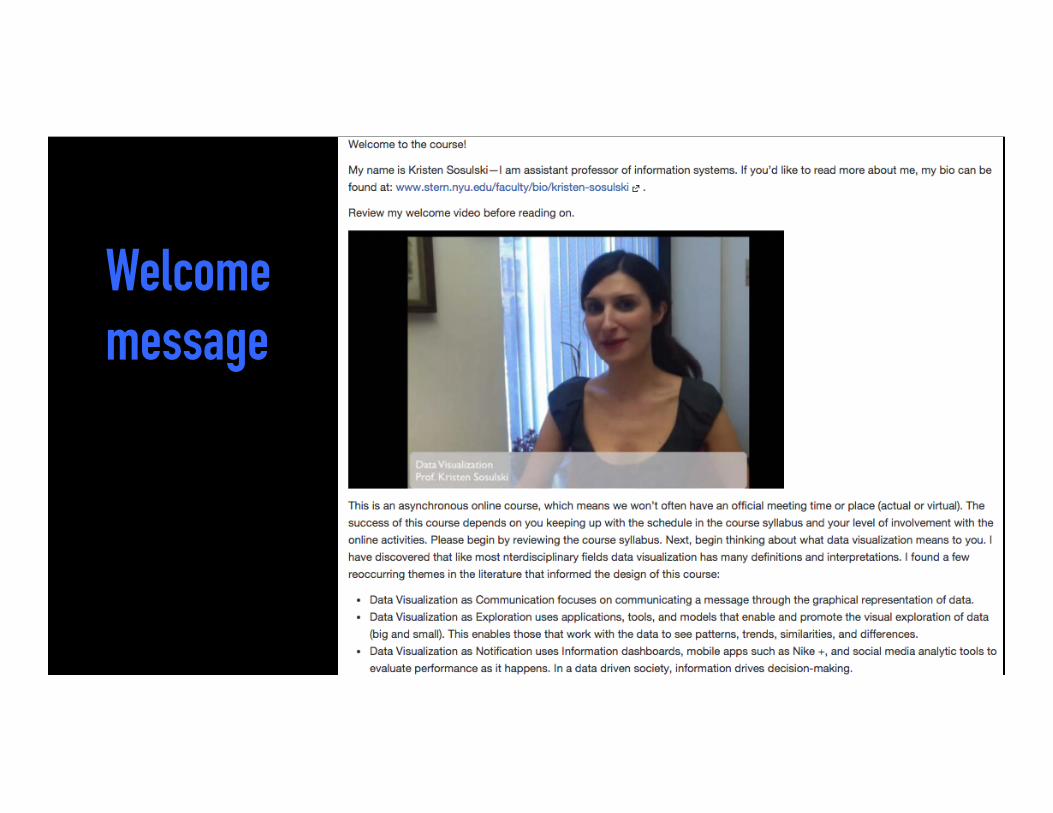
Welcome message

EXAMPLE
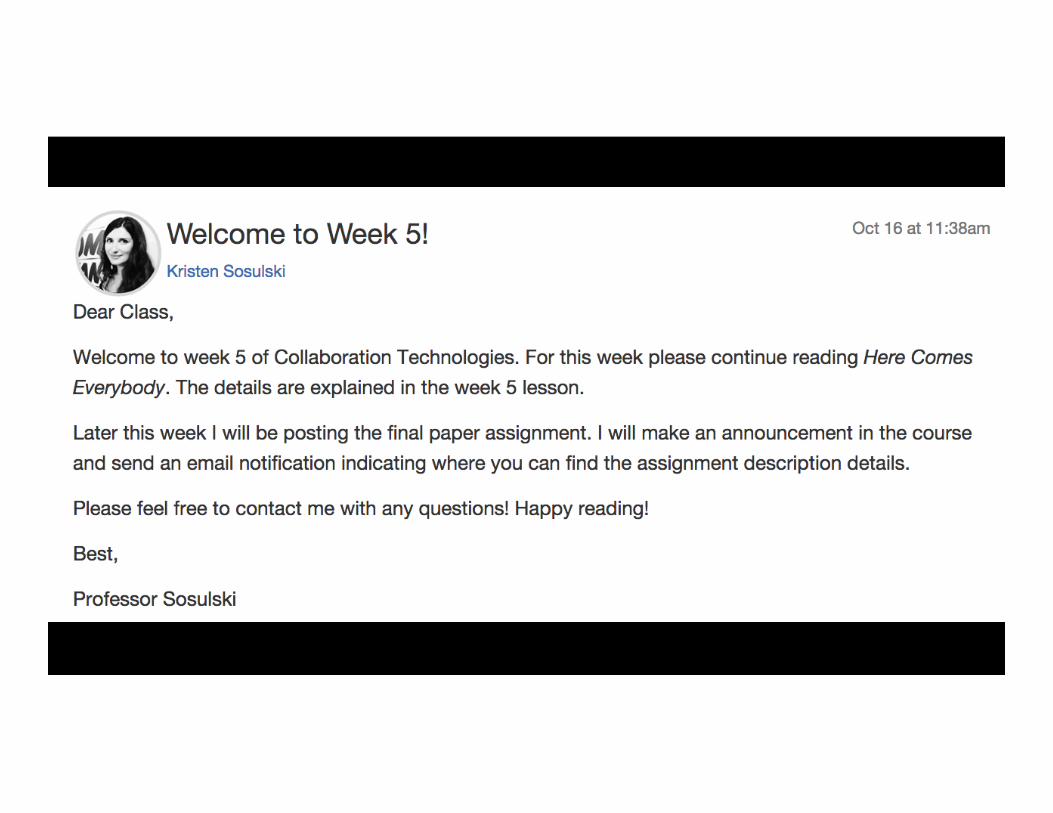
Weekly announcements
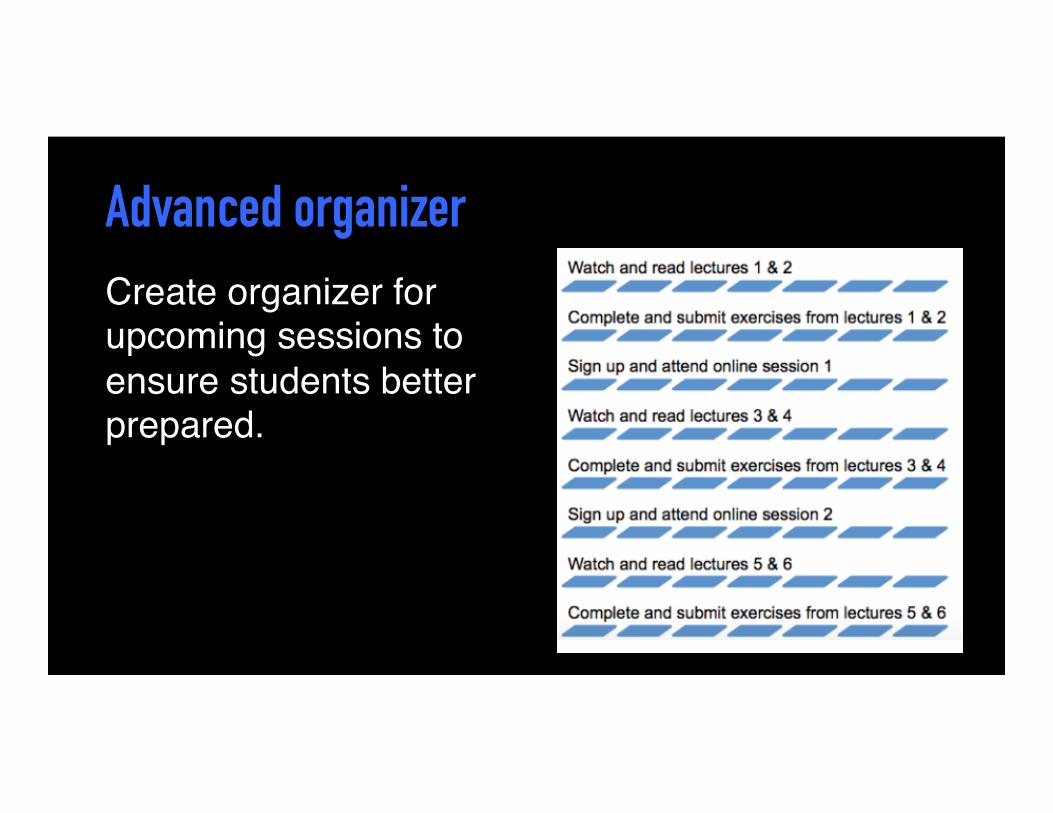
Advanced organizer Create organizer for upcoming sessions to ensure students better prepared.

EXAMPLE
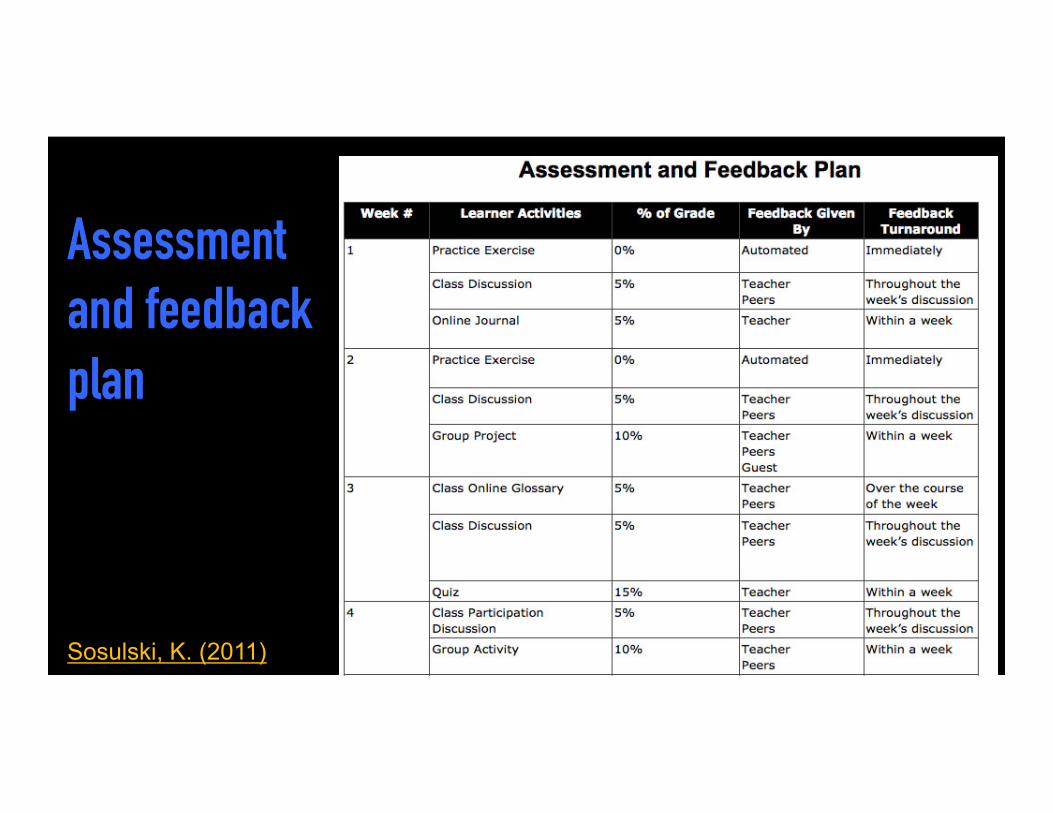
Assessment and feedback plan
Sosulski, K. (2011)

EXAMPLE

Provide structured help sessions

EXAMPLE

Add a communication strategy to your syllabus
Design of the online education experience
Context Faculty
Content Students
Describe some ways that you can present or introduce content to students in an online course?

How does content differ from media?
The knowledge that an expert possesses and demonstrates to students.
What is content?
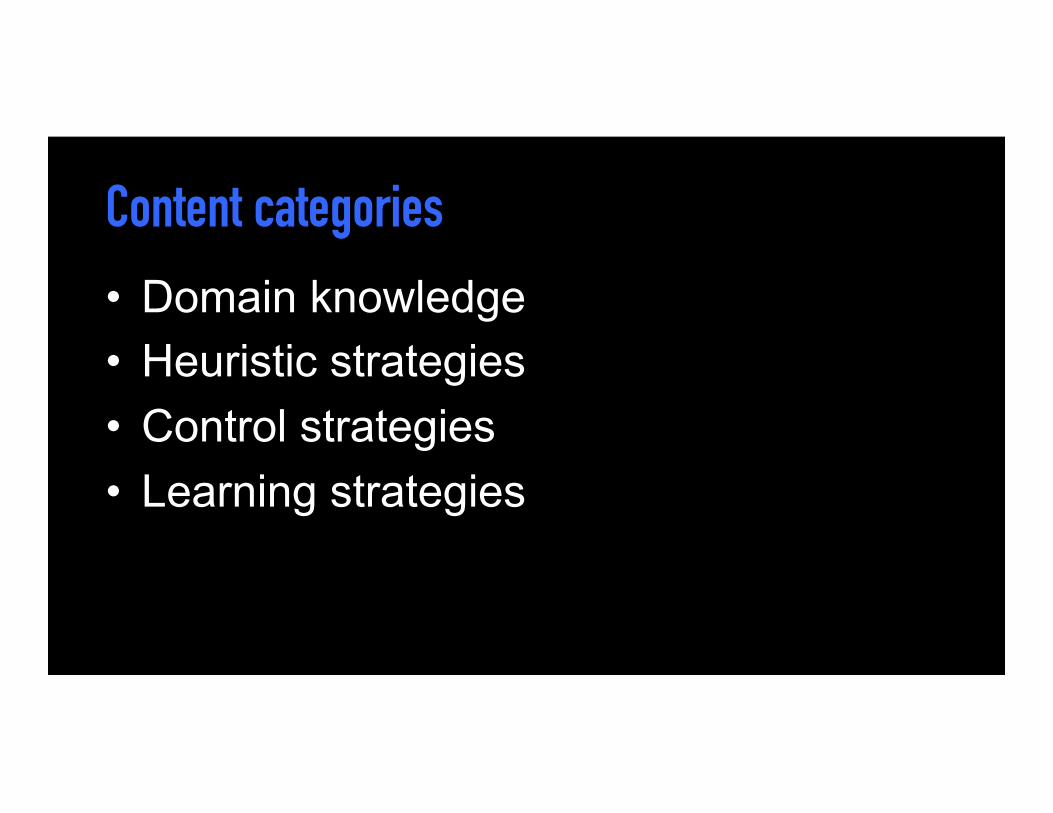
Content categories • Domain knowledge • Heuristic strategies • Control strategies • Learning strategies

Lessons or modules serve as the organizing backbone for the content Organize lessons according to the timeframe of the course
Week 1: 5/23 – 5/29
Week 2: 5/30 – 6/5
Week 3: 6/6 – 6/12
Week 4: 6/13 – 6/19
Week 5: 6/20 – 6/26
Week 6: 6/27 – 7/3

Lessons or modules serve as the organizing backbone for the content The sequence of lessons should be chosen to support students needs at different stages of learning.
Week 1: 5/23 – 5/29 • Topic: Data Visualization as Communication
• Overview • Demonstration • Exercise • Discussion • Advanced Exercise
Week 2: 5/30 – 6/5
Week 3: 6/6 – 6/12
Week 4: 6/13 – 6/19

Lessons: A basic structure 1. Introduction to new concept 2. Demonstration of new concept 3. Application of new concept

EXAMPLE

1. Topic introduction

45

46
2. Problem – solution demonstration
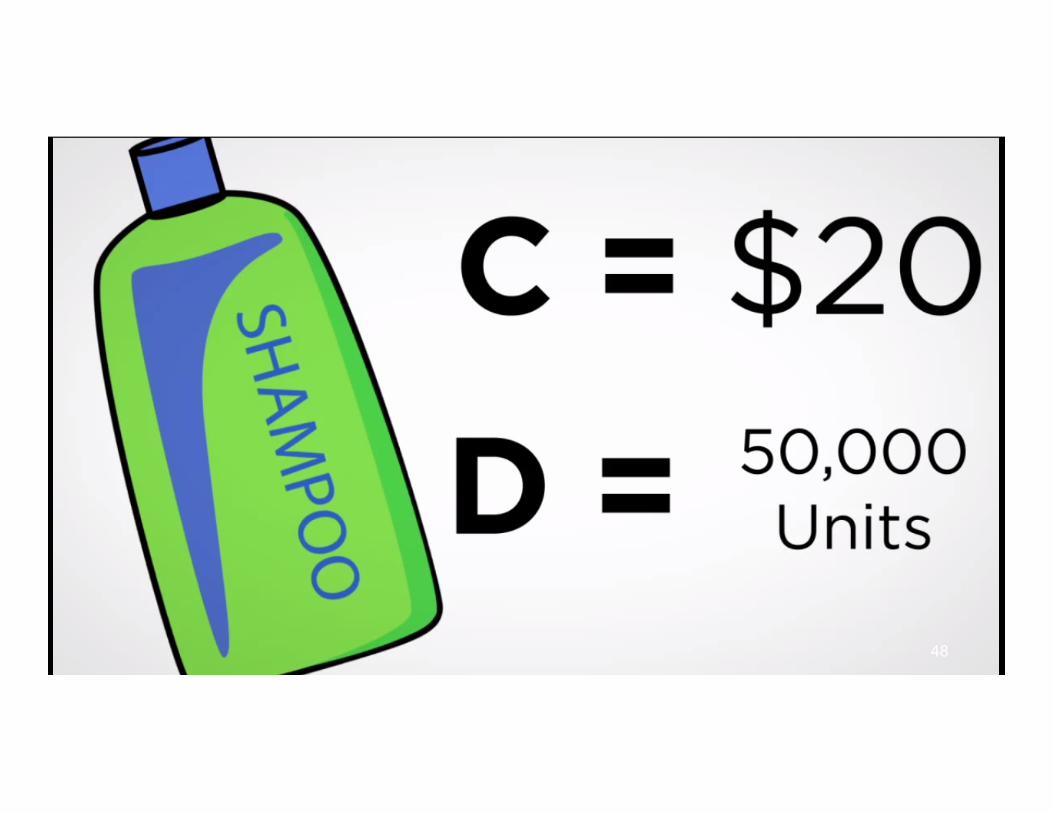
Online Problem – Solution Demonstrations
48

49
3. Call to action – student assignment

51
52
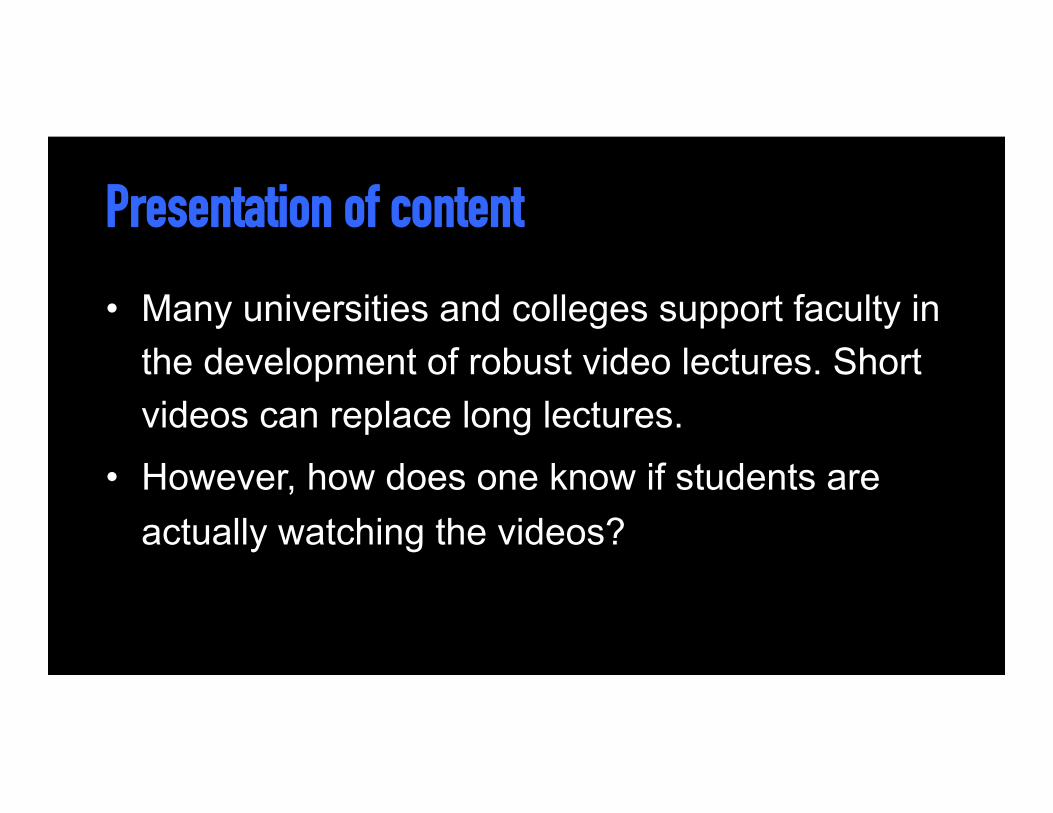
Presentation of content
• Many universities and colleges support faculty in the development of robust video lectures. Short videos can replace long lectures.
• However, how does one know if students are actually watching the videos?
Why use video in your course?
Why use any resource in your course?
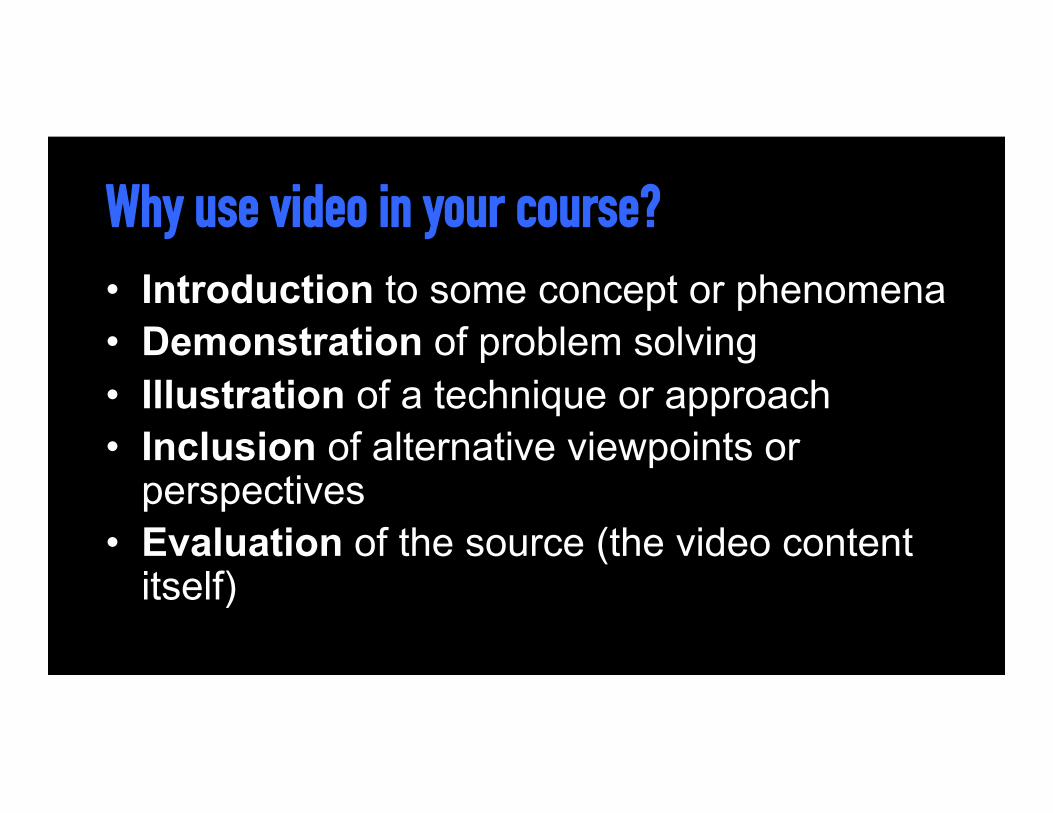
Why use video in your course? • Introduction to some concept or phenomena • Demonstration of problem solving • Illustration of a technique or approach • Inclusion of alternative viewpoints or
perspectives • Evaluation of the source (the video content
itself)

When assigning a resource, what is the expectation on the part of the student? Example 1 Watch these three videos (link 1) (link 2) (link 3) in advance of class 3
Example 2 Watch these three videos (link 1) (link 2) (link 3) in advance of class 3. As you watch the videos consider the following questions: Q1, Q2, & Q3.
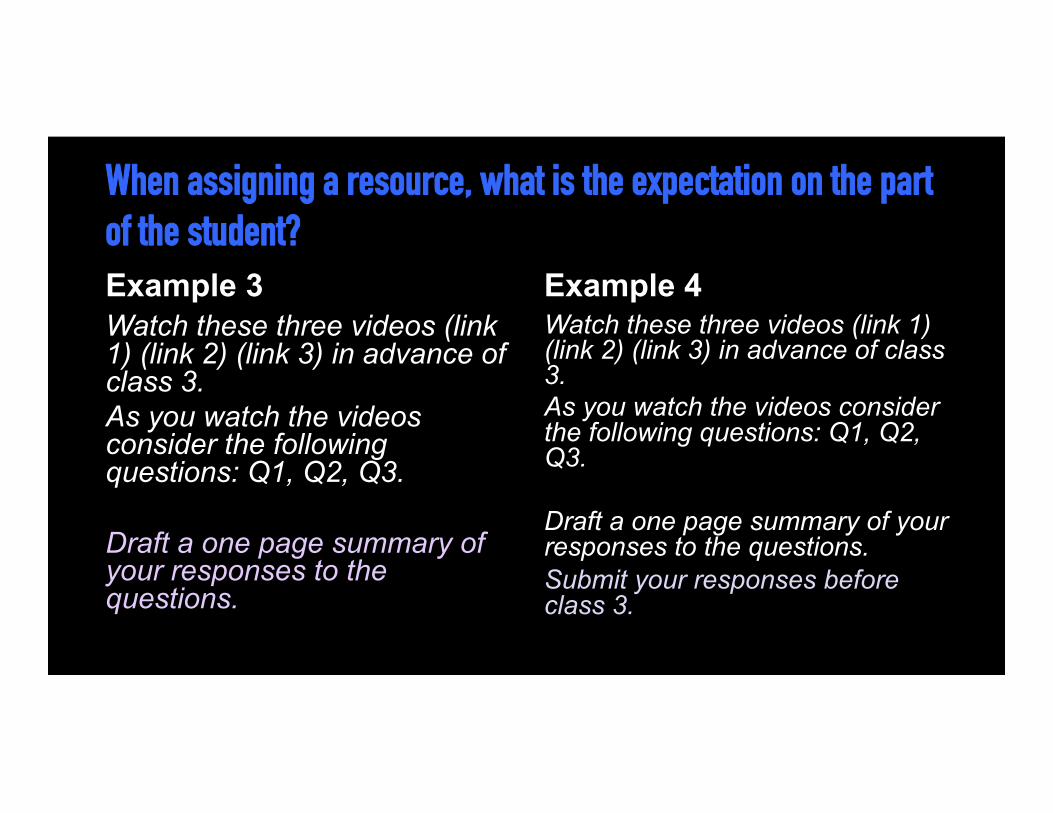
When assigning a resource, what is the expectation on the part of the student? Example 3 Watch these three videos (link 1) (link 2) (link 3) in advance of class 3. As you watch the videos consider the following questions: Q1, Q2, Q3. Draft a one page summary of your responses to the questions.
Example 4 Watch these three videos (link 1) (link 2) (link 3) in advance of class 3. As you watch the videos consider the following questions: Q1, Q2, Q3. Draft a one page summary of your responses to the questions. Submit your responses before class 3.

Use case #1: The black box approach
Faculty distributes video link to students
Students watch the video
Faculty reference video in future lessons

The educational challenges • Preparation • Understanding • Integration

How can we address these challenges? • Preparation à Required deliverable • Understanding à Question / prompts / tests • Integration à Discussion

Use case #2: The transparent approach Faculty
distributes video link to students
Students watch video
Students answer questions in the
videoFaculty review
students answers
Faculty address student pitfalls

Imagine if we could gather insights on student preparation and their understandings as they watch the videos?
Interactive videos provide 1. opportunities for students to actively participate in the video
lecture by responding to question and discussion prompts 2. robust analytics that show data by student including
responses to questions, viewing time, date / time viewed, 3. the ability for students to rate the video and for faculty to
incorporate the results into their teaching, and 4. opportunities for students to comment and generate
discussion around the content and concepts viewed.
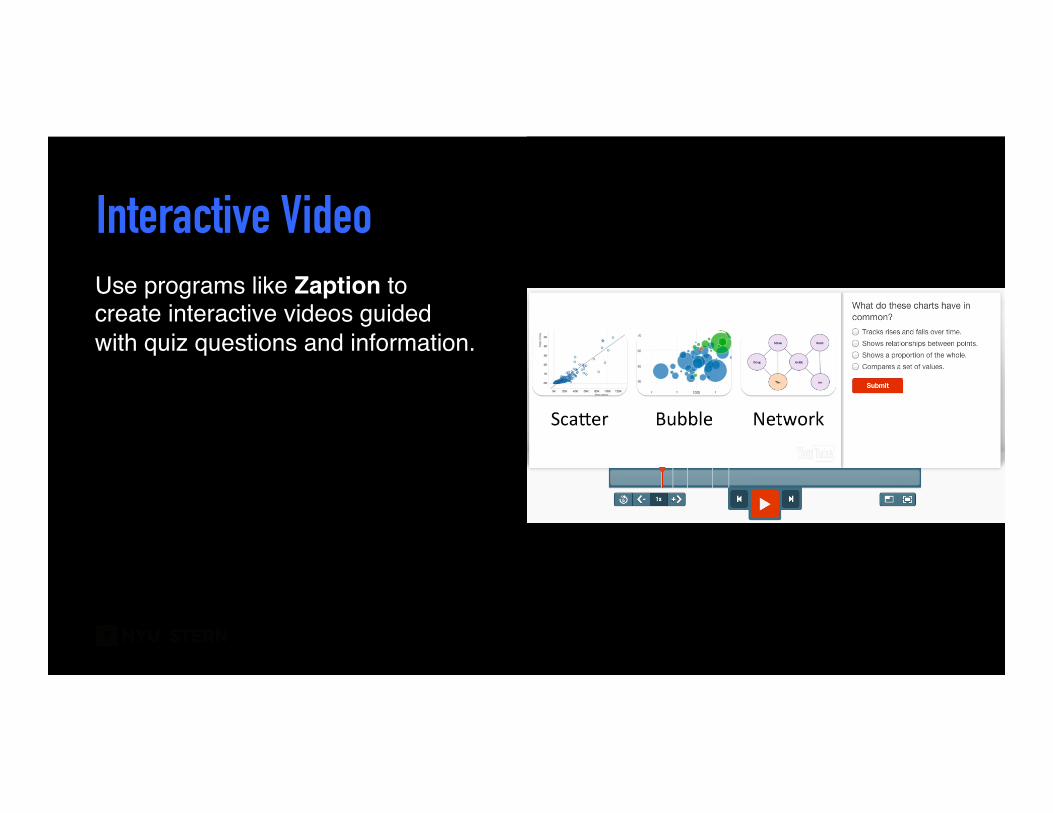
Interactive Video Use programs like Zaption to create interactive videos guided with quiz questions and information.

HOW DOES IT WORK?

How do students interact with the video?
• While a student is watching a video, a question or prompt to discuss the topic appears on the screen, pausing the video.
• Students can then respond appropriately, after which, the video resumes.
• Feedback is provided to the student based on their response.

Types of questions & prompts
Numeric Open ended Multiple choice Check boxes Drawn response
Discussion

How do you know that students have participated?
For each video, the number of unique viewers, the average viewing time, and the percentage of students who completed the questions is available through Zaption’s analytics interface.
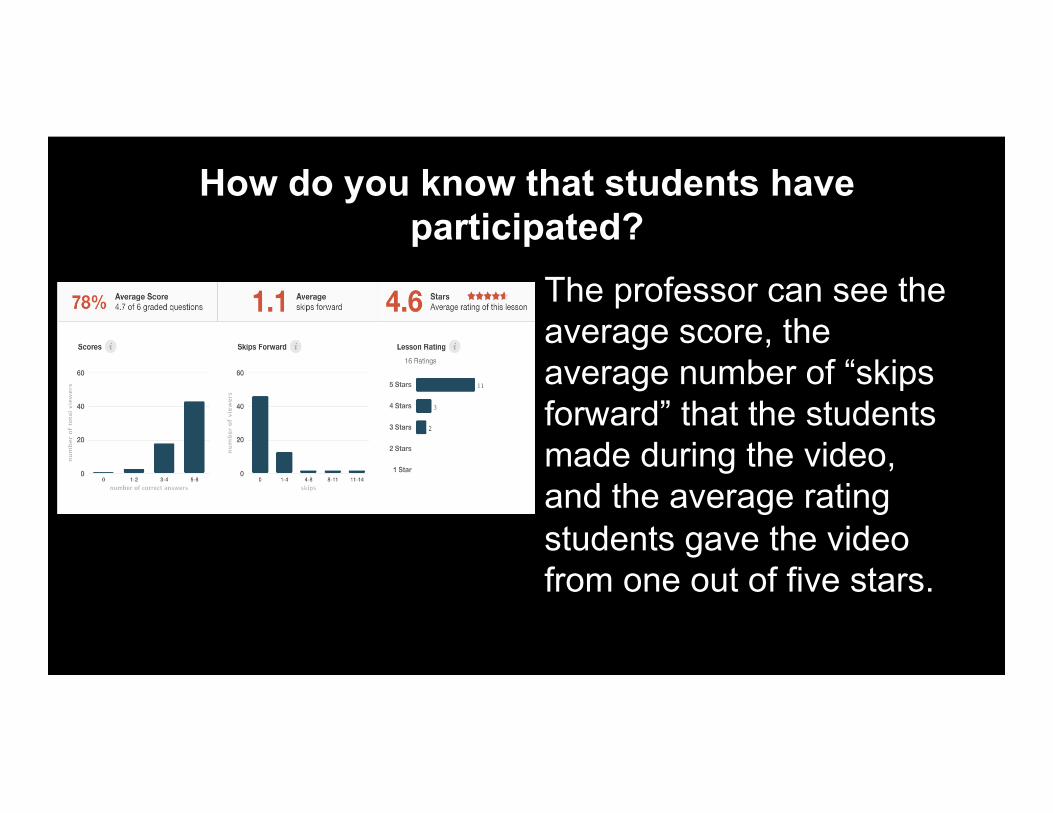
How do you know that students have participated?
The professor can see the average score, the average number of “skips forward” that the students made during the video, and the average rating students gave the video from one out of five stars.
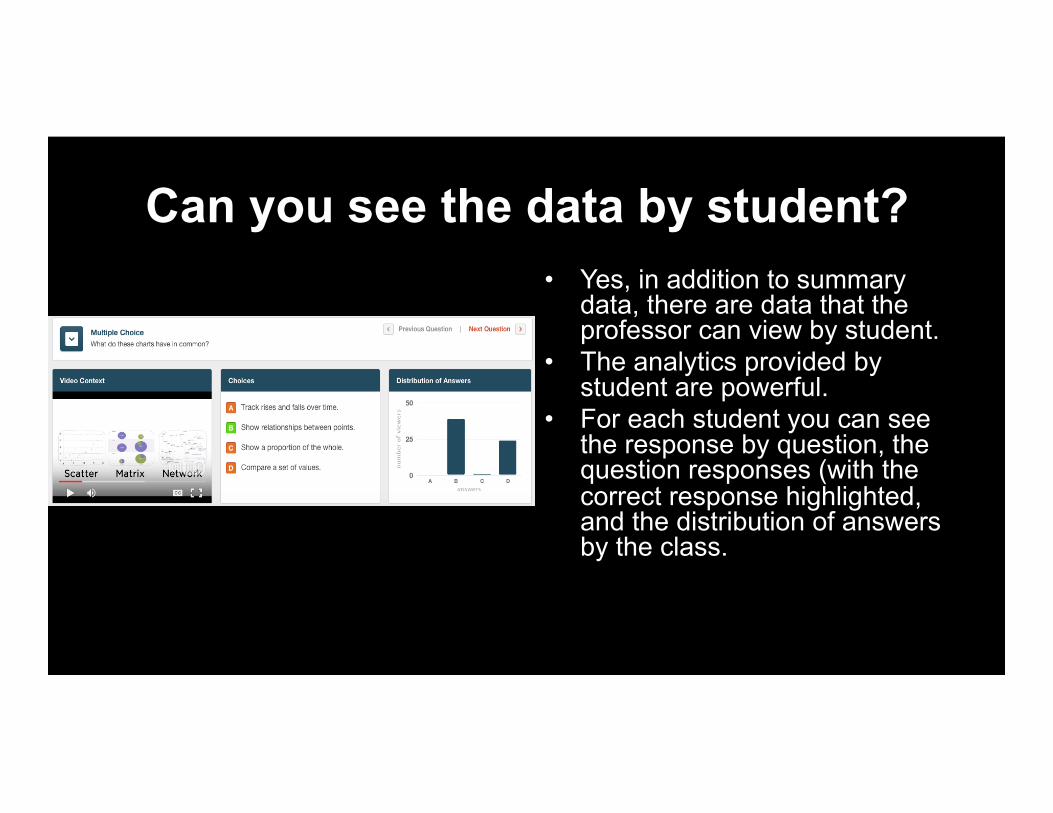
Can you see the data by student? • Yes, in addition to summary
data, there are data that the professor can view by student.
• The analytics provided by student are powerful.
• For each student you can see the response by question, the question responses (with the correct response highlighted, and the distribution of answers by the class.

How I can use this data? • Personally, I’ve used this data
to inform my weekly mini-lecture. I put slides up that show how well the class as a whole did on the questions asked in the video.
• I am then able to customize my lecture to address the questions or the areas that may need more clarification. It also signals to students that I am engaged in their learning and monitoring their progress.

EXAMPLE
See an example of an interactive video for my data visualization course:
http://zapt.io/tftezb5a
72

How to • Identify a video on YouTube or create a video and post
it on your YouTube account. • Create an account on Zaption (zaption.com) • Go to lessons > new lesson • Enter video URL > Add this video to a Lesson • Add a lesson title • Add your question and feedback • Save and publish • Send students the URL

STRATEGY: Present ideas or concepts in diverse ways using open content.
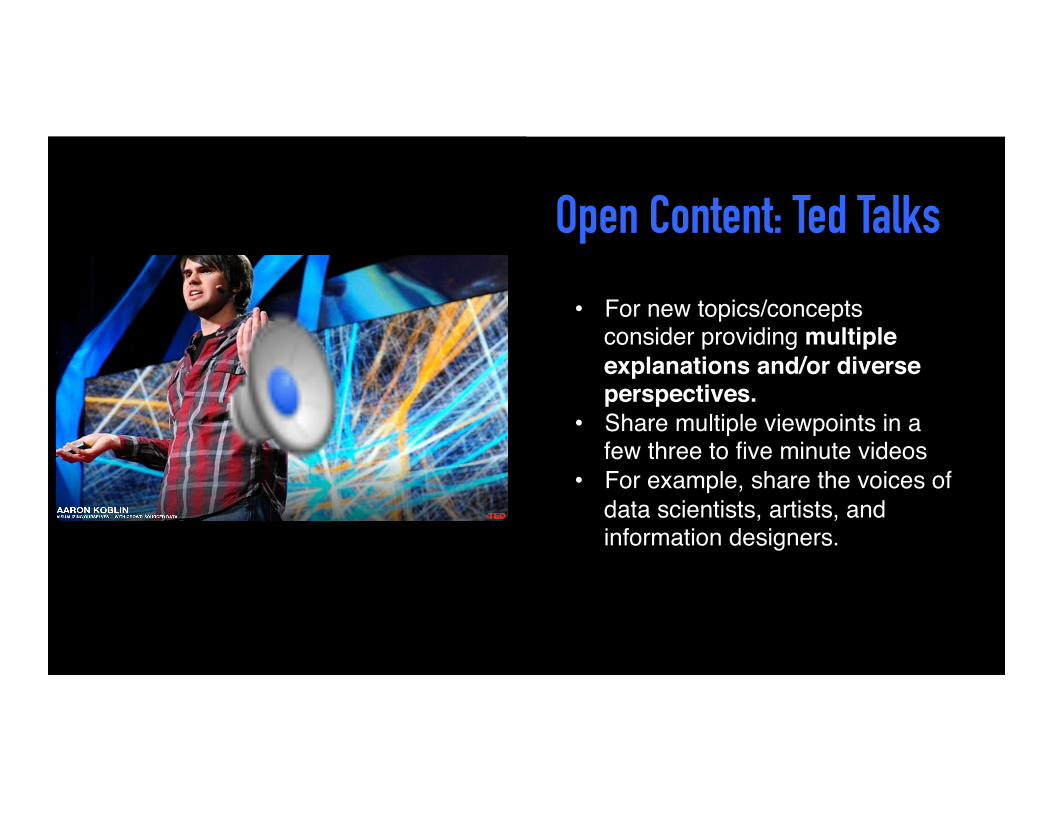
Open Content: Ted Talks
• For new topics/concepts consider providing multiple explanations and/or diverse perspectives.
• Share multiple viewpoints in a few three to five minute videos
• For example, share the voices of data scientists, artists, and information designers.
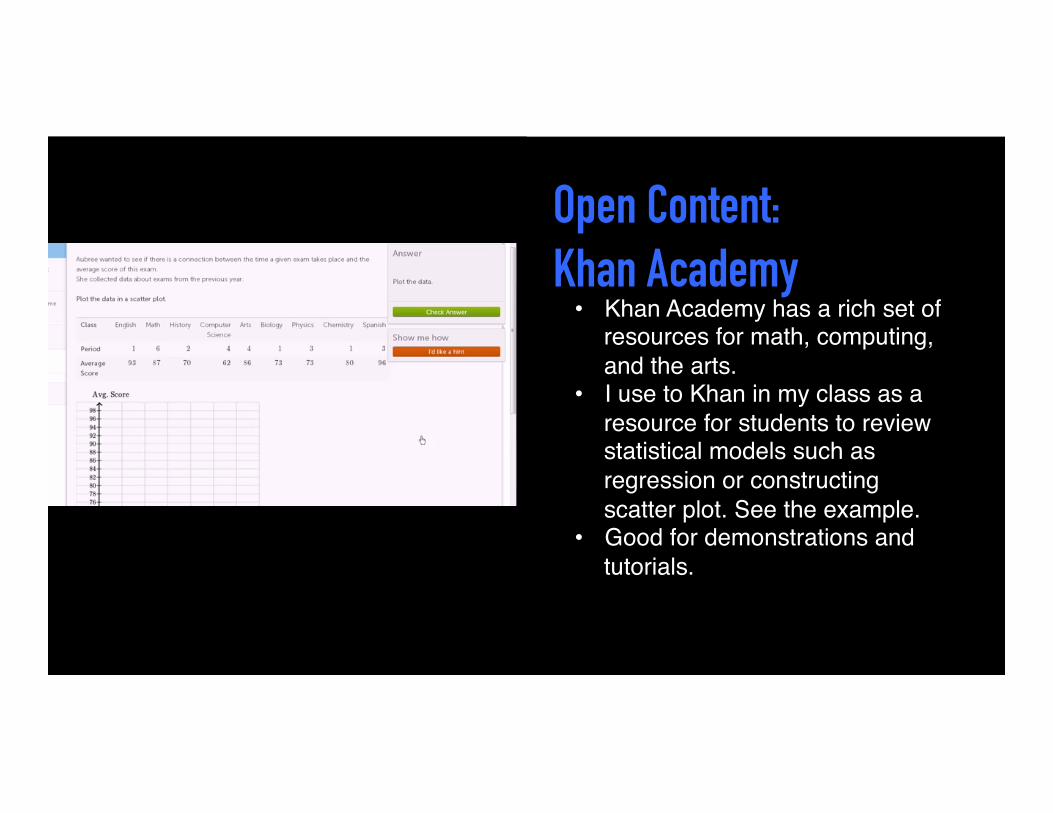
Open Content: Khan Academy
• Khan Academy has a rich set of resources for math, computing, and the arts.
• I use to Khan in my class as a resource for students to review statistical models such as regression or constructing scatter plot. See the example.
• Good for demonstrations and tutorials.

EXAMPLE
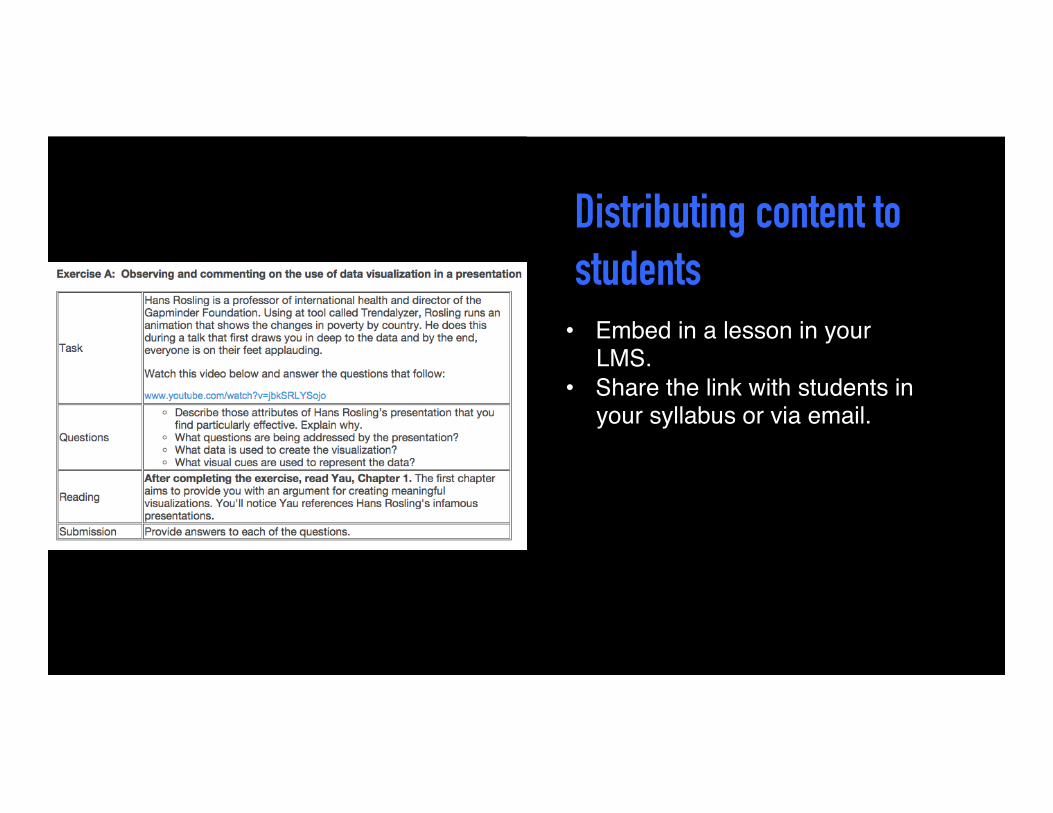
Distributing content to students
• Embed in a lesson in your LMS.
• Share the link with students in your syllabus or via email.

How to find content
• Search Ted at: http://www.ted.com/
• Search Khan academy at: https://www.khanacademy.org/
• Search Google Videos or YouTube
STRATEGY: Use synchronous communication
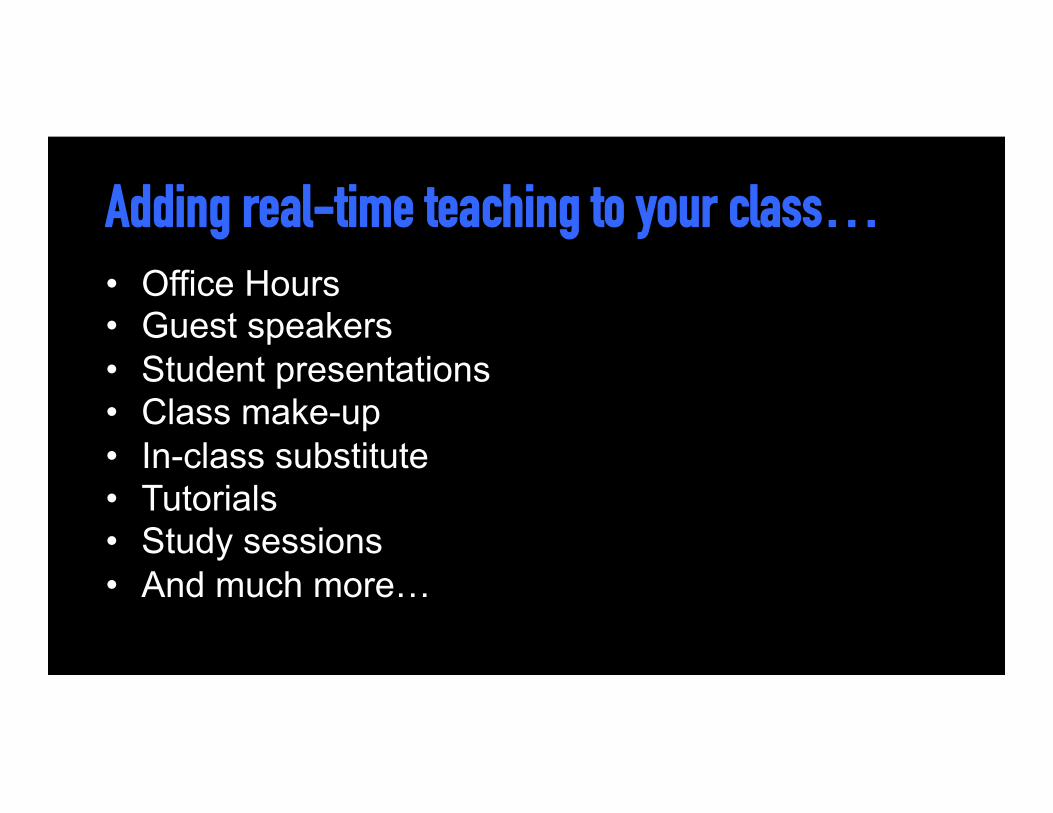
Adding real-time teaching to your class… • Office Hours • Guest speakers • Student presentations • Class make-up • In-class substitute • Tutorials • Study sessions • And much more…

Use web meeting tools • Virtual method when face to
face interaction is limited. • Each student has a voice • Allows faculty and students
to meet online together at the same time.
• Tools: WebEx, GoToMeeting, Adobe Connect

Online Presentations led by professor and/or students
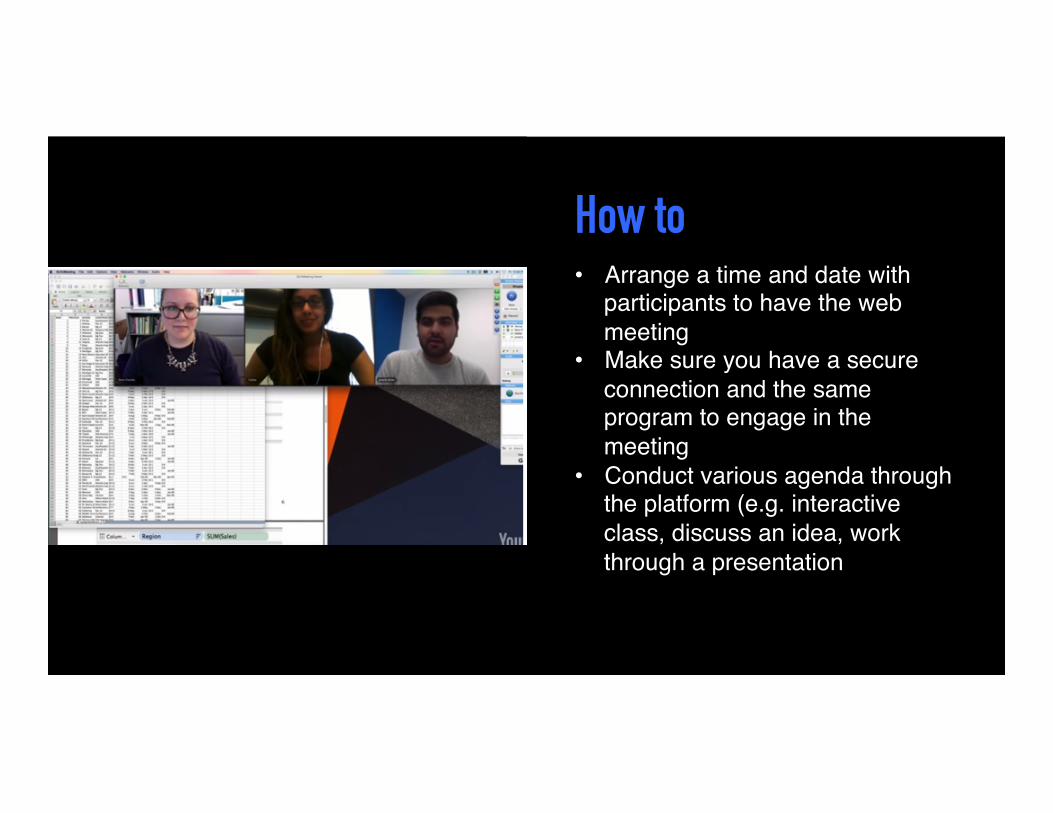
How to • Arrange a time and date with
participants to have the web meeting
• Make sure you have a secure connection and the same program to engage in the meeting
• Conduct various agenda through the platform (e.g. interactive class, discuss an idea, work through a presentation
Establish communication guidelines • How will you respond to chat messages? • Who can talk and when? • Encourage the use of audio and video for
maximum engagement.

EXAMPLES


Student Presentations

Guest Speakers

STRATEGY: Students as content creators

EXAMPLE
Student video project: USPS
Student video project: Brooklyn Brewery https://www.youtube.com/watch?v=ykxZ9WUkrk8&feature=youtu.be

Objective • To create a 2 minute video presentation
with images and narration.

Process • Step 1: Begin with a PowerPoint deck.
Include images and text in the order in you which to narrate over them.
• Step 2: Have a script or talking points handy. • Step 3: Record your narration. • Step 4: Match your narration (your audio
track) to the images you want displayed. • Step 5: Edit and deploy
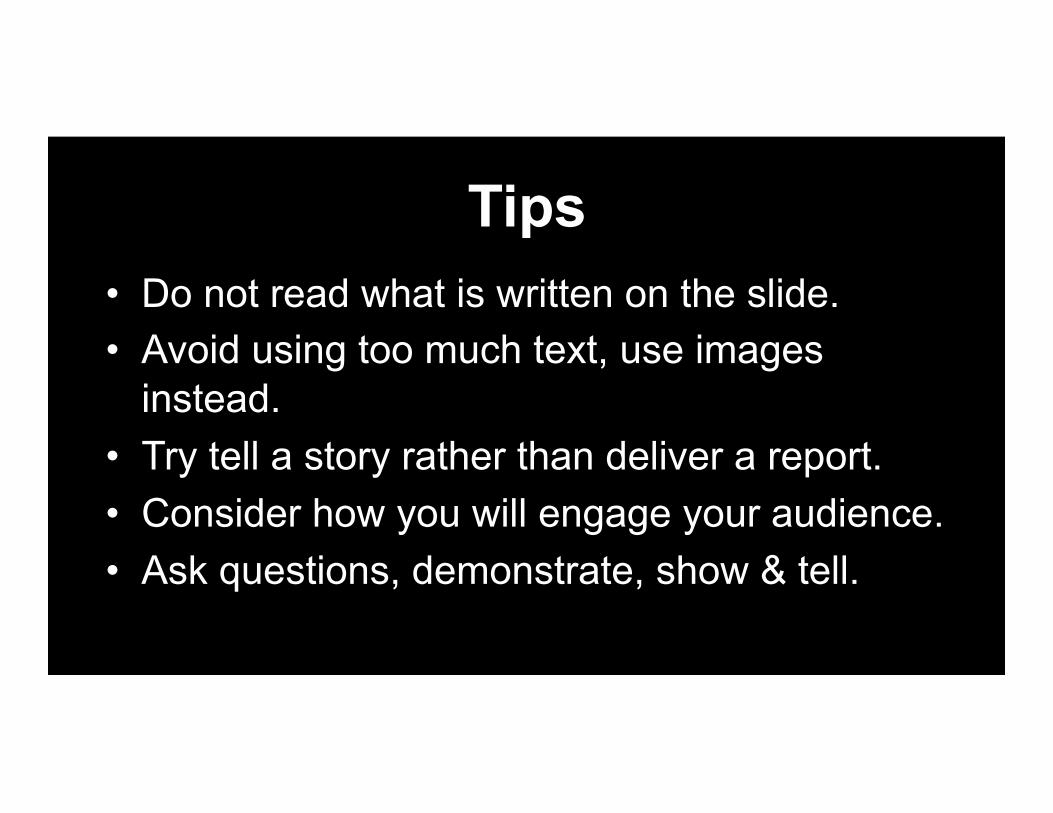
Tips • Do not read what is written on the slide. • Avoid using too much text, use images
instead. • Try tell a story rather than deliver a report. • Consider how you will engage your audience. • Ask questions, demonstrate, show & tell.
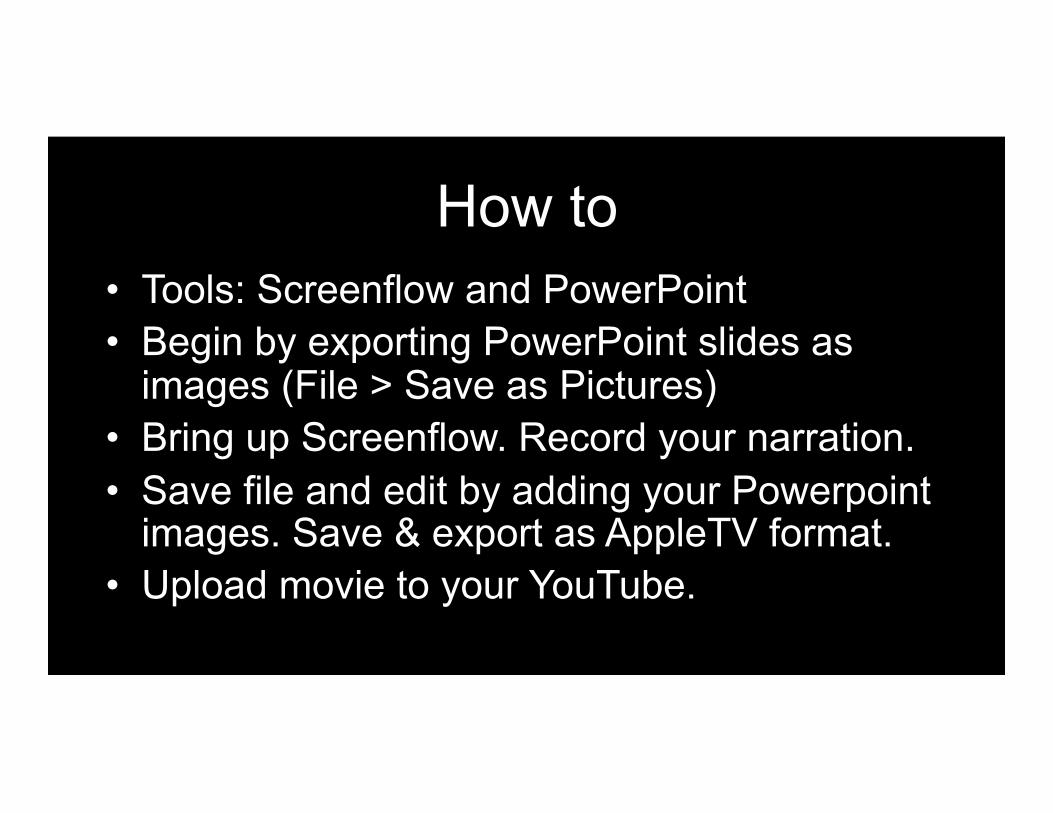
How to • Tools: Screenflow and PowerPoint • Begin by exporting PowerPoint slides as
images (File > Save as Pictures) • Bring up Screenflow. Record your narration. • Save file and edit by adding your Powerpoint
images. Save & export as AppleTV format. • Upload movie to your YouTube.
STRATEGY: Self-Assessment

Use self-assessment quizzes and practice exercises Allow students to self-assess to gauge their knowledge and understanding of content—also signals important concept to know/learn.
• Textbook resources such as Pearson or McGraw Hill, chapter by chapter quizzes
• Use quiz tool in LMS to create short weekly self-assessment quiz • Embed questions into timeline of video mini-lecture that students
can respond to and receive feedback on responses

EXAMPLE
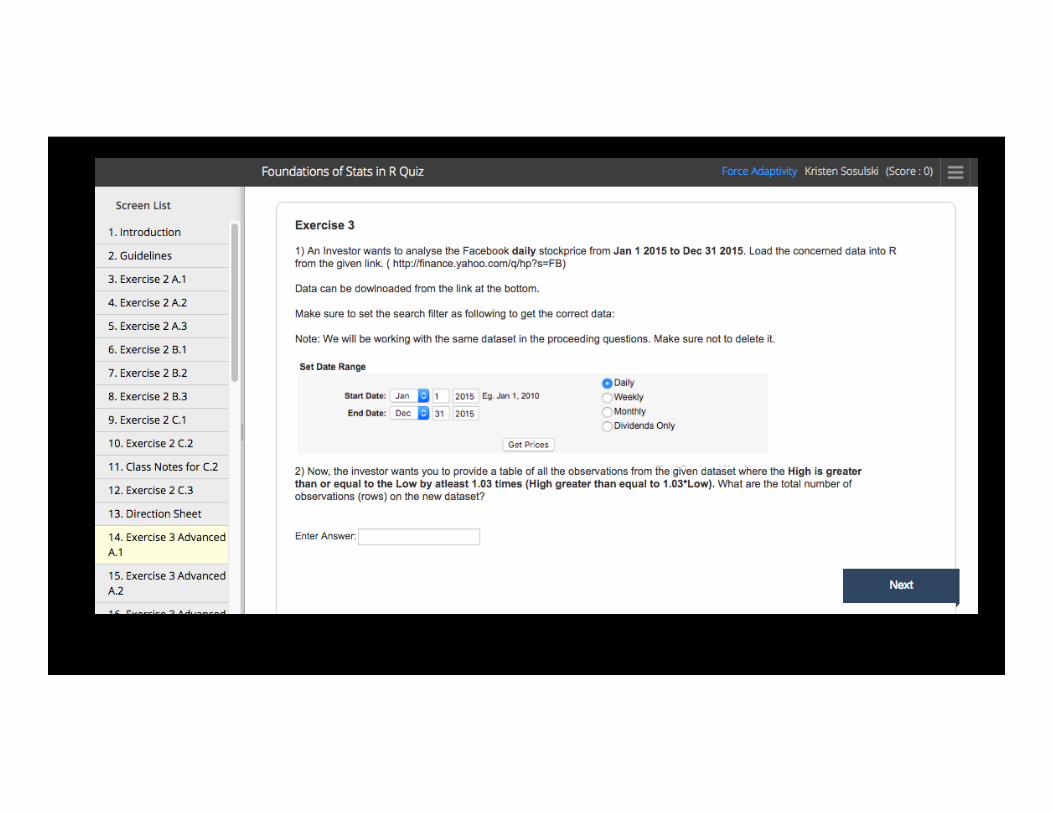
Tools for testing and quizzing • LMS supported engine • Google Forms / Survey Tools • Smart Sparrow for adaptive learning
STRATEGY: Structure group work to promote collaboration. Include yourself in the process.

Have students work on collaborative documents
Google Docs, Presentations, Spreadsheets allow for multi-user authoring and creation of content
Different colored markers indicate to the instructor who contributed what sections, who made comments, and how an assignment came together
While working on a document participants can simultaneously chat about the edits

Google Docs: Instructor Feedback The comments features allows the instructor to add feedback in-text or in the margin of document
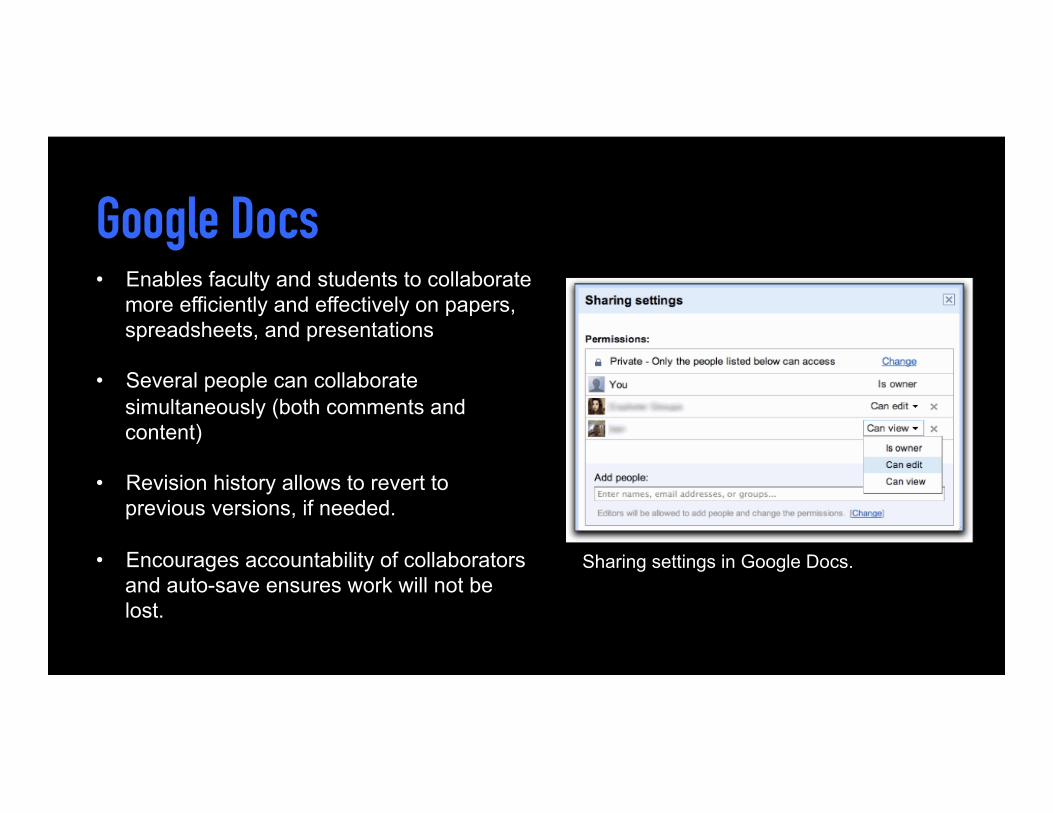
Google Docs
Sharing settings in Google Docs.
• Enables faculty and students to collaborate more efficiently and effectively on papers, spreadsheets, and presentations
• Several people can collaborate
simultaneously (both comments and content)
• Revision history allows to revert to
previous versions, if needed. • Encourages accountability of collaborators
and auto-save ensures work will not be lost.

How to set up GoogleDocs • Google docs are easily accessible through
http://www.google.com/docs/about/ or the Google doc icon in your Gmail apps
• Create a Google doc you wish to collaborate on
• Invite/share to other participants through Gmail

Q & A
Continued Learning: Live online trainings • Teaching live online using synchronous
software – 5/24 @ 1pm EST
• Creating visuals (slides and videos) for online teaching • 5/24 @ 3pm EST
• Developing interactive videos – 6/7 @ 1pm EST

Thank you Kristen Sosulski, Ed.D Associate Professor of Information Systems Director of Education, W.R. Berkley Innovation Lab @sosulski | kristensosulski.com | [email protected]


