Optically stimulated luminescence (OSL) dating of sand deposited by the 1960 tsunami in south-central Chile
Annaliese Eipert Senior Integrative Exercise
March 10, 2004
Submitted in partial fulfillment of the requirements for a Bachelor of Arts degree
from Carleton College, Northfield, Minnesota
Table of Contents
Abstract Introduction………………………………………………………………………….1 Tectonic setting……………………………………………………………...6 Tsunami properties and deposition…………………………………….........8 Optically stimulated luminescence (OSL) dating ………………………......10 OSL dating of tsunami deposits………………………………………..........17 Field Site…………………………………………………………………………….18 Methods……………………………………………………………………………..22 Field methods……………………………………………………………….22 Laboratory methods………………………………………………………...26 Results………………………………………………………………………………27 Discussion…………………………………………………………………………..28 Conclusion………………………………………………………………………….32 Acknowledgements…………………………………………………………………34 References cited…………………………………………………………………….35
Optically stimulated luminescence (OSL) dating of sand deposited by the 1960 tsunami in south-central Chile
Annaliese Eipert
Senior Integrative Exercise March 10, 2004
Sara Gran Mitchell, Advisor
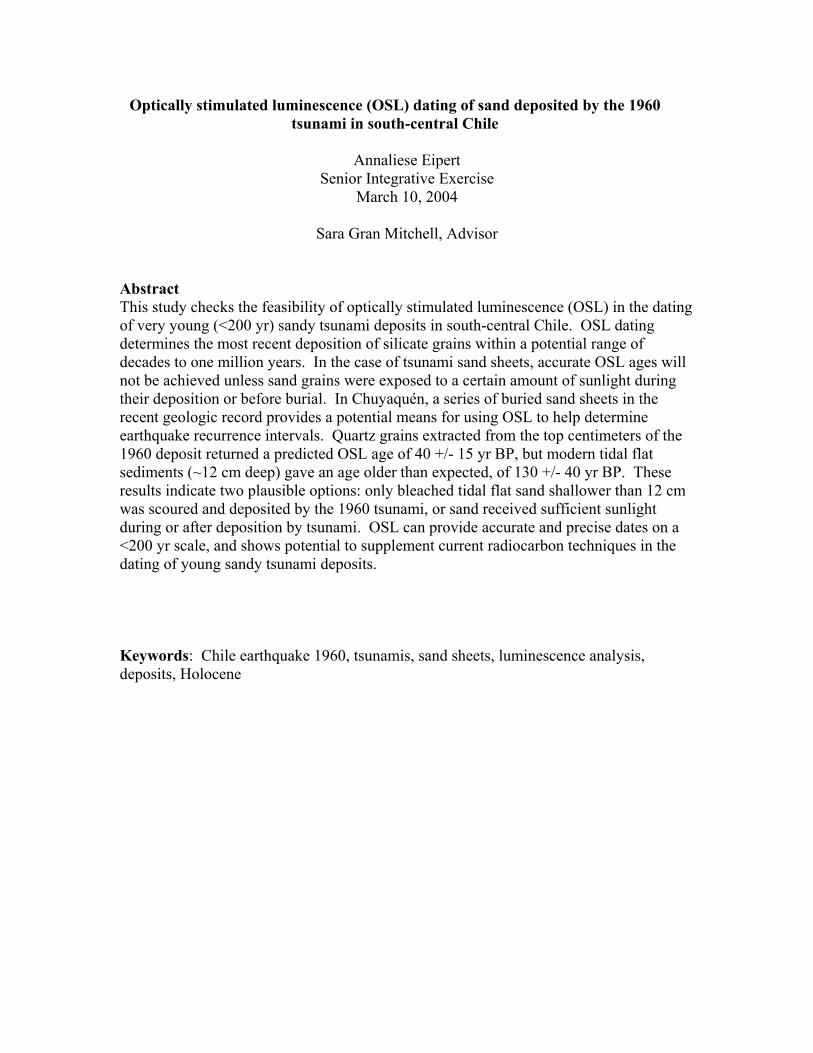
Abstract This study checks the feasibility of optically stimulated luminescence (OSL) in the dating of very young (<200 yr) sandy tsunami deposits in south-central Chile. OSL dating determines the most recent deposition of silicate grains within a potential range of decades to one million years. In the case of tsunami sand sheets, accurate OSL ages will not be achieved unless sand grains were exposed to a certain amount of sunlight during their deposition or before burial. In Chuyaquén, a series of buried sand sheets in the recent geologic record provides a potential means for using OSL to help determine earthquake recurrence intervals. Quartz grains extracted from the top centimeters of the 1960 deposit returned a predicted OSL age of 40 +/- 15 yr BP, but modern tidal flat sediments (~12 cm deep) gave an age older than expected, of 130 +/- 40 yr BP. These results indicate two plausible options: only bleached tidal flat sand shallower than 12 cm was scoured and deposited by the 1960 tsunami, or sand received sufficient sunlight during or after deposition by tsunami. OSL can provide accurate and precise dates on a <200 yr scale, and shows potential to supplement current radiocarbon techniques in the dating of young sandy tsunami deposits. Keywords: Chile earthquake 1960, tsunamis, sand sheets, luminescence analysis, deposits, Holocene
1
Introduction
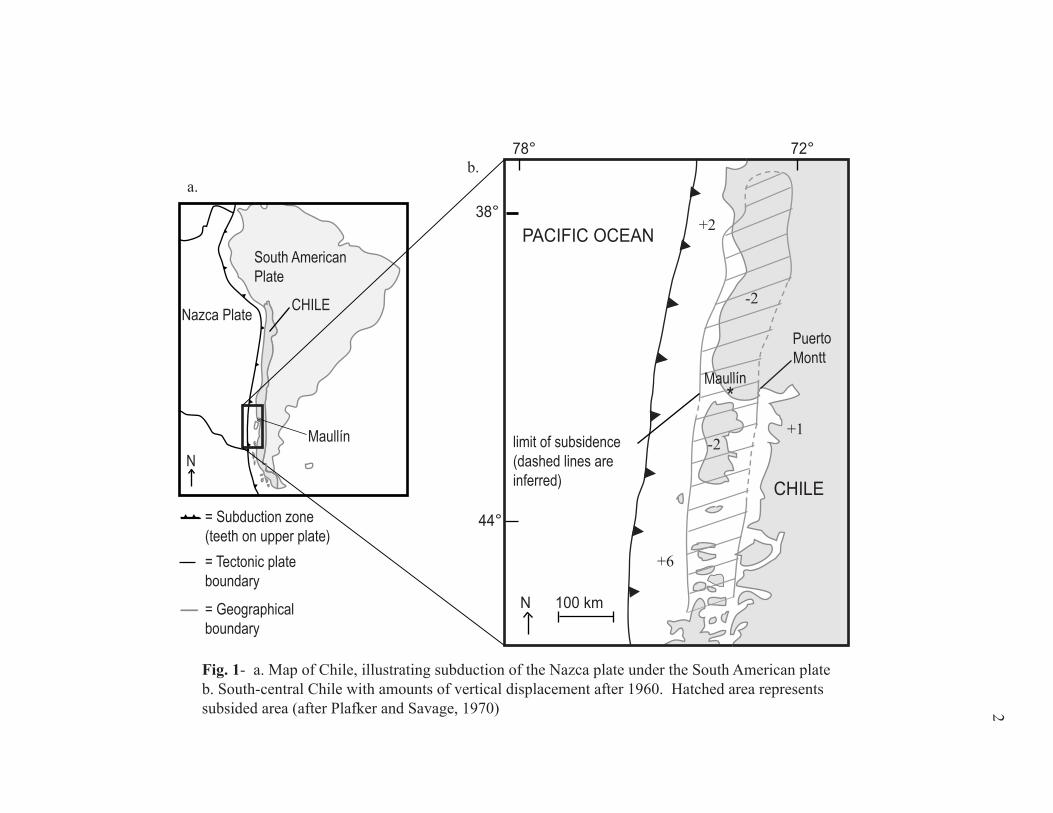
On the afternoon of May 22, 1960 a magnitude 9.5 earthquake occurred off the coast
of central and southern Chile in a complex thrust fault along 1000 km of the subduction
zone of the Nazca Plate under the South American Plate (Fig. 1) (Kanamori and Cipar,
1974; Plafker and Savage, 1970). The earthquake’s estimated 20 to 40 m of slip radiated
more energy than any other in the 20th century, and caused land level changes in 200,000
square km of Chile’s coastline (Fig. 1b) (Barrientos, 1992).
The 1960 earthquake also generated a train of giant ocean waves known as a tsunami.
In Chile these waves reached heights of 20 m (Dudley and Lee, 1998). Together, the
earthquake and tsunami killed 5,000 to 10,000 people in Chile (Bryant, 2001), and over
2,000 people in Hawaii and Japan (Bryant, 2001). Total damage in 1960 currency was
estimated at nearly $900 million (Fig. 2) (Bryant, 2001; Dudley and Lee, 1998).
The tsunami proved more deadly than the earthquake itself. All residents of Maullín,
a small town in south-central Chile (Fig. 1b), survived the earthquake, but 122 died from
the subsequent tsunami (Atwater et al., 1999). Many of these deaths probably could have
been avoided if residents had known that a tsunami might result from an earthquake and
that they should evacuate to high ground in order to escape it. A better understanding of
the behavior of earthquakes and tsunamis could help to prevent such massive loss of life
in future events.
Written and geological records in Chile show a pattern of recurring earthquakes
(Lomnitz, 1970). The great length of the South American subduction zone enables it to
generate the largest trans-Pacific tsunamis; both the magnitude and frequency of events
make the subduction zone a useful area to study (Beck et al., 1998; Bryant, 2001).
= Subduction zone(teeth on upper plate)
CHILENazca Plate
South AmericanPlate
= Tectonic plateboundary
= Geographicalboundary
N
Fig. 1- a. Map of Chile, illustrating subduction of the Nazca plate under the South American plateb. South-central Chile with amounts of vertical displacement after 1960. Hatched area representssubsided area (after Plafker and Savage, 1970)
78° 72°
38°
44°
100 kmN
PACIFIC OCEAN
CHILE
a.b.
Maullín
+2
-2
-2+1
+6
limit of subsidence(dashed lines areinferred)
**
PuertoMontt
Maullín
2
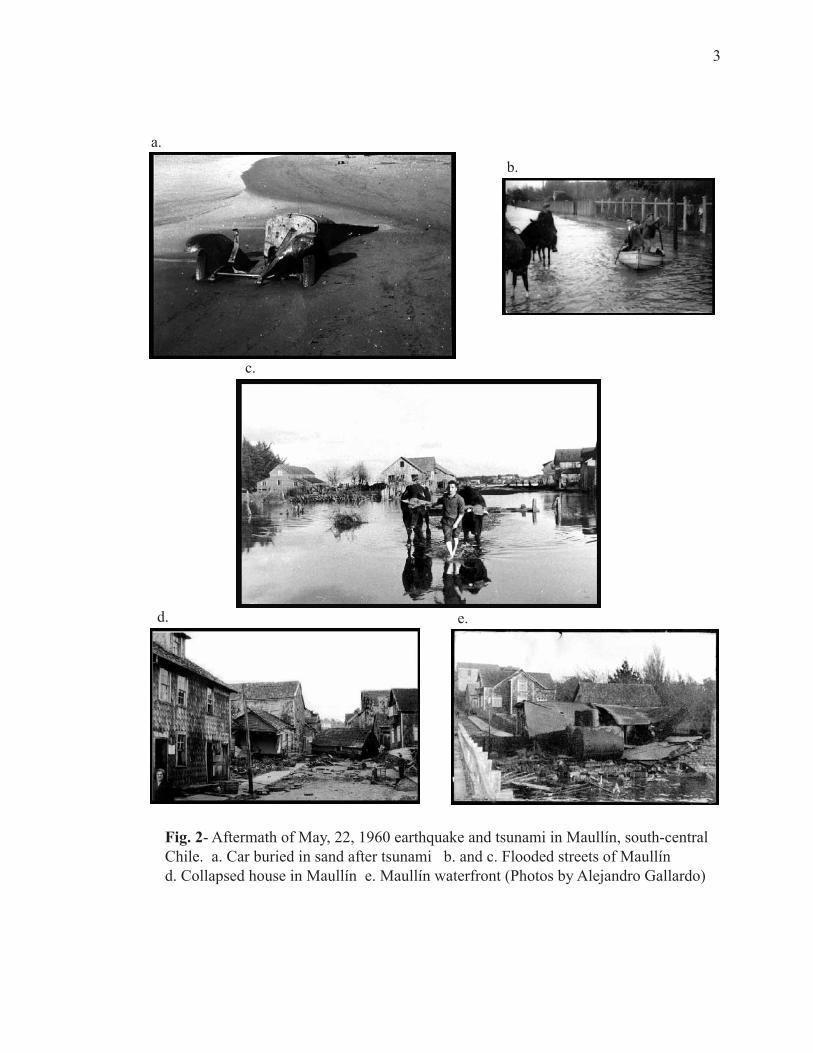
Fig. 2- Aftermath of May, 22, 1960 earthquake and tsunami in Maullín, south-centralChile. a. Car buried in sand after tsunami b. and c. Flooded streets of Maullínd. Collapsed house in Maullín e. Maullín waterfront (Photos by Alejandro Gallardo)
a.b.
c.
d. e.
3
4
Historical records of other large earthquakes span back to the arrival of the Spanish
around 1570 AD (Beck et al., 1998) but events older than this must be identified and
dated from closer study of the geological record. Subduction zone earthquakes are of
scientific and public interest because approximately half the world’s population lives near
active tectonic plate boundaries (Burbank and Anderson, 2001).
The recency of the 1960 Chile earthquake and tsunami makes them valuable events to
study in the field and lab, as sedimentary evidence can be supplemented and correlated
with written records, maps, tide meters, GPS data, and eyewitness accounts from tsunami
survivors. Knowledge of the 1960 event can then be extrapolated into an analogy for past
earthquakes about which data is more difficult to gather directly.
In February 2003, Marco Cisternas of the Catholic University of Valparaíso in Chile
headed a group of scientists and students studying earthquake prehistory, hazard, and
recurrence in south-central Chile. The current study is a branch of that larger project,
intended to add to the pool of knowledge regarding the dating and recurrence intervals of
seismic events.
Determining precise timing for earthquakes is always a problem for
paleoseismologists and geomorphologists (Burbank and Anderson, 2001). Tsunamis like
the one in 1960 can aid in the dating of large earthquakes because of the sand layers they
often leave behind. Until recently, prehistoric deposits like these have been dated only
through their stratigraphical relationship to radiocarbon dates of organic material taken
from adjacent layers (Atwater et al., 1992; Nelson et al., 1995). Radiocarbon dating
relies on the presence of in situ or detrital plant matter to provide a closely-limiting
5
maximum age, however, some sand layers in the south-central Chile field area lack
association with widespread organic material suitable for radiocarbon dating.
In 1985 a technique was developed that allows direct dating of quartz and feldspar
grains (Huntley et al., 1985). Optically stimulated luminescence (OSL) dating is a
method used to determine the most recent exposure of quartz and feldspar grains to
sunlight. Buried sediments are constantly exposed to radiation from trace amounts of
radioactive isotopes within silicate grains and from surrounding sediments. This
radiation excites electrons within sand grains to a higher energy level, consequently
trapping a small number of electrons in defects in the crystal structure. Subsequent
exposure of these sediments to an energy source frees electrons from their traps and
releases a measurable amount of light. The underlying principle of OSL dating is that the
length of time sediments have been buried can be determined from of the quantity of light
released. In other words, the older a deposit is, the more photons it will release when
exposed to light in a laboratory (Huntley et al., 1985).
The current project tests the effectiveness of OSL on a sandy tsunami-laid deposit
from the 1960 Chile earthquake. Huntley and Clague (1996) were the first to date
tsunami deposits with OSL, and obtained mixed results. Given this ambiguity, the 1960
layer was chosen as a check of the applicability of this dating technique because results
can be compared to the known depositional age of 43 y BP. Modern tidal flat samples
were also analyzed in order to further calibrate the results.
The applicability of OSL dating varies between events and locations. However, if
accurate OSL dates are achieved, this study would demonstrate potential for dating sandy
tsunami deposits, as well as provide a check on the lower end of OSL’s age range of
6
decades to one million years (Aitken, 1998; Stokes, 1992). If shown effective, OSL
dating could be used either in conjunction with radiocarbon methods, or in its place
where radiocarbon dating is not feasible.
Tectonic Setting
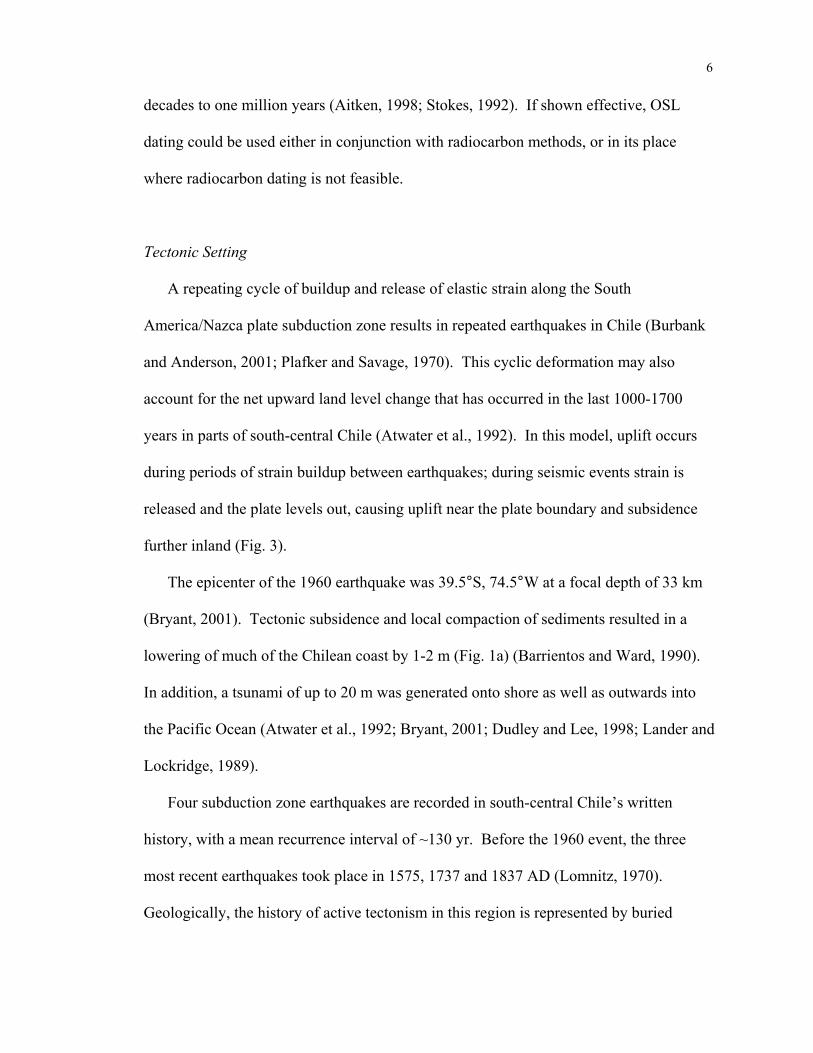
A repeating cycle of buildup and release of elastic strain along the South
America/Nazca plate subduction zone results in repeated earthquakes in Chile (Burbank
and Anderson, 2001; Plafker and Savage, 1970). This cyclic deformation may also
account for the net upward land level change that has occurred in the last 1000-1700
years in parts of south-central Chile (Atwater et al., 1992). In this model, uplift occurs
during periods of strain buildup between earthquakes; during seismic events strain is
released and the plate levels out, causing uplift near the plate boundary and subsidence
further inland (Fig. 3).
The epicenter of the 1960 earthquake was 39.5°S, 74.5°W at a focal depth of 33 km
(Bryant, 2001). Tectonic subsidence and local compaction of sediments resulted in a
lowering of much of the Chilean coast by 1-2 m (Fig. 1a) (Barrientos and Ward, 1990).
In addition, a tsunami of up to 20 m was generated onto shore as well as outwards into
the Pacific Ocean (Atwater et al., 1992; Bryant, 2001; Dudley and Lee, 1998; Lander and
Lockridge, 1989).
Four subduction zone earthquakes are recorded in south-central Chile’s written
history, with a mean recurrence interval of ~130 yr. Before the 1960 event, the three
most recent earthquakes took place in 1575, 1737 and 1837 AD (Lomnitz, 1970).
Geologically, the history of active tectonism in this region is represented by buried
Nazca Plate
S. Amplate
Maullín
StuckNazca Plate
S. Amplate
S. AmplateNazca Plate
Tsunami!
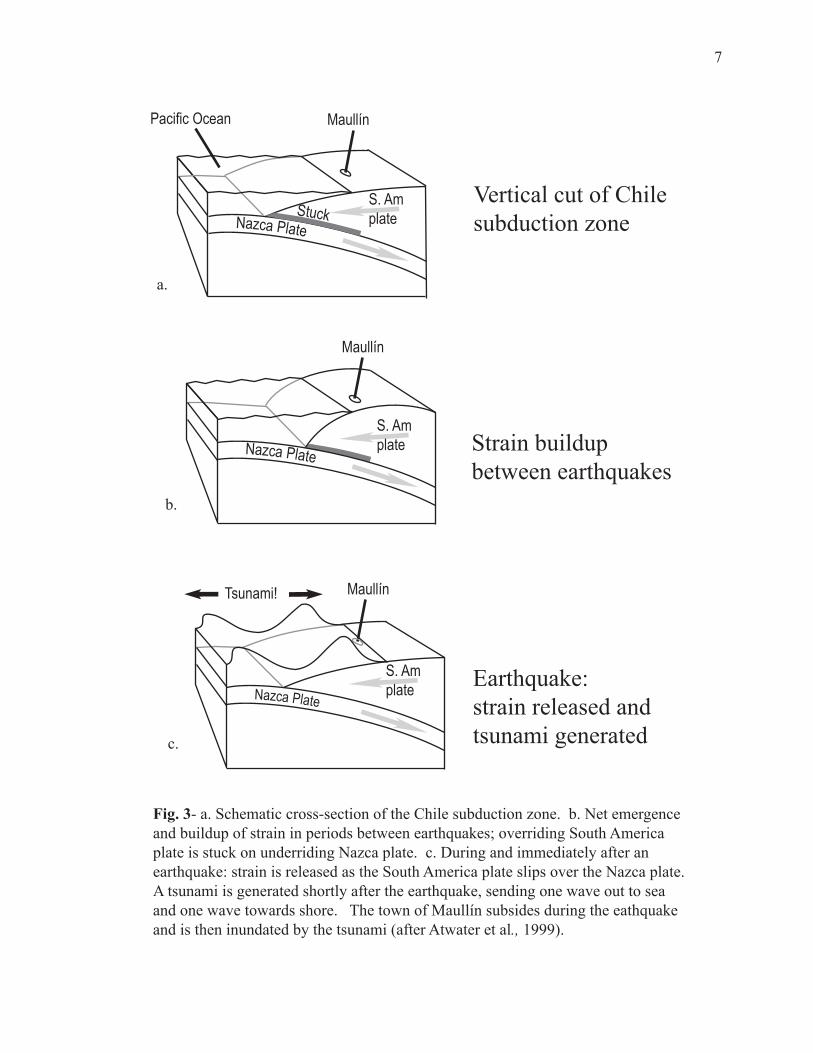
Fig. 3- a. Schematic cross-section of the Chile subduction zone. b. Net emergenceand buildup of strain in periods between earthquakes; overriding South Americaplate is stuck on underriding Nazca plate. c. During and immediately after anearthquake: strain is released as the South America plate slips over the Nazca plate.A tsunami is generated shortly after the earthquake, sending one wave out to seaand one wave towards shore. The town of Maullín subsides during the eathquakeand is then inundated by the tsunami (after Atwater et al., 1999).
a.
b.
c.
Vertical cut of Chilesubduction zone
Strain buildupbetween earthquakes
Earthquake:strain released andtsunami generated
Pacific Ocean
Maullín
Maullín
7
8
tsunami sand sheets and sandy tidal deposits overlying coseismically subsided soils
(Atwater et al., 1992; Bartsch-Winkler and Schmoll, 1990; Salgado et al., Fall 2003).
The sedimentary record of a buried sand sheet dated by radiocarbon indicates that in the
area of study, the 1575 earthquake was probably roughly equivalent in magnitude to the
9.5 earthquake in 1960, while the 1737 and 1837 earthquakes were smaller and were not
recorded with sediment (Atwater et al., Fall 2003).
Tsunami properties and deposition
Tsunamis are low amplitude, long wavelength ocean waves generated by earthquakes,
underwater landslides, bolides, or other catastrophic events. A tsunami may consist of
one wave or several discrete waves spaced up to half an hour apart (Bryant, 2001;
Dawson and Shi, 2000). Tsunami heights vary between events and areas, but large
earthquakes often produce waves of 10 m or more, while anomalous events may have
generated tsunamis hundreds of meters high (Bryant, 2001; Dawson, 1999).
Generally a single tsunami wave has two onshore phases: runup, the initial flow
towards land and over coastal lowlands; and backwash, the flow in the opposite direction
as the wave recedes out to sea. At its runup limit, the tsunami hits a zero velocity zone
before entering the backwash phase (Dawson and Shi, 2000) Backwash can be faster
than runup, and just as dangerous (Bryant, 2001).
Unlike wind-generated waves, the kinetic energy of tsunamis is distributed
throughout the whole water column; this causes wave amplitudes to increase in shallow
water because little energy is dissipated. The land level elevation to which tsunamis
9
flood is commonly two or more times higher than the height of the wave approaching
shore (Bryant, 2001).
Tsunamis themselves are difficult to measure and observe, but often leave deposits of
coastal material in their wakes. These deposits vary greatly, but consist of sediments
dropped out of suspension from rapidly moving water over a wide lateral area (Dawson,
1999). Silt, sand, gravel, or boulder-sized material from shallow offshore and nearshore
zones are turbulently suspended by the swell until they are deposited in low-lying coastal
areas (Dawson, 1999; Dawson and Shi, 2000). If no removable source material exists,
for instance sediment is absent or too large to transport, the tsunami may erode bedrock
or leave no visible trace at all (Bryant, 2001; Dawson and Shi, 2000). When sandy
source material is available, it can be transported several km inland (Morner, 1999),
despite tsunami bottom shear stresses that are too weak to uproot plants (Dawson, 1999).
These conditions sometimes allow for preservation of growth position stems and
rhizomes that are matted down by or protruding into tsunami deposits (Atwater and
Moore, 1992; Atwater et al., 1992; Atwater and Yamaguchi, 1991; Clague and
Bobrowsky, 1994). In situ plant material can later be identified and used for radiocarbon
dating (Aitken, 1998).
Sandy tsunami deposits can be continuous or discontinuous. Local topography
greatly affects the thickness of the deposit (Bryant, 2001). Lower contacts of tsunami
deposits are usually sharp as a result of wave erosion of the underlying soil, while the
upper contact is diffuse and grades into the soil above it (Atwater et al., 1992).
Tsunami sand sheets can be similar to storm deposits, but generally are more
extensive both laterally and inland (Bryant, 2001; Dawson, 1999). Tsunami deposits can
10
often be linked to earthquakes through sedimentary records of co-seismic subsidence, as
lowlands at the edges of rivers and bays have soil types and plant species that are distinct
from those of higher areas (Fig. 4a). Abrupt changes in soils or plants in the buried
sediment record are often attributed to sudden vertical land level displacements that often
result from earthquakes (Fig. 4b) (Atwater et al., 1992; Burbank and Anderson, 2001;
Dawson, 1999; Dawson and Shi, 2000; Salgado et al., 2003). A tsunami is capable of
depositing material on either its runup or backwash phase; therefore one wave or a
subsequent wave in the train may erode a fresh deposit before it has a chance to be
preserved (Dawson and Shi, 2000).
Tsunami deposits must be buried in order for them to remain in the geologic record,
otherwise they will be eroded by wind or water. In cases where grass or lowland plants
are conserved, it is clear that burial must have occurred within two years, otherwise,
plants would have decomposed (Burbank and Anderson, 2001). Thus, the burial and
preservation of tsunami deposits and underlying plant material is valuable to scientists in
the dating of large earthquakes (Atwater et al., 1992).
Optically stimulated luminescence (OSL) dating
Optically stimulated luminescence (OSL) is a relatively new method of “trapped
charge” dating, similar to thermoluminescence dating and electron spin resonance
(Huntley et al., 1985). OSL works on the principle that upon burial, sediments are
constantly exposed to low levels of internal, external, and cosmic radiation. This
radiation causes free electrons from naturally occurring isotopes to be excited from the
lower energy valence band to the higher energy conduction band. However, some
Decades laterBefore
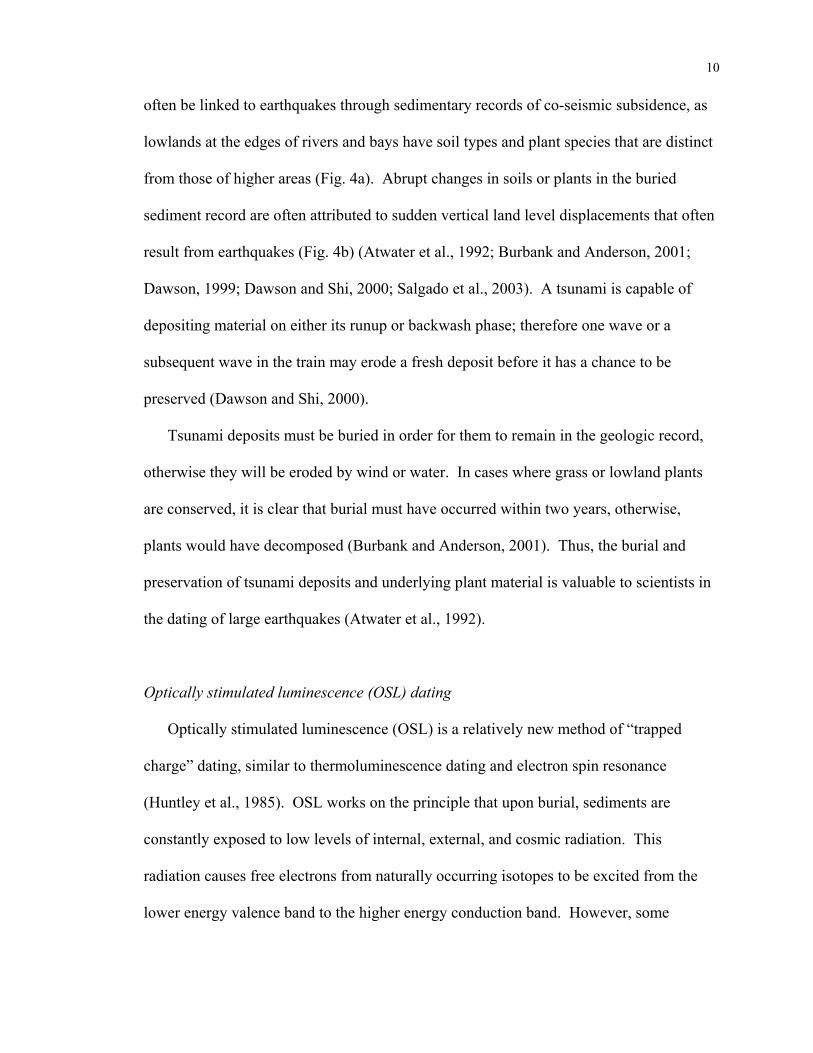
Organic-rich soilMuddy
soil
Fig. 4- a. Generalized tidal flat facies along a slope in the Río Maullín estuary:sandy tidal flat deposits near the river's edge, muddy soil in the slightly highersalt marsh, and firmer organic-rich soil higher up.
Río Maullín
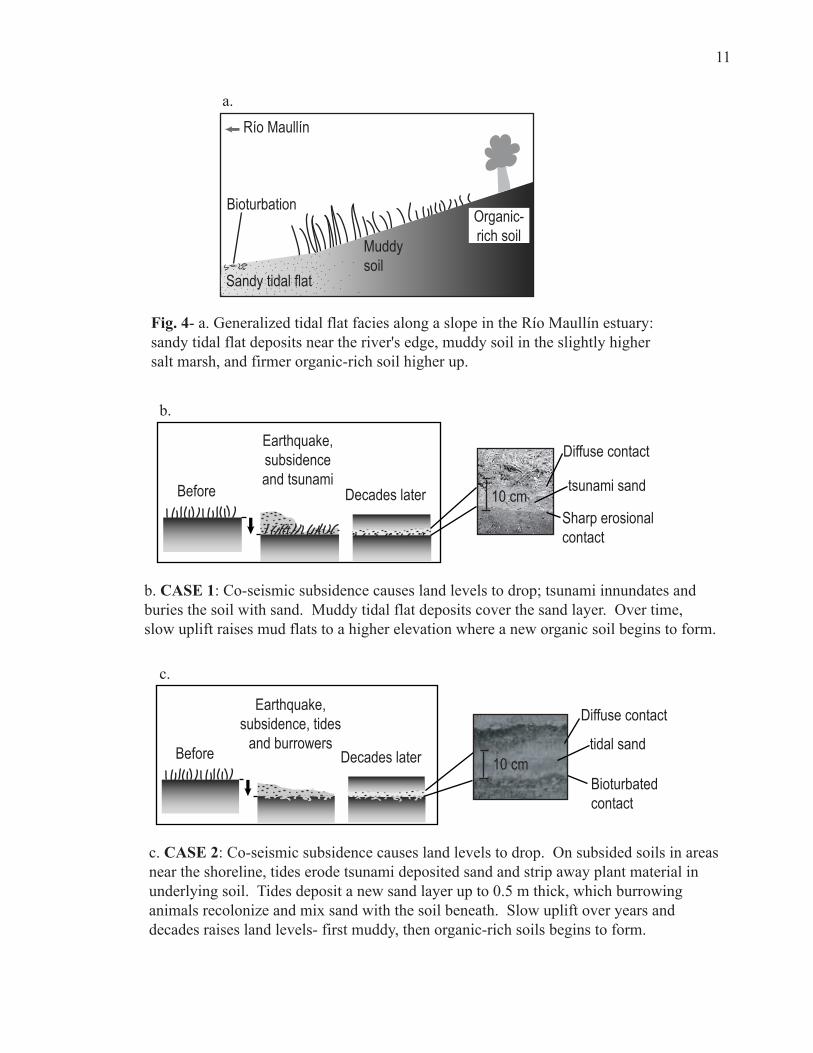
Sharp erosionalcontact
Diffuse contact
tsunami sand
b.
a.
Bioturbation
Sandy tidal flat
Earthquake,subsidence, tides
and burrowersDecades laterBefore
c.
Earthquake,subsidenceand tsunami
b. CASE 1: Co-seismic subsidence causes land levels to drop; tsunami innundates andburies the soil with sand. Muddy tidal flat deposits cover the sand layer. Over time,slow uplift raises mud flats to a higher elevation where a new organic soil begins to form.
c. CASE 2: Co-seismic subsidence causes land levels to drop. On subsided soils in areasnear the shoreline, tides erode tsunami deposited sand and strip away plant material inunderlying soil. Tides deposit a new sand layer up to 0.5 m thick, which burrowinganimals recolonize and mix sand with the soil beneath. Slow uplift over years anddecades raises land levels- first muddy, then organic-rich soils begins to form.
Bioturbatedcontact
Diffuse contact
tidal sand
11
10 cm
10 cm
12
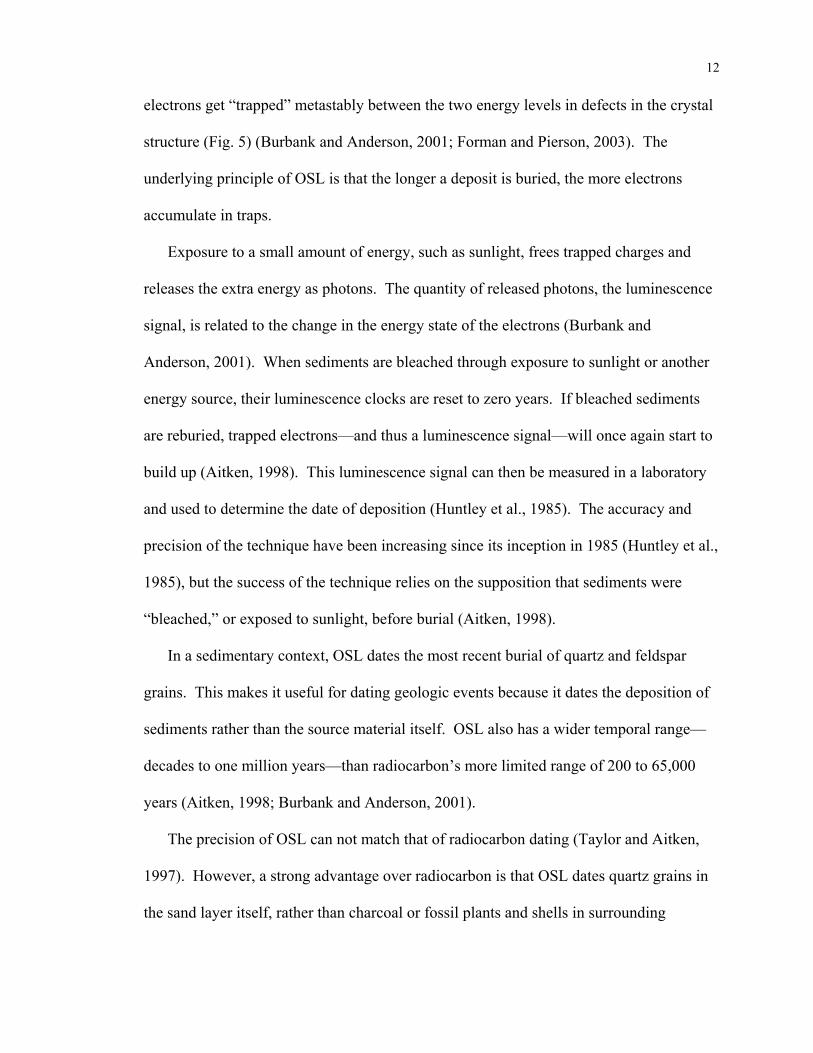
electrons get “trapped” metastably between the two energy levels in defects in the crystal
structure (Fig. 5) (Burbank and Anderson, 2001; Forman and Pierson, 2003). The
underlying principle of OSL is that the longer a deposit is buried, the more electrons
accumulate in traps.
Exposure to a small amount of energy, such as sunlight, frees trapped charges and
releases the extra energy as photons. The quantity of released photons, the luminescence
signal, is related to the change in the energy state of the electrons (Burbank and
Anderson, 2001). When sediments are bleached through exposure to sunlight or another
energy source, their luminescence clocks are reset to zero years. If bleached sediments
are reburied, trapped electrons—and thus a luminescence signal—will once again start to
build up (Aitken, 1998). This luminescence signal can then be measured in a laboratory
and used to determine the date of deposition (Huntley et al., 1985). The accuracy and
precision of the technique have been increasing since its inception in 1985 (Huntley et al.,
1985), but the success of the technique relies on the supposition that sediments were
“bleached,” or exposed to sunlight, before burial (Aitken, 1998).
In a sedimentary context, OSL dates the most recent burial of quartz and feldspar
grains. This makes it useful for dating geologic events because it dates the deposition of
sediments rather than the source material itself. OSL also has a wider temporal range—
decades to one million years—than radiocarbon’s more limited range of 200 to 65,000
years (Aitken, 1998; Burbank and Anderson, 2001).
The precision of OSL can not match that of radiocarbon dating (Taylor and Aitken,
1997). However, a strong advantage over radiocarbon is that OSL dates quartz grains in
the sand layer itself, rather than charcoal or fossil plants and shells in surrounding
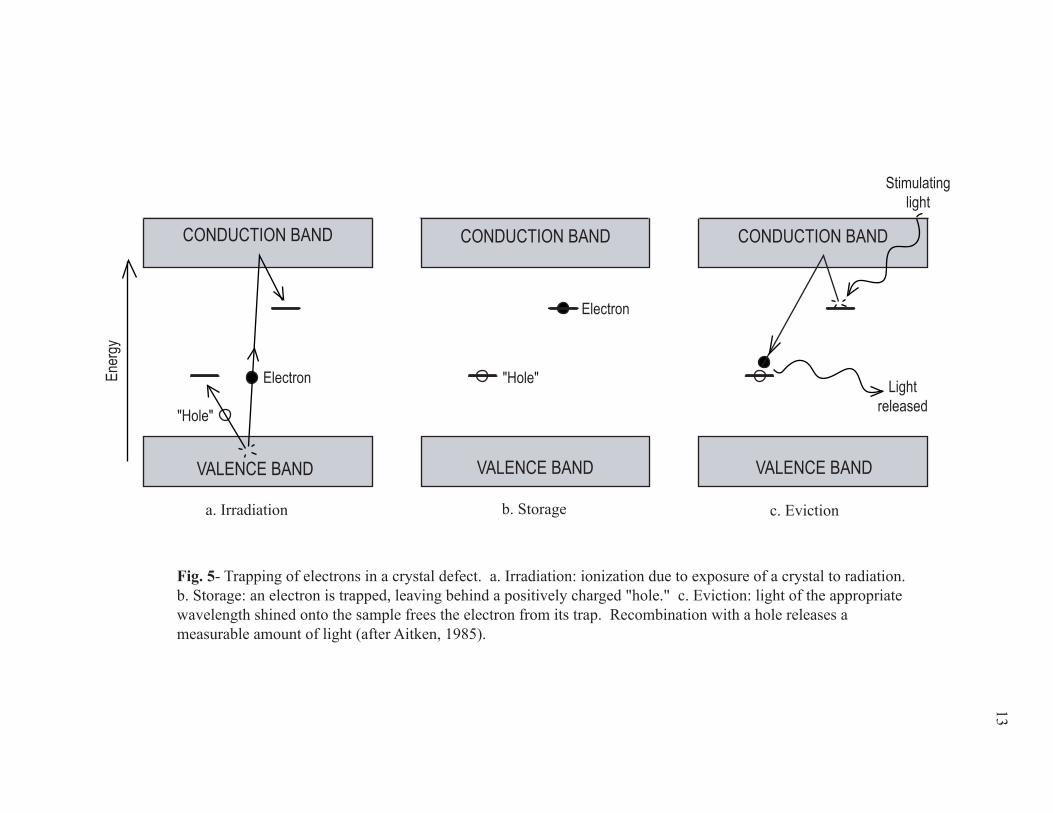
Fig. 5- Trapping of electrons in a crystal defect. a. Irradiation: ionization due to exposure of a crystal to radiation.b. Storage: an electron is trapped, leaving behind a positively charged "hole." c. Eviction: light of the appropriatewavelength shined onto the sample frees the electron from its trap. Recombination with a hole releases ameasurable amount of light (after Aitken, 1985).
VALENCE BAND
CONDUCTION BAND
VALENCE BAND
CONDUCTION BAND
VALENCE BAND
CONDUCTION BAND
Electron
"Hole"
a. Irradiation b. Storage c. Eviction
Stimulatinglight
Lightreleased
Electron
"Hole"Ener
gy
13
14
material (Huntley and Clague, 1996). The ability to date a sand layer is valuable for
several reasons. Radiocarbon methods may only provide reliable ages with in situ or
detrital plant material (Nelson et al., 1995), otherwise the organic matter may have been
re-deposited from an older layer. The stratigraphical association of the radiocarbon-dated
layer with the sand deposit must also be correctly understood in order to extrapolate the
sand layer’s age (Aitken, 1998). An additional advantage of OSL is that ages are
acquired directly in calendar years, therefore eliminating a common source of error in the
necessary calibration of radiocarbon ages (Taylor and Aitken, 1997).
Two distinct measurements must be made in an OSL laboratory to determine the age
of a particular deposit. The first measurement is paleodose, the amount of radiation that
sediments were exposed to while buried, which is measured in Grays (Gy). Paleodose is
determined from the intensity of the luminescence signal a sample gives off when
exposed to a light source (Aitken, 1998).
The second measurement is dose rate, the sample’s unique annual radiation
accumulation rate (Gy/yr), which is estimated from levels of radioactive isotopes in its
surrounding sediments (Forman and Pierson, 2003). Dose rate is an approximation of the
radiation a sample has received over time, based on the assumption that the concentration
of radioactive isotopes has remained constant. Fluctuations in radiation levels over time
are difficult to account for, and result in much of the uncertainty in OSL ages (Taylor and
Aitken, 1997).
Most radiation that contributes to the dose rate is a result of the decay of trace
amounts of U, Th and 40K present in quartz or feldspar grains. Cosmic rays also
contribute a small amount of radiation to near-surface samples. Because saturated
15
sediments absorb more radiation than dry sediments, water content of the sediments must
also be considered (Aitken, 1998; Forman and Pierson, 2003). For OSL to be effective,
sand must be well-bleached by the sun and then quickly buried by other sediments in
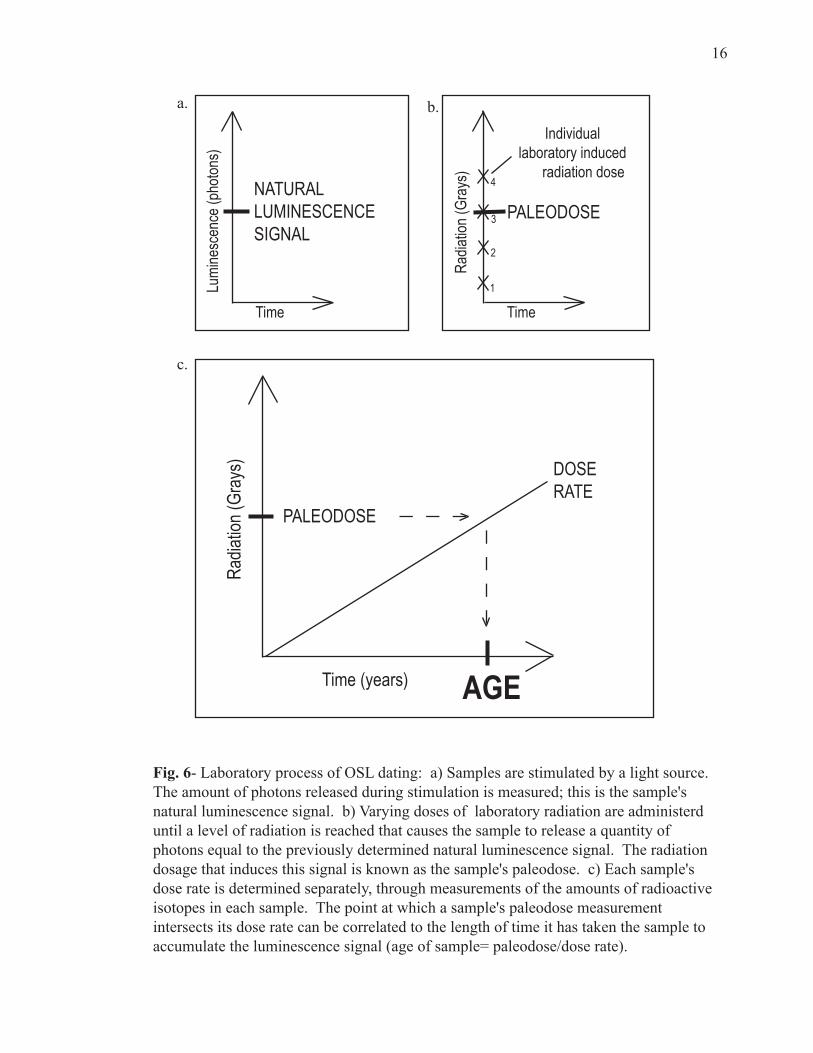
order to preserve this date of bleaching. If both conditions are met, paleodose (Gy)
divided by dose rate (Gy/yr) equals the number of years since deposition (Fig. 6) (Aitken,
1998).
The age of samples dateable by OSL does not fall within a fixed range, partly due to
varying dose rates of sediments. The lower limit of OSL is also affected by the
sensitivity of a sample’s luminescence signal, or its ability to accumulate electrons in
traps (Aitken, 1998). The upper limit of OSL is reached when all the traps in a sample
are filled, as each trap can accommodate only one or two electrons. The amount of time
it takes for a sand grain’s traps to be filled is a function of dose rate and the number of
traps in the grain (Aitken, 1998). In order for OSL dating of very recent deposits to be
successful, sediments must have a high dose rate and be sensitive enough to capture a
luminescence signal in a short time. Conversely, very old deposits must have a low dose
rate and be insensitive enough that their traps do not fill too quickly.
Two common errors in OSL dating of young sediments are overly old dates that result
from insufficient bleaching, and false zero dates in young sediments that do not have a
sensitive enough luminescence signal to trap and release a detectable number of photons
(Aitken, 1998; Stokes, 1992). Researchers have had varying degrees of success in the
dating of recently deposited (< hundreds of yr old) sediments.
Stokes (1992) tested young sediments likely to be sufficiently bleached in different
environments; supposedly “zeroed” sediments instead gave ages of tens to hundreds of
Lumi
nesc
ence
(pho
tons)
Radia
tion (
Gray
s)
Time (years)
Radia
tion (
Gray
s)
NATURALLUMINESCENCESIGNAL
PALEODOSE
DOSERATE
AGE
Individuallaboratory induced radiation dose
Fig. 6- Laboratory process of OSL dating: a) Samples are stimulated by a light source.The amount of photons released during stimulation is measured; this is the sample'snatural luminescence signal. b) Varying doses of laboratory radiation are administerduntil a level of radiation is reached that causes the sample to release a quantity ofphotons equal to the previously determined natural luminescence signal. The radiationdosage that induces this signal is known as the sample's paleodose. c) Each sample'sdose rate is determined separately, through measurements of the amounts of radioactiveisotopes in each sample. The point at which a sample's paleodose measurementintersects its dose rate can be correlated to the length of time it has taken the sample toaccumulate the luminescence signal (age of sample= paleodose/dose rate).
PALEODOSE
3
1
2
4
a. b.
c.
16
Time Time
17
years. These results were far from the expected age of zero, but were nonetheless an
improvement on previous studies in which the residual signal of sediments was a
magnitude of order higher. Olley et al (1998) tested young fluvial quartz grains from a
1930 flood event; resulting ages were also too old by an order of magnitude.
Most recently, Forman and Pierson (2003) obtained ages of 130-150 +/- 20-30 yr BP
on eolian dunes in Idaho. Despite uncertainty due to dose rate approximation, this recent
study illustrated recent improved resolution on sediments <1 ky. However, the chances
for adequate bleaching of sand in eolian settings may be higher than in water-laid
deposits (Stokes, 1992).
OSL dating of tsunami deposits
The application of OSL dating to tsunami deposits poses an additional challenge.
Tsunamis deposit material rapidly, allowing little time for sediments to be bleached;
tsunamis that occur at night have no chance of being bleached during deposition (Huntley
and Clague, 1996). Despite the risk of inadequate bleaching, OSL analyses of tsunami
deposits have resulted in successful matches with stratigraphical, radiocarbon, or
historical dates (Banerjee et al., 2001; Huntley and Clague, 1996). These recent studies
indicate that OSL dating of tsunami studies is feasible.
The 1960 Chile tsunami ran its course in under two hours; this short time, in
combination with the turbidity of the tsunami, was probably not sufficient to completely
bleach the sediments. Forman and Pierson (2003) determined that a one-hour exposure
was sufficient to reset the luminescence clocks of quartz grains in an eolian setting, while
Rendell (1994) found that quartz grains covered by 12-14 m of water were sufficiently
18
bleached after three hours. However, it is possible that mixing of the tsunami deposit
source material—modern day tidal flat sand—was sufficient to bleach sediments prior to
the depositional event.
In the current analysis, ages that are older than expected for the 1960 tsunami deposit
would indicate insufficient bleaching of sand before burial. Ages that are too young
would indicate that sufficient bleaching occurred but that these particular sediments did
not have a sensitive enough luminescence signal to accumulate a detectable amount of
photons in the short time since 1960. Feasibility of OSL as a successful means to date
these young tsunami sediments would complement radiocarbon dating, and could replace
it when the in situ or detrital organic material necessary for radiocarbon dating is not
available, or if deposits are older than radiocarbon’s 65 ka limit (Huntley and Clague,
1996).
Field site
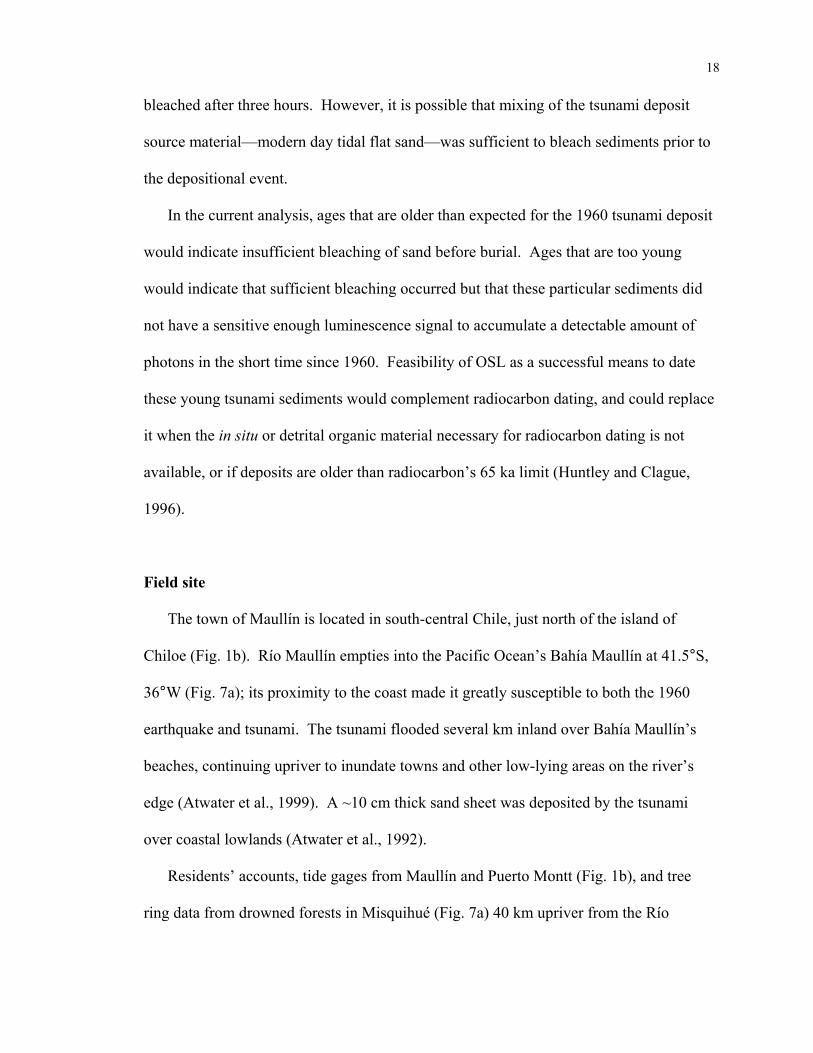
The town of Maullín is located in south-central Chile, just north of the island of
Chiloe (Fig. 1b). Río Maullín empties into the Pacific Ocean’s Bahía Maullín at 41.5°S,
36°W (Fig. 7a); its proximity to the coast made it greatly susceptible to both the 1960
earthquake and tsunami. The tsunami flooded several km inland over Bahía Maullín’s
beaches, continuing upriver to inundate towns and other low-lying areas on the river’s
edge (Atwater et al., 1999). A ~10 cm thick sand sheet was deposited by the tsunami
over coastal lowlands (Atwater et al., 1992).
Residents’ accounts, tide gages from Maullín and Puerto Montt (Fig. 1b), and tree
ring data from drowned forests in Misquihué (Fig. 7a) 40 km upriver from the Río
73° 45' 73° 30'
41° 30'
41° 45'
Río Maullín
Río BallenarBahíaMaullín
Fig. 7- a. Location map (after Ayala, 1982) showing pre-1960 lowlandsb. Map of Maullin area before 1960 earthquake c. Aerial photo from 1962 ofChuyaquén field site with transect of trenches and sample site locations.
N 10 km
a.
~2 km
N
b.
= Muddy lowlands
= Lowlands coveredby Holocene sand
~1 km transect
Tidal flatsample site
Fosa 5 andsample site
Río Ballenar
Río Maul
línRío Maullín
Río Ballenar
~N
c.
Maullín *
Maullín*
19
CHUYAQUEN
Misquihué
20
Maullín estuary all indicate that tides now inundate further onshore than they did before
1960 (Atwater et al., 1999). This is a result of the ~1.5 m of coseismic subsidence that
occurred in the area with the 1960 earthquake (Atwater et al., 1992). The lowering of the
land with respect to sea level also allowed the tsunami deposit to be quickly covered and
preserved by a newly forming soil (Atwater et al., 1992).
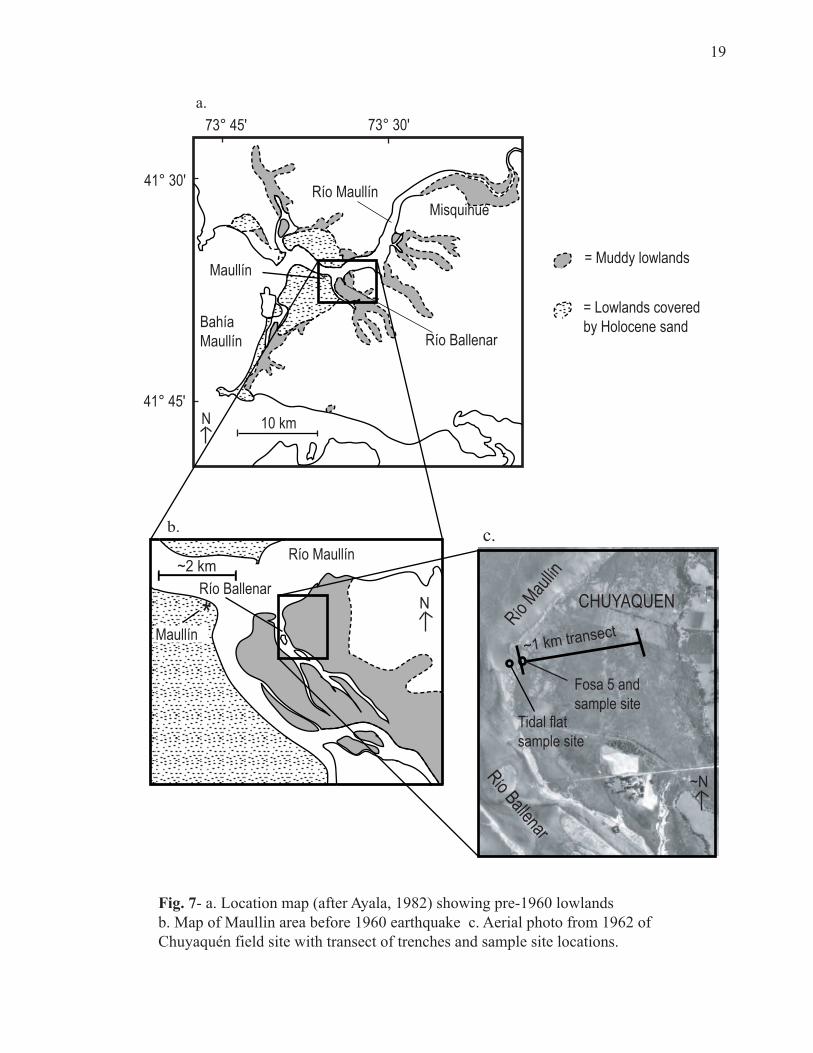
The primary field site is located in Chuyaquén, on Río Ballenar approximately 8 km
up from the tide-influenced Río Maullín estuary (Fig. 7b and c). The area of study
extends from sandy tidal flats on the edge of Río Ballenar to salt marsh pastures further
inland. The sandy intertidal zone along the shoreline is highly bioturbated by crabs and
other burrowers (Fig. 8).
Despite the great coseismic subsidence that can occur during these earthquakes,
several pieces of geologic evidence near Chuyaquén imply a net rise of land level:
preservation of probable Holocene-age paleo-shorelines (Atwater et al., 1992), rapid
erosion of the current shoreline, grading of soils from lowland tidal flat deposits to the
firmer soils of higher ground, and a correlation between the vertical positions of modern
and buried intertidal plants (Fig. 4a) (Atwater et al., 1992). Net uplift has been occurring
at this site over the past 1,000-2,000 years, periodically interrupted by abrupt land-
lowering and sand-depositing events such as the 1960 earthquake and tsunami (Fig. 4b)
(Atwater et al., 1992; Salgado et al., Fall 2003). Tide gages from Puerto Montt indicate
that the area has already risen measurably since the subsidence of 1960.
Crab
Fig. 8- a. Bioturbation in sand and exhumed 1960 rhizomes, and a crab, one of the burrowers. b. Rhizomes of buried 1960 soil exposed by tides and bioturbation.
a.
b.
Rio Ballenar
~12 cm
21
~12 cm
22
Methods
Field Methods
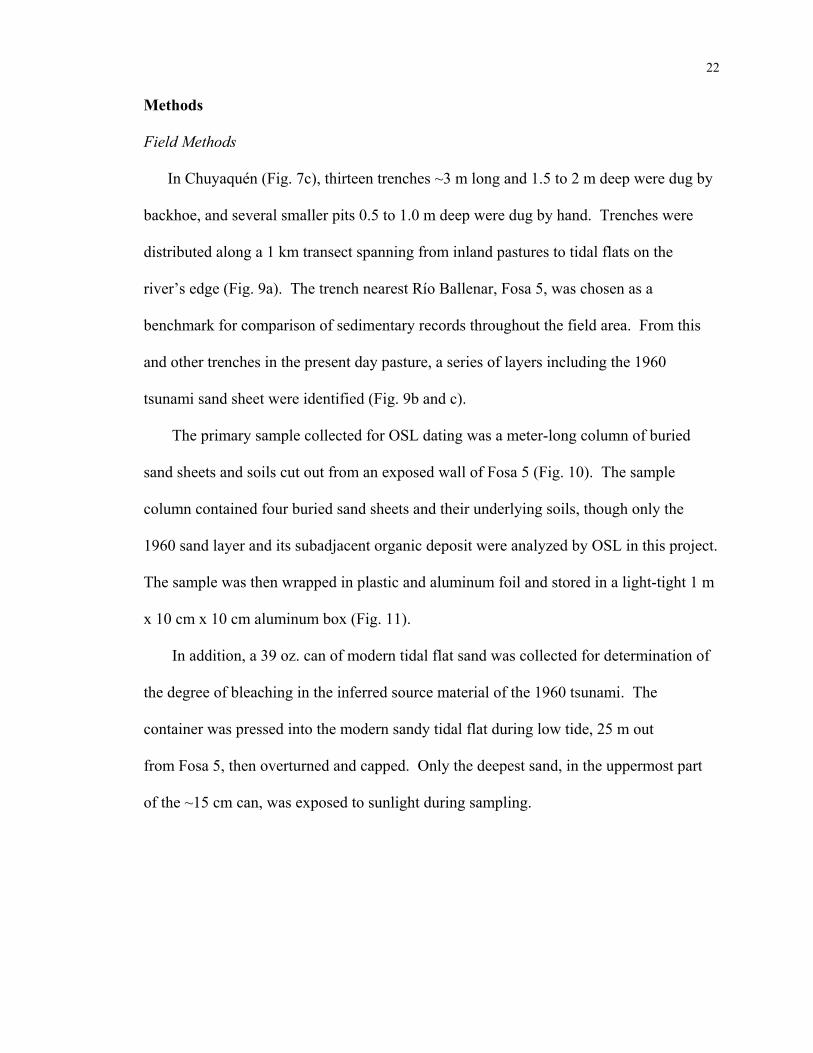
In Chuyaquén (Fig. 7c), thirteen trenches ~3 m long and 1.5 to 2 m deep were dug by
backhoe, and several smaller pits 0.5 to 1.0 m deep were dug by hand. Trenches were
distributed along a 1 km transect spanning from inland pastures to tidal flats on the
river’s edge (Fig. 9a). The trench nearest Río Ballenar, Fosa 5, was chosen as a
benchmark for comparison of sedimentary records throughout the field area. From this
and other trenches in the present day pasture, a series of layers including the 1960
tsunami sand sheet were identified (Fig. 9b and c).
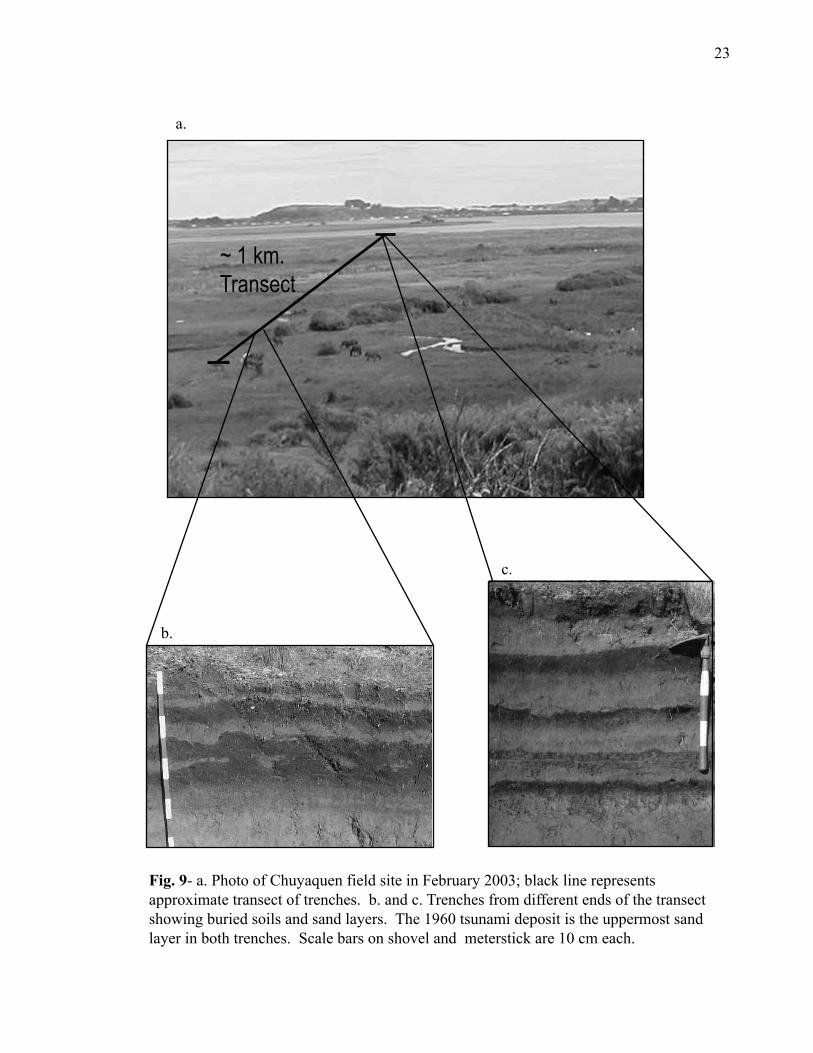
The primary sample collected for OSL dating was a meter-long column of buried
sand sheets and soils cut out from an exposed wall of Fosa 5 (Fig. 10). The sample
column contained four buried sand sheets and their underlying soils, though only the
1960 sand layer and its subadjacent organic deposit were analyzed by OSL in this project.
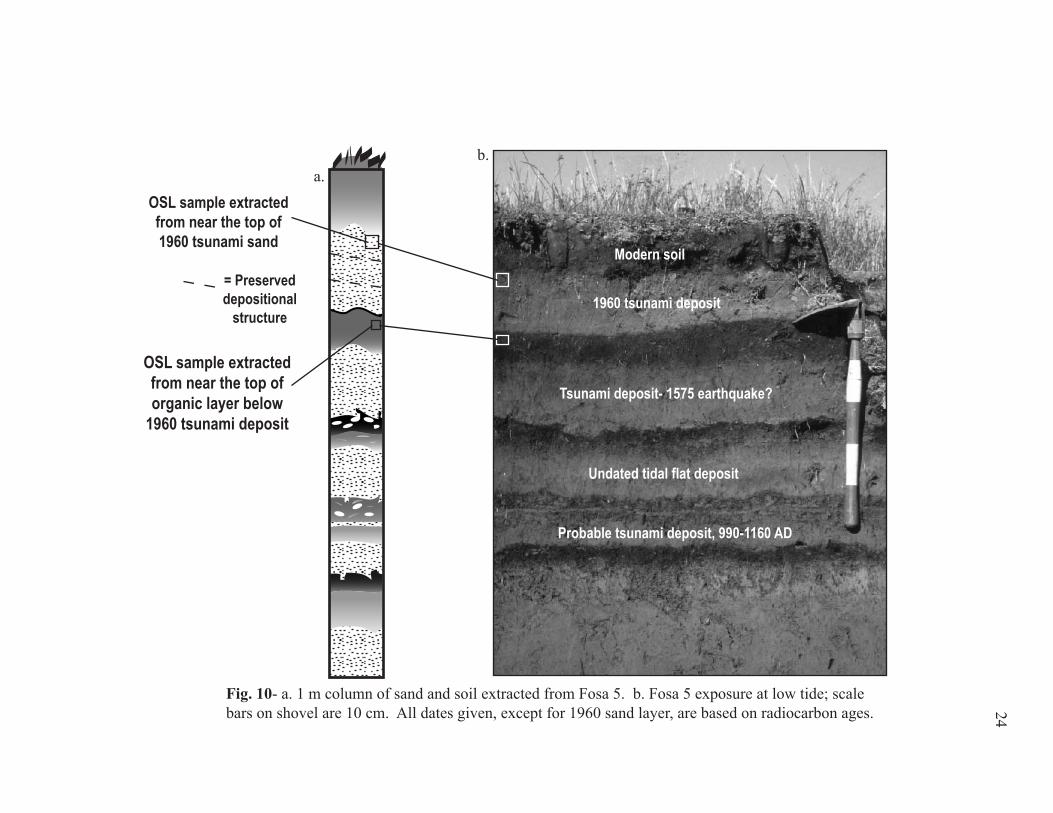
The sample was then wrapped in plastic and aluminum foil and stored in a light-tight 1 m
x 10 cm x 10 cm aluminum box (Fig. 11).
In addition, a 39 oz. can of modern tidal flat sand was collected for determination of
the degree of bleaching in the inferred source material of the 1960 tsunami. The
container was pressed into the modern sandy tidal flat during low tide, 25 m out
from Fosa 5, then overturned and capped. Only the deepest sand, in the uppermost part
of the ~15 cm can, was exposed to sunlight during sampling.
~ 1 km.Transect
Fig. 9- a. Photo of Chuyaquen field site in February 2003; black line representsapproximate transect of trenches. b. and c. Trenches from different ends of the transectshowing buried soils and sand layers. The 1960 tsunami deposit is the uppermost sandlayer in both trenches. Scale bars on shovel and meterstick are 10 cm each.
a.
b.
c.
23
OSL sample extractedfrom near the top of1960 tsunami sand
Fig. 10- a. 1 m column of sand and soil extracted from Fosa 5. b. Fosa 5 exposure at low tide; scalebars on shovel are 10 cm. All dates given, except for 1960 sand layer, are based on radiocarbon ages.
b.a.
OSL sample extractedfrom near the top oforganic layer below
1960 tsunami deposit
Modern soil
1960 tsunami deposit
Undated tidal flat deposit
Tsunami deposit- 1575 earthquake?
Probable tsunami deposit, 990-1160 AD
24
= Preserveddepositional
structure
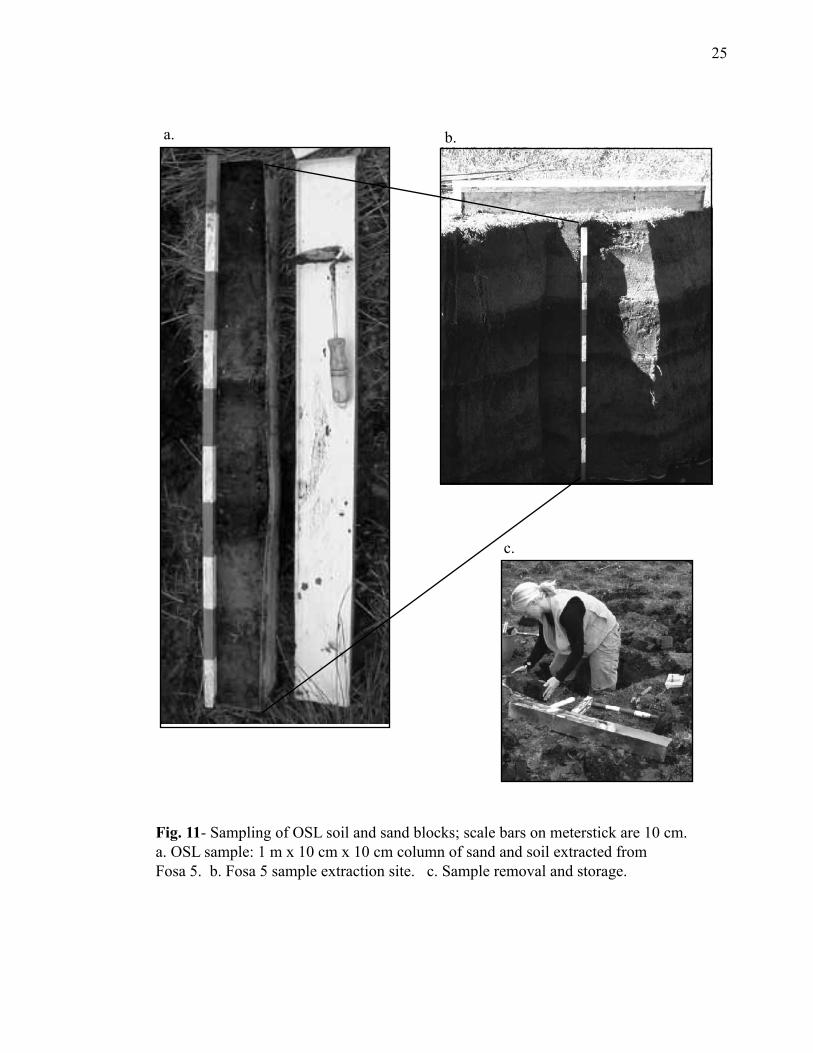
Fig. 11- Sampling of OSL soil and sand blocks; scale bars on meterstick are 10 cm.a. OSL sample: 1 m x 10 cm x 10 cm column of sand and soil extracted fromFosa 5. b. Fosa 5 sample extraction site. c. Sample removal and storage.
a. b.
c.
25
26
Laboratory Methods
Samples were analyzed at the luminescence laboratory of the University of Illinois,
Chicago, using the single aliquot regenerative (SAR) OSL method. In the single aliquot
method of paleodose determination, one single portion of grains is used for repeated
measurements (Aitken, 1998). Advantages of single aliquot analysis over multiple
aliquot techniques include a reduction of sample size (Duller, 1994) and elimination of
the need for normalization between different aliquots (Aitken, 1998). However, single
aliquot measurements must be corrected for changes that occur in the sample’s sensitivity
over the course of the procedure. The technique of Murray and Wintle (2000) was used
for sensitivity growth-curve corrections, a method that had proved successful for
Bannerjee et al (2001) and Forman and Pierson (2003).
In regenerative OSL, the natural luminescence signal of the quartz grains from built
up accumulation of radiation during burial, is first measured in the quartz grains. Next,
grains are repeatedly bleached and exposed to increasingly high doses of radiation until
the natural luminescence signal is matched. In this procedure, only interpolation between
laboratory doses is needed to find the date of deposition, rather than extrapolation out of
the experimental data range (Fig. 6) (Aitken, 1998).
Laboratory procedure followed that of Forman and Pierson (2003). Blue light (470
+/- 30 nm) was used to stimulate OSL dating on 100-150 µm quartz grains from the 1960
tsunami sand layer, ~0.5 to 2.5 cm below the layer’s upper contact (Fig. 10). Additional
quartz grains from ~1 to 2.4 cm below the top of the organic layer subadjacent to the
1960 tsunami sand were analyzed. Sand from ~12.5 to14.5 cm below the modern tidal
flat deposit was also extracted and analyzed. Twenty disks of sand from each sample
27
were analyzed, with ~2000 grains per disk. Achieving the highest possible signal-to-
noise ratio is especially important when dating young sediments (Stokes, 1992); as early
OSL signals are the most sensitive to light, only luminescence released during the first
0.8 s of light exposure was measured (Murray and Wintle, 2000).
After the natural luminescence signal of the quartz grains was recorded, the SAR
sequence of Murray and Wintle (2000) was applied multiple times with varying
luminescence test doses of radiation. Samples were exposed first to a fixed test dose—
used to monitor sensitivity changes throughout the procedure—then to the luminescence
test dose, which varied in intensity each time. This formula was repeated until samples
emitted a luminescence signal equal to the experimentally determined natural
luminescence signal. The amount of radiation needed to match the natural luminescence
signal was defined as the sample’s paleodose. The dose rate for each sample was
estimated by measuring its U and Th content through thick source alpha counting and
mass spectrometry, and 40K levels through the K2O content (Forman and Pierson, 2003).
Each individual paleodose measurement was divided by its respective dose rate in order
to determine the sample’s OSL age.
Results
Multiple sand sheets were apparent in most trenches; four of these were clearly
observed at Fosa 5 (Fig. 10). Eyewitness accounts and a distinctive soil make clear that
the uppermost sand sheet near Fosa 5 is the 1960 tsunami deposit (Atwater et al., 1992).
Radiocarbon dates from a related study provide a closely-limiting maximum date of 1410
AD to 1630 AD for the sand layer below the 1960 soil, making it a likely candidate for
28
deposition by the 1575 Chile earthquake (Atwater et al., Fall 2003). The lowest sand
layer was dated with radiocarbon methods at 990 AD to 1160 AD, and the second lowest
sand sheet remains undated but is stratigraphically constrained to ~1000 to 1500 AD
(Atwater et al., Fall 2003).
Each sand sheet is at least several cm thick. In all sand layers but the second lowest,
trench walls exposed faint lines running parallel to the plane of the deposit. Within the
1960 tsunami layer, three faint horizontal lines are seen. Each sand sheet was topped
with a layer that graded upwards from settled out silt and mud to organic-rich soil (Fig.
10).
In OSL analysis, grains from the top 3 cm of the 1960 tsunami deposit provided an
age of 40 +/- 15 yr BP. Quartz grains from near the top of the organic layer directly
under the 1960 tsunami deposit gave an age of 115 +/- 25 yr BP. Sand from ~12.5 to
14.5 cm under the surface of modern tidal flats ~25 m west of Fosa 5 were dated at 130
+/- 40 yr BP.
Discussion
Due to their preservation of structure and sharp erosional lower contacts, the sand
sheet below the 1960 deposit and the lowest sand sheet exposed in Fosa 5 are probably
tsunami deposits. Lower contacts of both are bioturbated at their lowest elevation, Fosa 5
(Fig. 9), indicating that these sections were not buried right away. However, throughout
most of the section, lower contacts of these layers resemble the sharp erosional lower
contact of the 1960 sand sheet. Grading within the buried soils likely represents
emergence between earthquake events. In this model, post-earthquake soils transition
29
from muddy tidal flat deposits in a co-seismically subsided low area to the peaty soil of
higher salt marshes as they raise relative to sea level (Fig. 4b) (Atwater et al., 1999;
Salgado et al., Fall 2003).
In the second lowest sand layer in Fosa 5, no structure was preserved and the lower
contact was diffuse and probably bioturbated but the overlying soil followed the same
pattern as the other three soils (Fig. 10). The transition from organic-rich soil below the
sand layer to muddy soil above implies that this sand layer, like the others, was deposited
during or after subsidence from an earthquake. However, the degree of reworking and
lack of preserved structure indicate that more time passed before burial of this layer than
the others. This sand was interpreted to have been deposited by tides on soil that had
recently subsided, probably as the result of an earthquake (Salgado et al., Fall 2003).
This sand sheet is another type of layer that could be dated by OSL to help determine
earthquake recurrence intervals.
The calculated OSL age for the 1960 tsunami sheet of 40 +/- 15 yr BP spans the
known date of the earthquake. The fact that the quartz grains did not provide a much
younger date indicates that in this area the luminescence signal of sediments is sensitive
enough to capture an age of only a few decades, and that laboratory techniques are
sophisticated enough to record them. Precision is high enough to indicate that dating of
young deposits can provide useful information, even in the decadal age range.
The result of an age that is not younger than expected indicates that the 1960 sand
sheet was buried within a few years of deposition, and not subsequently bleached again.
Sedimentary evidence for rapid burial includes the level of preservation of rhizomes in
30
the organic layer subadjacent to the 1960 tsunami layer (Burbank and Anderson, 2001),
as well as preservation of structure in the sand layer.
The three lines of structure in the 1960 sand may be the result of the sand layer’s
deposition by the three discrete waves of the tsunami (Bryant, 2001). Sand grains are too
homogenous for any sorting to be evident. Preservation of the sand’s structure is
significant because it indicates that the burrowers that are so prevalent in the field area
(Fig. 8) did not have enough time to colonize the tsunami sand deposit and destroy its
structure before the layer was covered. Preservation of structure therefore provides
further evidence that new soil must have begun to form almost immediately after
deposition.
The OSL date of the 1960 tsunami sand layer is not older than expected, which
indicates that sufficient bleaching of the sediments must have occurred prior to burial.
Since 1960 samples were extracted from the top part of the sand sheet, it not possible to
determine from this OSL age alone whether bleaching occurred in the source material
prior to the tsunami, during entrainment by the tsunami, or in the upper part of the layer
after deposition and before burial.
In addition, the age of 115 +/- 25 yr for quartz grains in the organic layer underlying
the 1960 tsunami deposit stratigraphically agrees with both the historical and OSL date of
the 1960 deposit. Though sand grains were extracted from the upper part of the
preserved organic layer, the 1960 tsunami would have scoured away the youngest of this
material, potentially creating a small stratigraphic unconformity. Though the accuracy of
this age can not be confirmed, it appears reasonable and thus further supports the
feasibility of using OSL to date recently deposited sand grains.
31
When evaluating implications for applying these results to the interpretation of other
tsunami deposits, it is important to consider the point at which the actual bleaching
occurred, as well as how long deposits were exposed to sunlight before burial. The 1960
tsunami occurred during the day, and other tsunamis that occurred at night might not
have had the same chance of being sufficiently bleached during deposition (Huntley and
Clague, 1996). However, if the inferred source material was well-bleached prior to the
event, or if all sand had sufficient exposure to sunlight after deposition but before burial,
all tsunami deposits in this area could be expected to be equally well-bleached regardless
of the time of day of the actual event.
“Modern” sediments collected from tidal flats dated at 130 +/- 40 yr clearly had not
been completely bleached. These sediments are the inferred source material of the 1960
Chile tsunami, as they would have been in the immediate path of the tsunami before it
inundated Chuyaquén. Grains of tidal flat sand and 1960 tsunami sand were identical in
size and degree of rounding, which supports this hypothesis. Because the OSL age is far
from zero, and is in fact greater than that of the tsunami sand, it can not be used to further
calibrate the age of the 1960 deposit as did Huntley and Clague (1996) with modern tidal
flat sediments.
The unexpectedly old OSL tidal flat age raises questions about the depth to which
bleaching occurred in source material, as well as about depositional mechanisms of the
1960 tsunami. Laboratory samples were extracted from >12 cm below the modern tidal
flat surface. The non-zero age indicates that littoral processes were not enough to
provide sufficient sunlight to bleach sediments at this depth, but does not preclude the
possibility that more surficial sand was adequately bleached.
32
Taken together, the well-bleached 1960 tsunami sand and the poorly-bleached
modern tidal deposit offer two plausible options. One possibility is that bleaching did
occur prior to deposition, that the tsunami’s low bottom shear strength prevented it from
digging into deep, poorly bleached sediments, and instead only scoured well-bleached
sand from the tidal flat surface. Alternatively, sand was bleached during deposition,
though Huntley and Clague (1996) considered the bleaching of sediments an unlikely
possibility due to the turbid and rapid depositional nature of tsunamis. Preservation of
depositional structure makes it unlikely that material was reworked—and therefore
bleached—after deposition. The older than expected tidal flat age indicates that mixing
by tides and burrowing animals was insufficient to allow sunlight penetration at depths
>12 cm.
Conclusion
The results of this study confirm the feasibility of using OSL to help determine
earthquake recurrence intervals. In south-central Chile, an area that has displayed great
co-seismic subsidence, tsunami deposits and sandy tidal deposits overlying organic-rich
soils are two indicators of the cyclical nature of active tectonism. In locations that
undergo large amounts of co-seismic subsidence, the dating of these two types of sand
layers may provide a reasonable indicator of the recurrence interval of large earthquakes.
Successful dating of the 1960 tsunami deposit in Chuyaquén demonstrates that young
sandy tsunami deposits can provide OSL dates that are both accurate and precise. The
precision of the age of 40 +/- 15 yr BP confirms that in this area, very young sediments
(<200 yr) can accumulate a measurable luminescence signal.
33
OSL dates indicate that while the 1960 tsunami deposit was well-bleached prior to
burial, the modern tidal flat source material is not well-bleached 12 cm below its surface.
Well-preserved depositional structure in the 1960 layer indicates that bleaching probably
occurred before or during, rather than after, deposition. It is more likely that surficial
(<12 cm deep) tidal flat sand was bleached before deposition than that bleaching occurred
during entrainment by tsunami. Further OSL analysis of tidal flat sand could resolve the
depth to which bleaching occurs, and might help determine the plausibility of pre-
depositional bleaching of tsunami sand sheets in this area.
The extent of pre- and post-depositional bleaching remains an important issue in
dating deposits of unknown age. If source material is not well-bleached, there is a risk
that tsunami sand deposited at night and buried rapidly might not receive adequate
sunlight exposure to reset luminescence clocks, thus providing OSL dates that are too
old. Sand sheets overlying preserved plant material or showing depositional structure
must have undergone rapid (<2 yr) burial, thus locking in the date of deposition and
making them good candidates for OSL dating.
34
Acknowledgements
This project was enabled through financial support from Carleton College’s Bernstein
Endowment and FONDECYT no. 1020224 of Chile. I gratefully acknowledge my
advisor, Sara Gran Mitchell, and unofficial mentors, Brian F. Atwater and Marco
Cisternas V., as well as other readers of my drafts in various states of legibility: Melissa
Keevil, Sarah Leibson, Lesanna Dobrahner, and Sue and Erich Eipert. Steve Forman at
the University of Illinois, Chicago, conducted OSL dating and cheerfully provided timely
responses to my numerous questions. I especially thank Maria Isolina Silva Vera for
allowing us to decimate her pastures, and all the other Maullinenses who shared their
bebidas, tsunami stories, marriage proposals, and diggable land.
35
References Cited
Aitken, M. J., 1998, An Introduction to Optical Dating: The Dating of Quaternary Sediments by the Use of Photon-Stimulated Luminescence: Oxford, Oxford University Press, 267 p.
Atwater, B. F., Cisternas, M., Salgado, I., Machuca, G., Lagos, M., Eipert, A., and Shishikura, M., Fall 2003, Incubation of Chile's 1960 Earthquake, in American Geophysical Union, San Francisco.
Atwater, B. F., and Moore, A. L., 1992, A Tsunami about 1000 years ago in Puget Sound, Washington: Science, v. 258, no. 1614-1623.
Atwater, B. F., Núnez, H. J., and Vita-Finzi, C., 1992, Net late Holocene emergence despite earthquake-induced submergence, south-central Chile: Quaternary International, v. 15/16, p. 77-85.
Atwater, B. F., V., M. C., Bourgeois, J., Dudley, W. C., II, J. W. H., and Stauffer, P. H., 1999, Surviving a tsunami- lessons from Chile, Hawaii, and Japan: Denver, U.S Department of the Interior and U.S. Geological Survey, 18 p.
Atwater, B. F., and Yamaguchi, D. K., 1991, Sudden, probably coseismic submergence of Holocene trees and grass in coastal Washington State: Geology, v. 19, p. 706-709.
Ayala, V., 1982, Estratigrafia de la boca occidental del Canal de Chacao, X Region, Chile: Proceedings III Congreso Geologico Chileno, p. A343-A376.
Banerjee, D., Murray, A. S., and Foster, I. D. L., 2001, Scilly Isles, U.K: optical dating of a possible tsunami deposit from the 1755 Lisbon earthquake: Quaternary Science Reviews, v. 20, no. 5-9, p. 715-718.
Barrientos, S. E., 1992, Postseismic coastal uplift in southern Chile: Geophysical Research Letters, v. 19, no. 7, p. 701-704.
Barrientos, S. E., and Ward, S. N., 1990, The 1960 Chile earthquake: inversion for slip distribution from surface deformation: Geophysics Journal International, v. 103, p. 589-598.
Bartsch-Winkler, S., and Schmoll, H., 1990, Stratigraphy of late Holocene intertidal deposits, Isla Grande de Chiloe region, southern Chile- evidence for relative sea level change., in 13th International Sedimentological Congress, Nottingham, England, p. 39-40.
Beck, S., Barrientos, S., Kausel, E., and Reyes, M., 1998, Source characteristics of historic earthquakes along the central Chile subduction zone: Journal of South American Earth Sciences, v. 11, no. 2, p. 115-129.
Bryant, E., 2001, Tsunami: the underrated hazard: Cambridge, University Press, 320 p. Burbank, D. W., and Anderson, R. S., 2001, Tectonic Geomorphology: Malden,
Blackwell Science. Clague, J. J., and Bobrowsky, P. T., 1994, Evidence for a large earthquake and tsunami
100-400 years ago on Western Vancouver Island, British Columbia: Quaternary Research, v. 41, p. 176-184.
Dawson, A. G., 1999, Linking tsunami deposits, submarine slides and offshore earthquakes: Quaternary International, v. 60, p. 119-126.
Dawson, A. G., and Shi, S., 2000, Tsunami deposits: Pure and applied geophysics, v. 157, p. 875-897.
36
Dudley, W. C., and Lee, M., 1998, Tsunami!, University of Hawaii Press, 362 p. Duller, G. A. T., 1994, Luminescence dating of sediments using single aliquots: new
procedures: Quaternary Geochronology (Quaternary Science Reviews), v. 13, p. 149-156.
Forman, S. L., and Pierson, J., 2003, Formation of linear and parabolic dunes on the eastern Snake River Plain, Idaho in the nineteenth century: Geomorphology, v. 1354, p. 1-12.
Gallardo, A., 1960, Photographs of 1960 Chile tsunami aftermath. Huntley, D. J., and Clague, J. F., 1996, Optical dating of tsunami-laid sands: Quaternary
Research, v. 46, p. 127-140. Huntley, D. J., Godfrey-Smith, D. I., and Thewalt, M. L. W., 1985, Optical dating of
sediments: Nature, v. 313, p. 105-107. Kanamori, H., and Cipar, J. J., 1974, Focal process of the great Chilean earthquake May
22, 1960: Physics of the Earth and Planetary Interiors, v. 9, p. 128-136. Lander, J. F., and Lockridge, P. A., 1989, United States tsunamis 1690-1988: National
Geophysical Data Center publication, v. 41-42. Lomnitz, C., 1970, Major earthquakes and tsunamis in Chile during the period 1535 to
1955: Geologische Rundschau, v. 59, p. 938-960. Morner, N.-A., 1999, Paleo-tsunamis in Sweden: Physics and Chemistry of the Earth, v.
24, no. 5, p. 443-448. Murray, A. S., and Wintle, A. G., 2000, Luminescence dating of quartz using an
improved single-aliquot regenerative-dose protocol: Radiation Measurements, v. 32, p. 57-73.
Nelson, A. R., Atwater, B. F., Bobrowsky, P. T., Bradley, L.-A., Clague, J. J., Carver, G. A., Darienzo, M. E., Grant, W. C., Krueger, H. W., Sparks, R., Stafford, T. W., and Stuiver, M., 1995, Radiocarbon evidence for extensive plate-boundary rupture about 300 year ago at the Cascadia subduction zone: Nature, v. 378, p. 371-374.
Olley, J., Caitcheon, G., and Murray, A., 1998, The distribution of apparent dose as determined by optically stimulated luminescence in small aliquots of fluvial quartz: implications for dating young sediments: Quaternary Geochronology, v. 17, p. 1033-1040.
Plafker, G., and Savage, J. C., 1970, Mechanism of the Chilean Earthquakes of May 21 and 22, 1960: Geological Society of America Bulletin, v. 81, p. 1001-1030.
Rendell, H. M., Webster, S. E., and Sheffer, N. L., 1994, Underwater bleaching of signals from sediment grains: new experimental data: Quaternary Geochronology (Quaternary Science Reviews), v. 13, p. 433-435.
Salgado, I., Eipert, A., Atwater, B., Shishikura, M., and Cisternas, M., 2003, Recurrence of giant earthquakes inferred from tsunami sand sheets and subsided soils in south-central Chile, in Geological Society of America, Seattle.
Stokes, S., 1992, Optical dating of young (modern) sediments using quartz: results from a selection of depositional environments: Quaternary Science Reviews, v. 11, p. 153-159.
Taylor, R. E., and Aitken, M. J., 1997, Luminescence dating, Chronometric dating in archaeology: Advances in archaeological and museum science: New York, Plenum Press, p. 183-216.


