
OPTIMIZATION OF SDD-AGE AS A METHOD TO STUDY AMYLOID
CONVERSION OF HUMAN RECOMBINANT PRION PROTEIN
by
James C. Campbell, B.S.
A thesis submitted to the Graduate Council of Texas State University in partial fulfillment
of the requirements for the degree of Master of Science
with a Major in Biochemistry August 2014
Committee Members:
Steve Whitten, Chair
Rachell Booth
Walter Rudzinski

COPYRIGHT
by
James Christopher Campbell
2014

FAIR USE AND AUTHOR'S PERMISSION STATEMENT
Fair Use
This work is protected by the Copyright Laws of the United States (Public Law 94-553, section 107). Consistent with fair use as defined in the Copyright Laws, brief quotations from this material are allowed with proper acknowledgement. Use of this material for financial gain without the author's express written permission is not allowed.
Duplication Permission
As the copyright holder of this work I, James Campbell, authorize duplication of this work, in whole or in part, for educational or scholarly purposes only.

DEDICATION
TO MY MOTHER AND FATHER

v
ACKNOWLEDGEMENTS
I would like to thank Dr. Steve Whitten for his guidance in the completion of this
work and the training he offered during my time in his lab. I am deeply indebted to him
for fostering a passion for quantitative biology in me that I will carry throughout my
scientific career. Additionally, I would like to thank my committee members Dr. Walter
Rudzinski and Dr. Rachell Booth, for their advice on this thesis project and their
continued support during my doctoral studies. I also want to thank my fellow student
Reagan Meredith, I would not have been able to complete this work without his help.
Finally, I would like to thank my friends and family for their continuous support.
vi
TABLE OF CONTENTS
Page
ACKNOWLEDGMENTS ...................................................................................................v
LIST OF TABLES ........................................................................................................... viii
LIST OF FIGURES ........................................................................................................... ix
ABSTRACT .........................................................................................................................x
CHAPTER
I. INTRODUCTION .............................................................................................1
I.1 Amyloid ............................................................................................1 I.2 Prion Protein .....................................................................................3 I.3 Current Methods of Amyloid Detection ...........................................4 I.4 Semi Detergent Denaturing Agarose Gel Electrophoresis ...............6 I.5 Project Goals ....................................................................................6
II. MATERIALS AND METHODS ......................................................................7
II.1 Materials .........................................................................................7 II.2 Cloning, Over-Expression and Purification of Recombinant
hPrP ................................................................................................7 II.2.1 Cloning and Heat Shock Transformation
of E.coli ....................................................................7 II.2.2 hPrP Glycerol Stocks for Long Term -80 °C
Storage .....................................................................9 II.2.3 Over-Expression of Recombinant hPrP Into
Bacterial Inclusion Bodies .......................................9 II.2.4 Purification of Recombinant hPrP from
Bacterial Inclusion Bodies .....................................10 II.3 Seeded Amyloid Samples From Peptide Induced Amyloid
Conversions ..................................................................................12

vii
II.4 Semi Detergent Denaturing-Agarose Gel Electrophoresis ...........13 II.5 Western Blot Analysis ...................................................................14
III. RESULTS AND DISCUSSION ......................................................................16
III.1 SDD-AGE Voltage Optimization ................................................16 III.2 SDD-AGE Electrophoretic Buffer Optimization .........................20 III.3 SDD-AGE Agarose Concentration Optimization .......................23 III.4 SDD-AGE Buffer Incubation Time Optimization .......................26 III.5 SDD-AGE Gel Thickness Optimization ......................................28 III.6 Conclusions ..................................................................................28
REFERENCES ..................................................................................................................32

viii
LIST OF TABLES
Table Page
1. Human amyloid disease. ..................................................................................................2
2. Agarose gel thickness estimates.....................................................................................30

ix
LIST OF FIGURES
Figure Page
2.1 Consensus amino acid sequence of full length hPrP .....................................................8 3.1.1 SDD-AGE of peptide induced amyloid conversion ..................................................18 3.1.2 SDD-AGE performed at 12 V/cm for 2 hours at 4 °C ..............................................18 3.1.3 SDD-AGE performed at 24 V/cm for 1 hours at 4 °C ..............................................19 3.1.4 SDD-AGE performed at 30 V/cm for 30 minutes at 4 °C ........................................19 3.2.1 SDD-AGE performed at 12 V/cm for 2 hours at 4 °C in the TGS buffer system ....21 3.2.2 SDD-AGE performed at 12 V/cm for 2 hours at 4 °C in the TBE buffer system ....22 3.3.1 SDD-AGE performed at 12 V/cm for 2 hours at 4 °C with a 0.8% agarose gel ......24 3.3.2 SDD-AGE performed at 12 V/cm for 2 hours at 4 °C with a 2.8% agarose gel ......25 3.3.3 SDD-AGE performed at 12 V/cm for 2 hours at 4 °C with a 3.8% agarose gel ......26 3.4.1 SDD-AGE performed at 12 V/cm for 2 hours at 4 °C, SDD-AGE buffer
incubation time optimization .................................................................................27 3.5.1 SDD-AGE performed on a peptide induced amyloid conversion at 12 V/cm
for 2 hours at 4 °C in with a 0.4 cm gel .................................................................31

x
ABSTRACT
Many common diseases are caused by amyloid proteins1. Amyloid structures are β sheet
rich, protease resistant, and can form polydisperse insoluble fibers2. Due to these
properties, biochemical/biophysical studies of amyloid have been hampered. One
technique that is able to study amyloid is Semi Detergent Denaturing-Agarose Gel
Electrophoresis (SDD-AGE)3. The work presented here shows the optimization of several
parameters such as gel thickness, electrophoretic conditions, and capillary transfer
method. Through this optimization of SDD-AGE we show that it can be used to 1) study
a recombinant human amyloid system and 2) achieve a higher resolution than has been
previously reported.

1
CHAPTER I
Introduction
I.1 Amyloid
The intracellular environment presents proteins with many possible binding
partners (ligands), which can include peptides, lipids, nucleic acids, charged ions, and
other proteins. The ability to faithfully recognize the correct ligand is critical to a
protein’s proper cellular function. To recognize ligands a protein needs to adopt the
correct 3-dimensional structure, or the “native” state. Many common diseases are the
consequence of improper ligand recognition, such as in cancer where due to aberrant
signaling caused by a mutated protein, normal cell proliferation is affected. Other
diseases that result from a protein binding to an abnormal ligand are the amyloid diseases
(Table 1).

2
Table 1. Human amyloid disease. Table of common human amyloid diseases
and the proteins that form the amyloid1.
Amyloid diseases are caused by the conversion of a protein from the native state
to an amyloid state4. The propagation of amyloid disease is caused by the binding of
native protein to one in the amyloid state5. The amyloid state of a protein is characterized
as being β sheet rich, protease resistance, and able form large insoluble amyloid fibrils5.
In humans, almost 25 amyloid forming proteins have been identified to date and due to
broad tissue distribution and lack of sequence homology it is thought that these
polypeptide sequences have intrinsic amyloid forming propensities1. Interestingly, the
presence of amyloid proteins is not always associated with a disease and can even have a
beneficial role in a cell, or organism. For example, in melanin producing cells there is a
pH dependent conversion of the amyloid forming fragments of Pmel17 into soluble
particles which are able to promote eumelanin formation6. Other beneficial uses include

3
the mounting of cellular immune response to a viral infection. For example, a Sendai
virus specific immune response pathway is triggered by the formation of amyloid on the
surface of the cytosolic mitochondrial membrane.7 Another beneficial use of amyloid is
found in yeast where it plays a role in the non-DNA based transmission of heritable traits.
In yeast, the inheritance of phenotypic traits without changing the DNA is achieved
through the sequestration of translation factors such as Sup53 into amyloid structures4.
I.2 Prion Protein
The prion protein (PrP) is thought to be the causative agent of amyloid diseases
such as the transmissible encephalopathies (TSEs), which effect many mammalian
species1-2, 5. However, it is only after the conversion of the cellular (PrPc) or native state
into the amyloid state (PrPsc) that PrP can act as an infection agent5, 8. This model of
conversion is termed the “protein only hypothesis” which was pioneered by Stanley B.
Prusiner, and lead to him being awarded the 1997 Nobel Prize in Physiology or Medicine.
In the protein only hypothesis, the conversion of PrPc to PrPsc is achieved solely by a self-
replicating mechanism, where one PrPsc acts as a template that converts PrPc molecules8.
Evidence in support of this hypothesis are that common techniques known to degrade
nucleic acids failed to neutralize TSE infectivity, and that PrPc knockout mice are
immune to infectivity5, 8.
The human variant of the prion protein (hPrP) has been shown to be converted
into an amyloid state both in vitro and vivo. Currently our lab is focused on understanding
the protein-ligand interactions that drive the amyloid conversion of PrPc. To gain insight
into the amyloid conversion of PrP we developed an in vitro system where ligands are
mixed with recombinantly purified (rPrPc) in a conversion buffer and with mild agitation

4
are able to produce rPrPsc. The ligands are synthetic cyclic-peptides, whose sequences are
either derived from naturally occurring neuropeptides or have been designed based on
computational predictions of functional binding sites on the surface of PrPc. Prior to the
work presented here, we had three primary assays at our disposal to validate the presence
of rPrPsc. These were the Protease K, the Thioflavin-T and the turbidity assays.
I.3 Current Methods of Amyloid Detection
The first assay, the Proteinase K (PK) assay is a classical standard for the
detection PrPsc2. In this assay PrPc is readily digested by PK, but PrPsc is resistant to
digestion and the product is the β sheet rich core of the amyloid particles2. PK resistant
products are then typically resolved with sodium dodecyl sulfate polyacrylamide gel
electrophoresis (SDS-PAGE) followed by western blotting where an amyloid specific
antibody recognizes the PK resistance core. PK is able to function in a large variety of
buffer conditions including those that contain detergents and chaotropic agents such as
urea or guanidinium HCl. This broad compatibility allows it to digest PrPsc samples from
both in vitro and vivo system. A limitation of the PK assay is that PK is a non-specific
serine protease, PK can generate a collection of digestion products of difference
molecular weights if the digestion reaction experiences experimental variability. For
example, in our hands small errors in PK or PrPSc concentration can lead to the formation
of abnormal digestion patterns2. These alternative patterns add to the difficulty of
interpreting the effect that a novel ligand may have had on the size or rate of formation of
the amyloid core.
5
The second assay available was the Thioflavin-T (ThT) assay. ThT is a small
fluorescent molecule that binds to the β sheet rich core of amyloid particles9. Upon
intercalating into the β sheet rich environment, ThT experiences a red shift in its
excitation (385 nm to 450 nm) and emission (445 nm to 482 nm) maxima9. A typical ThT
assay involves suspending a PrPsc sample into a buffer containing 10 µM ThT solution,
prior to performing fluorescence intensity measurements. In our lab we find that a major
limitation of the ThT assay is inconsistent intensity measurements, even when repeating a
florescence scan with the same sample. This inconsistency could be attributed to the
insolubility of amyloid samples. Upon settling in the cuvette, amyloid will not interact
with the light beam and therefore, while present in the sample, this fraction of the PrPsc
sample is not contributing fluorescent signal.
The final available assay was the turbidity assay. Turbidity, is the result of the
scattering of light by large particles in solution. As monomeric PrPc undergoes the
conversion to PrPsc it forms polydisperse amyloid particles causing the turbidity of the
sample to increase, which is observed by measuring the absorbance at 400 nm. A major
drawback of this method however, is that it isn’t amyloid specific and detects the
formation of amorphous aggregates as well. The tendency of rPrPc to spontaneously form
amorphous aggregates is a concern due to the protein’s poor stability. The predicted
instability index (II) of our rPrPc construct is computed to be 45.39, and an II >40
predicts that the protein may be unstable10. The II is a statistical metric of a protein’s
stability based on the known dipeptide sequences of stable and instable proteins and the
measured half-lives of these proteins. The amino acid sequence of a protein can therefore
be used predict stability based on the presence of destabilizing dipeptides.

6
I.4 Semi Detergent Denaturing-Agarose Gel Electrophoresis
Semi Detergent Denaturing-Agarose Gel Electrophoresis (SDD-AGE) is a
method of amyloid detection predominantly used for yeast prions. Yeast prions, while
named after the PrP share little sequence homology, but have been termed prions due to
their ability to self-replicate and form amyloid fibrils11. Yeast prions have been studied
for their physiological roles and as analogs to gain insight into amyloid conversion5, 12.
SDD-AGE is typically performed on cell lysate from yeast strains that have had amyloid
formation induced. Amyloid samples are then incubated with 2% Sodium Dodecyl
Sulfate (SDS), this concentration of detergent is sufficient to dissolve amorphous
aggregates and protein complexes. Amyloid particles however, are resistant to
denaturation by 2% SDS3. SDS resistance is thought to be a result of the β sheet rich
core. After incubation, the sample is ran on an agarose gel which due to its large pore size
allows separation, but not resolution, of different molecular weight amyloid particles.
After separation, western blotting allows for the detection of proteins present in the SDS
resistant amyloid particles, which appear as smearing on the blot.
I.5 Project Goals
Upon a review of the literature we realized that there was room for improvement
in the currently accepted SDD-AGE experimental design. We believed that through
optimization we could achieve better separation and the ability to partially resolve SDS
resistant amyloid particles. Our optimization involved modifying the percent agarose in
the gel and the type of electrophoretic buffer, as well as changing the voltage, runtime,
gel thickness and temperature. We also sought to, for the first time, show that SDD-AGE
can be used to detect hPrPsc derived from a recombinant system.

7
CHAPTER II
Materials and Methods
II.1 Materials
All chemicals and reagents used for this project were Molecular Biology grade or
higher. Synthetic peptide, 98% pure, was purchased from GenScript (Piscataway, NJ) and
Peptide 2.0 (Chantilly, VA). Precision Plus Protein™ All Blue Standard was obtained
from BioRad Laboratories (Hercules, CA.) Water used in sample preparation was filtered
and deionized by a Millipore Milli-Q purification unit (Billerica, MA). To ensure
sterility, all glassware, pipette tips, and micro-centrifuge tubes were autoclaved in a
HICLAVE HV-50 autoclave vessel (Hirayama, Westbury, NY).
II.2 Cloning, Over-Expression, and Purification of Recombinant hPrP
II.2.1 Cloning and Heat Shock Transformation of E.coli
A high expression hPrP plasmid was created using DNA2.0’s design services
(Menlo Park, California). The pJexpress plasmid was selected for the insertion of the
hPrP sequence. The pJexpress plasmid contains a Lac inducible T5 promoter upstream of
the insertion site. pJexpress also has a high copy origin of replication. pJexpress allows
for the positive selection of bacteria containing the plasmid through the expression of
beta lactamase, which cleaves the beta lactam moiety of ampicillin. The pJexpress had
the consensus hPrP amino acid sequence for residues 23-230 inserted into it, the DNA
sequence was codon optimized for bacterial expression. In mammalian cells, residues 1-
22 are responsible for PrP’s sorting and trafficking, and residues 231-246 are removed
during protein maturation13. These sorting and maturation sequences were therefore

8
removed for bacterial expression. Figure 2.1 shows the amino acid sequence used in our
studies, and represents the consensus wild type hPrP sequence. Lyophilized pJexpress,
with hPrP inserted, DNA was solubilized in DNA grade sterile water to a concentration
of 1 ng/µL and stored in sterile cryovial tubes at -80 °C.
1 MANLGCWMLV LFVATWSDLG LCKKRPKPGG WNTGGSRYPG QGSPGGNRYP PQGGGGWGQP
61 HGGGWGQPHG GGWGQPHGGG WGQPHGGGWG QGGGTHSQWN KPSKPKTNMK HMAGAAAAGA
121 VVGGLGGYVL GSAMSRPIIH FGSDYEDRYY RENMHRYPNQ VYYRPMDEYS NQNNFVHDCV
181 NITIKQHTVT TTTKGENFTE TDVKMMERVV EQMCITQYER ESQAYYKRGS SMVLFSSPPV
241 ILLISFLIFL IVG
Figure 2.1. Consensus amino acid sequence of full length hPrP. Residues 1-22 are a
signaling motif that are needed for protein trafficking, and residues 231-246 are removed
during protein maturation. The sorting and maturation sequences have been removed and
the studies presented here have been performed with residues 23-230.
Heat shock transformations of BL21 (DE3) pLysS competent cells by Novagen
(Darmstadt, Germany) were performed by adding of plasmid stock to 50 µL of competent
cells. The mixture was incubated on ice for 5 minutes, then heat shocked in a heat bath
(42°C) for 30 seconds, and then on ice again for 2 minutes. Next, 250 µL of Room
Temperature (RT) Super Optimal Broth with Catabolite repression (SOC) was added. At
this point, 150 µL of the cell culture was then transferred to Lysogeny Broth (LB) agar
plates containing 100 µg/mL of ampicillin and 15 mg/mL agar. The plates were
incubated overnight at 37°C.

9
II.2.2 hPrP Glycerol Cell Stocks For long Term -80°C Storage.
An Erlenmeyer flask containing 200 mL of 100 µg/mL ampicillin and LB was
aseptically inoculated with a single colony of E. coli cells transformed with the pJexpress
hPrP plasmid. The 200 mL cell culture was incubated overnight in a rotary incubator
(Max*Q, MIDSCI, St. Louis, MO) at 30°C with orbital rotation. 5 mL of the overnight
cell culture was transferred to 200 mL of 100 µg/mL ampicillin and LB and incubated
with orbital rotation at 37°C to an Optical Density at 600 nm (OD600) of 0.6. Glycerol
stocks were created by mixing 800 µL of cell culture with sterile 80% glycerol to a final
concentration of 16%, glycerol stocks were stored in sterile cryovial tubes at -80°C.
II.2.3 Over-Expression of Recombinant hPrP Into Bacterial Inclusion Bodies
To initiate bacterial growth an aseptic dab of E. coli from a glycerol stock was
spread onto an LB agar plate containing 100 µg/mL of ampicillin. The plate was then
incubated at 37°C overnight. The next day a single colony grown on the agar plate was
used to inoculate 10 mL of sterile 100 µg/mL ampicillin and LB. The inoculated sample
was incubated with orbital rotation at 37°C until visibly turbid (~ 3-4 hours). Then, a
hundred fold dilution of the inoculated sample was performed into each of 4 flasks
containing 250 mL of sterile 100 µg/mL of ampicillin and LB. The 4 flasks were
incubated with orbital rotation at 37°C until an OD600 of 0.6 was measured. At this point
isopropyl β-D-1thiogalactopyranoside (IPTG) was added to a concentration of 0.5 mM to
induce hPrP expression. IPTG is a lactose analog and allows transcription to occur at the
T5 promoter, which is lactose inducible. The cell cultures were incubated for an
additional 4 hours at 37°C with orbital rotation, cell pellets were formed by

10
centrifugation at 7,000 RPM, 4°C, for 20 minutes, using a Beckman J2-21 centrifuge
with a JA-14 rotor. The supernatant was decanted and cell pellets were stored at -20°C.
II.2.4 Purification of Recombinant hPrP From Bacterial Inclusion Bodies
Cell pellets containing hPrP were thawed and suspended in 20 mL of lysis buffer
(10 mM Tris-HCl, 2 mM EDTA, 100 mM NaCl, pH 7.5), lysozyme was added to a final
concentration of 100 µg/mL. The suspension was then incubated for 30 minutes at 37°C
to allow lysozyme to degrade the peptidoglycans of the bacterial cell wall, which hinder
cell lysis. The cell suspension was then sonicated using a Bronson Sonifier S-450A
(Danbury, CT). The sonication procedure consisted of three, one minute pulses separated
by one minute rest periods, all while on ice. The sonifier’s power settings were set to a
duty cycle of 80% and half-maximum output (control set to 5).
After sonication, TritonX-100 was added to a final concentration of 1% and the
sample was centrifuged at 25,000xg, 4°C, for 45 minutes. Under these expression
conditions hPrP is localized to insoluble inclusions bodies by E.coli. Following
centrifugation of the cell lysate, the supernatant was discarded. The insoluble pellet of
cellular fragments and protein was dissolved in 10 mL of resuspension buffer (8 M urea,
20 mM Tris-HCl, 100 mM NaCl , pH 8.0) and incubated overnight at 4°C. The following
morning, the protein solution was cleared of urea insoluble biomolecules by centrifuging
at 10,000xg, 4°C, for 20 minutes.
The supernatant was loaded onto a column containing DE52 media (GE
healthcare, New Orleans, LA), DE52 is an anion exchange resin and is used to remove
nucleic acids from the sample. The DE52 media was first hydrated with a 20 mM Tris-
HCl, 100 mM NaCl solution at pH of 3.5 and degassed for 20 minutes with constant

11
stirring. The media was then equilibrated with 20 mL of equilibration buffer (8 M urea,
20 mM Tris-HCl, 100 mM NaCl, pH 8.0). The protein sample was loaded onto the DE52
column and washed with 20 mL of equilibration buffer, the flow through fraction was
collected.
Next, the flow through fraction was loaded onto a nickel (II)-nitriloacetate (Ni-
NTA) agarose column for purification by Immobilized Metal Affinity Chromatography
(IMAC). In both the native and urea denatured state, hPrP has a natural affinity for Ni-
NTA agarose resin and doesn't require the commonly used 6x-Histidine tag for
recombinant protein purification. IMAC purification of hPrP was performed using a
BioLogic LP system from BioRad Laboratories (Hercules, CA). A packed Ni-NTA resin
column was rinsed with 30 mL of dH2O to wash out the storage solution (20% ethanol).
The column was equilibrated with 30 mL equilibration buffer (8 M urea, 20 mM Tris-
HCl, 100 mM NaCl, pH 8.0), after which the hPrP protein sample was carefully loaded
onto the column. The column was then washed with 30 mL of the following three
buffers, wash buffer A (20 mM Tris-HCl, 100 mM NaCl, 8 M urea, pH 8.0), wash buffer
B (20 mM Tris-HCl, 100 mM NaCl, pH 8.0), and wash buffer C (20 mM Na2 HPO4, 100
mM NaCl, pH 8.0). After the column wash steps, hPrP was eluted using a combination of
low solution pH and imidazole. The elution buffer consisted of 20 mM Na2HPO4, 100
mM NaCl, 500 mM imidazole, pH 4.5.
Sample from the eluted protein peak was consecutively dialyzed against 4 L each
of pre-chilled dialysis buffer A (10 mM Na2HPO4, pH 5.8) and dialysis buffer B (5 mM
Tris-HCl, pH 8.5) at 4°C for 12 hours (buffer A) and then a minimum of 4 hours (buffer
B). The protein was then filtered through a 0.22 micron filter to remove pre-formed

12
aggregates. hPrP purified in this manner has been previously shown to be 99% pure by
silver staining 14. Furthermore, biophysical studies using circular dichroism spectroscopy
to determine the secondary structure and thermal unfolding characteristics have shown
that hPrP has been properly refolded on the column during this purification15.
II.3 Seeded Amyloid Samples from Peptide Induced Amyloid Conversions
Synthetic peptides were mixed with freshly purified and filtered recombinant
hPrP. The total reaction volume was 100 μL. Each reaction contained 1 mM cyclic
CGGKFAKFGGC (cystine-glycine-gylcine-lysine-phenylalanine-alanine-lysine-
phenylalanine-glycine-gylcine-cystine) peptide and 4.3 μM hPrP in Quic buffer (138 mM
NaCl, 2.7 mM KCl, 0.1 % SDS, 0.1 % TritonX-100, pH 7.0). Samples were incubated in
a 37 °C thermomixer set at 1500 rpm with one minute agitation and one minute rest
cycles. Samples were removed after 24 hours for the formation of seed stocks or frozen at
intervals for time course experiments. To create seed stocks the insoluble portion of
amyloid samples was pelleted by centrifugation at 16,000xg, RT, using a Beckman
Coulter Benchtop Microfuge (Fullerton, California). After centrifugation, the supernatant
was decanted and the fibrils were suspended in 100 µL of molecular biology grade sterile
Phosphate Buffered Saline (PBS, 138 mM NaCl, 2.7 mM KCl, pH 7.4). Next, the
suspended fibrils were gently sonicated using a Bronson Sonifier S-450A (Danbury, CT)
to create a homogenous amyloid sample. The sonifier was set to a duty cycle of 20% and
an output control of 1. Sonication was performed in three, one minute pulses separated by
one minute rest periods, all while on ice. Without this step the polydisperse amyloid in
the sample cannot be accurately dispensed due the challenge of aliquoting small volumes
(10 µL) of the insoluble sample. The insoluble fraction contains fibrils of different

13
molecular weights which, when dispensed at a fixed volume prevents the accurate
addition of amyloid protein. The inability to precisely add fixed amounts of amyloid
greatly affects experimental reproducibility. Now a homogenous amyloid solution, 10 µL
of this sample was added to a solution of freshly purified and filtered hPrP to make a 100
µL sample of 4.3 µM hPrP, 1X PBS, 0.1% SDS, 0.1% TritonX-100. The sample of fresh
hPrP and amyloid seed was then incubated for up to 72 hours at 37°C in an Eppendorf
Thermomixer R (Hauppauge, NY) with one minute pulses of agitation separated by one
minute periods of rest. Agitation consisted of rapid shaking of the sample at 1500 RPM.
Samples were frozen for up to a month prior to SDD-AGE analysis.
II.4 Semi Denaturing Detergent-Agarose Gel Electrophoresis
SDD-AGE gels were cast in a 10 cm x 15 cm casting tray with an 18 well comb.
1.8 % agarose gels were made by melting 2.16 g of agarose in 120 mL of TAE (10 mM
Tris-HCl, 5 mM acetic acid, 5 mM EDTA). The agarose slurry was heated for a total of
three minutes in 30 seconds intervals with gentle swirling at each interval. The liquid
agarose was cooled for several minutes. Slowly 120 μL of 10 % SDS was added to avoid
localized solidifying. Care was taken to avoid the formation of air bubbles during casting
and any formed were removed prior to setting the comb. The gel was left to cool for at
least an hour at RT. Protein samples were mixed with 4X SDD-AGE loading buffer (2 X
TAE, 20 % glycerol, 8 % SDS, 1 % Bromophenol blue) in a 4:1 ratio and incubated at
room temperature for 7 minutes, 24 μL of sample was loaded into every other well of the
gel. The gel was placed in a Bio-Rad Sub Cell GT (Hercules, CA) with pre-chilled TAE
running buffer containing 0.1 % SDS. Electrophoresis was performed for 2 hours at 12
V/cm at 4 °C. Protein was transferred from the gel to a nitrocellulose membrane for

14
western blot analysis using capillary action. This method as originally described,
involved the agarose gel being placed on top of nitrocellulose, with fiber pads directly on
top and below the membrane:gel stack3. However, we find that this method only works
when performed using thick, large area, 20 cm x 24 cm gels which are heavy enough to
displace trapped air bubbles at the membrane:gel interface. The protocol as described,
suggests making the gel as thick as possible to maximize detection3. With our thin, small
area, 10 cm x 15 cm gels we found it necessary to apply the nitrocellulose to the gel in
order to avoid bubbles. This method allows for proper contact and prevents dead spots on
the blots. Additional pads were placed on top of the nitrocellulose in order to assist with
capillary action of the transfer buffer. The top of the entire stack had a 1 kg weight to
promote both membrane:gel contact and capillary transfer. Transfer trays were filled with
Tris Buffer Saline (TBS, 20 mM Tris, 0.1 M NaCl, pH 7.5) and were placed on either
side of the transfer stack. Transfer trays contained wicks allowing for transfer buffer to
flow and produce capillary action. Capillary transfer proceeded for 12-16 hrs. Following
the transfer onto the nitrocellulose membrane, western blot analysis was performed.
During optimization some of these conditions were modified and this will be described in
the Results sections. All optimization trials were performed at least in duplicate.
II.5 Western Blot Analysis
The nitrocellulose membrane was removed from the transfer stack and incubated
for 1 hour with constant shaking in a solution of 5 % dry milk in a Tris-Tween Buffer
Saline (T-TBS, 20 mM Tris, 0.1 M NaCl, 0.1 % Tween-20, pH 7.5). Next, the membrane
was washed several times with T-TBS and soaked for 1 hr in a solution containing dry
milk, T-TBS and primary antibody. The primary antibody used was 3F4 antibody
15
(Covance, Princeton, NJ) which recognizes residues 109-112 of hPrP as an epitope. The
3F4 stock was diluted to a 1:100,000 working concentration. After 3F4 incubation, the
nitrocellulose membrane was then washed several times with T-TBS and placed in a
secondary antibody that consisted of anti-mouse IgG conjugated to horseradish
peroxidase (GE Healthcare, Piscataway, NJ) diluted to 1:40,000 in T-TBS and dry milk
for one hour. The nitrocellulose was then washed multiple times. To image the
membrane, a chemiluminsence solution was applied to the nitrocellulose for 5 minutes
while incubating in the dark. The ECL chemiluminescence kit was purchased from GE
Healthcare. After the incubation period, the membrane was imaged using a
FOTO/Analyst FX imager from Fotodyne (Hartland, WI).

16
CHAPTER III
Results and Discussion
III.1 SDD-AGE Voltage Optimization
The optimization of SDD-AGE of recombinant PrPsc involved changing the
electrophoretic conditions. The original protocol calls for a voltage ≤ 3 V/cm of gel
length and a continuation of the run until the dye front is 1 cm from the bottom3. Under
these conditions a SDD-AGE run would take 8 hours during electrophoresis alone.
During this time, the sample’s signal would be suffering from the effects of diffusion
which causes the signal to become weaker and more spread out. However, this low
voltage is required to avoid the generation of heat, which also causes the protein signal to
become more diffuse. Diffuse signal is due to increased macromolecular diffusion caused
by the combination of the introduction of added kinetic energy and the large pores in
agarose gels. The large pores in agarose have a poor sieving effect on proteins when
compared to acrylamide based gels. The resistance that a thick, large area gel produces
greatly limits the voltage that a run can be performed at without the production of a
significant amount of heat. With our system using a thin, small area gel we saw the
potential to greatly increase the voltage of the run, which would decrease the overall run
time. This faster run would have the effect of minimizing the constant effect of
macromolecular diffusion by the monomeric protein. Our first attempt at a faster SDD-
AGE was performed at 12 V/cm, RT, for 2 hours. The transfer stack was assembled as
described by Lindquist3. As apparent in Figure 3.1.1, the monomer and amyloid signals
greatly overlap using these experimental conditions. It is obvious though, that the time

17
course of peptide induced amyloid conversion can be observed using SDD-AGE,
agreeing with what has previously been observed using the PK, ThT, and turbidity
assays.14-15 Also of note, is the many dead spots created by poor membrane:gel contact.
To further explore the effects of decreasing the run time we moved all future runs
to 4 °C to minimize the production of heat cause by increasing the voltage. From this
point on we also chose to use our modified transfer stack to diminish the appearance of
dead spots on the blot. During the rest of our optimization we chose to use seeded
amyloid samples that gave consistent and heavy smearing to simplify the interpretation of
experiments. Our molecular weight ladder or Molecular Marker (MM) was used as a
metric for how the experimental changes altered resolution. Next, we tried a series of
voltage conditions at 4 °C. 12 V/cm for 2 hours (Figure 3.1.2), 24 V/cm for an hour
(Figure 3.1.3) and 30 V/cm for 30 minutes (Figure 3.1.4) were attempted. As voltage was
increased a significant loss in the MM’s signal was observed as well. Also the 24 and 30
V/cm runs generated a great deal of heat even though performed in a refrigerator. Based
on these findings 12 V/cm for 2 hours was selected.

18
Figure 3.1.1 SDD-AGE of peptide induced amyloid conversion. First attempt at SDD-
AGE using Lindquist’s transfer stack and 12 V/cm, RT. Lanes: 1 = PrPc, 2 = 0 hours. 3 =
12 hours, 4 = 18 hours, 5 = 24 hours, 6 = 30 hours, 7 = 36 hours, 8 = 42 hours, 9 = 48
hours.
Figure 3.1.2 SDD-AGE performed at 12 V/cm for 2 hours at 4 °C. Voltage
optimization of SDD-AGE. Lane 1 = rPrPc, Lane 2 = rPrPsc, Lane 3 = MM.

19
Figure 3.1.3 SDD-AGE performed at 24 V/cm for 1 hours at 4 °C. Voltage
optimization of SDD-AGE. Lane 1 = rPrPc, Lane 2 = rPrPsc, Lane 3 = MM.
Figure 3.1.4 SDD-AGE performed at 30 V/cm for 30 minutes at 4 °C. Voltage
optimization of SDD-AGE. Lane 1 = rPrPc, Lane 2 = rPrPsc, Lane 3 = MM.

20
III.2 SDD-AGE Electrophoretic Buffer Optimization
Our next step in optimization involved determining if changing the
electrophoretic buffer could improve the resolution of SDD-AGE. We chose to examine
the following common electrophoretic buffer systems, Tris-Glycine-SDS (TGS, 25 mM
Tris, 192 mM glycine and 0.1% SDS, pH 8.3) and Tris-Borate-EDTA (TBE, 89 mM Tris,
89 mM boric acid, 2 mM EDTA, pH 8.3.) Note that 0.1% SDS was added to the TBE,
which like TAE does not normally contain SDS. Interestingly, TGS created very tight
bands reminiscent of what was seen in SDS-PAGE gels Figure 3.2.1. However, we know
that the MM in lane represents a set of proteins with molecular weight ranging from 10-
250 kDa. Since the MM was compressed into a single band it is clear that this buffer
system has created a loss in resolution. The fact that the amyloid smearing is barely
discernable due to the compression effects, further rules out this system. It should be
noted that the relative migration of the TGS and the TAE systems at 12 V/cm for 2 hours,
4 °C are very similar (data not shown). TBE on the other hand didn’t show compression
effects, and migration under the same conditions was only about 30% of TAE’s (data not
shown). The TBE buffer system showed a greater degree of diffusion then TAE due to
this lack of electrophoretic mobility. TBE also failed to produce the smearing effect. Due
to these findings we chose to continue to use TAE as our buffer system.

21
Figure 3.2.1 SDD-AGE performed at 12 V/cm for 2 hours at 4 °C in the TGS buffer
system. Electrophoretic buffer optimization of SDD-AGE. Lane 1 = rPrPc, Lane 2 =
rPrPsc, Lane 3 = MM.

22
Figure 3.2.2 SDD-AGE performed at 12 V/cm for 2 hours at 4 °C in the TBE buffer
system. Electrophoretic buffer optimization of SDD-AGE. Lane 1 = rPrPc, Lane 2 =
rPrPsc, Lane 3 = MM.

23
III.3 SDD-AGE Agarose Concentration Optimization
We next sought to optimize the agarose concentration present in the gels used for
SDD-AGE. Pore size can be altered by varying concentration of agarose in a gel. This
parameter has two experimental limits, with 1.8% agarose in the middle of them. The
lower limit is imposed by the fact that the SDD-AGE gel’s structural integrity comes
from the agarose itself. Due to this there are limits to how little agarose can be used when
making a gel that can withstand the capillary transfer method. A result of this lack of
structural integrity is seen as the reemergence of large dead spots that were seen when
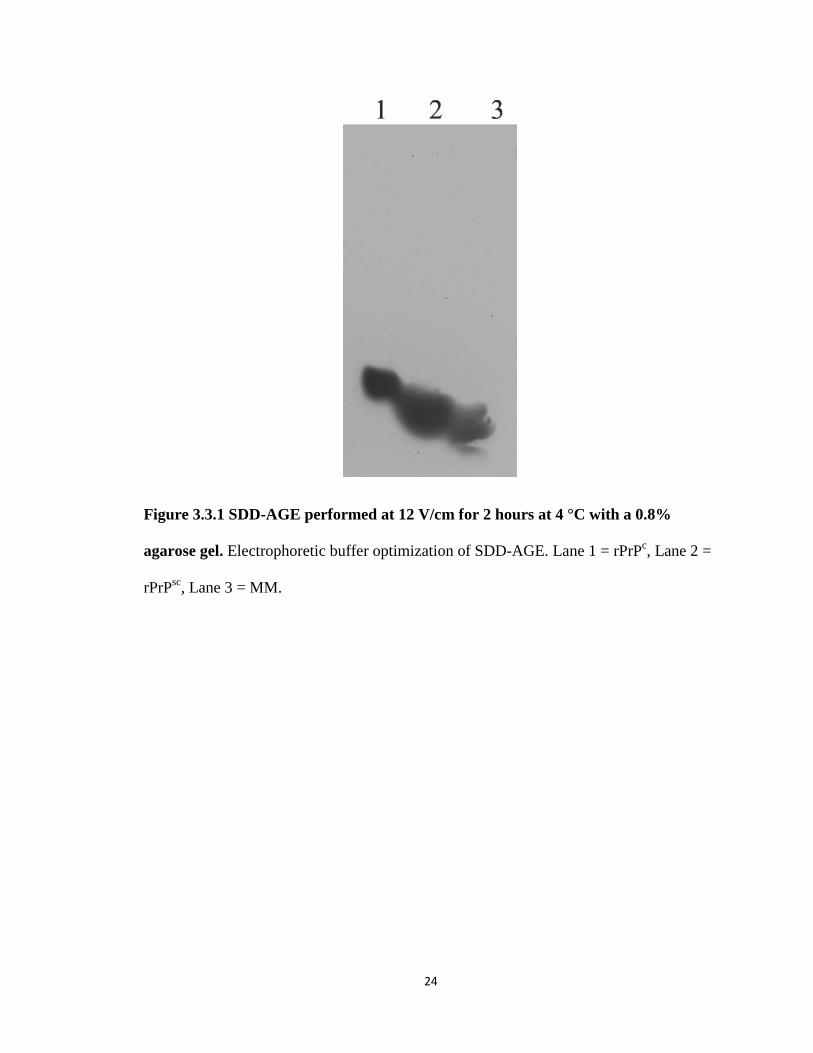
using Lindquist’s transfer stack and are visible in Lane 3 of Figure 3.3.1. The decreased
pore size has also caused diffusion to increase and the protein signals overlap laterally.
Another interesting phenomena is the lack smearing. With the small pore size it is
possible that the amyloid fraction of the sample has been spread so diffusely during both
electrophoresis and transfer that it is no longer detectable. The upper limit of agarose
concentration is created by the pore size being so small that it impairs electrophoretic
mobility and/or the capillary transfer method. Figures 3.3.2 and 3.3.3 clearly illustrate
that at the upper limit of agarose concentrations SDD-AGE is rendered useless. Transfer
of the pre-stained MM standard onto the nitrocellulose membrane was not evident before
the western blotting protocol, and the chemiluminescent signal is not seen for either
concentration once complete. Because of the practical limitations imposed by the
agarose, the 1.8% agarose SDD-AGE gels remained unchanged from the published
method.
24
Figure 3.3.1 SDD-AGE performed at 12 V/cm for 2 hours at 4 °C with a 0.8%
agarose gel. Electrophoretic buffer optimization of SDD-AGE. Lane 1 = rPrPc, Lane 2 =
rPrPsc, Lane 3 = MM.

25
Figure 3.3.2 SDD-AGE performed at 12 V/cm for 2 hours at 4 °C with a 2.8%
agarose gel. Electrophoretic buffer optimization of SDD-AGE. Lane 1 = rPrPc, Lane 2 =
rPrPsc, Lane 3 = MM.

26
Figure 3.3.3 SDD-AGE performed at 12 V/cm for 2 hours at 4 °C with a 3.8%
agarose gel. Electrophoretic buffer optimization of SDD-AGE. Lane 1 = rPrPc, Lane 2 =
rPrPsc, Lane 3 = MM.
III.4 SDD-AGE Buffer Incubation Time Optimization
The motivation of the work presented here has been to validate the use of SDD-
AGE on a peptide induced amyloid system using recombinant hPrP. Therefore, we
wanted to verify that the amount of time that the amyloid sample incubated in SDD-AGE
buffer was sufficient to generate a strong amyloid signal. Lindquist’s method, which is
designed to screen for yeast prions calls for a 5 minute incubation. We tested whether this

27
was an appropriate incubation time for PrPsc samples in our system. Figure 3.4.1 shows a
series of time incubation time points from zero to 7 minutes. It is clear that a 7 minute
incubation time is needed to observe the expected smearing band.
Figure 3.4.1 SDD-AGE performed at 12 V/cm for 2 hours at 4 °C, SDD-AGE buffer
incubation time optimization. Electrophoretic buffer optimization of SDD-AGE. Lane 1
= rPrPc, Lane 2 = MM, Lane 3 = rPrPsc with 7 minute incubation, Lane 4 = rPrPsc with 5
minute incubation, Lane 5 = rPrPsc with 2 minute incubation, Lane 6 = rPrPsc with no
incubation.

28
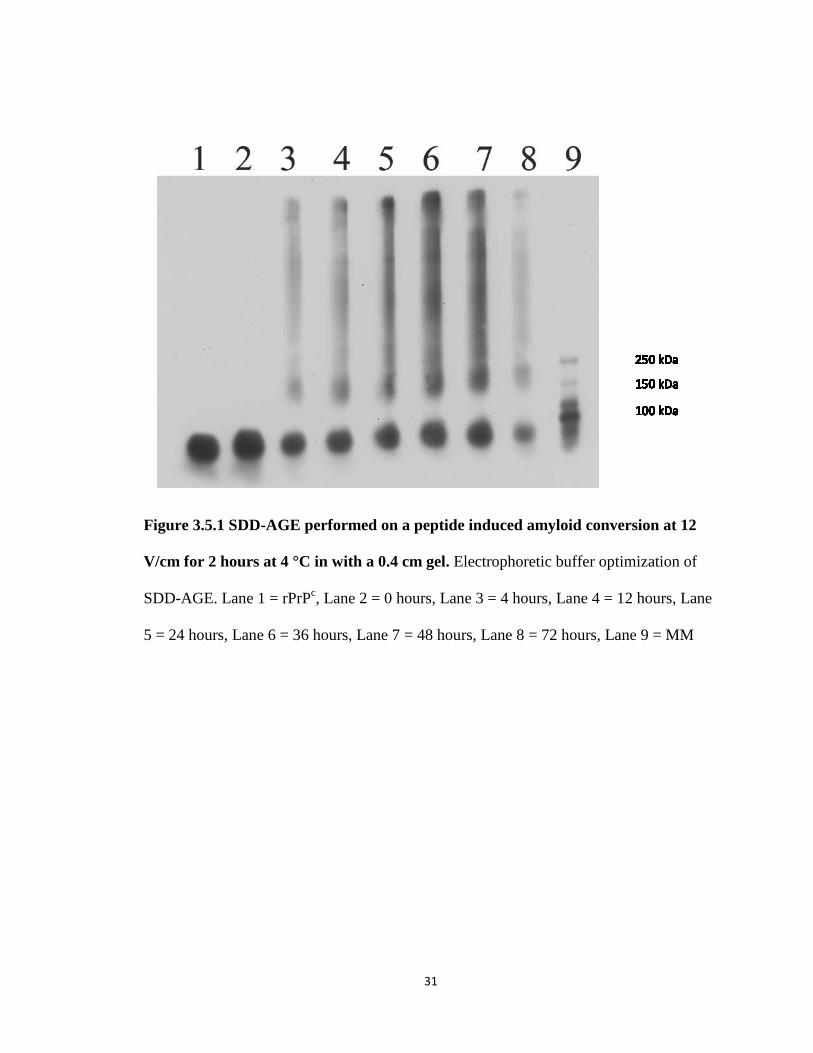
III.5 SDD-AGE Gel Thickness Optimization
The final parameter to be varied was the thickness of the gel. We only examined
thinner gels as this would minimize the diffusion that occurs during the overnight
transfer. Gel volume was decreased in 10 mL increments and then cast, the well volume
capacity using an 18- well comb was then measured. The gel thickness of these gels was
estimated as shown in Table 2. At 60 mL the well volume is approximately 30 μL, which
is large enough to allow the pipetting of 24 μL volumes of sample into a well without
spill over. A 60 mL, 1.8% agarose gel was cast and run for 2 hours at 12 V/cm in the
TAE buffer system. The SDD-AGE in figure 3.4.1 shows the time course of peptide
induced amyloid conversion in a thin gel under the described conditions. Striking
improvement is observed from what is seen in Figure 3.1.1. Note the clear separation of
the monomer and amyloid signal in wells 3-8. Also greatly improved is the resolution of
the individual proteins in the MM, Lane 9. We have determined that a 0.4 cm thick gel
gives us the best resolution.
III.6 Conclusions
The conclusions of our SDD-AGE optimization are that the TAE buffer system
and 1.8% agarose gel conditions are ideal for SDD-AGE, and should remain unchanged.
Variation of these two conditions greatly diminished the resolution of SDD-AGE.
Through our voltage optimization procedure we discovered that 12 V/cm offered us the
best tradeoff between decreased run time and a loss of resolution due to heat generated
during the run. This represents a 4 fold decrease in run time from what published
protocols call for. We also found that performing the electrophoresis at 4 °C, helps to
minimize lost resolution due to the heat generated by the higher voltage. We have tested

29
the pre-electrophoresis incubation time with the 2% SDS SDD-AGE buffer. We
discovered that unlike the Lindquist method, we require a 7 minute incubation to achieve
a strong amyloid signal. We were able to further improve the resolution of SDD-AGE by
decreasing agarose gel thickness, from 0.8 cm to 0.4 cm. Overall we found that with a
higher voltage (12 V/cm) run at 4 °C in a thin gel (0.4 cm), gives us the best SSD-AGE
resolution. We also found that a 7 minute pre-electrophoresis incubation with SDD-AGE
buffer maximizes the amyloid signal.
With these improvements we believe that SDD-AGE will be a powerful tool in
our efforts to understand amyloid conversions. Using this improved method has already
yielded new mechanistic insights into the amyloid conversion of rPrP. The peptide
induced conversion seems to involve an 8-mer intermediate, with a molecular weight of
~200 kDa. In the future this improved SDD-AGE protocol will be used to probe the
thermal and chemical stability of amyloid, as well as the molecular weight distribution of
PK digestion products.

30
Table 2. Agarose gel thickness estimates. Gel thickness was estimated for gels cast in a
10 X 15 cm casting tray.* Does not account for volume displacement of 18 well comb.
31
Figure 3.5.1 SDD-AGE performed on a peptide induced amyloid conversion at 12
V/cm for 2 hours at 4 °C in with a 0.4 cm gel. Electrophoretic buffer optimization of
SDD-AGE. Lane 1 = rPrPc, Lane 2 = 0 hours, Lane 3 = 4 hours, Lane 4 = 12 hours, Lane
5 = 24 hours, Lane 6 = 36 hours, Lane 7 = 48 hours, Lane 8 = 72 hours, Lane 9 = MM

32
REFERENCES
1. Eisenberg, D.; Jucker, M., The Amyloid State of Proteins in Human Diseases. Cell 2012, 148 (6), 1188-1203. 2. Concha-Marambio, L.; Diaz-Espinoza, R.; Soto, C., The extent of protease resistance of misfolded prion protein is highly dependent on the salt concentration. Journal of Biological Chemistry 2013. 3. Halfmann, R.; Lindquist, S., Screening for Amyloid Aggregation by Semi-Denaturing Detergent-Agarose Gel Electrophoresis. 2008, (17), e838. 4. Halfmann, R.; Jarosz, D. F.; Jones, S. K.; Chang, A.; Lancaster, A. K.; Lindquist, S., Prions are a common mechanism for phenotypic inheritance in wild yeasts. Nature 2012, 482 (7385), 363-368. 5. Sabate, R., When amyloids become prions. (1933-690X (Electronic)). 6. McGlinchey, R. P.; Shewmaker, F.; McPhie, P.; Monterroso, B.; Thurber, K.; Wickner, R. B., The repeat domain of the melanosome fibril protein Pmel17 forms the amyloid core promoting melanin synthesis. Proceedings of the National Academy of Sciences 2009, 106 (33), 13731-13736. 7. Hou, F.; Sun, L.; Zheng, H.; Skaug, B.; Jiang, Q.-X.; Chen, Zhijian J., MAVS Forms Functional Prion-like Aggregates to Activate and Propagate Antiviral Innate Immune Response. Cell 2011, 146 (3), 448-461. 8. Prusiner, S., Molecular biology of prion diseases. Science 1991, 252 (5012), 1515-1522. 9. Sabate, R.; Rodriguez-Santiago, L.; Sodupe, M.; Saupe, S. J.; Ventura, S., Thioflavin-T excimer formation upon interaction with amyloid fibers. Chemical Communications 2013, 49 (51), 5745-5747. 10. Guruprasad, K.; Reddy, B. V. B.; Pandit, M. W., Correlation between stability of a protein and its dipeptide composition: a novel approach for predicting in vivo stability of a protein from its primary sequence. Protein Engineering 1990, 4 (2), 155-161. 11. Dulle, J. E.; Bouttenot, R. E.; Underwood, L. A.; True, H. L., Soluble oligomers are sufficient for transmission of a yeast prion but do not confer phenotype. The Journal of Cell Biology 2013, 203 (2), 197-204. 12. Alberti, S.; Halfmann, R.; King, O.; Kapila, A.; Lindquist, S., A Systematic Survey Identifies Prions and Illuminates Sequence Features of Prionogenic Proteins. Cell 2009, 137 (1), 146-158. 13. Zafar, S.; Asif, A.; Ramljak, S.; Tahir, W.; Schmitz, M.; Zerr, I., Anchorless 23–230 PrPC Interactomics for Elucidation of PrPC Protective Role. Mol Neurobiol 2014, 49 (3), 1385-1399. 14. Adam, M. C., Peptide Induced Amyloidosis of Recombinant Human Prion Protein. Thesis 2012. 15. Maldonado, R., Testing the ability of RF-amide neuropeptides to promote amyloidosis of recombinant human prion protein. Thesis 2014.


