
Our Changing Denver Region
DRCOG Idea Exchange - 13 December 2016

1.
What is Shift Research Lab?2.
Our Changing Region Project3.
Chapter 2: Jobs/Housing Preview4.
Points for Reflection
O u t l i n e
3
OUR HISTORY
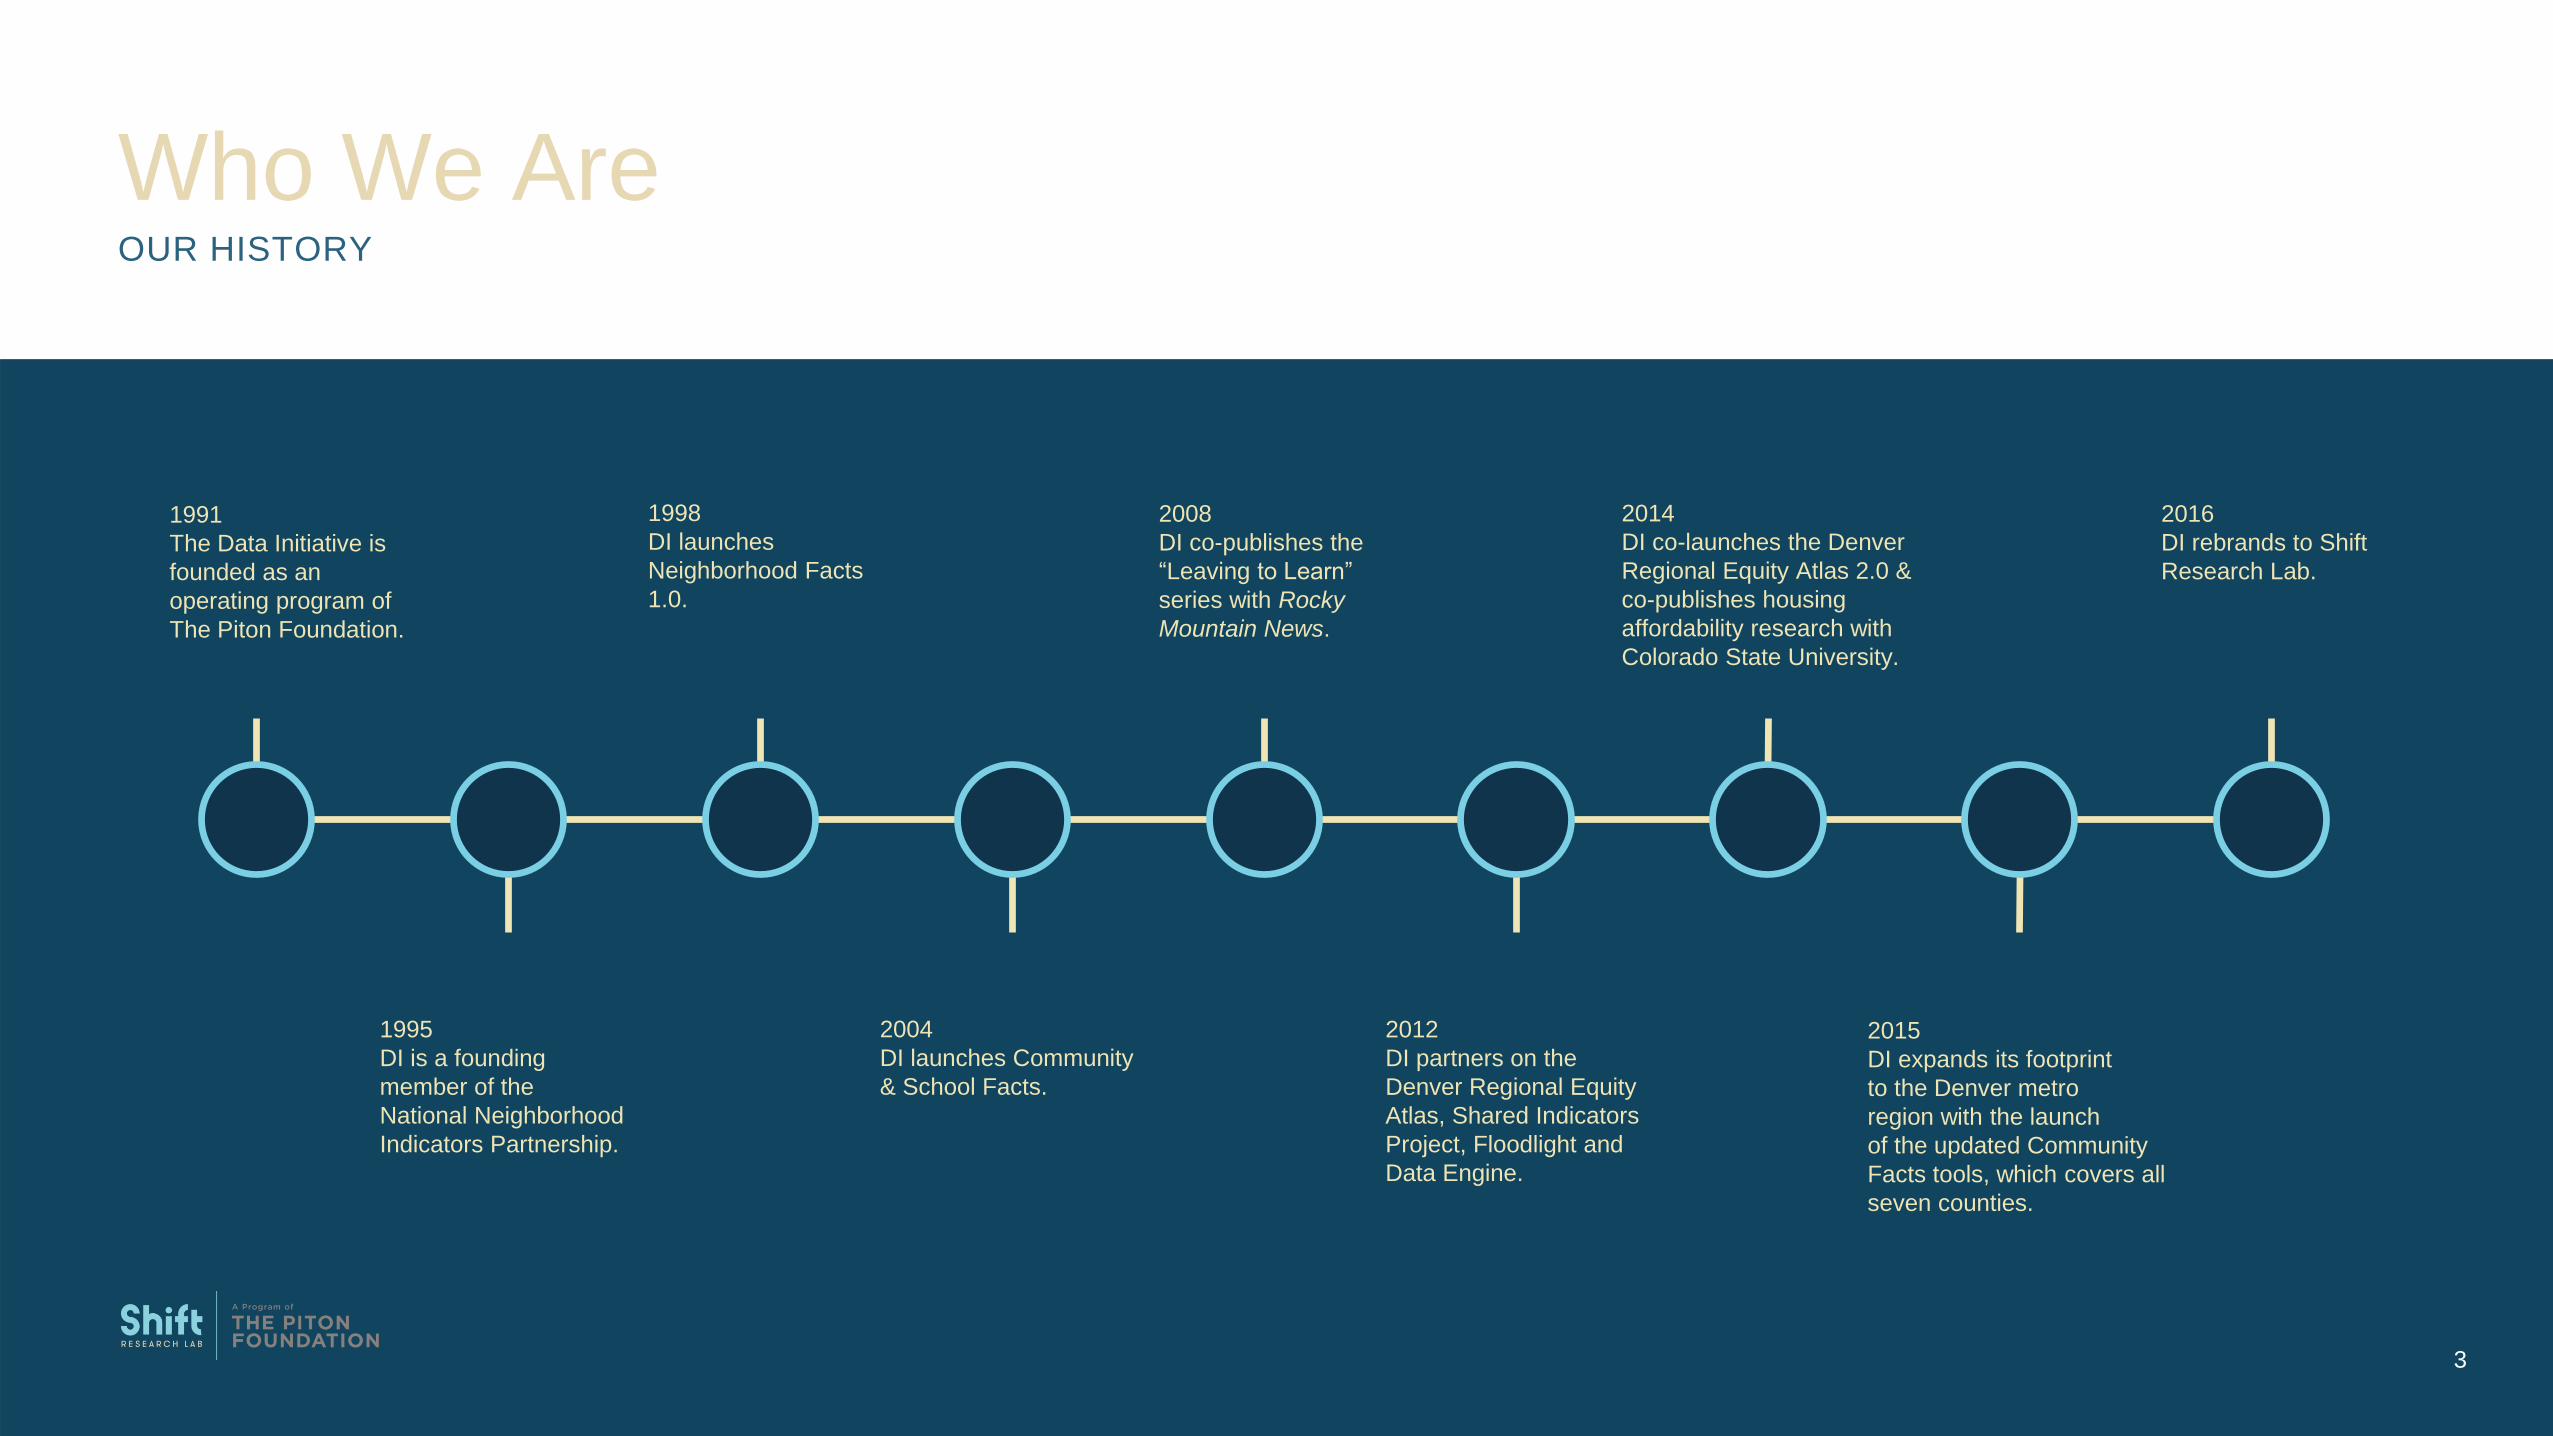
Who We Are
3
1991
The Data Initiative is
founded as an
operating program of
The Piton Foundation.
1995
DI is a founding
member of the
National Neighborhood
Indicators Partnership.
2004
DI launches Community
& School Facts.
2012
DI partners on the
Denver Regional Equity
Atlas, Shared Indicators
Project, Floodlight and
Data Engine.
2015
DI expands its footprint
to the Denver metro
region with the launch
of the updated Community
Facts tools, which covers all
seven counties.
1998
DI launches
Neighborhood Facts
1.0.
2008
DI co-publishes the
“Leaving to Learn”
series with Rocky
Mountain News.
2014
DI co-launches the Denver
Regional Equity Atlas 2.0 &
co-publishes housing
affordability research with
Colorado State University.
2016
DI rebrands to Shift
Research Lab.
4
WHAT WE DO
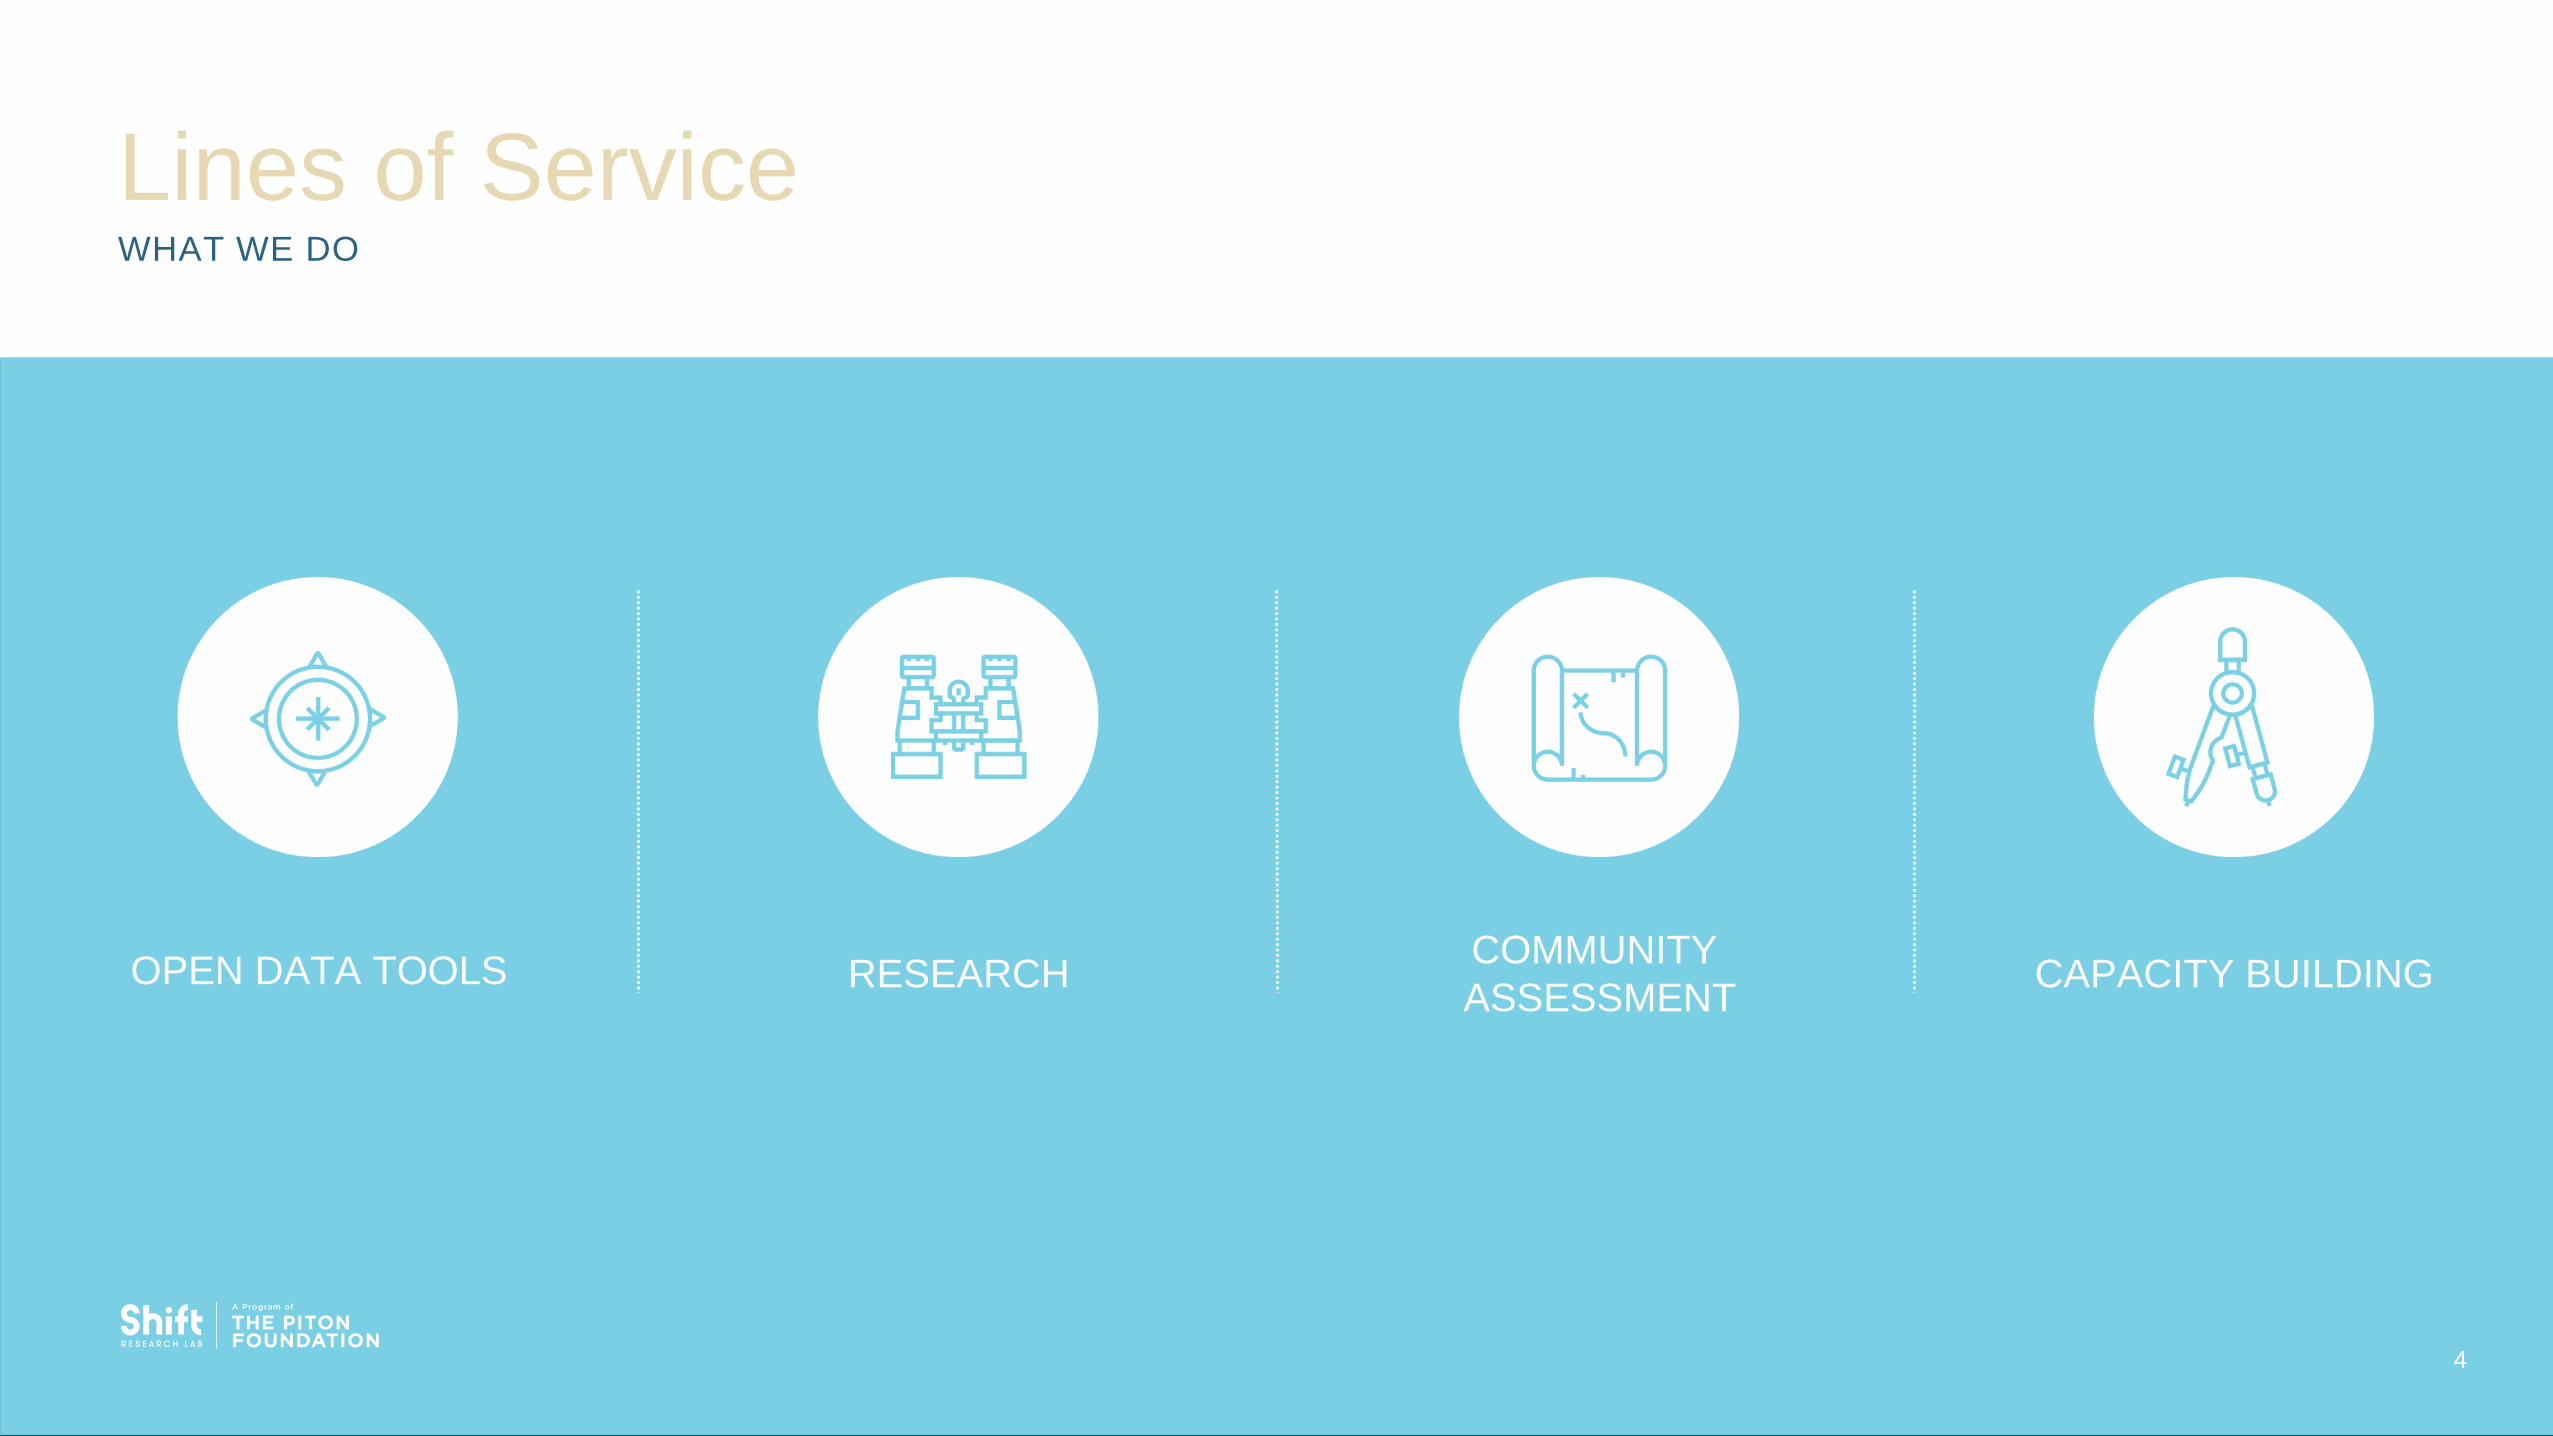
Lines of Service
4
OPEN DATA TOOLS RESEARCHCOMMUNITY
ASSESSMENTCAPACITY BUILDING

5
ECONOMIC DISPARITY – THE REAL STORY OF GROWTH
Project Background
5
POVERTY & RACE
70% of job growth by 2023 will be in
occupations with entry pay less than $36k
Less Poverty More Poverty = > 50% Non-white
0%
5%
10%
15%
20%
25%
Wages Rent
Real
Do
llars
Wages vs. Rent Growth ('09 - '14)
Sources: 2014 ACS 5 year estimates, Regional Transportation District, Colorado Department of Labor and Employment, Apartment Association of Metro Denver Multifamily Survey
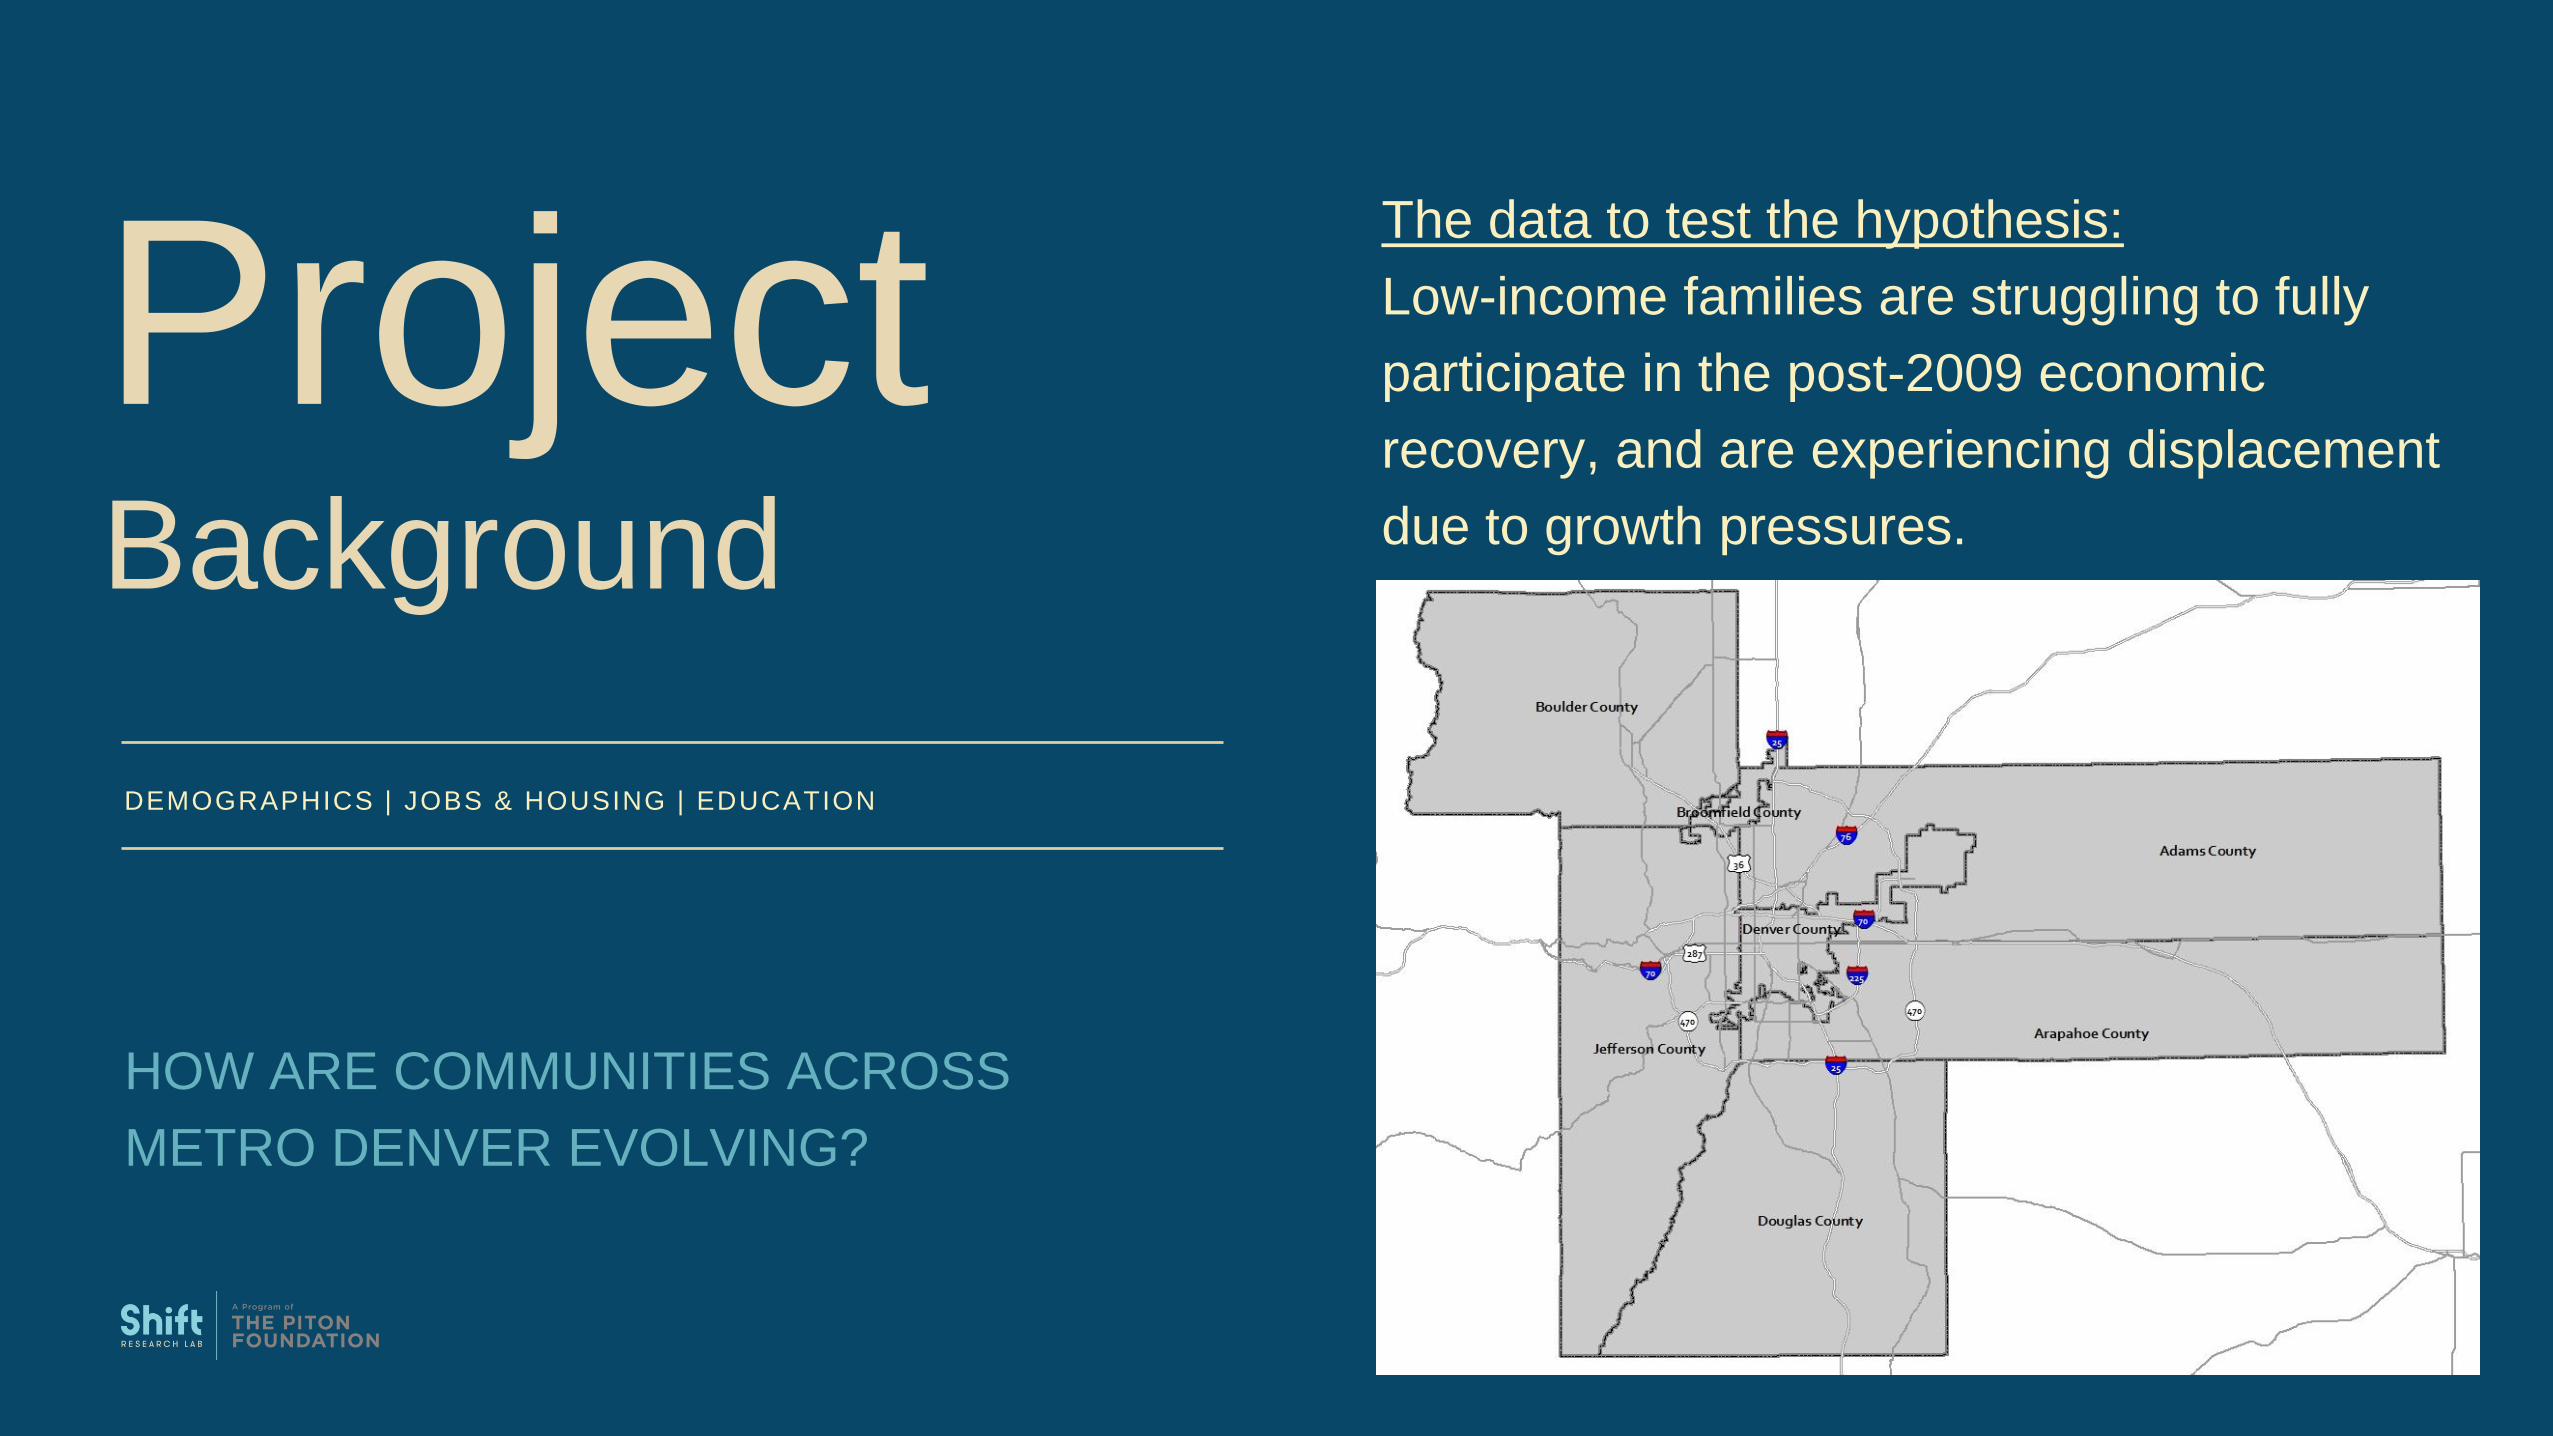
ProjectBackground
DEMOGRAPHICS | JOBS & HOUSING | EDUCATION
6
The data to test the hypothesis:
Low-income families are struggling to fully
participate in the post-2009 economic
recovery, and are experiencing displacement
due to growth pressures.
HOW ARE COMMUNITIES ACROSS
METRO DENVER EVOLVING?

Chapter 1Demographics
TOTAL POPULATION | AGE | HOUSEHOLD TYPES | RACE/ETHNICITY | MOBILITY
7
TOTAL POPULATION: 2.9 MILLION
Under 18:
696K
ETHNIC POPULATION
White, Non-Hispanic:
1.9MHispanic or Latino:
639K
Black or African American:
144KAsian:
110KOver 65:
315KHOUSEHOLDS: 1.12 MILLION
Households w/Children:
367KSource: 2009-2014 American Community Survey 5-year Estimates

8
DEMOGRAPHICS: KEY FINDINGS
Region Population Growth (2005 – 2014)
16% Overall
People per annum
Households per day
48,000
50
or
or
0.0%
0.5%
1.0%
1.5%
2.0%
2.5%
3.0%
3.5%
0
20,000
40,000
60,000
80,000
100,000
120,000
Annual Growth
Growth Rate
Region Growth Rate
Source: Colorado State Demography Office

Chapter 2Jobs | Housing
OCCUPATIONS, INCOME, EDUCATIONAL ATTAINMENT, HOUSING
INVENTORY AND CHARACTERISTICS, GENTRIFICATION
9
COMING SOON
Total Jobs:
1.55M
ECONOMIC PROFILE
Median Income:
$77,800Educational Attainment (Bachelors or Higher):
42%
$998 Denver | $1,149 Boulder
Median Value:
$253K Denver | $358K Boulder
Jobs paying under $36K*:
325K
Median Rent:
398K
HOUSING INVENTORY: 1.22M
Housing Cost Burdened:
Sources: 2009-2014 ACS 5-year Estimates (Boulder & Denver-Aurora-Lakewood MSAs), Colorado Department of Labor and Employment | *OES Occupations mean income

10
JOBS | HOUSING: PRELIMINARY FINDINGS
Housing vs. Household Growth
0
200,000
400,000
600,000
800,000
1,000,000
1,200,000
1,400,000
2001 2002 2003 2004 2005 2006 2007 2008 2009 2010 2011 2012 2013 2014 2015
Households
Housing Units
Housing Units
per Day
30
Source: Colorado State Demography Office
11
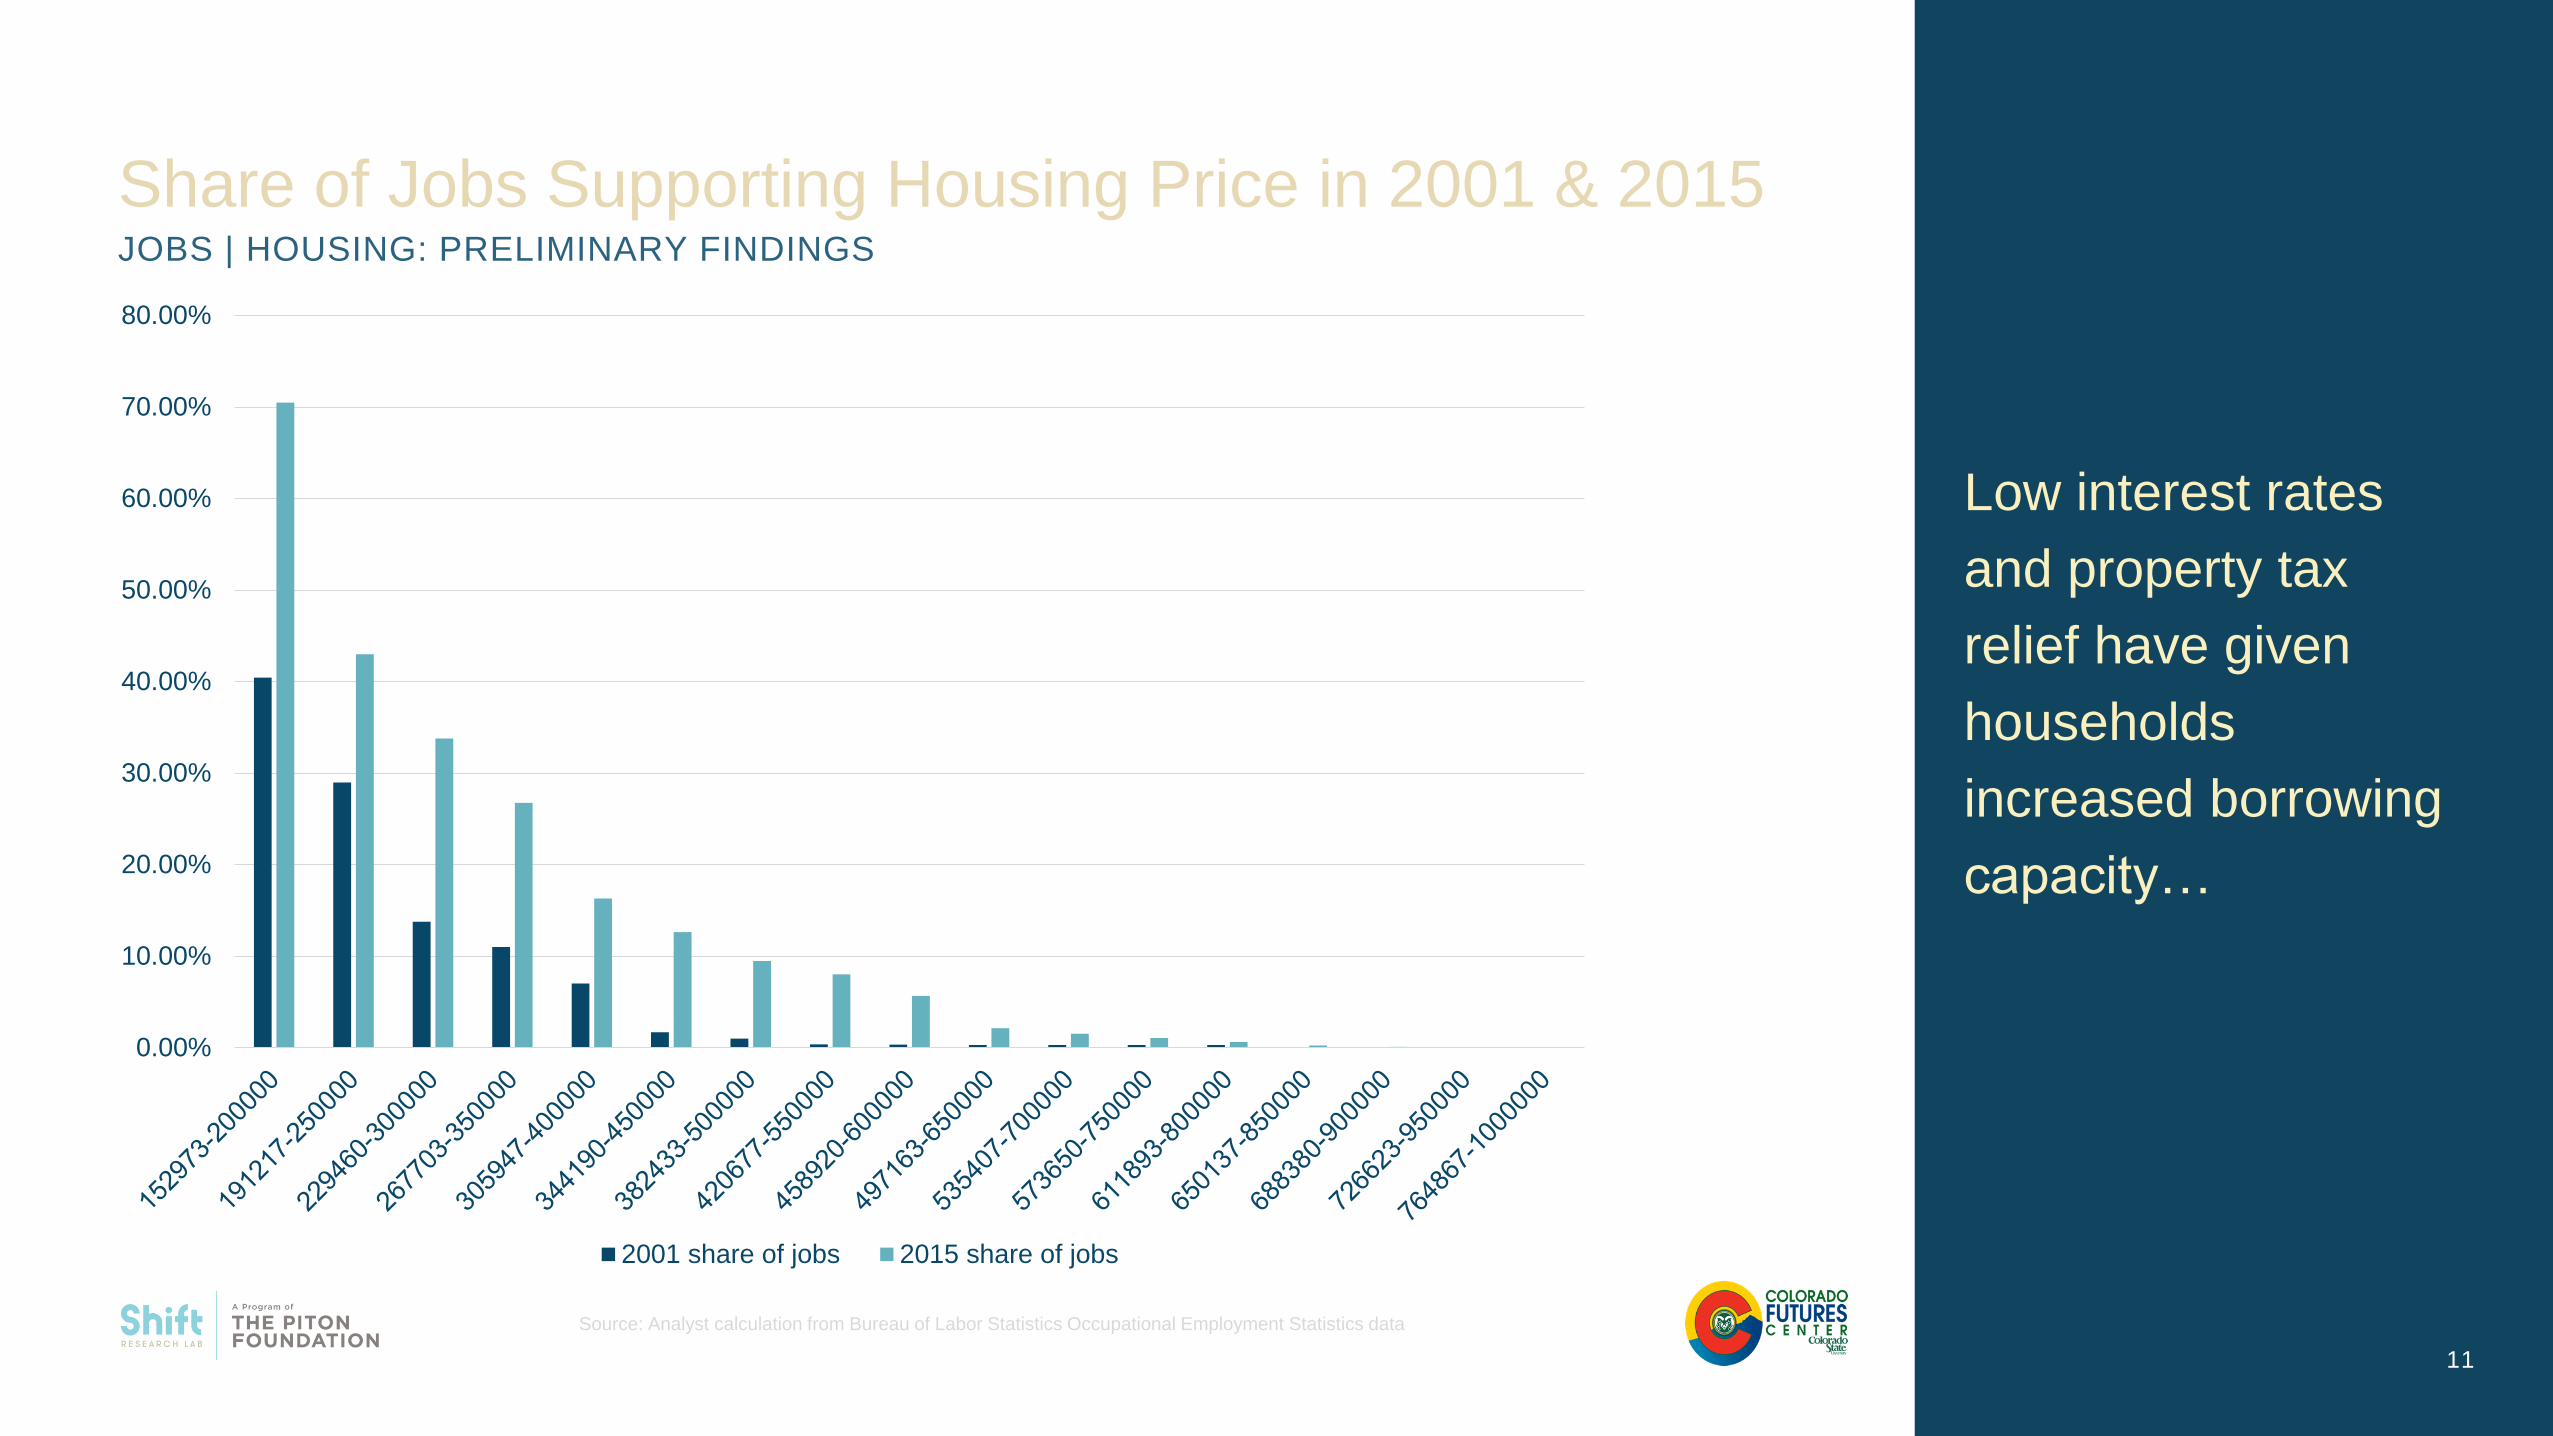
JOBS | HOUSING: PRELIMINARY FINDINGS
Share of Jobs Supporting Housing Price in 2001 & 2015
Low interest rates
and property tax
relief have given
households
increased borrowing
capacity…
0.00%
10.00%
20.00%
30.00%
40.00%
50.00%
60.00%
70.00%
80.00%
2001 share of jobs 2015 share of jobs
Source: Analyst calculation from Bureau of Labor Statistics Occupational Employment Statistics data

12
JOBS | HOUSING: PRELIMINARY FINDINGS
Housing for Working Occupations
12
Janitors NursesTeachers
…we lack the inventory at the levels affordable to households
working in a large share of the region’s occupations.
Sources: Analyst calculation from Bureau of Labor Statistics Occupational Employment Statistics data, and County assessment records

13
JOBS | HOUSING: PRELIMINARY FINDINGS
Gentrification Pressures
Who Bears the Burden?
The communities that qualify for
being at risk of gentrification:
1. Majority of the Census tract
earning <60% of the region’s
area median income (AMI).
2. In 2009 it was $ 45,600, or
326K households
3. In 2014 it was $46,680, or
268K households, with 114K
households in gentrifying
areas.
Source: Analyst calculation from 2005-2009 and 2010-2014 American Community Survey 5-year Estimates

14
EDUCATION: PRELIMINARY FINDINGS
Change in Free & Reduced Lunch ParticipationFamily Economics
The increase in free and
reduced lunch program
participation in the suburban
areas is influenced by two
primary factors:
1. Family income not keeping
pace with essential expenses,
and
2. Movement of low-income
families to more affordable
communities.
Source: Colorado Department of Education
15
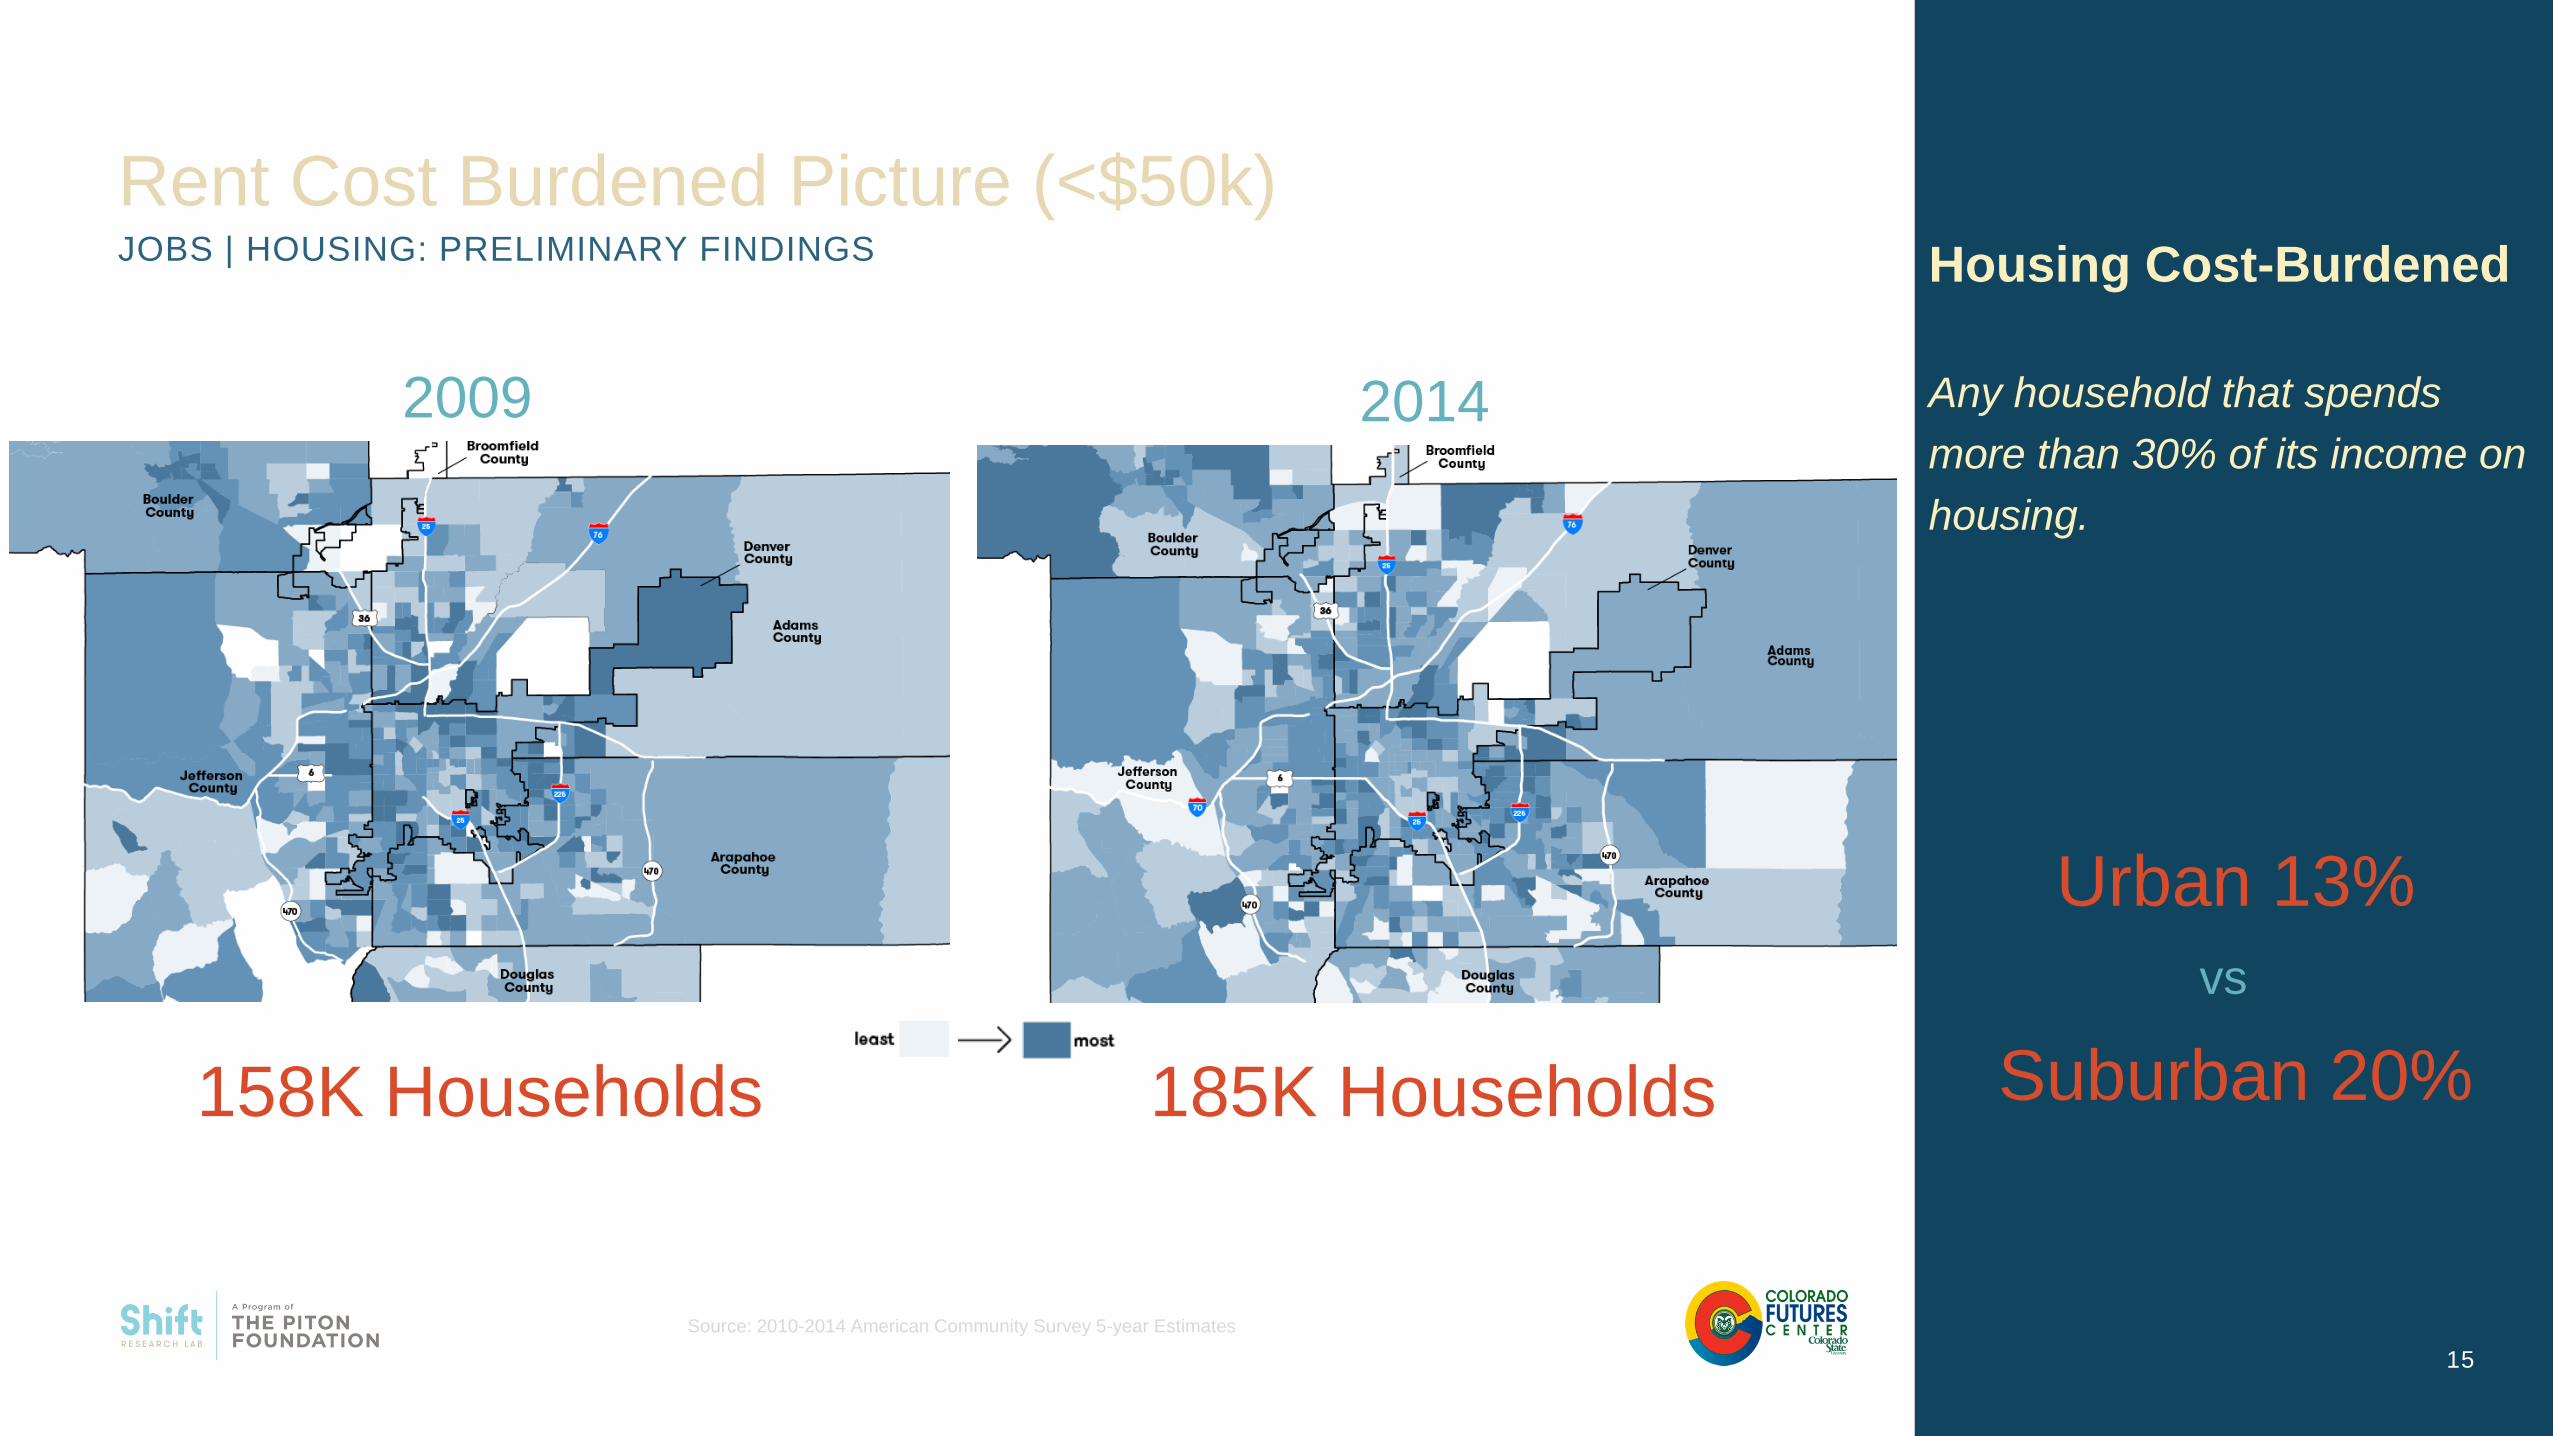
JOBS | HOUSING: PRELIMINARY FINDINGS
Rent Cost Burdened Picture (<$50k)
2009 2014
158K Households 185K Households
Urban 13%
Suburban 20%
vs
Housing Cost-Burdened
Any household that spends
more than 30% of its income on
housing.
Source: 2010-2014 American Community Survey 5-year Estimates

16
JOBS | HOUSING: PRELIMINARY FINDINGS
Regional Crowded-Out Household Spending
16
Additional dollars spent on housing that could otherwise go
to taxable-based goods.
$1.16 Billion
Source: Analyst calculation from 2010-2014 American Community Survey Estimates and 2013/2014 Consumer Expenditure Survey data

17
POINTS FOR REFLECTION
Key Upstream Drivers of Housing Price Pressures
17
The increase in housing prices is the result of multiple levers in the
larger economic and policy environment, including:
1. Construction costs (vertical)
2. Construction defects
3. Local development/building process
4. Local land use regulations
5. Land development costs
6. Building to economic development announcements
7. Rent control

Thank YouJennifer Newcomer
Dr. Phyllis Resnick
www.shiftresearchlab.org

DEMOGRAPHICS: KEY FINDINGS
19
Age Profile & Growth 2014
Age Composition
2009-2014
Fewer Children Under 512,600
-6.2%
3.5%6.9%
1.9%
11.0%
22.0%
-10.0%
-5.0%
0.0%
5.0%
10.0%
15.0%
20.0%
25.0%
0
100,000
200,000
300,000
400,000
500,000
600,000
700,000
800,000
Under 5 Under 18 18 to 34 35 to 44 45 to 64 Over 65
7-County Region: Age Profile
2009
2014
Cohort Growth 2009-2014
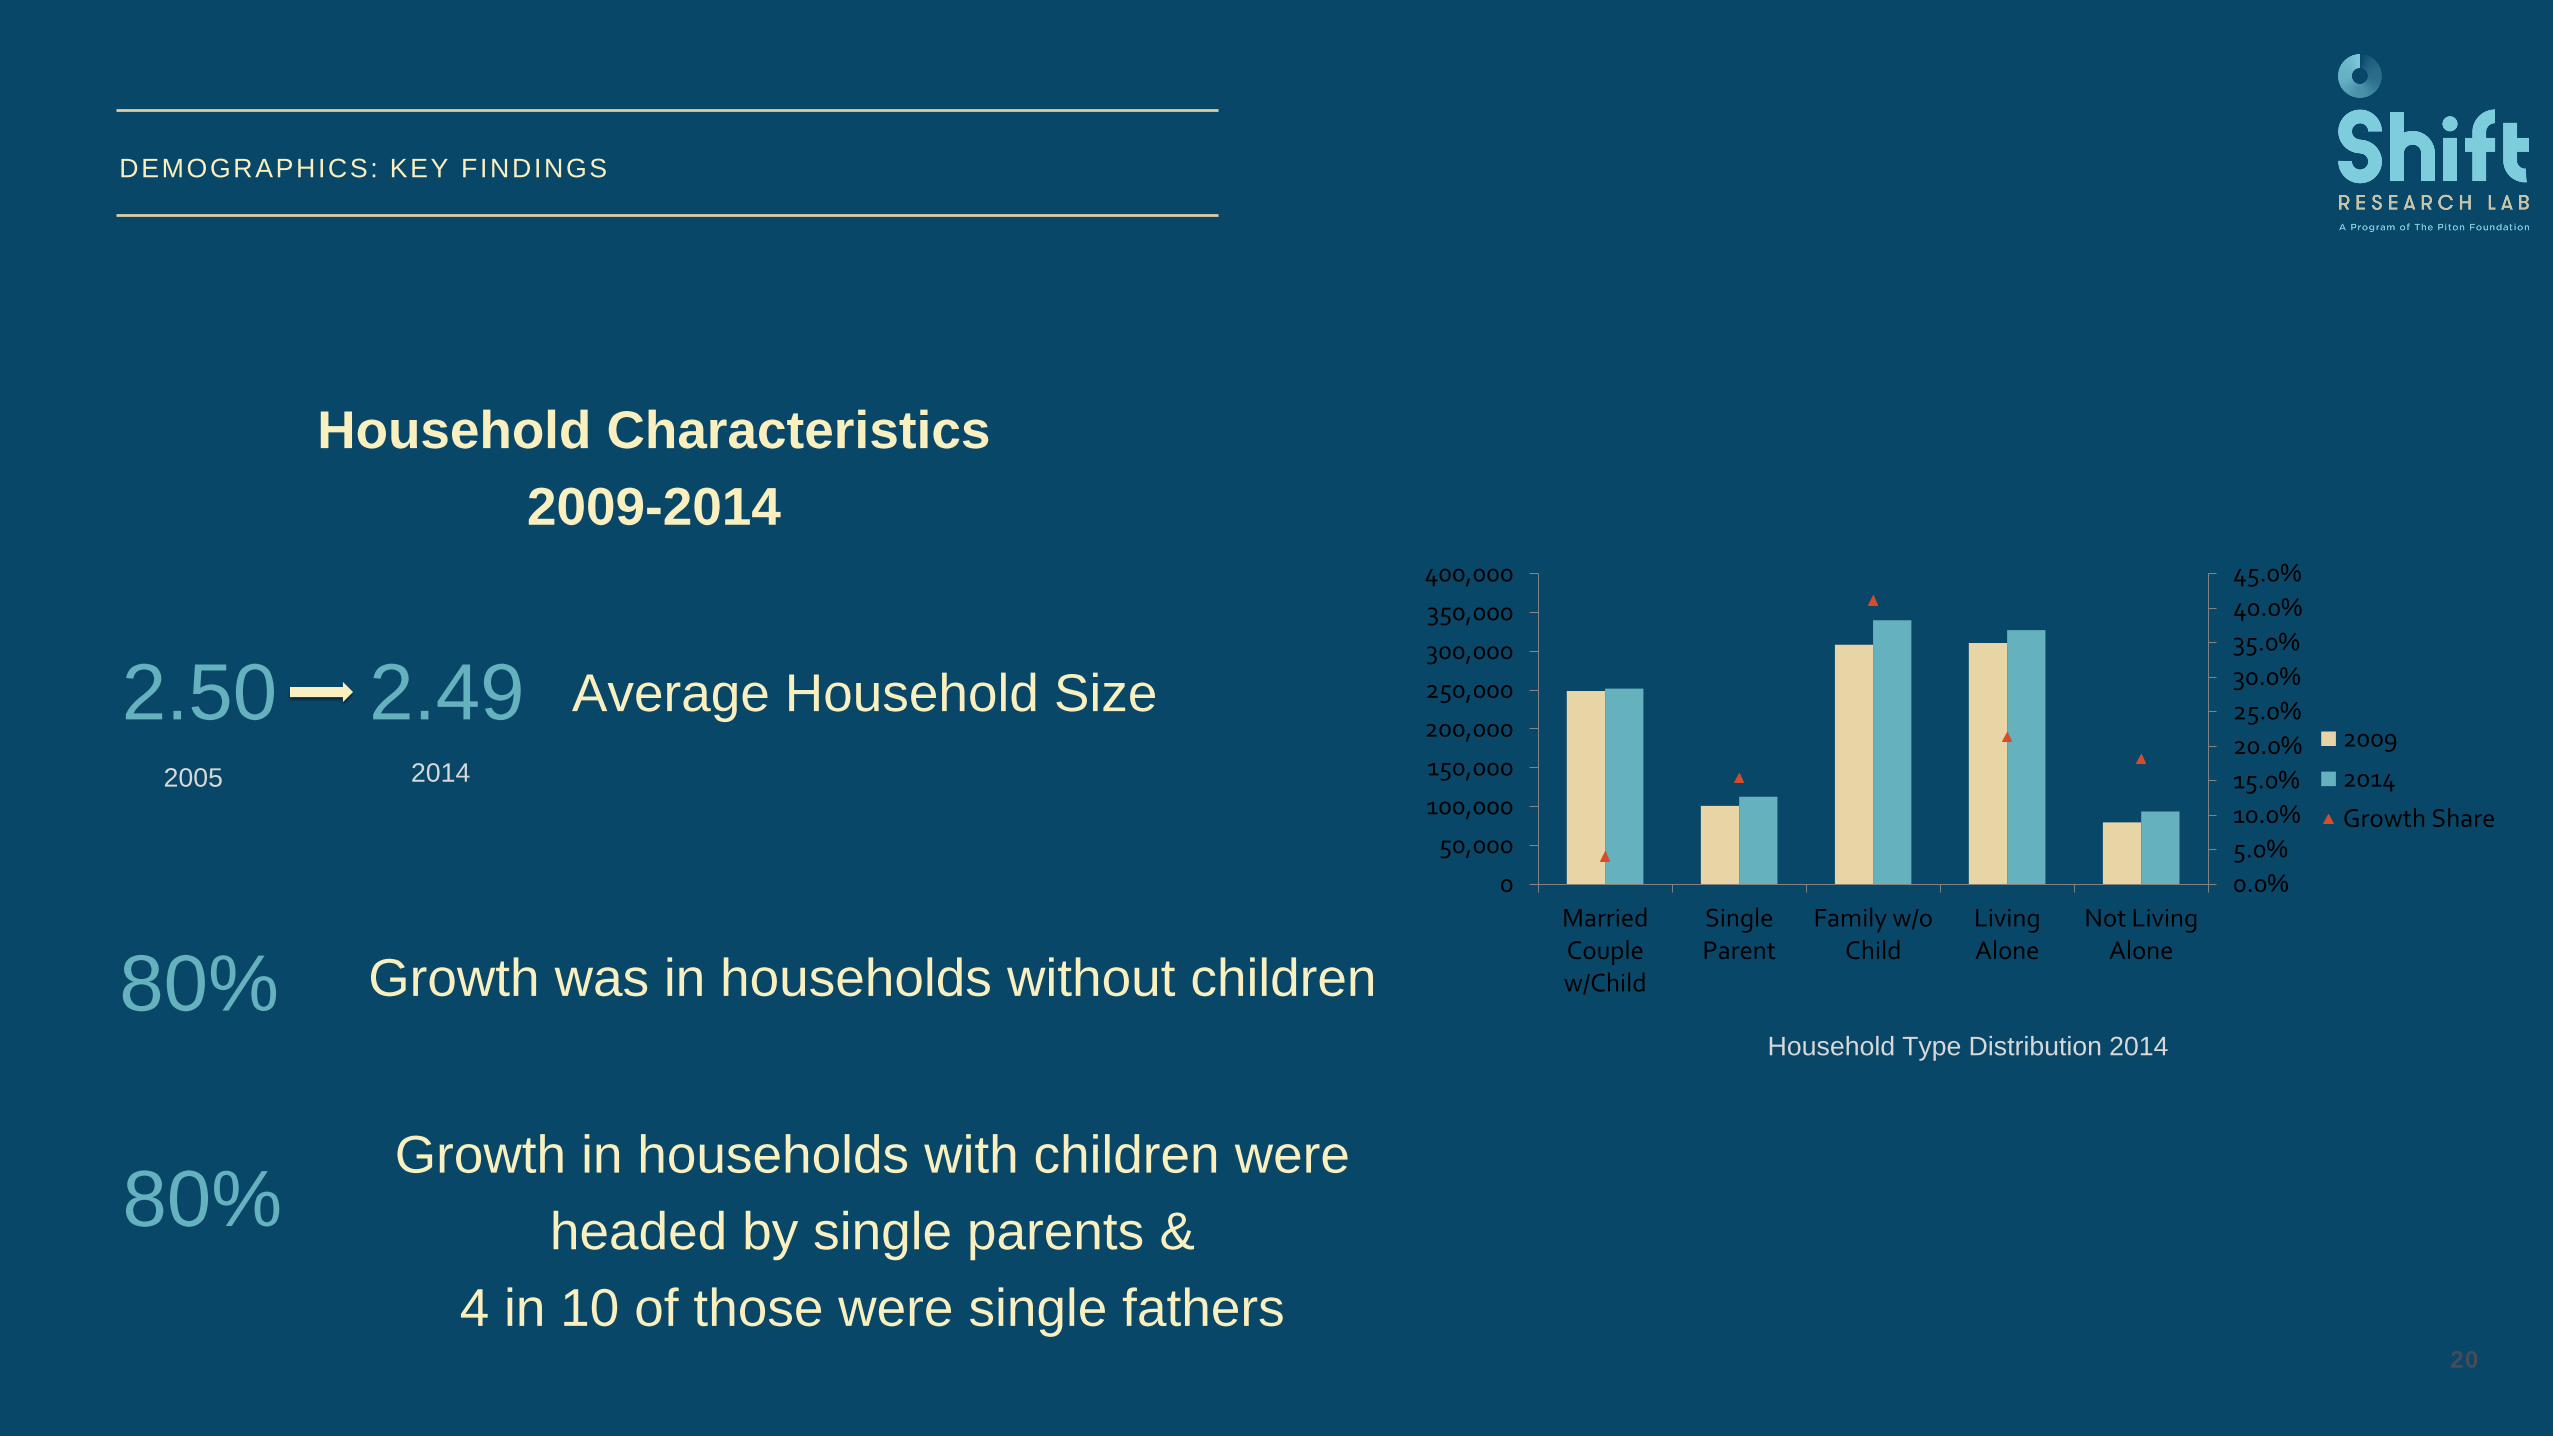
DEMOGRAPHICS: KEY FINDINGS
20
Household Type Distribution 2014
Household Characteristics
2009-2014
Average Household Size2.50 2.492005 2014
80% Growth was in households without children
0.0%
5.0%
10.0%
15.0%
20.0%
25.0%
30.0%
35.0%
40.0%
45.0%
0
50,000
100,000
150,000
200,000
250,000
300,000
350,000
400,000
MarriedCouplew/Child
SingleParent
Family w/oChild
LivingAlone
Not LivingAlone
2009
2014
Growth Share
80%Growth in households with children were
headed by single parents &
4 in 10 of those were single fathers
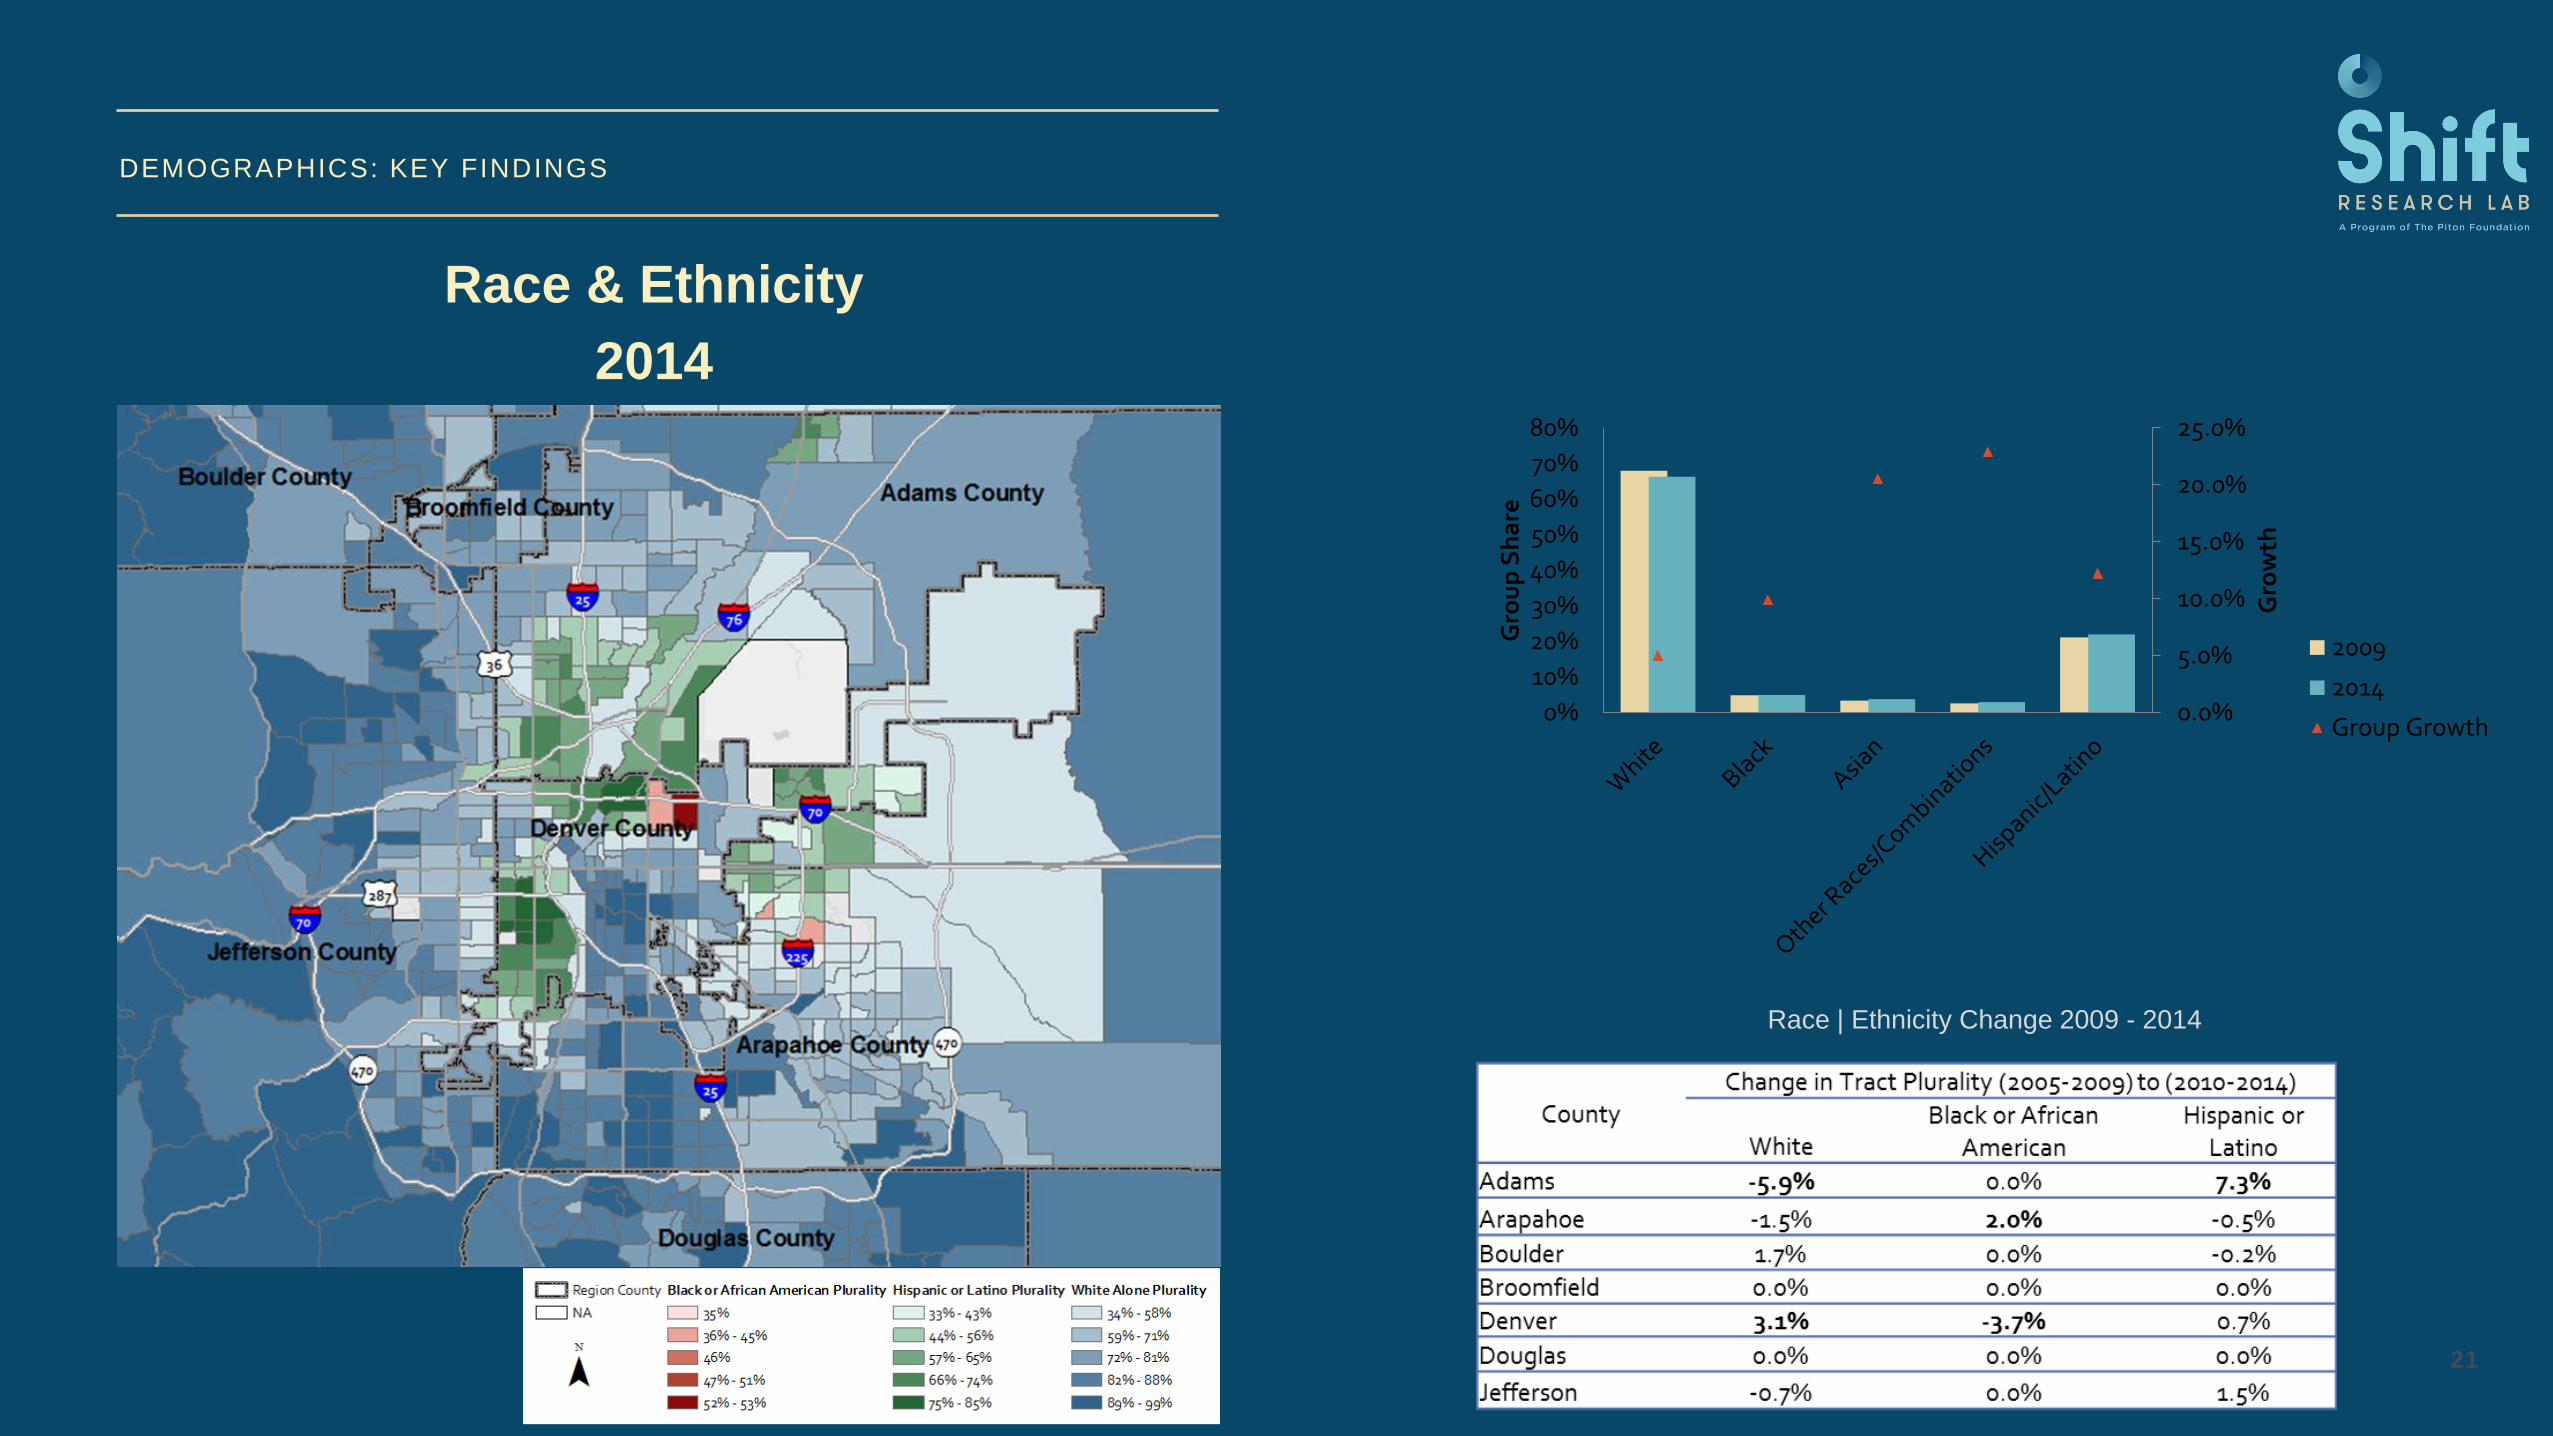
DEMOGRAPHICS: KEY FINDINGS
21
Race | Ethnicity Change 2009 - 2014
Race & Ethnicity
2014
0.0%
5.0%
10.0%
15.0%
20.0%
25.0%
0%
10%
20%
30%
40%
50%
60%
70%
80%
Gro
wth
Gro
up
Sh
are
2009
2014
Group Growth

DEMOGRAPHICS: KEY FINDINGS
22
Mobility
2014
Black or African
American:
Different County 1
Year Ago
19% 14%
WhiteBlack or Hispanic
Overall, mobility rates between 2009 and
2014 remained flat, but Black and Hispanic
populations consistently have higher inter-
regional mobility rates.
Hispanic or Latino:
Different County 1
Year Ago

JOBS | HOUSING: PRELIMINARY FINDINGS
23Gentrification (2009-2014)
Signs of Displacement?
Race/Ethnic Plurality 2009 Race/Ethnic Plurality 2014
Transit Type
Frequent Bus
Light Rail
Future Transit Lines
Gentrifying 2014
NA Black or African American Plurality
35%
36% - 45%
46%
47% - 51%
52% - 53%
Hispanic or Latino Plurality
33% - 43%
44% - 56%
57% - 65%
66% - 74%
75% - 85%
White Alone Plurality
34% - 58%
59% - 71%
72% - 81%
82% - 88%
89% - 99%

JOBS | HOUSING: PRELIMINARY FINDINGS
24
0%
10%
20%
30%
40%
50%
60%
70%
80%
90%
100%
2 A
dults
2 A
dults +
tee
na
ger
2 A
dults +
2 t
ee
nag
ers
Adu
lt
2 A
dults +
scho
ola
ge
r
2 A
dults +
scho
ola
ge
r +
tee
nag
er
2 A
dults +
3 t
ee
nag
ers
2 A
dults +
pre
sch
oo
ler
2 A
dults +
infa
nt
2 A
dults +
pre
sch
oo
ler
+te
en
age
r
2 A
dults +
2 s
ch
oo
lage
rs
2 A
dults +
infa
nt
+te
ena
ge
r
2 A
dults +
scho
ola
ge
r +
2 te
ena
ge
rs
2 A
dults +
pre
sch
oo
ler
+sch
oola
ger
2 A
dults +
infa
nt
+sch
oola
ger
2 A
dults +
pre
sch
oo
ler
+2
tee
na
gers
2 A
dults +
2 s
ch
oo
lage
rs +
tee
na
ge
r
2 A
dults +
infa
nt
+2
tee
nag
ers
Adu
lt +
teen
ag
er
2 A
dults +
2 p
rescho
ole
rs
Adu
lt +
2 te
ena
gers
2 A
dults +
infa
nt
+p
resch
oo
ler
2 A
dults +
2 in
fan
ts
2 A
dults +
pre
sch
oo
ler
+sch
oola
ger
+te
ena
ger
2 A
dults +
3 s
ch
oo
lage
rs
2 A
dults +
infa
nt
+sch
oola
ger
+te
en
ag
er
2 A
dults +
2 p
rescho
ole
r +
tee
na
ger
2 A
dults +
infa
nt
+p
resch
oo
ler
+te
en
age
r
2 A
dults +
pre
sch
oo
ler
+2
scho
ola
ge
rs
Adu
lt +
schoo
lag
er
2 A
dults +
2 in
fan
ts +
tee
nag
er
2 A
dults +
infa
nt
+2
sch
oo
lage
rs
Adu
lt +
schoo
lag
er
+te
ena
ger
2 A
dults +
2 p
rescho
ole
r +
scho
ola
ge
r
2 A
dults +
infa
nt
+p
resch
oo
ler
+sch
oo
lag
er
2 A
dults +
2 in
fan
ts +
sch
oo
lage
r
2 A
dults +
3 p
rescho
ole
rs
Adu
lt +
3 te
ena
gers
2 A
dults +
infa
nt
+2
pre
sch
oole
rs
Adu
lt +
pre
scho
ole
r
2 A
dults +
2 in
fan
ts +
pre
sch
oole
r
2 A
dults +
3 in
fan
ts
Adu
lt +
infa
nt
Adu
lt +
pre
scho
ole
r +
tee
nag
er
Adu
lt +
2 s
cho
ola
ge
rs
Adu
lt +
infa
nt
+te
en
ag
er
Adu
lt +
schoo
lag
e +
2 t
ee
na
gers
Adu
lt +
pre
scho
ole
r +
schoo
lage
r
Adu
lt +
infa
nt
+sch
oo
lage
r
Adu
lt +
pre
scho
ole
r +
2 te
en
age
rs
Adu
lt +
2 s
cho
ola
ge
rs +
tee
nag
er
Adu
lt +
infa
nt
+2
te
ena
ge
rs
Adu
lt +
2 p
resch
oo
lers
Adu
lt +
infa
nt
+p
rescho
ole
r
Adu
lt +
2 infa
nts
Adu
lt +
pre
scho
ole
r +
schoo
lage
+te
en
ag
er
Adu
lt +
infa
nt
+sch
oo
lage
r +
tee
na
ge
r
Adu
lt +
3 s
cho
ola
ge
rs
Adu
lt +
2 p
resch
oo
lers
+te
en
age
r
Adu
lt +
infa
nt
+p
rescho
ole
r +
tee
na
ger
Adu
lt +
pre
scho
ole
r +
2 s
ch
oola
gers
Adu
lt +
2 infa
nts
+ t
een
age
r
Adu
lt +
infa
nt
+2
sch
oola
gers
Adu
lt +
2 p
resch
oo
lers
+sch
oola
ger
Adu
lt +
infa
nt
+p
rescho
ole
r +
scho
ola
ge
r
Adu
lt +
2 infa
nts
+ s
ch
oola
ger
Adu
lt +
3 p
resch
oo
lers
Adu
lt +
infa
nt
+2
pre
sch
oo
lers
Adu
lt +
2 infa
nts
+ p
rescho
ole
r
Adu
lt +
3 infa
nts
Share of Jobs (by Occupation) with Median Wage Above and Below Median SSS Wage by Family Type, 2015
Share below Share above
Share of jobs statewide
supporting the median self-
sufficiency standard fell from
65% in 2001 to 56% in 2015

JOBS | HOUSING: PRELIMINARY FINDINGS
25
-
100,000
200,000
300,000
400,000
500,000
600,000
700,000
800,000
900,000
Doctoral orprofessional degree
Bachelor's degree Master's degree Associate's degree Postsecondarynondegree award
High school diploma orequivalent
Some college, nodegree
No formal educationalcredential
Number of Jobs by Educational Attainment, 2015

JOBS | HOUSING: PRELIMINARY FINDINGS
26
$-
$5.00
$10.00
$15.00
$20.00
$25.00
$30.00
$35.00
$40.00
2 A
dults
2 A
dults +
teenag
er
2 A
dults +
2 teena
gers
Adult
2 A
dults +
sch
oo
lag
er
2 A
dults +
sch
oo
lag
er
+te
en
ager
2 A
dults +
3 teena
gers
2 A
dults +
pre
schoole
r
2 A
dults +
infa
nt
2 A
dults +
pre
schoole
r +
teenager
2 A
dults +
2 s
cho
ola
gers
2 A
dults +
infa
nt +
teena
ger
2 A
dults +
sch
oo
lag
er
+2 tee
nagers
2 A
dults +
pre
schoole
r +
schoola
ger
2 A
dults +
infa
nt +
scho
ola
ger
2 A
dults +
pre
schoole
r +
2 teenag
ers
2 A
dults +
2 s
cho
ola
gers
+te
ena
ger
2 A
dults +
infa
nt +
2 teen
agers
Adult +
teena
ger
2 A
dults +
2 p
reschoo
lers
Adult +
2 teen
agers
2 A
dults +
infa
nt +
pre
schoole
r
2 A
dults +
2 infa
nts
2 A
dults +
pre
schoole
r +
schoola
ger
+te
enag
er
2 A
dults +
3 s
cho
ola
gers
2 A
dults +
infa
nt +
scho
ola
ger
+te
enager
2 A
dults +
2 p
reschoo
ler
+te
enag
er
2 A
dults +
pre
schoole
r +
2 s
choola
ge
rs
2 A
dults +
infa
nt +
pre
schoole
r +
teenage
r
Adult +
scho
ola
ger
2 A
dults +
infa
nt +
2 s
ch
oola
gers
2 A
dults +
2 infa
nts
+te
enag
er
Adult +
scho
ola
ger
+te
enager
2 A
dults +
2 p
reschoo
ler
+sch
oola
ge
r
2 A
dults +
infa
nt +
pre
schoole
r +
sch
oola
ge
r
2 A
dults +
2 infa
nts
+sch
oo
lag
er
2 A
dults +
3 p
reschoo
lers
Adult +
3 teen
agers
2 A
dults +
infa
nt +
2 p
reschoo
lers
Adult +
pre
schoole
r
2 A
dults +
2 infa
nts
+p
reschoole
r
2 A
dults +
3 infa
nts
Adult +
infa
nt
Adult +
pre
schoole
r +
teenage
r
Adult +
2 s
ch
oola
gers
Adult +
infa
nt +
teen
ager
Adult +
scho
ola
ge +
2 teena
gers
Adult +
pre
schoole
r +
sch
oola
ge
r
Adult +
infa
nt +
scho
ola
ger
Adult +
pre
schoole
r +
2 teenag
ers
Adult +
2 s
ch
oola
gers
+te
en
ager
Adult +
infa
nt +
2 tee
nagers
Adult +
2 p
reschoo
lers
Adult +
infa
nt +
pre
schoo
ler
Adult +
2 infa
nts
Adult +
pre
schoole
r +
sch
oola
ge
+te
enager
Adult +
infa
nt +
scho
ola
ger
+te
enager
Adult +
3 s
ch
oola
gers
Adult +
2 p
reschoo
lers
+te
enager
Adult +
infa
nt +
pre
schoo
ler
+te
enag
er
Adult +
pre
schoole
r +
2 s
choo
lag
ers
Adult +
infa
nt +
2 s
choola
gers
Adult +
2 infa
nts
+ t
eena
ger
Adult +
2 p
reschoo
lers
+schoola
ger
Adult +
infa
nt +
pre
schoo
ler
+sch
oo
lage
r
Adult +
2 infa
nts
+ s
cho
ola
ger
Adult +
3 p
reschoo
lers
Adult +
infa
nt +
2 p
rescho
ole
rs
Adult +
2 infa
nts
+ p
reschoole
r
Adult +
3 infa
nts
Family Types, by SSS, Supported by Median Wage of "No Education" Job
Average SSS Median Wage - "No Eduation" job
“No Education”
jobs only support
19 family types


