
MINISTRY OF PUBLIC WORKS
Well Connected and Reliable Infrastructure to Support Economic Development
PRESENTATION OF VICE MINISTER OF PUBLIC WORKSREPUBLIC OF INDONESIA
Indonesia Australia Business Council (IABC)Bali, November 2013
Outline• Introduction on APEC
• APEC 2013 and Bogor Goals
• Indonesia – Australia connection
• Countries Outlook
• Indonesia current condition
• Road Infrastructure Development Plan
• Infrastructure Investment Requirement
• Innovative delivery in toll road development
• New models for government co‐funding in Infrastructure Development
• Conclusion
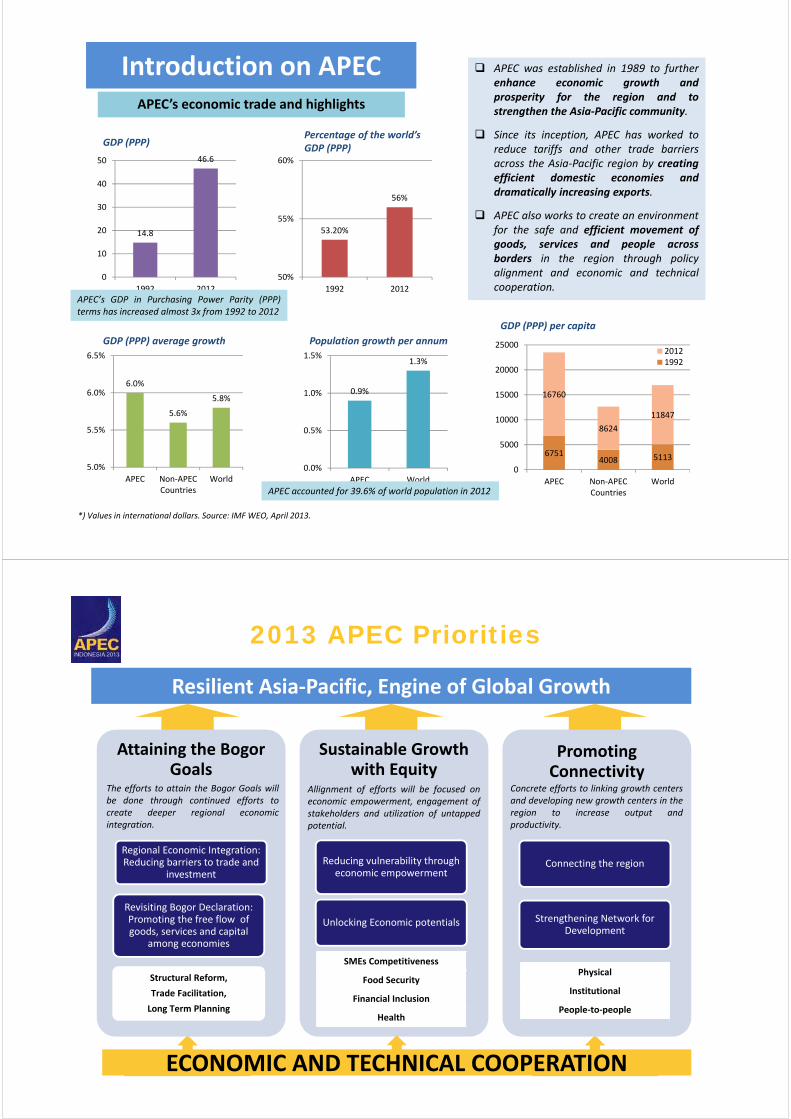
Introduction on APECAPEC’s economic trade and highlights
14.8
46.6
0
10
20
30
40
50
1992 2012
GDP (PPP)Percentage of the world’s GDP (PPP)
6.0%
5.6%
5.8%
5.0%
5.5%
6.0%
6.5%
APEC Non‐APECCountries
World
GDP (PPP) average growth
0.9%
1.3%
0.0%
0.5%
1.0%
1.5%
APEC World
Population growth per annum
67514008 5113
16760
8624
11847
0
5000
10000
15000
20000
25000
APEC Non‐APECCountries
World
20121992
GDP (PPP) per capita
APEC’s GDP in Purchasing Power Parity (PPP)terms has increased almost 3x from 1992 to 2012
APEC accounted for 39.6% of world population in 2012
APEC was established in 1989 to furtherenhance economic growth andprosperity for the region and tostrengthen the Asia‐Pacific community.
Since its inception, APEC has worked toreduce tariffs and other trade barriersacross the Asia‐Pacific region by creatingefficient domestic economies anddramatically increasing exports.
APEC also works to create an environmentfor the safe and efficient movement ofgoods, services and people acrossborders in the region through policyalignment and economic and technicalcooperation.
*) Values in international dollars. Source: IMFWEO, April 2013.
53.20%
56%
50%
55%
60%
1992 2012
Resilient Asia‐Pacific, Engine of Global Growth
Attaining the Bogor Goals
Regional Economic Integration: Reducing barriers to trade and
investment
Revisiting Bogor Declaration: Promoting the free flow of goods, services and capital
among economies
Structural Reform,
Trade Facilitation,
Long Term Planning
Sustainable Growth with Equity
Reducing vulnerability through economic empowerment
Unlocking Economic potentials
Promoting Connectivity
Connecting the region
Strengthening Network for Development
ECONOMIC AND TECHNICAL COOPERATION
SMEs Competitiveness
Food Security
Financial Inclusion
Health
Physical
Institutional
People‐to‐people
The efforts to attain the Bogor Goals willbe done through continued efforts tocreate deeper regional economicintegration.
Allignment of efforts will be focused oneconomic empowerment, engagement ofstakeholders and utilization of untappedpotential.
Concrete efforts to linking growth centersand developing new growth centers in theregion to increase output andproductivity.
2013 APEC Priorities

Trade and Trade and investment liberalization
• reducing and eliminating tariff
• reducing and eliminating non‐tariff barriers to trade and investment
• opening markets
Business facilitation
• reducing the costs of business transactions
• improving access to trade information
• bringing into line policy and business strategies to facilitate growth
• free and open trade
Economic and Economic and technical
cooperation
• assisting member economies build the necessary capacities to take advantage of global trade and the New Economy
APEC Economic Leaders' Declaration Of Common Resolve (1994)Free and open trade and investment in the Asia‐Pacific
– by 2010 for developed economies– by 2020 for developing economies
3 specific areas crucial to achieving the Bogor Goals:
Bogor Goals
Well connected and reliable
infrastructure is important in
reducing and eliminating non‐tariff
barriers to trade and investment as
well as in reducing the cost of
business transactions by reducing
transportation costs.
100
1000
10000
100000
100 1.000 10.000 100.000
Paved Road Density (km/mil pop)
GNI ($/pop)
Source: Queiroz (World Bank, 2007)
logGNI = 1.39 logPRDR squared: 0.7698 countries
Infrastructure as a social capital is crucial to accelerate national development.
Infrastructure as a catalyst of production process and its marketing drives the economic development.
Illustration on the importance of infrastructure to support economic development
Infrastructure to Support Economic Development
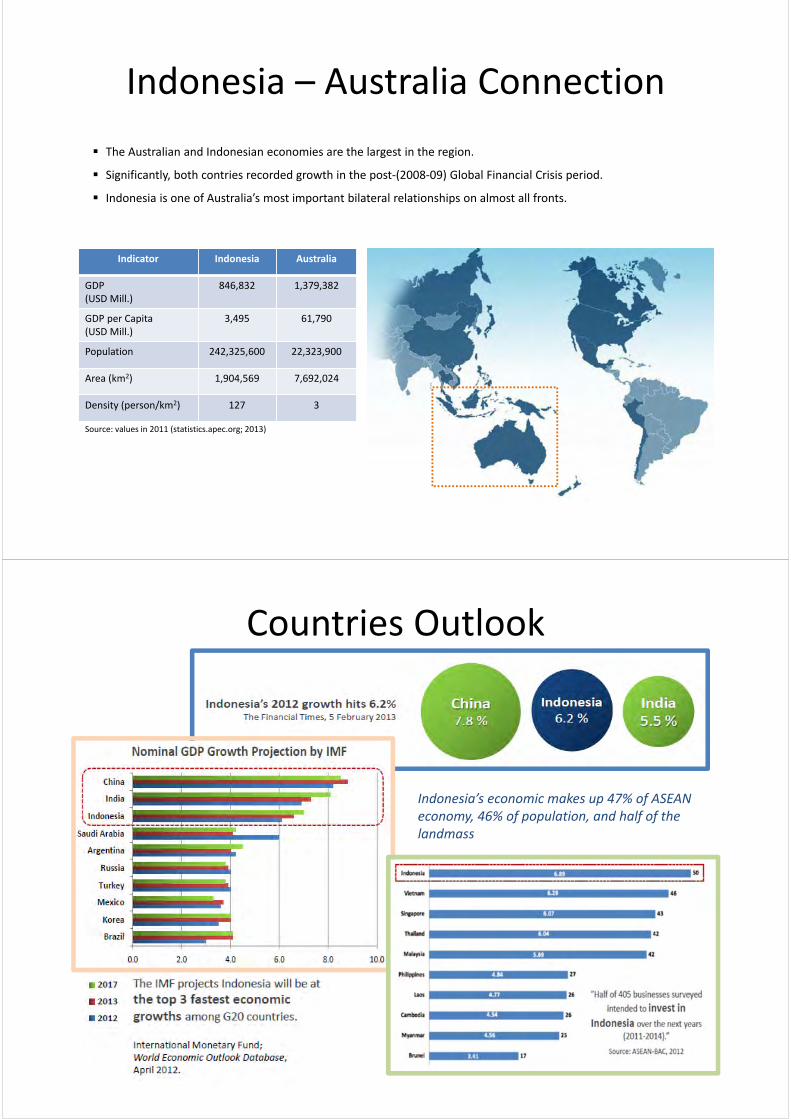
The Australian and Indonesian economies are the largest in the region.
Significantly, both contries recorded growth in the post‐(2008‐09) Global Financial Crisis period.
Indonesia is one of Australia’s most important bilateral relationships on almost all fronts.
Indonesia – Australia Connection
Indicator Indonesia Australia
GDP(USD Mill.)
846,832 1,379,382
GDP per Capita(USD Mill.)
3,495 61,790
Population 242,325,600 22,323,900
Area (km2) 1,904,569 7,692,024
Density (person/km2) 127 3
Source: values in 2011 (statistics.apec.org; 2013)
Countries Outlook
Indonesia’s economic makes up 47% of ASEAN economy, 46% of population, and half of the landmass

Challenge in Connectivity
Connectivity across main corridors is low compared to other countries
0.00 1.00 2.00 3.00
Trip time (hr/100 km)
Vietnam
Indonesia
China
Thailand
Malaysia
High land transport costs – low connectivity of economic centres
Demand growing 8‐10% pa to support growth
Key centres congested, large areas under‐developed
0 0.2 0.4 0.6 0.8
Malaysia
China
Philippines
Thailand
Indonesia
Vietnam
Expressway Density (km/1000 population)
Backlog in Expressway Development
Indonesia
Indonesia
0 1 2 3 4 5 6 7
Developing Asia
ASEAN
Indonesia
China
Thailand
Malaysia
Singapore
Brunei Darussalam
Cambodia
Philippines
Indonesia
Low Competitiveness in InfrastructureQuality of Roads Score (GCI 2013‐2014)
Indonesia
2013‐2014: rank 38
2012‐2013: rank 50
Singapore
2013‐2014: rank 2
2012‐2013: rank 2
Competitiveness ranking (GCI)
Malaysia
2013‐2014: rank 24
2012‐2013: rank 25
Thailand
2013‐2014: rank 37
2012‐2013: rank 38
3.0
3.5
4.0
4.5
5.0
5.5
6.0Institutions
Infrastructure
Macroeconomic
environment
Health andprimaryeducation
Highereducationand training
Goodsmarketefficiency
Labor marketefficiency
Financialmarket
development
Technological readiness
Market size
Businesssophisticatio
n
Innovation
Score 2013‐2014 Score 2012‐2013
• Indonesia’s rank according to GCI 2013‐2014 is improved (rank 38) fromlast year (rank 50).
• Infrastructure rank is also improved (rank 61) from last year (rank 78).
• Quality of overall infrastructure is improved (score 4,0) from last year(score 3,4).
• However, quality of roads score is still below quality of overallinfrastructure score as well as overall competitiveness score.
• Road infrastructure in Indonesia needs to be improved in order toincrease competitiveness.
2012‐20132013‐2014
Challenge in Competitiveness
Reliable Infrastructure is Crucial to Improve Competitiveness

Challenge in Logistics Performance
1
8
18
21
26
29
31
38
46
52
53
59101
109
128
Singapore
Japan
Australia
Korea
China
Malaysia
New Zealand
Thailand
India
Philippines
Vietnam
Indonesia
Cambodia
Laos
Papua NG
Sumber: Logistic Performance Index (The World Bank)
Road infrastructure holds an important role to ensure logistics servicesdelivery.Reliable road infrastructure reduces transportation costs.Road infrastructure development is one of the indicators of logisticsperfomance index and global competitiveness.
The World Bank’s Logistics Performance index (LPi) analyzes countries in six components:1. The efficiency of customs and border management
clearance.2. The quality of trade and transport infrastructure.3. The ease of arranging competitively priced
shipments.4. The competence and quality of logistics services.5. The ability to track and trace consignments.6. The frequency with which shipments reach
consignees within scheduled or expected delivery times.
0
1
2
3
4LPI Score
Customs
Infrastructure
ShipmentsCompetence
Tracking
Timeless
LPI 2012 RANKING
National Connectivity
zzzz
Production center and natural resources processing and national energy resources
Production center and mining product processing
and national energy resources
National production center and agriculture, fishery,
plantation, oil, gas and mining products processing
National industrial and services support National tourism gate and
national consumable goods support
National energy, consumable goods, fishery and mining development

STATUS
GROUND BREAKINGUP TO JULY 2013
TOTAL
Investment Cost : USD 64.746 Bill
No. of Project : 240 Projects
SECTOR
Investment Cost : USD 36.446 Bill
No. of Project : 94 Projects
INFRASTRUCTURE
Investment Cost : USD 28.300 Bill
No. of Project : 146 Projects
VALIDATION RESULTUP TO JULY 2013
TOTAL
Investment Cost : USD 448,100 Bill
No. of Project : 1,568 Projects
SECTOR
Investment Cost : USD 217,700 Bill
No. of Project : 583 Projects
INFRASTRUCTURE
Investment Cost : USD 230,400 Bill
No. of Project : 985 Projects
MP3EI LAUNCHING27 MAY 2011
TOTAL
Investment Cost : USD 401,200 Bill
No. of Project : 1,264 Projects
SECTOR
Investment Cost : USD 222,600 Bill
No. of Project : 639 Projects
INFRASTRUCTURE
Investment Cost : USD 178,600 Bill
No. of Project : 625 Projects
VALIDATION
Validation result exclude Human Resources Investment in Science and Technology with total amount of USD 2,170 Mill.
PROGRESS OF MP3EI
Ferry AH-2 to AH-25 Sumatera to Java Island
= 14 mile, served by max of 24 Ro-Ro Ferrys
(±3.5 trip time)
Ferry to/from Singapore (Efficiency and
CompetitivesnessProposed to be studied)
AH Route
Width (KM)
< 6 M6 – 7 M
7 – 14 M
>14 M Total
AH‐2 16 573 676 420 1685
AH‐25 512 1836 318 98 2764
AH‐150 2779 342 291 52 3464
AH Route
Condition (%)
Good Fair Bad
AH‐2 58 38 4
AH‐25 61 35 4
AH‐150 78 17 5
Progress per December 2012
Current Progress on ASEAN Highways Network

Route ItineraryLength
(km)Transit Route
Sumatera Island
AH-25 Banda Aceh-Medan-Dumai-Pekanbaru-Jambi-Palembang-Bakauheni.Ferry:Bakauheni-Merak
2,746.57 non-toll roadwith 42.7 toll road as
alternative route
Y
AH-151 Tebing Tinggi-Pematang siantar-Bukit Tinggi-Padang-Muara Bango-Sarolangun-Lubuk Linggau-Lahat-BatuRaja-Bandar Lampung
1,968.42 N
Java Island
AH-2 Merak – Jakarta – Semarang – Surakarta – Surabaya – Ketapang, Cikampek – Bandung.Ferry:Ketapang-Gilimanuk
1,525.862 non-toll roadWith 541,16 toll road as
alternative route
Y
AH-152 Jakarta – Sukabumi – Bandung – Cilacap –Yogyakarta - Kertosono
833.766 N
Bali Island
AH-2 Gilimanuk - Tabanan – Denpasar – Tuban 159.334 Y
Kalimantan Island
AH-150 Pontianak-Pangkalanbun-Palangkaraya-Banjarmasin-Balikpapan-Samarinda-Bontang-Tanjung Selor-Malinau-Simanggaris
3,390.742 N
ASEAN and Asian Highways Routes
16
Bandung
Jawa Barat
JakartaSerang
Surabaya
Yogyakarta
Semarang
DKI
Banten
DIY
Jawa Tengah
Jawa Timur
Kertosono
Mojokerto
Pejagan Pemalang
Batang
Cikampek
Palimanan
Solo
Ngawi
Pasuruan
Probolinggo
Banyuwangi
Kanci
SukabumiCiranjang Demak
Malang
Pandaan
Gempol
Bogor
288 KM 177,12 KM 76,77 KM
(K)
TRANS JAVA TOLL ROAD
73 KM
1
243
6
57
8
9Legend:: Operated: Land Acquisition and Construction: Preparation
Total investment cost : USD 5,141 Mill.Total land acquisition cost : USD 509 Mill.Total length : 615 Km
Section Number
Toll Road Cikampek – Palimanan Pejagan -Pemalang
Pemalang -Batang
Batang -Semarang
Semarang - Solo Solo - Ngawi Ngawi - Kertosono Kertosono -Mojokerto
Mojokerto -Surabaya
Toll Road Company PT.Lintas Marga Sedaya
PT. Pejagan Pemalang Toll
Road
PT. Pemalang Batang Toll
Road
PT. Marga Setia Puritama
PT. Trans Marga Jateng
PT. Solo Ngawi Jaya PT. Ngawi Kertosono Jaya
PT. Marga Harjaya
Infrastruktur
PT. Marga Nujyasumo
Agung
Length (km)/No. of Section 116/6 58/4 39/2 75/5 73/5 90/4 87/4 41/4 36/5
Investment Cost (USD Mill.) 1,260 552 408 723 621 514 383 348 340
Land Acquisition Cost (USD Mill)
55 25.4 18 58.4 92.7 99.5 86.4 29.7 46.1
Target Operation 2014 2014 2014 2015 2014 2014 2014 2014 2014
Concession period (year) 35 45 45 45 45 35 35 35 42
Progress
Land Acq. *) 100,00% 28,72% 1,86% 3,33% 38,95% 82,67% 51,27% 87,00% 64,71%
Construction 2,90% - - - 30,18%Total GOI TRC Total GOI TRC
38,55% 31,06% 11,98% 48% -. - - -
1 2 3 4 5 6 7 8 9
*) Status: 23 August 2013*) Assumption: 1 USD = Rp. 10,000
Trans Java Toll Road

Bakaheuni ‐ Indralaya
Indralaya ‐ Pekanbaru
Pekanbaru ‐Medan
Medan ‐ Aceh
PKN
HGH Sumatera consists of:Bakauheni‐ Banda Aceh corridor (Eastern Corridor, total length of ±2.017 Km)Feeder, total length of +720 Km
Connecting 8 cities (National Activity Center/PKN), 8 airports, 6 international portsConnected to Sunda Strait Bridge and Trans Java Toll RoadPart of ASEAN/ASIAN HighwaysOperation of Trans Sumatera Toll Road will reduce traffic load and road maintenance costs
High Grade Highway Sumatera
Sunda Strait Infrastructure and Strategic Region Development
Sunda Strait Infrastructure and Strategic Region Development
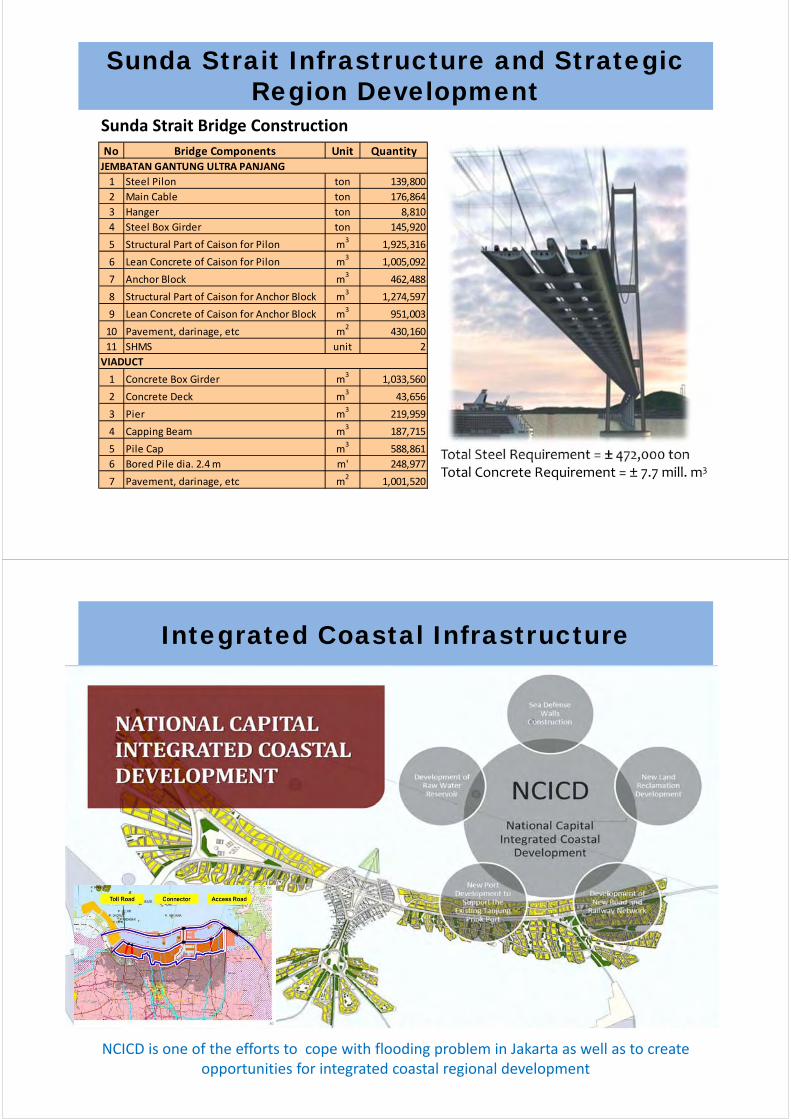
Sunda Strait Bridge Construction
No Bridge Components Unit Quantity
1 Steel Pilon ton 139,800
2 Main Cable ton 176,864
3 Hanger ton 8,810
4 Steel Box Girder ton 145,920
5 Structural Part of Caison for Pilon m3
1,925,316
6 Lean Concrete of Caison for Pilon m3
1,005,092
7 Anchor Block m3
462,488
8 Structural Part of Caison for Anchor Block m3
1,274,597
9 Lean Concrete of Caison for Anchor Block m3
951,003
10 Pavement, darinage, etc m2
430,160
11 SHMS unit 2
1 Concrete Box Girder m3
1,033,560
2 Concrete Deck m3
43,656
3 Pier m3
219,959
4 Capping Beam m3
187,715
5 Pile Cap m3
588,861
6 Bored Pile dia. 2.4 m m' 248,977
7 Pavement, darinage, etc m2
1,001,520
JEMBATAN GANTUNG ULTRA PANJANG
VIADUCT
Total Steel Requirement = ± 472,000 tonTotal Concrete Requirement = ± 7.7 mill. m3
Integrated Coastal Infrastructure
NCICD is one of the efforts to cope with flooding problem in Jakarta as well as to create opportunities for integrated coastal regional development
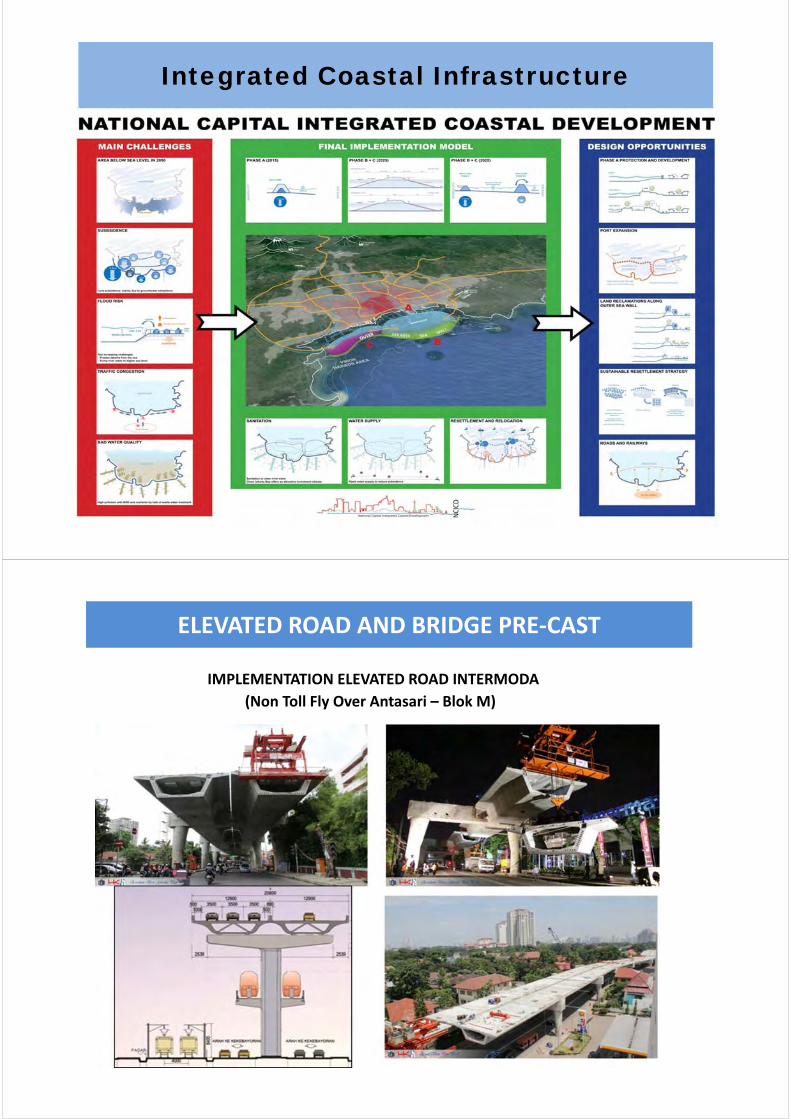
Integrated Coastal Infrastructure
ELEVATED ROAD AND BRIDGE PRE‐CAST
IMPLEMENTATION ELEVATED ROAD INTERMODA
(Non Toll Fly Over Antasari – Blok M)

BALI MANDARA TOLL ROAD AND DEWARUCI INTERCHANGE (UNDERPASS AND FLYOVER)
Dewaruci Interchange (Underpass and Fly over)
BALI MANDARA TOLL ROAD

Infrastructure Investment Requirement (2010-2014)
(Gap)
Source: Bappenas 2011
Initial Target: ID
R 1,429 Trillion
Investment Requirement and Funding Sources (2010‐2014)
IDR Trillion
Total : ID
R 1.429 Trillion
National BudgetIDR 559.5 Trillion
Local Govt. BudgetIDR 355 Trillion
Private SectorIDR 344.7 Trillion
State Owned CompanyIDR 340.8 Trillion
Total Investment Requirement Estimated Financing Capacity Gap
Infrastructure Investment Gap (2010-2014)
2009 2010 2011 2012 2013 2014Total
2010‐2014
Growth (%)1)
4.6 6.2 6.5 6.2 6.3 6.4
GDP (IDR Trillion)1)
5.606,2 6.436,3 7.427,1 8.179 9.284 10.583 41.909,4
Total Infrastructure Allocation1)
218,65 263,9 314,1 385,2 438,1 469,15 1.870,42
Infrastructure Investment Requirement 5% of GDP (IDR Trillion)
3) 280,3 321,8 371,4 409 464,2 529,2 2.095,64)
Infrastructure Investment Requirement 7% of GDP (IDR Trillion)
2) 392,4 450,5 519,9 572,5 649,9 740,8 2.933,6
Requirement Gap of Infrastructure Investment 5% of GDP (IDR Trillion)
3) 61,65 57,9 57,3 23,8 26,1 60,05 225,18
Requirement Gap of Infrastructure Investment 7% of GDP (IDR Trillion)
3) 173,75 186,6 205,8 187,3 211,8 271,65 1.123,18
Allocation for Ministry of Public Works36,1
16,51%37,7
14,29%56,9
18,12%75,5
19,6%83,2
19,17%84,1
17,93%337,4
18,04%
Remarks:1)Source: National Budget Plan 2014
2) Minimum requirement of 7% based on RPJMN 2010‐2014
3)Analysis Result
4) Analysis in year 2011 = IDR 1,923 Trillion and has been reviewed to IDR 2,095 Trillion

Innovative Delivery in Toll Road Development
Land Acquisition
New InnitiativeCurrent Practice
Financing Facilities
PPP Modality
Procurement
Concession Agreement and Contingent Liability
• Presidential Decree No. 36/2005 as amended with Presidential Decree No. 65/2006
• Financed by TRC (pre financed by BLU)• Implemented by Government
• UU Pengadaan Tanah Bagi Kepentingan Umum No.2/2012
• Dibiayai dan dilaksanakan oleh Pemerintah
• TRC and bank syndication • TRC and bank syndication• SMII/IIF
• BOT • BOT• SBOT• Annuity Based Project• Leasing• Outsourcing
• Mainly solicited• Solicited• Unsolicited
• Standard minimum• No government guarantee
•Better risk allocation•Government guarantee by PT.PII
Government support
• From sector (related Ministry) • Sectoral contribution from related Ministry
• VGF by Ministry of Finance
New Models for Government co‐funding in Infrastructure Development
• Enhanced financial Impact (retain risks, achieve cost efficiency and apply user charges)
• Increased leverage (impact on balance sheet and ability to attract private sector capital)
Model 1: Public sector subordinated notes
Transfer of demand risk to private sector with defined public sector support (subordinate loan) for any funding gapSubordinated loans are repaid after debt service on senior loans but before returns to equity
Model 2:Public sector debt capital
Government co‐lending on equal basis with commercial debt
Model 3:Public sector minimum guarantees
Government support for demand risk until a threshold is metGovernment would provide minimum patronage or revenue guarantees for a defined period
Model 4:Public sector development company (with traditionally
delivered infrastructure)Government through public sector development company would design, finance, and build the asset and maintain and operate it in the initial years Government retains substantially all project risks (until divested)
Model 5:Public sector development company (with availability based
PPP delivered infrastructure)Government retains demand risk (until divested) Payment by the government to the Concessionaire based on the availability of the asset after construction
Model 6:Alternative new funding models
Tax Increment Financing: Use the revenue generated by infrastructure development, specifically an increase in local/state taxes due to increase in property values to repay loan used to fund new infrastructureInfrastructure bonds has focused on leveraging private investment through: i) Create a tax incentive by allowing interest in infrastructure bonds to be tax deductible for issuers but tax exempt for investors and ii) provide some form of credit enhancement through government guarantees
Source: Funding Infrastructure: Time For A New Approach? (pwc.com.au/industry, 2013)

Reliable infrastructure is prerequisite to improveIndonesia’s competitiveness in the global world.
To support Bogor Goals, Ministry of Public Works supportsinfrastructure connectivity as one of crucial aspects inreducing and eliminating non‐tariff barriers to trade andinvestment.
The efforts are among others in form of ASEAN and AsianHighway development, Trans Sumatera Toll Road, TransJava Toll Road and Sunda Strait Bridge Development Plan.
In realizing such programs, the main issues faced today arerelated to the land acquisition process and low feasibility ofthe projects (the need for Government support andguarantee to increase the project’s attractiveness to theprivate sector).
Innovative delivery is needed in infrastructure funding tosupport Public Private Partnership in infrastructureprovision.
Conclusion
THANK YOU
MINISTRY OF PUBLIC WORKS


