
NREL is a national laboratory of the U.S. Department of Energy, Office of Energy Efficiency and Renewable Energy, operated by the Alliance for Sustainable Energy, LLC.
Overview of Fuel Cell Electric Bus Development
Leslie Eudy, National Renewable Energy Laboratory
September 12, 2013

2
Why Fuel Cells for Transit Buses? • Reduce transit bus emissions • Improve fuel efficiency • Improve vehicle performance • Consumer Acceptance • Transit industry is excellent test-bed for new
technologies o Centrally fueled and maintained o Fixed routes with urban stop-go duty cycle o Professional operators and mechanics o Federal Capital Funding Support o High Visibility & High Impact

3
FCEB Development Timeline since 2000
California Air Resources Board Transit Rule
Early demonstrations of single prototypes
DOE begins funding NREL technology validation for FCEBs
First multiple bus fleet demonstrations in California
FTA initiates National Fuel Cell Bus Program and funds NREL technology validation
First larger-scale FCEB fleet introduced
First new NFCBP bus goes into service
DOE/DOT establish commercialization targets
2000 2001 2002 2003 2004 2005 2006 2007 2008 2009 2010 2011 2012

4
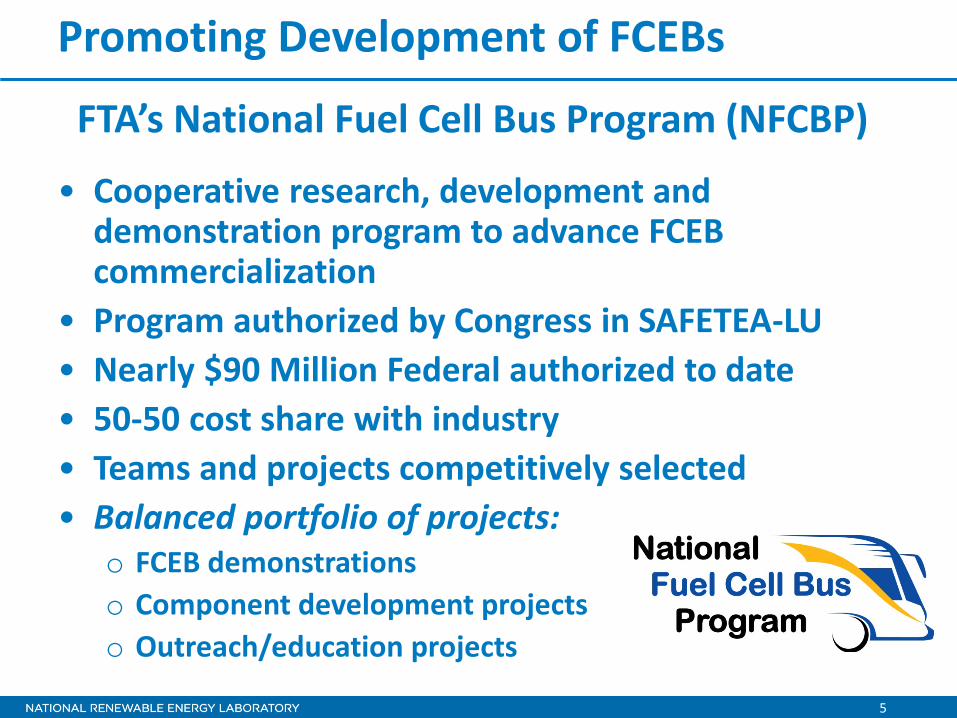
Promoting Development of FCEBs
• Set more stringent emission standards for new urban bus engines
• Set fleet emission averages • Promoted advances in the cleanest technologies:
required demonstrations of zero-emission buses o Fuel cell electric, battery electric, or trolley buses o Early demonstrations of 8 FCEBs at 3 agencies o Advanced demonstration: 12 FCEBs for SF Bay area
California Air Resources Board Transit Rule
5
• Cooperative research, development and demonstration program to advance FCEB commercialization
• Program authorized by Congress in SAFETEA-LU • Nearly $90 Million Federal authorized to date • 50-50 cost share with industry • Teams and projects competitively selected • Balanced portfolio of projects:
o FCEB demonstrations o Component development projects o Outreach/education projects
Promoting Development of FCEBs
FTA’s National Fuel Cell Bus Program (NFCBP)

6
2012 Awards announced September 4th
Promoting Development of FCEBs
FTA’s National Fuel Cell Bus Program (NFCBP)
Project Consortia Location Partners FCEB Fleet Extended Operation (ZEBA) CTE Oakland, CA AC Transit
American Fuel Cell Bus CALSTART Cleveland, OH Greater Cleveland RTA, ElDorado National, BAE Systems, Ballard Power Systems
Battery Dominant FCEB CALSTART Palm Springs, CA SunLine, ElDorado National, BAE Systems
Central NY Fuel Cell Transportation Program CTE Ithaca, NY
Tompkins Consolidated Transit Authority, ElDorado National, BAE Systems, Ballard Power Systems
Birmingham FCEB Operational Support CTE Birmingham, AL Birmingham Jefferson County Transit
FCEB Altoona Testing CALSTART Altoona, PA National Bus Testing Facility Best Practices in H2 fueling and maintenance CALSTART Pasadena, CA CALSTART
NFCBP Education & Outreach CTE Atlanta, GA CTE

7
Technology Readiness Levels
Bus OEM Length
(ft) Fuel Cell System Hybrid System Design Strategy Energy Storage TRL Level
Van Hool 40 UTC Power Siemens ELFA
integrated by Van Hool Fuel cell dominant Lithium-based batteries 7
New Flyer 40 Ballard Siemens ELFA
integrated by Bluways Fuel cell dominant Lithium-based batteries 7
ElDorado 40 Ballard BAE Systems Fuel cell dominant Lithium-based batteries 7
Proterra 35 Hydrogenics Proterra integration Battery dominant Lithium-based batteries 6
Daimler (Orion)
40 Hydrogenics BAE Systems Diesel hybrid w/
FC Lithium-based batteries 6 - 7
Ebus 22 Ballard Ebus integration Battery dominant Nickel cadmium 6
Manufacturer Teams for FCEBs Currently Operating in the United States

8
0
1
2
3
4
5
6
7
8
9
10
Aug-12 Sep-12 Oct-12 Nov-12 Dec-12 Jan-13 Feb-13 Mar-13 Apr-13 May-13 Jun-13 Jul-13
Mile
s pe
r DG
E
ZEBA Nutmeg AT Bus AFCB
TX Proterra SL CNG ACT Diesel CTT Diesel
DOE RD&D
Data Collection & Validation
DOT Deployment
DOE – DOT Collaborations
Accomplishments
Demonstrated: • Nearly doubled fuel economies (>7 mpg, ~2X
compared to diesel buses) • 87% increase in average miles between roadcall for
all bus systems (~4,200 MBRC) • Demonstrated more than 13,000 hr fuel cell durability
Fuel Cell buses: 82% to 131% better fuel economy than
conventional buses
Developed low Pt approach Reduced cost by >30% since 2008, 80% since 2002 NREL
National Bus Program ($49 million for 4 years)
DOE and DOT support the development and deployment of fuel cell technology

Global Fuel Cell Bus Activities
September 12, 2013
Lauren Justice Project Manager, CTE

Global Overview
• US – National Fuel Cell Bus Program – ZEBA
• Europe – Fuel Cell Hydrogen Joint Undertaking – High V.LO City
• Canada • India, South America, China

Active US FC Bus Operations Site Fleet
Size Manufacturer Team Fuel Economy
Achievement
AC Transit ZEBA
12 Van Hool, ClearEdge*, Siemens
7.55 mi/DGE**
Nutmeg: CT, Flint, & Cleveland
4 Van Hool, ClearEdge*, Siemens
6.72 mi/DGE (CTTransit)
SunLine AT 1 New Flyer, Ballard, Siemens
5.29 mi/DGE
SunLine All American
1 ElDorado, Ballard, BAE
6.93 mi/DGE
TOTAL 18
* Formerly UTC Power ** Diesel Gallon Equivalent

Current US FC Bus Accomplishments From NREL’s FC Bus Technology Evaluation*:
* NREL 2013 Annual Merit review presentation

Current US FC Bus Accomplishments From NREL’s FC Bus Technology Evaluation*:
* NREL 2013 Annual Merit review presentation

Planned US FC Bus Operations Site Fleet
Size Location Manufacturer Estimated
delivery SunLine All American 2 Thousand
Palms, CA ElDorado, Ballard, BAE Late 2014
Chicago All American 1 Chicago, IL ElDorado, Ballard, BAE Early 2014
CT All American 1 Hartford, CT ElDorado, Ballard, BAE Early 2015
Proterra Next Generation
1 Austin, TX & DC
Proterra, Hydrogenics, USHybrid
Early 2014
EVAmerica 1 Birmingham, AL EVAmerica, Ballard, EPC Fall 2013
Compound Hybrid 1 San Francisco, CA
Daimler, Hydrogenics, BAE Fall 2013
TOTAL 7

Current European FC Bus CHIC Projects Site Fleet Size Duration Manufacturer Recent Achievements
Hamburg, Germany
4 (3 more 2013)
2011-2017 Daimler/Evobus, AFCC
Fuel economy: 8.76 mi/DGE
Aargau, Switzerland
5 2011-2016 Daimler/Evobus, AFCC
Fuel economy: 8.76-10 mi/DGE
Milan, Italy 3 2011-2016 Daimler/Evobus, AFCC
London, UK 4 (3 more 2013)
2011 Wrightbus, Ballard
8.15 mi/DGE; Avail=51% (& improving); 156,187 mi
Oslo, Norway 5 2012-2017 Van Hool, Ballard
Cologne, Germany
2 2011- APTS, Ballard, Vossloh
70% availability
TOTAL 23

Next European FC Bus Projects Site Fleet
Size Demo Start Manufacturer
Bolzano, Italy 5 Exp. Deliv. Yr end 2013 Daimler/Evobus
High V.LO City - San Remo, Italy
5 Exp. Deliv. Yr end 2013 Van Hool
High V.LO City -Aberdeen, Scotland
4 Exp. Deliv. Yr end 2013 Van Hool
High V.LO City -Brussels, Belgium
5 Exp. Deliv. Early 2014 Van Hool
TOTAL 19

Europe’s FCB Adoption : Strategic Regions
• FCH JU Study: Urban Buses: Alternative Powertrains for Europe
• Next phase of Powertrain study – Will detail EU roadmap for hydrogen and FC in transit
• FCH-JU released RFP for new demonstrations – Projects must have 5 buses/site
– Priority given to linking hydrogen networks
– Strong interface with renewable hydrogen production

Other FCB Projects Worldwide
Fleet Size
Manufacturer Team
Details
ACTIVE: Whistler, Canada / BC Transit
20 New Flyer/Ballard Demo: 2010-2014
ACTIVE: Japan 6 (various locations)
Toyota 2005 models
PLANNED: Sao Paolo, Brazil
3 + 25 Tutto/Ballard
PLANNED: India 12 Tata/Ballard First bus in testing
PLANNED: China Ballard/Azure Signed MOU
PLANNED: Korea Hyundai Unveiled in 2009

October Workshop

FCB rollout strategy California Nico Bouwkamp
September 12, 2013
1

California and the future
9/12/2013 2
“How can FCEBs become one of the advanced vehicle technologies that transit agencies will choose to
fulfill California’s goal of decreasing transportation air pollution?”
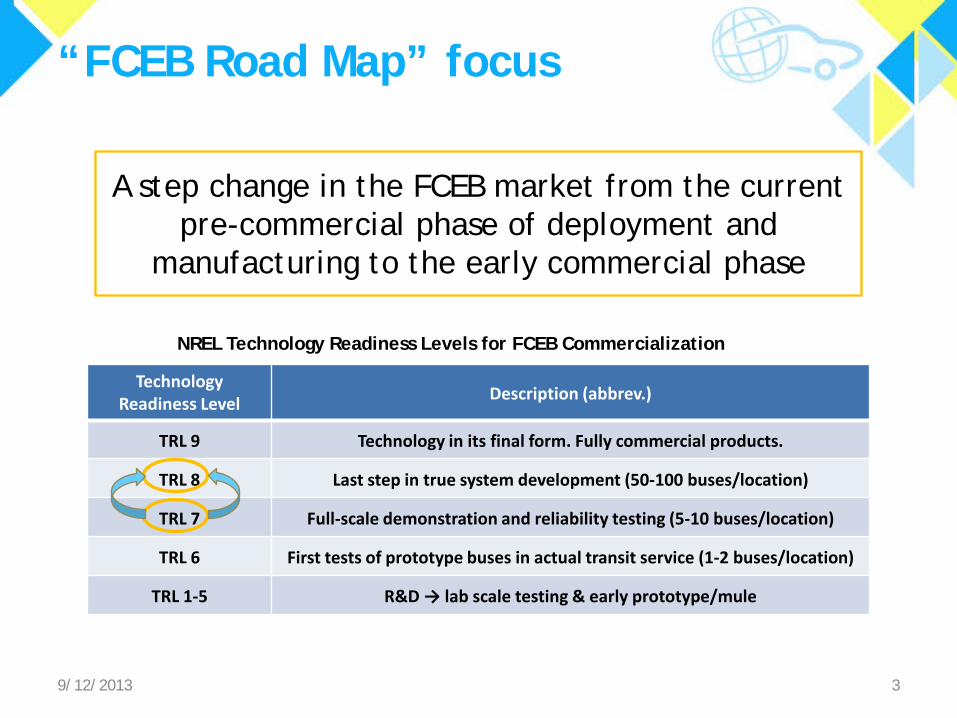
“FCEB Road Map” focus
9/12/2013 3
Technology Readiness Level Description (abbrev.)
TRL 9 Technology in its final form. Fully commercial products.
TRL 8 Last step in true system development (50-100 buses/location)
TRL 7 Full-scale demonstration and reliability testing (5-10 buses/location)
TRL 6 First tests of prototype buses in actual transit service (1-2 buses/location)
TRL 1-5 R&D → lab scale testing & early prototype/mule
NREL Technology Readiness Levels for FCEB Commercialization
A step change in the FCEB market from the current pre-commercial phase of deployment and
manufacturing to the early commercial phase

US DOE / US DOT targets
9/12/2013 4 http://hydrogen.energy.gov/pdfs/12012_fuel_cell_bus_targets.pdf
TRL 7 TRL 8 TRL 9

FCEB rollout strategy
9/12/2013 5
Goal » Move FCEB deployment and manufacturing from pre-
commercial (2012-2015) to early commercial (2016-2017)
Major objectives » Create two Centers of Excellence One in Northern and one in Southern California
» Achieve US DOE/US DOT 2016 FCEB targets » Provide information to support state and federal decision
making
AC Transit fueling station (Photo courtesy of L. Eudy, NREL)

Centers of Excellence
Key components
• A single bus configuration per site, manufactured under a serial production run of 40 units over 1 to 2 years
• Vehicles meet transit agency requirements & operate in revenue service on scheduled runs (e.g. no compromise or deviation in service)
• A 12-year operating period
• A single H2 fueling station with sufficient throughput to achieve fuel cost/mile comparable to conventional buses
• Vehicles introduced in 2015-16 timeframe
• Regional training and education for transit staff and stakeholders
6

Fueling station assumptions
Category Details
Station lifetime 15-20 years Fuel quality SAE J2719 Fuel pressure 35 MPa Fill time per bus (pending on bus design) 5-8 minutes Average fill amount per bus 30 kg/day Station capacity (based on 30 kg/day/bus, 40 FCEBs)
1,200 kg/day
Number of dispensers capable of fueling simultaneously
2 dispensers
Bus fleet fueling window 4-5 hours/day
7

Financial budget (TRL 7→8) • For 12-yr deployment capital cost per site is $50.2M • At $1M/bus the incremental cost is ~$30M/location compared to
conventional buses (bus cost only)
• Fuel and station O&M cost paid by vehicle operator » $4-9 kg (depending on mode of supply) and O&M ~$200,000/year
• Costs could be reduced by utilizing existing infrastructure
8
Capital equipment Units per Center of Excellence
Capital cost per location
Capital cost for two Centers of Excellence
FCEBs 40 $40M $80M
H2 station 1 $5M $10M
Maintenance facility 1 $2M $4M
Mid-life overhaul of bus power plant (6 yrs) 40 $3.2M $6.4M
Total n/a $50.2M $100.4M

Funding scenario
Typical funding (bus only): US DOT FTA 80% - local sources 20%
9
Funding source % of CoE
US DOT FTA Conventional 47%
California Energy Commission AB118 19%
Cap and Trade Auction Proceeds 19%
California Air Resources Board Hybrid Voucher Program 7%
Air Quality Management Districts 5%
Regional Matching Funds 2%
Total 100%

10
- Include 2 CoE concept in 2013 ZEV Action Plan
- CA/federal government identify & implement funding conditions
- Develop & release procurement documentation
- Validate & verify incremental cost FCEBs
- Complete procurement contracting
- Centers of Excellence operational
- Include large scale production run in ZBus regulatory planning
- Leverage state funding for federal government funding
- Station & vehicle commissioning
2013
2014
2016
2015
!! Continued NREL FCEB data collection !!

CaFCP Members Air Liquide Air Products Alameda-Contra Costa Transit District Automotive Fuel Cell Cooperation Ballard Power Systems California Air Resources Board California Department of Food and
Agriculture California Energy Commission California State University-Los Angeles Center for Energy Efficiency and
Renewable Technologies Chrysler Daimler Energy Independence Now General Motors Honda Hydrogenics
Hyundai Institute of Transportation Studies, UC Davis Linde North America, Inc. National Fuel Cell Research Center, UC Irvine National Renewable Energy Laboratory Nissan Powertech Labs Proton OnSite Sandia National Laboratories South Coast Air Quality Management District Southern California Gas Company SunLine Transit Agency Toyota U.S. Department of Energy U.S. Department of Transportation U.S. Environmental Protection Agency US Hybrid Volkswagen
11

Questions or comments?
Nico Bouwkamp [email protected]
(916) 375-8050
12
Available at: http://cafcp.org/carsandbuses/busroadmap
Thank You
hydrogenandfuelcells.energy.gov


