Presented To:
IAEA ORP 2014 2nd International Conference on Occupational Radiological Protection Vienna, Austria - December 1- 5, 2014
Overview of Occupational
Radon Exposure - Past,
Present and Future
Presented By:
Douglas Chambers
Session 8: Occupational Radiation Protection
in the Workplaces Involving Exposure to Radon
1
Every thing is naturally
radioactive
Uranium-238, radium-226 and
radon-222 are ubiquitous
2
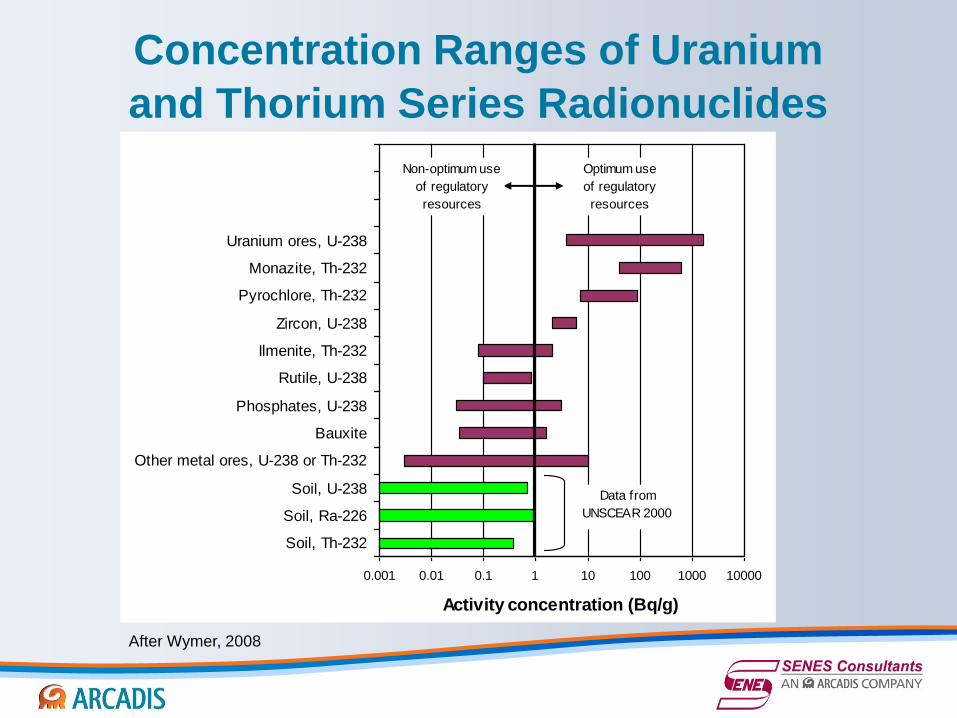
Concentration Ranges of Uranium
and Thorium Series Radionuclides
0.001 0.01 0.1 1 10 100 1000 10000
Soil, Th-232
Soil, Ra-226
Soil, U-238
Other metal ores, U-238 or Th-232
Bauxite
Phosphates, U-238
Rutile, U-238
Ilmenite, Th-232
Zircon, U-238
Pyrochlore, Th-232
Monazite, Th-232
Uranium ores, U-238
Activity concentration (Bq/g)
Data from
UNSCEAR 2000
Non-optimum use
of regulatory
resources
Optimum use
of regulatory
resources
After Wymer, 2008
Recognition of lung cancer as a risk
to miners Mining of metals and minerals has been taking place for
thousands of years
in the 15th century a large silver deposit was discovered at
Joachimsthal in Bohemia which was the basis for Agricola’s
treatise on mining De Re Metallica
as early as Agricola, there was a recognition of an unusually high
incidence of a fatal lung disease in miners
the unusual, lung disease was eventually (500 years later)
recognized as lung cancer
which was reported to have caused up to 70% of the miners’
deaths
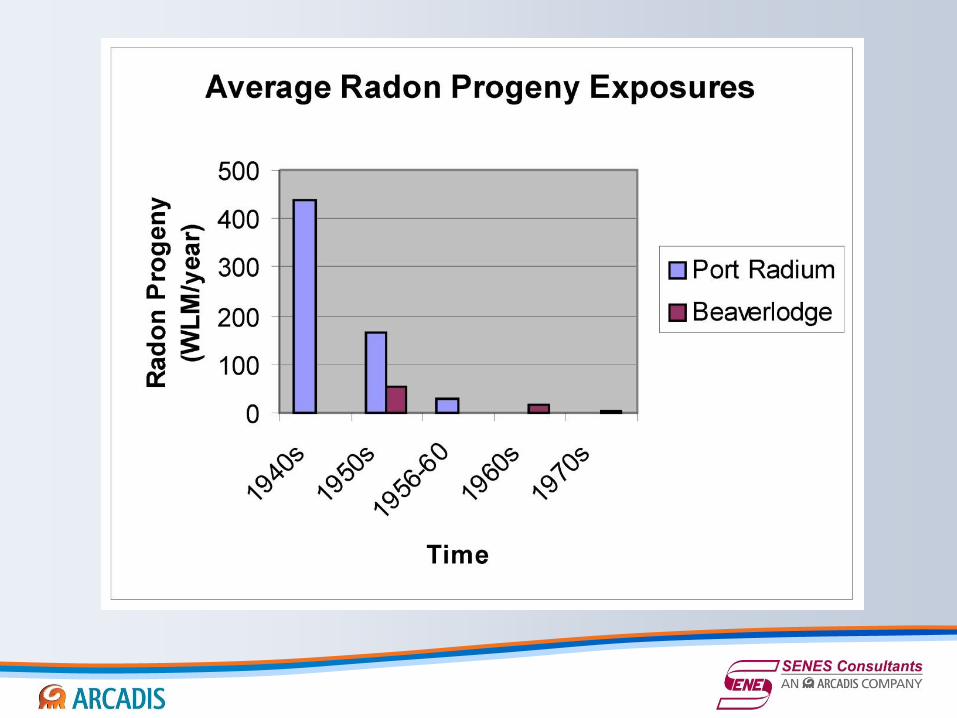
radon levels in these medieval mines were thought to have had
radon progeny levels ranging from 30 to 150 WL.
4
Motivation for Occupational Radon
Guidance
By the mid 1950’s, there was a global
awareness of the risk of lung cancer in
miners. This drove the development of
radiation protection guidelines for radon and
consequent parallel changes to mining
methods and ventilation practices which
resulted in substantial improvements in radon
levels in uranium mines
Evolution of regulation is illustrated by the US
experience
5
Evolution of Radon Standard
in the USA -1
The United States uranium industry began after World
War II when the government began to buy uranium.
Early mine operators knew nothing of the hazard of
exposure to radon and no government agency had the
authority to regulate the health and safety of miners.
In 1949, the U.S. Public Health Service became
concerned about the potential hazard based on the
experience of the Joachimsthal/Schneeberg mines.
Measurements in about 40 mines in Utah and
Colorado and confirmed high concentrations
averaging over 92,000 Bq/m3 (2,500 pCi/L ).
6
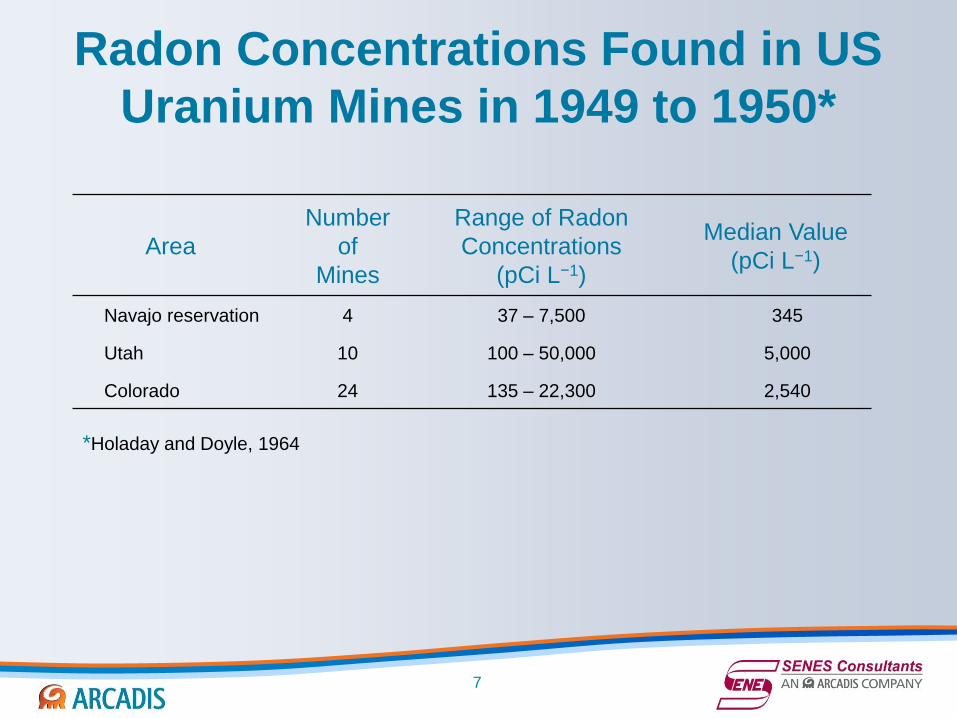
Radon Concentrations Found in US
Uranium Mines in 1949 to 1950*
7
*Holaday and Doyle, 1964
Area
Number
of
Mines
Range of Radon
Concentrations
(pCi L−1)
Median Value
(pCi L−1)
Navajo reservation 4 37 – 7,500 345
Utah 10 100 – 50,000 5,000
Colorado 24 135 – 22,300 2,540
Evolution of Radon Standard
in the USA - 2 Beginning in 1954, the U.S. Atomic Energy Commission
had regulatory authority over the uranium industry
after the material was mined but had no authority to regulate the
mining industry.
There were no mining industry standards and no personnel
experienced in assessing the hazard within the mining community.
In 1955, the Public Health Service developed the concept of
expressing a tolerance level in terms of the potential alpha
energy of radon decay products in air
In 1958, the Nuclear Standards Board of the American
National Standards Association (later Institute),
established a committee to develop a standard for uranium
mines and mills.
8
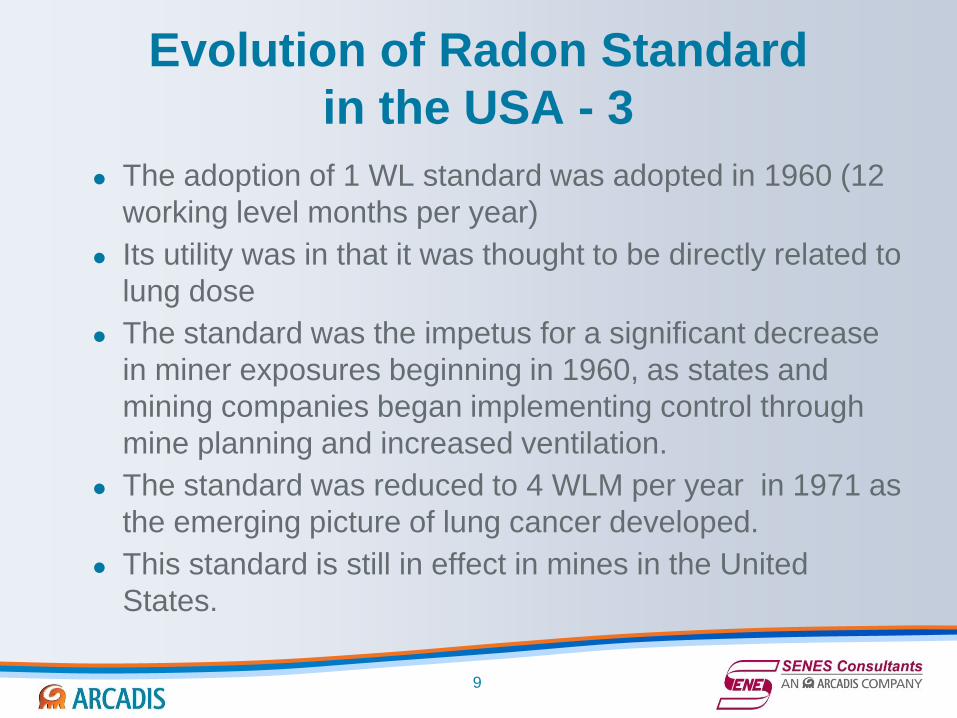
Evolution of Radon Standard
in the USA - 3
The adoption of 1 WL standard was adopted in 1960 (12
working level months per year)
Its utility was in that it was thought to be directly related to
lung dose
The standard was the impetus for a significant decrease
in miner exposures beginning in 1960, as states and
mining companies began implementing control through
mine planning and increased ventilation.
The standard was reduced to 4 WLM per year in 1971 as
the emerging picture of lung cancer developed.
This standard is still in effect in mines in the United
States.
9
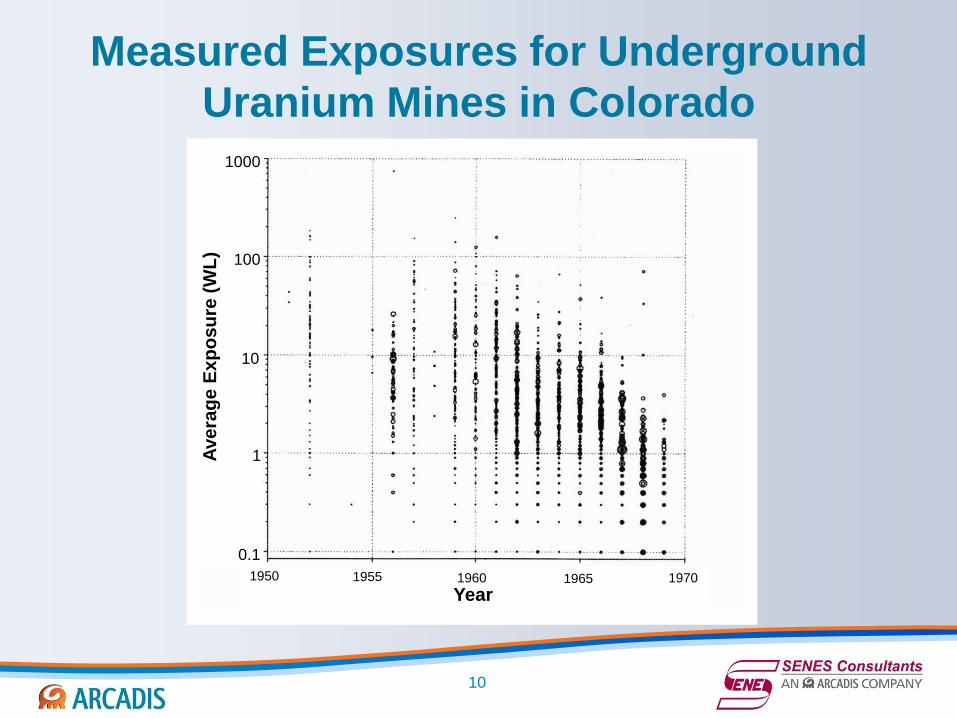
Measured Exposures for Underground
Uranium Mines in Colorado
1950 1955 1960 1965 1970
Year
1000
100
10
1
0.1
Ave
rag
e E
xp
os
ure
(W
L)
10
11
Epidemiological Studies of Miners
Considered in UNSCEAR 2006 – Annex E
Colorado Plateau
Ontario
Czech
Swedish Iron
Beaverlodge
Wismut
Port Radium
French Uranium
Chinese (uranium and tin)
Newfoundland (fluorspar)
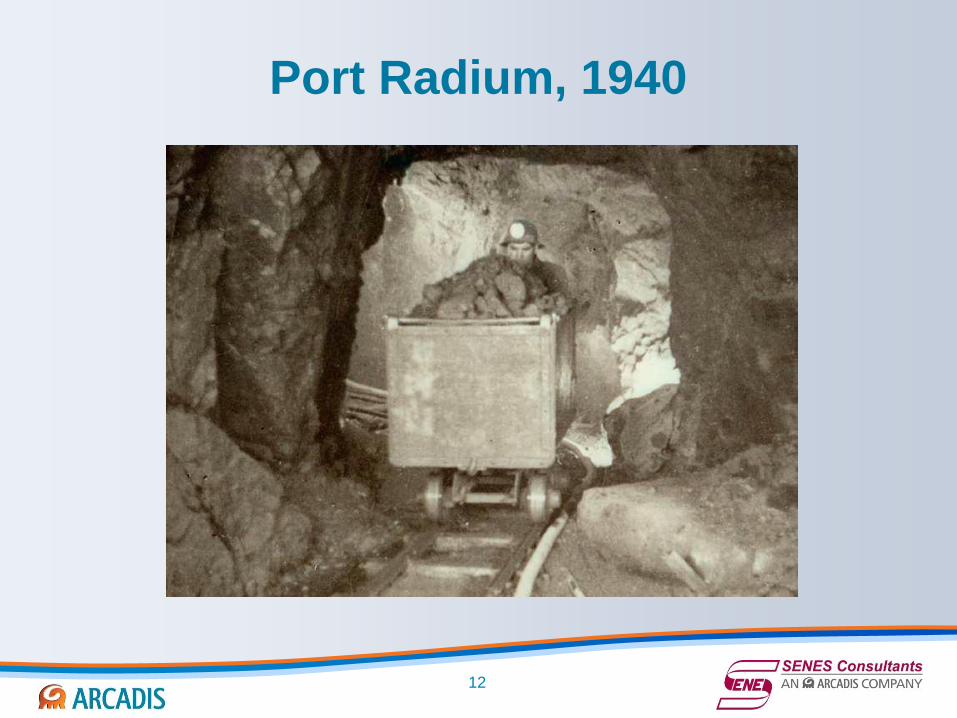
Port Radium, 1940
12
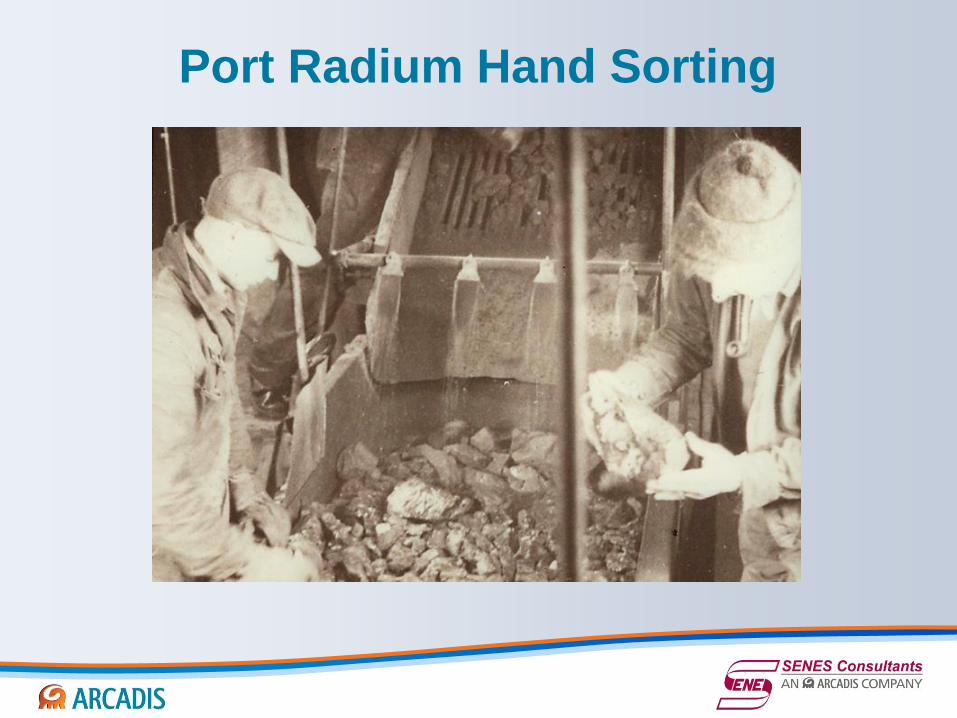
Port Radium Hand Sorting
This is a Title
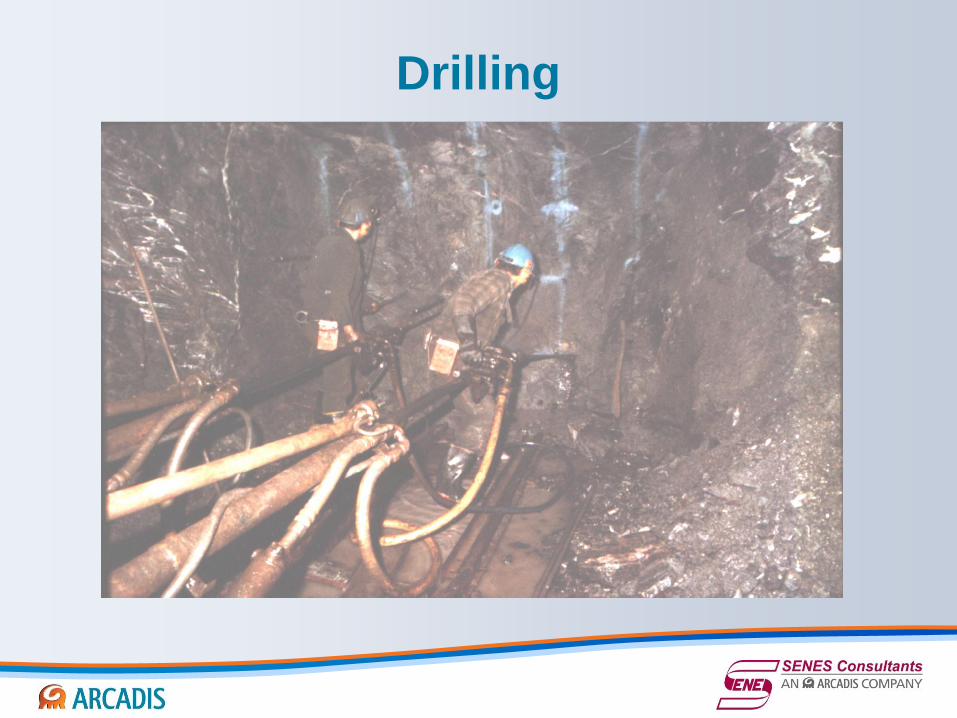
Drilling
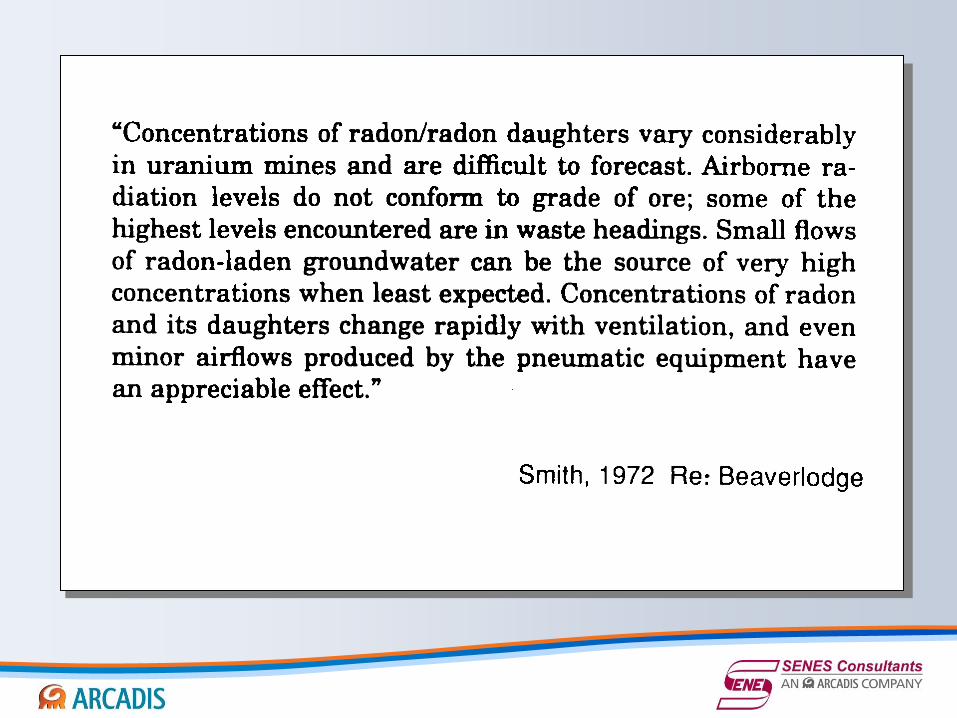
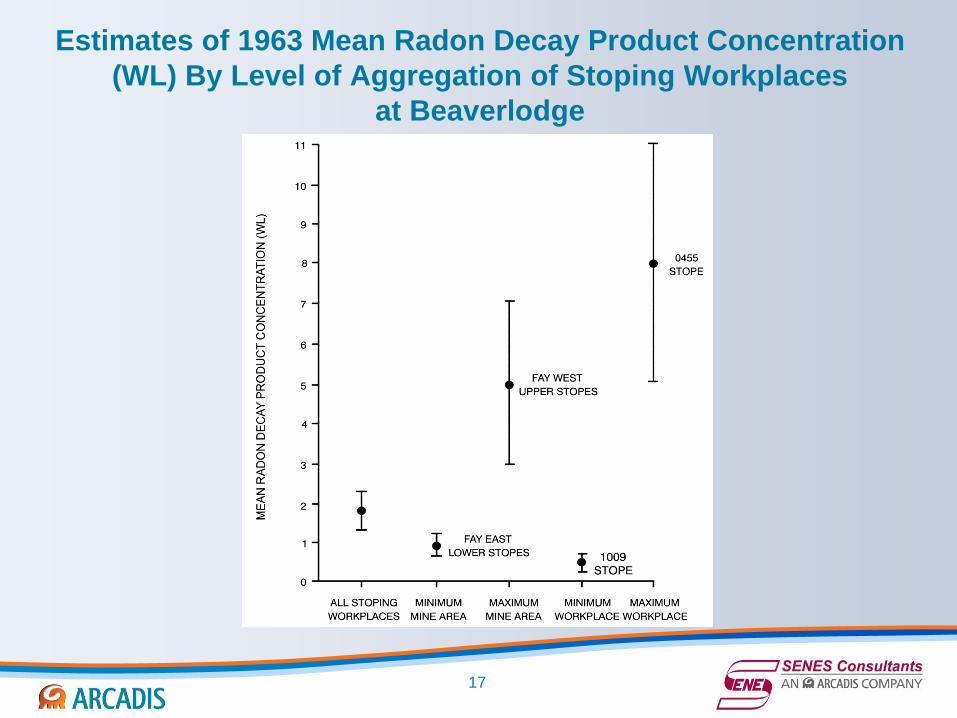
Estimates of 1963 Mean Radon Decay Product Concentration
(WL) By Level of Aggregation of Stoping Workplaces
at Beaverlodge
17
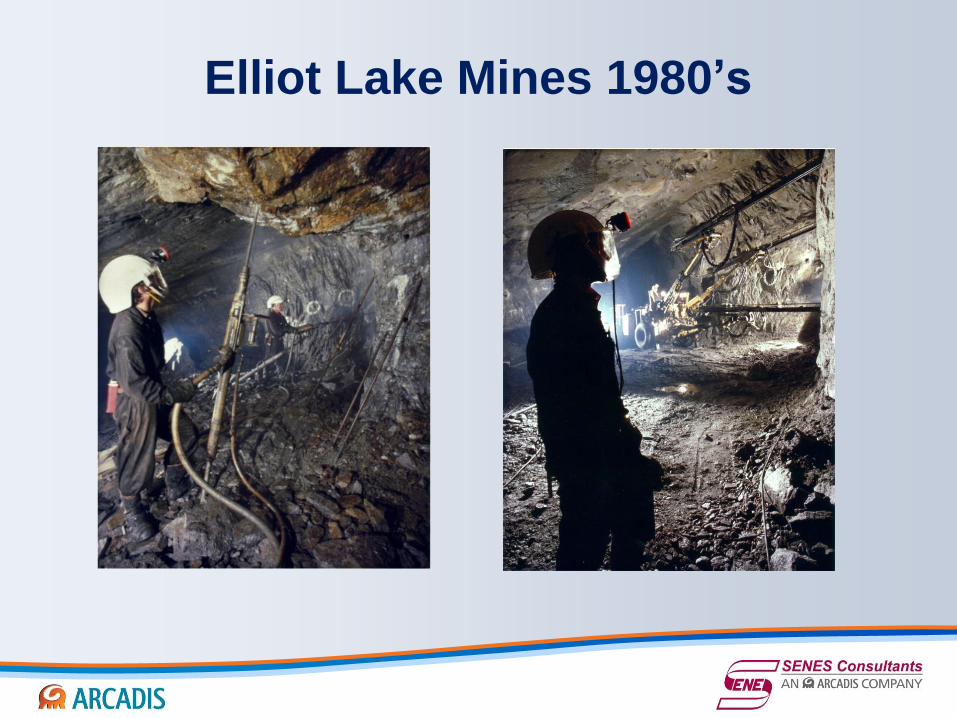
Elliot Lake Mines 1980’s
20
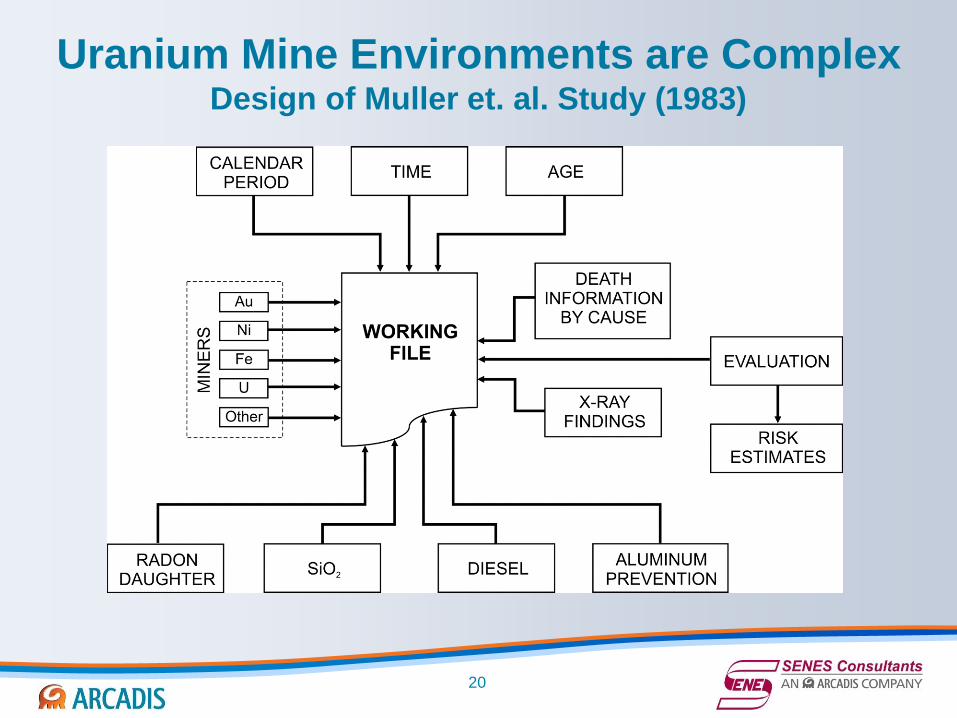
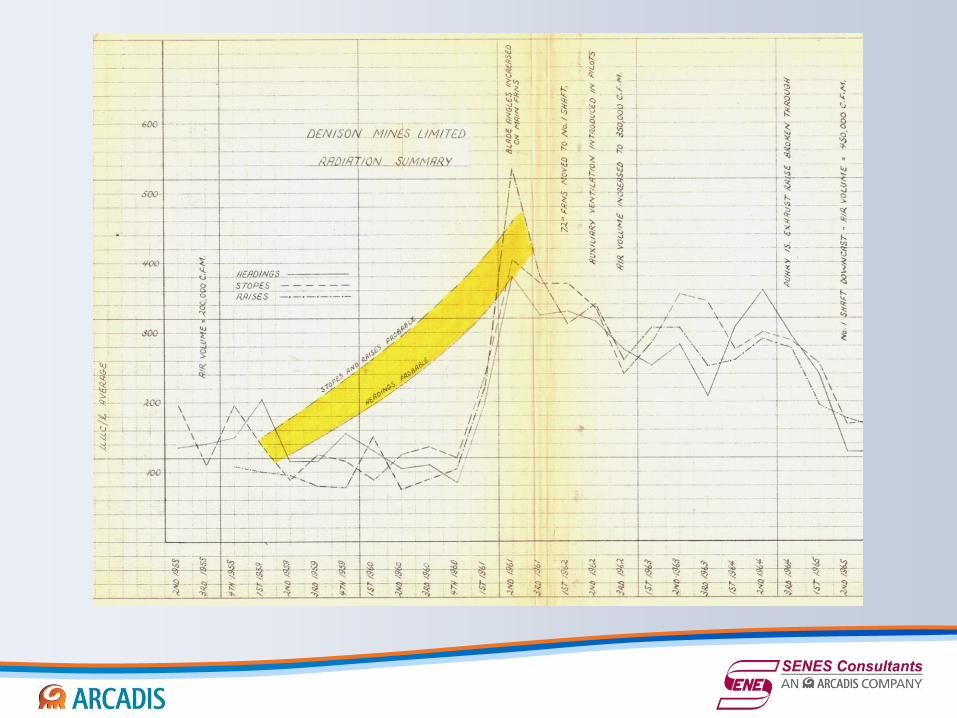
Uranium Mine Environments are Complex Design of Muller et. al. Study (1983)
22
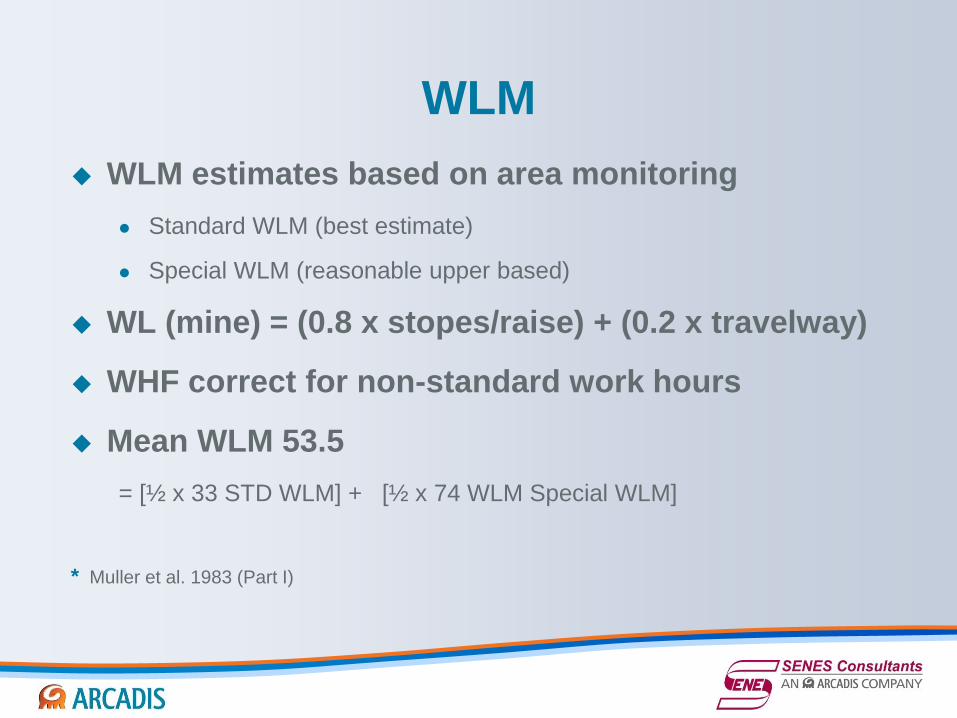
WLM
WLM estimates based on area monitoring
Standard WLM (best estimate)
Special WLM (reasonable upper based)
WL (mine) = (0.8 x stopes/raise) + (0.2 x travelway)
WHF correct for non-standard work hours
Mean WLM 53.5
= [½ x 33 STD WLM] + [½ x 74 WLM Special WLM]
* Muller et al. 1983 (Part I)
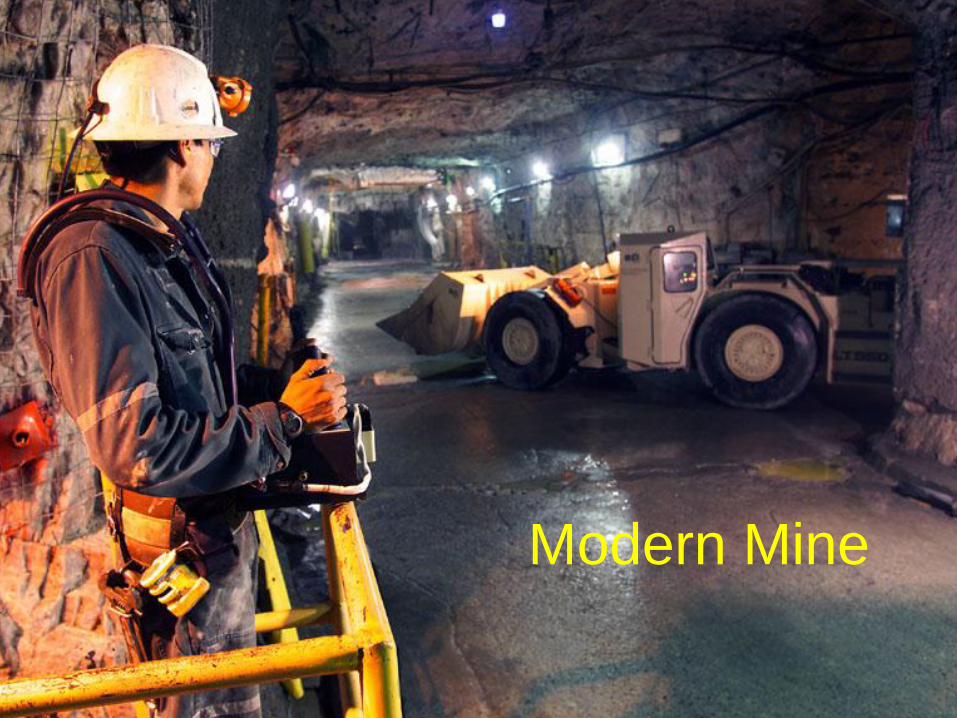
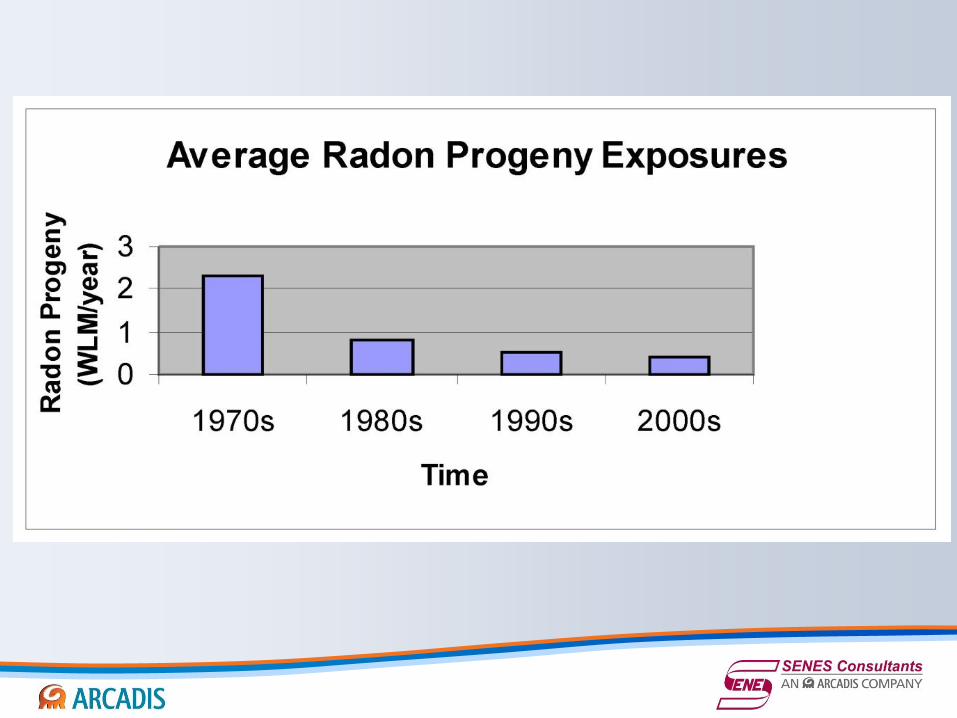
Modern Mine
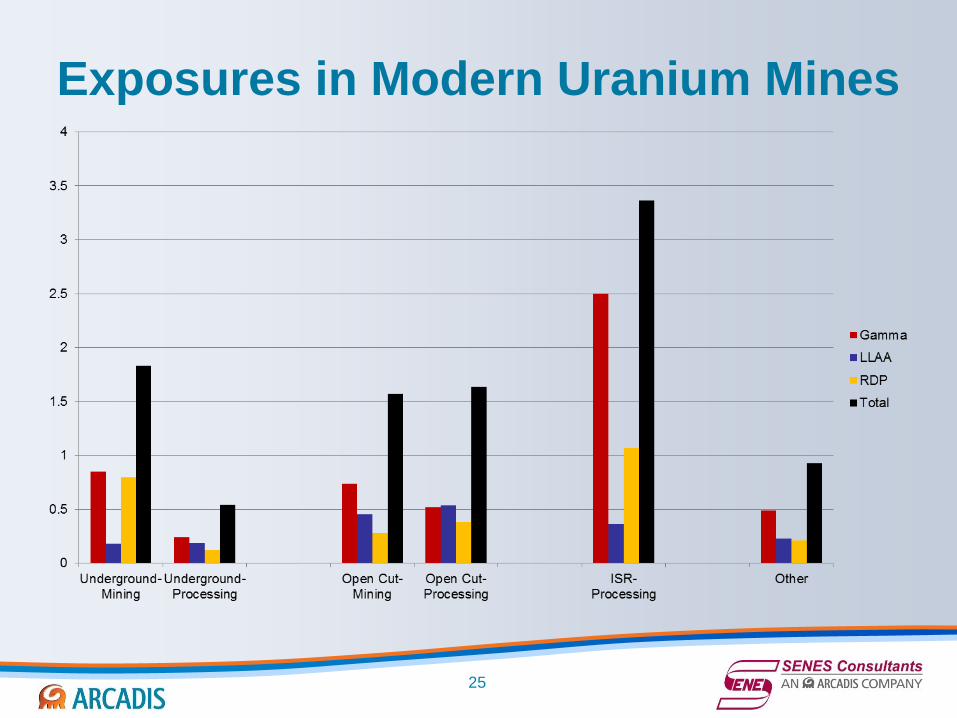
Exposures in Modern Uranium Mines
25
Examples of NORM Sources
Soils
Uranium mining and waste management
Coal ash
Phosphate fertilizer production
Tantalum raw materials
copper mining wastes
Rare earth minerals production
Radon in groundwater
Radon from unconventional resource development
(“fracking”)
Etc.…
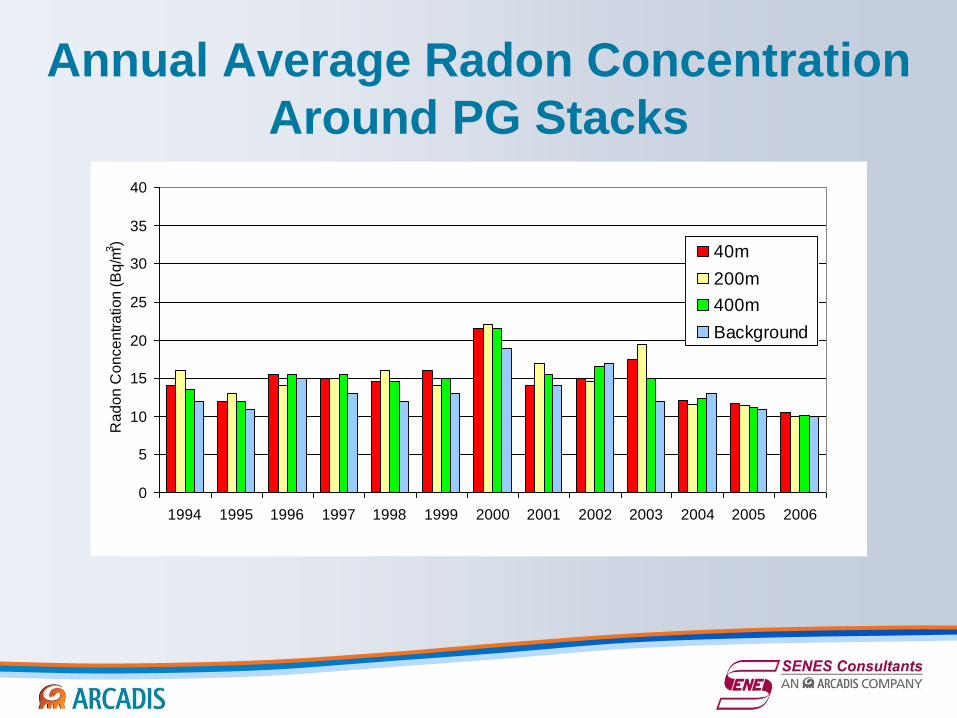
Annual Average Radon Concentration
Around PG Stacks
0
5
10
15
20
25
30
35
40
1994 1995 1996 1997 1998 1999 2000 2001 2002 2003 2004 2005 2006
Ra
do
n C
on
ce
ntr
atio
n (
Bq
/m3)
40m
200m
400m
Background
Examples of radon other than
uranium Tourist Caves and Mines Open to Visitors - in some
caves as high as 20,000 Bq/m3.
Graphite mines - radon concentrations vary winter
and summer but levels up to 6000 Bq/m3
Fluorspar - radon concentration in Newfoundland
mine averaged around 3500 Bq/m3
Oil shale mines - average radon concentrations o
around 430 Bq/m3.
Chinese Coal mines – up to 1200Bq/m3
Groundwater - typical levels reported by the EPA from
a few to perhaps 1000 to 30 000 Bq/m3 but can be very
high up to 106 Bq/m3 or more
28
29 29 29
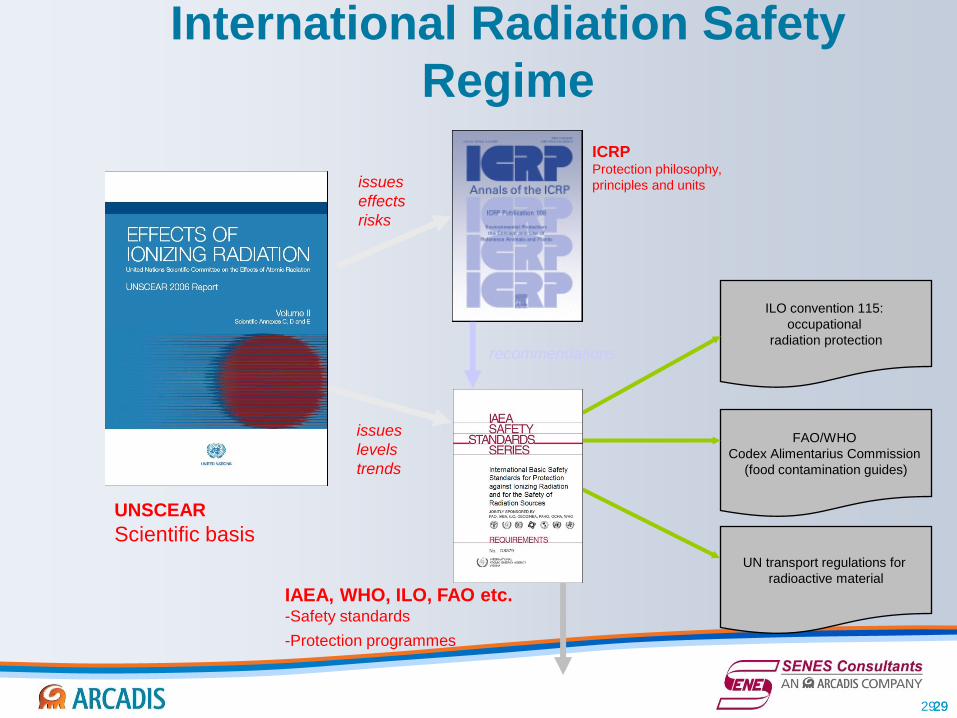
International Radiation Safety
Regime
issues
levels
trends
ICRP Protection philosophy,
principles and units issues
effects
risks
ILO convention 115:
occupational
radiation protection
FAO/WHO
Codex Alimentarius Commission
(food contamination guides)
UN transport regulations for
radioactive material
implemented by
Member States
IAEA, WHO, ILO, FAO etc. -Safety standards
-Protection programmes
UNSCEAR
Scientific basis
recommendations
ICRP’s New Approach
Currently ICRP uses a dose conversion convention
(DCC) to calculate effective dose per unit exposure to
radon progeny based on epidemiology;
The detriment adjusted risk coefficient for radon is
likely to double;
ICRP intends that in the future, doses from radon and
its progeny would be calculated using ICRP biokinetic
and dosimetric models;
Current dose conversion values may continue to be
used until dose coefficients are available.
Past Measurements
The major factor controlling the bronchial dose from
inhalation of 222Rn decay products is their associated
particle size (activity size distribution – especially in
range of 1 to< 10 nm)
The decay products attach mainly to the ambient
particle distribution but a small fraction, mainly 218Po,
remain as small nuclei called the unattached fraction.
Activity size distributions in mines have not been well
measured, mainly because it is a difficult research area
and current instruments are mainly for laboratory use.

Overview
Radon levels vary widely by region, mineralogy and
work practice
Radiation protection guidance for radon has been
developed by international authorities, notably the
ICRP and the IAEA
Radon levels in modern uranium mines are very low,
typically well below the current limit of 4 WLM per year
the continued application of ALARA and good work practice will
continue to ensure safe levels of workplace radon in uranium mine
it will be important in the future to ensure that the same radiation
protection principles are applied to none-uranium mines and
workplaces.
32


