Eagle River Parks Debt Service
Community Work Service
Horticulture
Park Maintenance
Park Property Management
Fire Lake Recreation Center
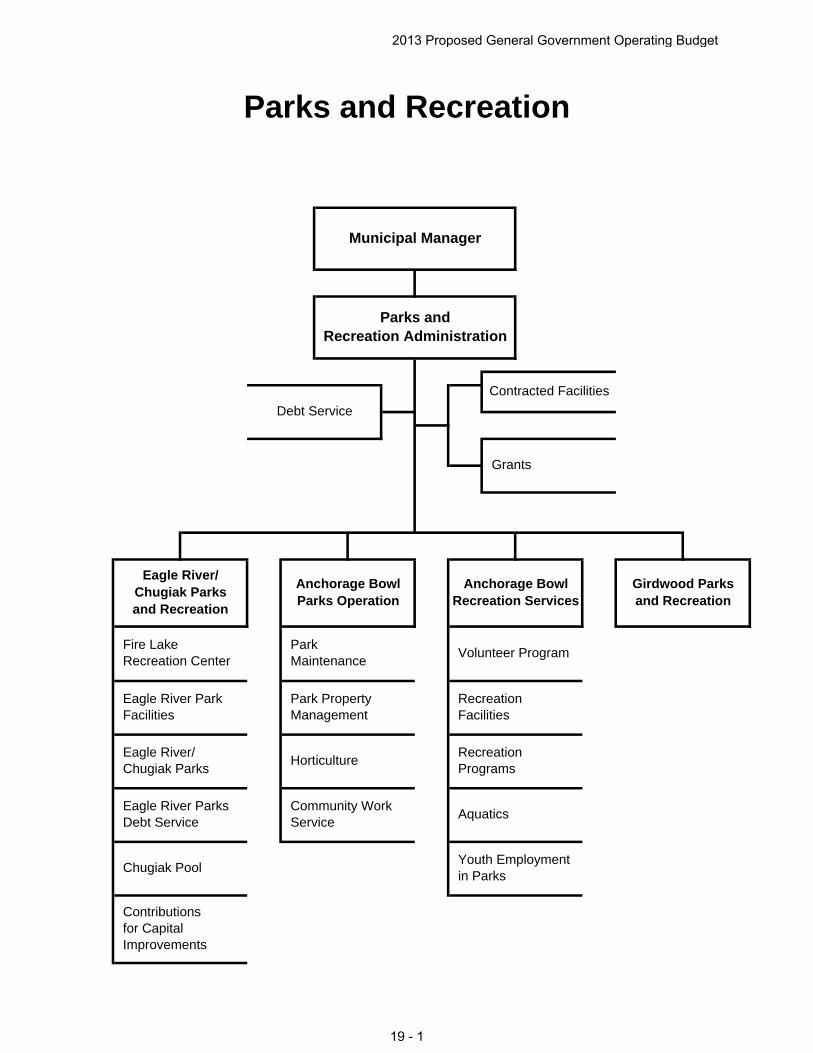
Parks and Recreation
Municipal Manager
Parks andRecreation Administration
Girdwood Parksand Recreation
Debt Service
Grants
Contracted Facilities
Anchorage Bowl Parks Operation
Anchorage Bowl Recreation Services
Volunteer Program
Contributions for Capital Improvements
Chugiak Pool
Eagle River/Chugiak Parksand Recreation
Eagle River Park Facilities
Eagle River/ Chugiak Parks
Recreation Facilities
Recreation Programs
Aquatics
Youth Employment in Parks
2013 Proposed General Government Operating Budget
19 - 1
Parks and Recreation Description
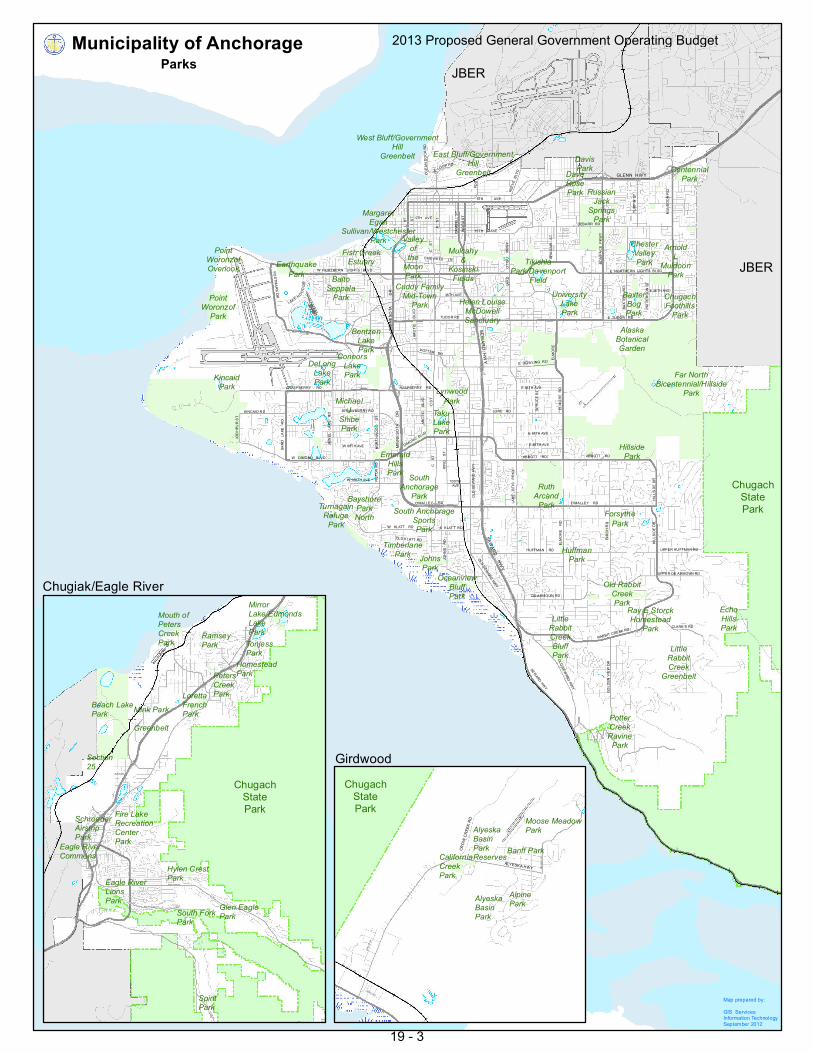
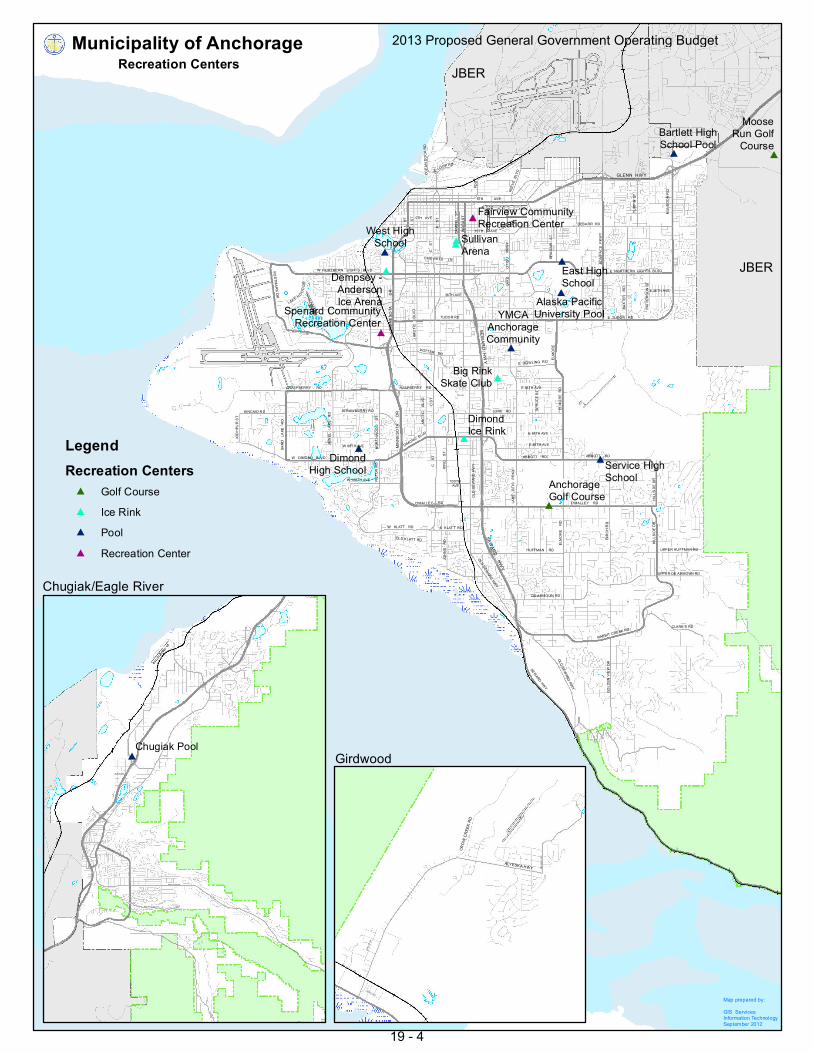
The Parks and Recreation Department is responsible for beautifying, operating and maintaining Park and Recreation assets (parks, trails, community recreation centers and community pools) as well as implementing year-round recreation programs for all ages and caring for our natural resource areas. The Department is also responsible for horticulture and park maintenance. The Department provides support for community gardens, dog parks and Youth Employment in Parks (YEP). Additionally, one of the most important and exciting jobs for Parks and Recreation staff is working with Anchorage’s impressive numbers of volunteers. In 2010, over 6,000 volunteers contributed over 90,000 hours of service to the Parks and Recreation Department. Anchorage has 10,946 acres of municipal parkland; 223 parks with 82 playgrounds; 250 miles of trails and greenbelts linking neighborhoods with surrounding natural open spaces and wildlife habitat (135 miles of paved trails); 110 athletic fields; 5 pools; 11 recreation facilities; year-round and seasonal Park Department employees.
Department Services Parks Operations: maintain and improve the health of the Municipality of Anchorage park
system for the benefit of present and future generations through managed development; and routine care and maintenance of parks, trails, green spaces, trees, and facilities.
Community Development: promote community giving to foster economic growth and community volunteerism in the care and improvement of park assets and in the delivery of parks and recreation services
Recreation Services: promote healthy lifestyles by delivering year-round recreation and volunteer programs in the Municipality of Anchorage’s parks, pools, and recreation facilities.
2013 Proposed General Government Operating Budget
19 - 2
C ST
A S
T
OLD
SEW
ARD
HWY
LAKE
OTIS
P
KWY
MINN
ESOT
A
DR
E TUDOR RD
O'MALLEY RD
ARCT
IC
BLVD
ABBOTT RD
DEBARR RD
W DIMOND BLVD
BIRC
H RD
I ST
HUFFMAN RD
MULD
OON
RD
DE ARMOUN RDBO
NIFA
CE P
KWY
E NORTHERN LIGHTS BLVD
L S
T
KING
ST
ELMO
RE
RD
5TH AVE
JEW
EL L
AKE
RD
RABBIT CREEK RD
RASPBERRY RD E 68TH AVE
W KLATT RD
BRAG
AW S
T
INGR
A ST
GOLD
EN V
IEW
DR
15TH AVE
36TH AVE
E DOWLING R D
BAXT
ER R
D
POSTMARK DR
W 100TH AVE
ELMO
RE R
D
HILL
SIDE
DR
CLARK'S RD
W NORTHERN LIGHTS BLVD
W 88TH AVE
GAMB
ELL S
T
SAND
LAK
E R
D
LORE RD
TUDOR RD
9TH AVE
TURP
IN S
T
KINCAID R D STR AWBER RY R D
JOHN
S R
D
OLD SEWARD HWY
SPRU
CE S
T
NORT
HWOO
D S
T
PATT
ERSO
N ST
L AKE HO OD D
R
OLD KLATT RD
ARCT
IC
BLV
D
E LO OP RD
DIMOND BLVD
100TH AVE
FIREWEED LN
JODH
PUR
ST
VICT
OR R
D
E 84TH AVE
E KLATT R D
UPPER DE ARMOUN RD
ABBOTT RD
REEV
E BL
VD
POTTER DR
GLENN HW Y
UPPER HU FFMAN RD
OCEA
N DO
CK R
D
MINN
ESOT
A
DR
C S
T
POST
SEWARD HWY
OLD SEWARD HWY
SEWARD HWY
C S
T
RASPBERRY RD
E 36TH AVE
ELMO
RE
E 88TH AVE
LAKE
OTI
S P
RKY
HILL
SIDE
DR
SEWARD HW
Y
O'MALLEY RD
Far NorthBicentennial/Hillside
Park
Old RabbitCreekPark
RussianJack
SpringsPark
PotterCreekRavine
Park
ConnorsLakePark
TakuLakePark
South AnchorageSportsPark
MargaretEgan
Sullivan/WestchesterPark
RuthArcand
Park
HuffmanPark
AlaskaBotanicalGarden
Fish CreekEstuary
DaveRosePark
TimberlanePark Johns
Park
EarthquakePark
UniversityLakePark
EmeraldHillsPark
ForsythePark
ArnoldL
MuldoonPark
PointWoronzofOverlook
ChesterValleyPark
Ray E StorckHomestead
Park
MichaelJ
ShibePark
East Bluff/GovernmentHill
Greenbelt
HillsidePark
BayshoreParkNorth
BaxterBogPark
Mulcahy&
KosinskiFields
West Bluff/GovernmentHill
Greenbelt
TurnagainRefuge
Park
BaltoSeppala
Park ChugachFoothills
Park
KincaidPark
Valleyofthe
MoonPark
PointWoronzof
ParkBentzen
LakePark
Helen LouiseMcDowellSanctuary
LittleRabbitCreek
Greenbelt
LittleRabbitCreekBluffPark
DavisPark
OceanviewBluffPark
EchoHillsPark
LynwoodPark
SouthAnchorage
Park
TikishlaPark/Davenport
Field
DeLongLakePark
Cuddy FamilyMid-Town
Park
CentennialPark
Municipality of AnchorageParks
EAG LE RIVER RD
S BI
RCHW
OOD
LOO
P RD
HILAND RD
OB
ER
G R
D
TE
RR
AC
E
LN
DRIFTWO O D BAY D R
SE
TT
LE
RS
D
R
B IR C HWO
OD L OO P R D
VF
W
RD
JA M IE D R
VO
YL
ES
B
LV
D
FA R M A V E
SH
IMS
ST
B A R O N O F F A V E
JA Y H A WK D R
Y O S E MIT E D R
N EAG LE RIVE R LOO P RD
EA
GL
E
RIV
ER
LN
KN
IK
VIS
TA
ST
BIR
CH
WO
OD
SP
UR
R
D
BO
WE
RY
LN
W S K Y L IN E D R
TA R IK A A V E
C O R O N A D O R D
BIR
CH
TR
EE
S
T
OL
D E
AG
LE
RIV
ER
R
D
S K Y V IE W A V E
R E E S E R D
G L A C IE R V I S T A R D
H O M E S T E A D R D
C H A M B E R L N
B IL L S T EP H E N S D R
P IL O T S R D
S T E WA R T M O U N T A I N D R
S U N BE A U D
R
ALMD ALE AVE
SU
NS
ET
B
LV
D
OLD G
LENN
HWY
H IL L C R E S T D R
HILAND RD
Beach LakePark
MirrorLake/EdmondsLakePark
PetersCreekPark
Hylen CrestPark
Section25
Eagle RiverLionsPark
LorettaFrenchPark
Mouth ofPetersCreekPark
South ForkPark
TonjessPark
RamseyPark
Fire LakeRecreationCenterPark
SpiritPark
Eagle RiverCommons
SchroederAirstripPark
HomesteadPark
Mink Park-Greenbelt
Glen EaglePark
ALYESKA HWY
SPRO
AT RD
CROW
CRE
EK RD
GO LD AVE
ARLB
ERG
AVE
Moose MeadowPark
CaliforniaCreekPark
AlyeskaBasinParkReservesBanff Park
AlpineParkAlyeska
BasinPark
Girdwood
Chugiak/Eagle River
Map prepared by:GIS ServicesInformation TechnologySeptember 2012
JBER
JBER
ChugachStatePark
ChugachStatePark
ChugachStatePark
2013 Proposed General Government Operating Budget
19 - 3
#
#
#
#
#
#
#
#
#
#
#
#
#
#
#
#
C ST
A S
T
OLD
SEW
ARD
HWY
LAKE
OTIS
P
KWY
MINN
ESOT
A
DR
E TUDOR RD
O'MALLEY RD
ARCT
IC
BLVD
ABBOTT RD
DEBARR RD
W DIMOND BLVD
BIRC
H RD
I ST
HUFFMAN RD
MULD
OON
RD
DE ARMOUN RDBO
NIFA
CE P
KWY
E NORTHERN LIGHTS BLVD
L S
T
KING
ST
ELMO
RE
RD
5TH AVE
JEW
EL L
AKE
RD
RABBIT CREEK RD
RASPBERRY RD E 68TH AVE
W KLATT RD
BRAG
AW S
T
INGR
A ST
GOLD
EN V
IEW
DR
15TH AVE
36TH AVE
E DOWLING R D
BAXT
ER R
D
POSTMARK DR
W 100TH AVE
ELMO
RE R
D
HILL
SIDE
DR
CLARK'S RD
W NORTHERN LIGHTS BLVD
W 88TH AVE
GAMB
ELL S
T
SAND
LAK
E R
D
LORE RD
TUDOR RD
9TH AVE
TURP
IN S
T
KINCAID R D STR AWBER RY R D
JOHN
S R
D
OLD SEWARD HWY
SPRU
CE S
T
NORT
HWOO
D S
T
PATT
ERSO
N ST
L AKE HO OD D
R
OLD KLATT RD
ARCT
IC
BLV
D
E LO OP RD
DIMOND BLVD
100TH AVE
FIREWEED LN
JODH
PUR
ST
VICT
OR R
D
E 84TH AVE
E KLATT R D
UPPER DE ARMOUN RD
ABBOTT RD
REEV
E BL
VD
POTTER DR
GLENN HW Y
UPPER HU FFMAN RD
OCEA
N DO
CK R
D
MINN
ESOT
A
DR
C S
T
POST
SEWARD HWY
OLD SEWARD HWY
SEWARD HWY
C S
T
RASPBERRY RD
E 36TH AVE
ELMO
RE
E 88TH AVE
LAKE
OTI
S P
RKY
HILL
SIDE
DR
SEWARD HW
Y
O'MALLEY RD
SullivanArena
AnchorageGolf Course
MooseRun Golf
Course
DimondHigh School
Spenard CommunityRecreation Center
West HighSchool
Dempsey -AndersonIce Arena
DimondIce Rink
Fairview CommunityRecreation Center
East HighSchool
Bartlett HighSchool Pool
Alaska PacificUniversity Pool
Big RinkSkate Club
YMCAAnchorageCommunity
Service HighSchool
Municipality of AnchorageRecreation Centers
#
EAG LE RIVER RD
S BI
RCHW
OOD
LOO
P RD
HILAND RD
OB
ER
G R
D
TE
RR
AC
E
LN
DRIFTWO O D BAY D R
SE
TT
LE
RS
D
R
B IR C HWO
OD L OO P R D
VF
W
RD
JA M IE D R
VO
YL
ES
B
LV
D
FA R M A V E
SH
IMS
ST
B A R O N O F F A V E
JA Y H A WK D R
Y O S E MIT E D R
N EAG LE RIVE R LOO P RD
EA
GL
E
RIV
ER
LN
KN
IK
VIS
TA
ST
BIR
CH
WO
OD
SP
UR
R
D
BO
WE
RY
LN
W S K Y L IN E D R
TA R IK A A V E
C O R O N A D O R D
BIR
CH
TR
EE
S
T
OL
D E
AG
LE
RIV
ER
R
D
S K Y V IE W A V E
R E E S E R D
G L A C IE R V I S T A R D
H O M E S T E A D R D
C H A M B E R L N
B IL L S T EP H E N S D R
P IL O T S R D
S T E WA R T M O U N T A I N D R
S U N BE A U D
R
ALMD ALE AVE
SU
NS
ET
B
LV
D
OLD G
LENN
HWY
H IL L C R E S T D R
HILAND RD
Chugiak Pool
ALYESKA HWY
SPRO
AT RD
CROW
CRE
EK RD
GO LD AVE
ARLB
ERG
AVE
Girdwood
Chugiak/Eagle River
Map prepared by:GIS ServicesInformation TechnologySeptember 2012
JBER
JBER
LegendRecreation Centers# Golf Course# Ice Rink# Pool# Recreation Center
2013 Proposed General Government Operating Budget
19 - 4
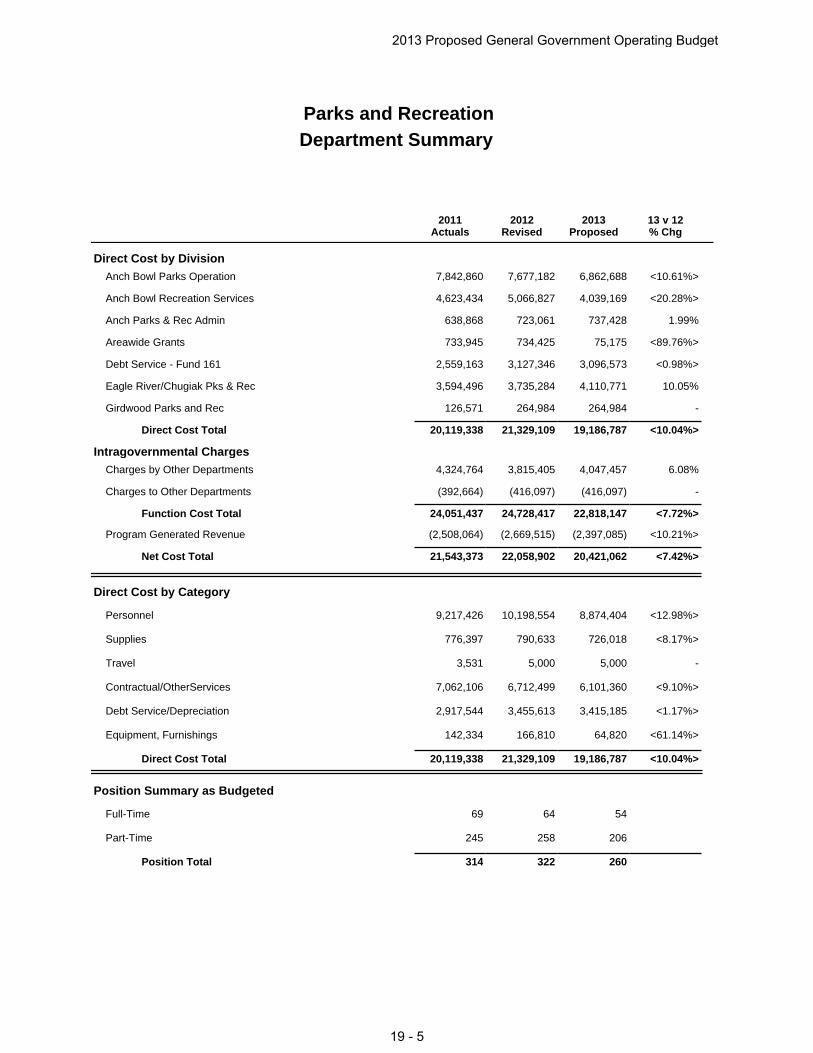
Direct Cost by DivisionAnch Bowl Parks Operation 7,842,860 7,677,182 6,862,688 <10.61%>
Anch Bowl Recreation Services 4,623,434 5,066,827 4,039,169 <20.28%>
Anch Parks & Rec Admin 638,868 723,061 737,428 1.99%
Areawide Grants 733,945 734,425 75,175 <89.76%>
Debt Service - Fund 161 2,559,163 3,127,346 3,096,573 <0.98%>
Eagle River/Chugiak Pks & Rec 3,594,496 3,735,284 4,110,771 10.05%
Girdwood Parks and Rec 126,571 264,984 264,984 -
Direct Cost Total 20,119,338 21,329,109 19,186,787 <10.04%>
Intragovernmental ChargesCharges by Other Departments 4,324,764 3,815,405 4,047,457 6.08%
Charges to Other Departments (392,664) (416,097) (416,097) -
Function Cost Total 24,051,437 24,728,417 22,818,147 <7.72%>
Program Generated Revenue (2,508,064) (2,669,515) (2,397,085) <10.21%>
Net Cost Total 21,543,373 22,058,902 20,421,062 <7.42%>
Direct Cost by Category
Personnel 9,217,426 10,198,554 8,874,404 <12.98%>
Supplies 776,397 790,633 726,018 <8.17%>
Travel 3,531 5,000 5,000 -
Contractual/OtherServices 7,062,106 6,712,499 6,101,360 <9.10%>
Debt Service/Depreciation 2,917,544 3,455,613 3,415,185 <1.17%>
Equipment, Furnishings 142,334 166,810 64,820 <61.14%>
Direct Cost Total 20,119,338 21,329,109 19,186,787 <10.04%>
Position Summary as Budgeted
Full-Time 69 64 54
Part-Time 245 258 206
Position Total 314 322 260
Parks and RecreationDepartment Summary
2012Revised
2013Proposed
2011Actuals
13 v 12% Chg
2013 Proposed General Government Operating Budget
19 - 5
Direct Costs FT PT T
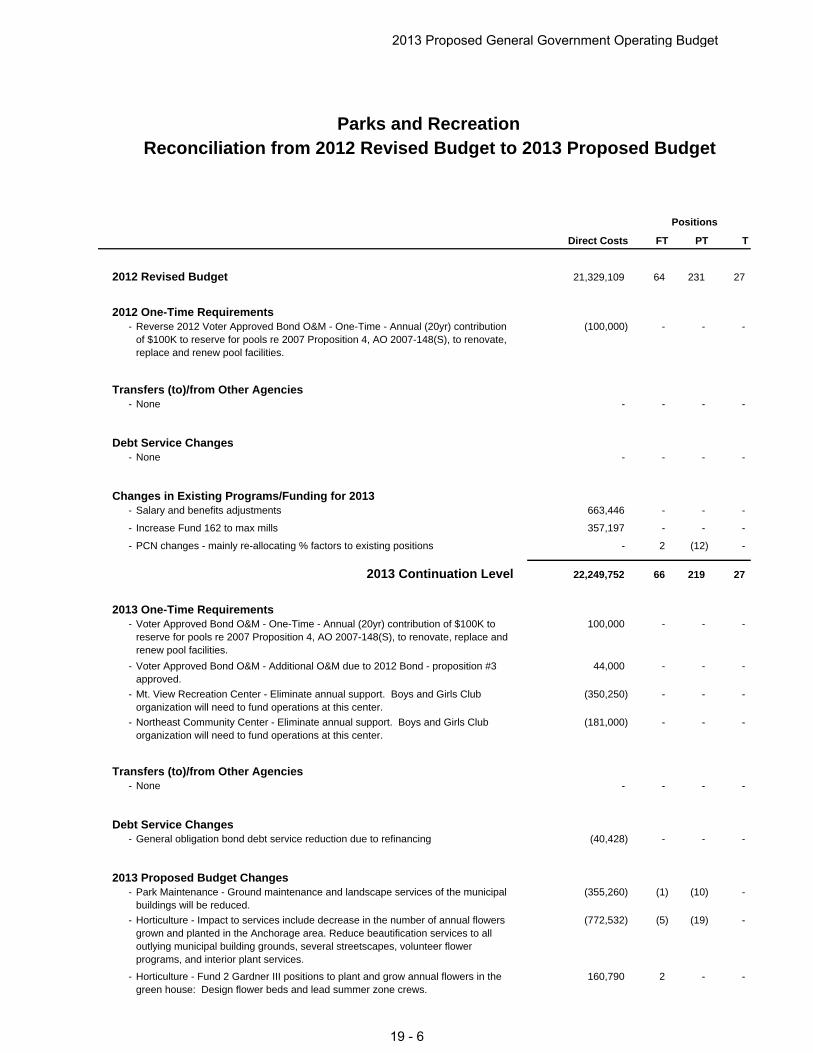
21,329,109 64 231 27
- Reverse 2012 Voter Approved Bond O&M - One-Time - Annual (20yr) contribution of $100K to reserve for pools re 2007 Proposition 4, AO 2007-148(S), to renovate, replace and renew pool facilities.
(100,000) - - -
- None - - - -
- None - - - -
- Salary and benefits adjustments 663,446 - - -
- Increase Fund 162 to max mills 357,197 - - -
- PCN changes - mainly re-allocating % factors to existing positions - 2 (12) -
22,249,752 66 219 27
- Voter Approved Bond O&M - One-Time - Annual (20yr) contribution of $100K to reserve for pools re 2007 Proposition 4, AO 2007-148(S), to renovate, replace and renew pool facilities.
100,000 - - -
- Voter Approved Bond O&M - Additional O&M due to 2012 Bond - proposition #3 approved.
44,000 - - -
- Mt. View Recreation Center - Eliminate annual support. Boys and Girls Club organization will need to fund operations at this center.
(350,250) - - -
- Northeast Community Center - Eliminate annual support. Boys and Girls Club organization will need to fund operations at this center.
(181,000) - - -
- None - - - -
- General obligation bond debt service reduction due to refinancing (40,428) - - -
- Park Maintenance - Ground maintenance and landscape services of the municipal buildings will be reduced.
(355,260) (1) (10) -
- Horticulture - Impact to services include decrease in the number of annual flowers grown and planted in the Anchorage area. Reduce beautification services to all outlying municipal building grounds, several streetscapes, volunteer flower programs, and interior plant services.
(772,532) (5) (19) -
- Horticulture - Fund 2 Gardner III positions to plant and grow annual flowers in the green house: Design flower beds and lead summer zone crews.
160,790 2 - -
2013 Continuation Level
Transfers (to)/from Other Agencies
2013 One-Time Requirements
2013 Proposed Budget Changes
Debt Service Changes
Parks and Recreation
Debt Service Changes
Changes in Existing Programs/Funding for 2013
Transfers (to)/from Other Agencies
2012 Revised Budget
2012 One-Time Requirements
Reconciliation from 2012 Revised Budget to 2013 Proposed Budget
Positions
2013 Proposed General Government Operating Budget
19 - 6
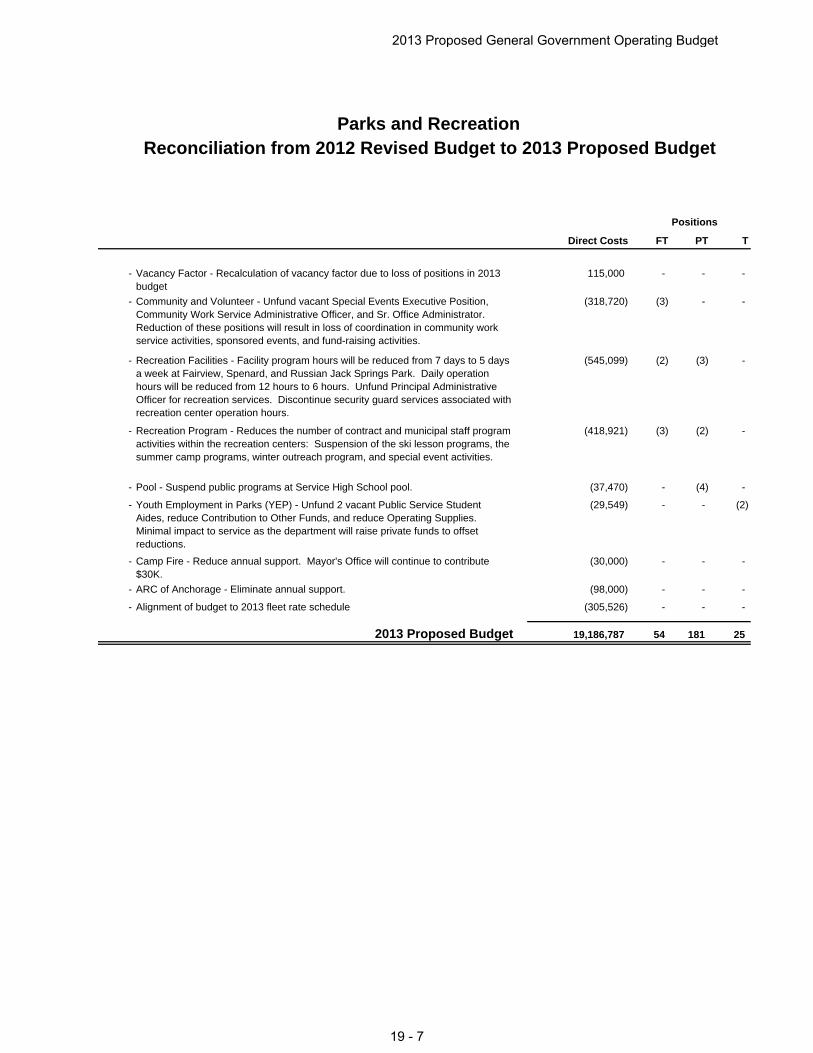
Direct Costs FT PT T
Parks and RecreationReconciliation from 2012 Revised Budget to 2013 Proposed Budget
Positions
- Vacancy Factor - Recalculation of vacancy factor due to loss of positions in 2013 budget
115,000 - - -
- Community and Volunteer - Unfund vacant Special Events Executive Position, Community Work Service Administrative Officer, and Sr. Office Administrator. Reduction of these positions will result in loss of coordination in community work service activities, sponsored events, and fund-raising activities.
(318,720) (3) - -
- Recreation Facilities - Facility program hours will be reduced from 7 days to 5 days a week at Fairview, Spenard, and Russian Jack Springs Park. Daily operation hours will be reduced from 12 hours to 6 hours. Unfund Principal Administrative Officer for recreation services. Discontinue security guard services associated with recreation center operation hours.
(545,099) (2) (3) -
- Recreation Program - Reduces the number of contract and municipal staff program activities within the recreation centers: Suspension of the ski lesson programs, the summer camp programs, winter outreach program, and special event activities.
(418,921) (3) (2) -
- Pool - Suspend public programs at Service High School pool. (37,470) - (4) -
- Youth Employment in Parks (YEP) - Unfund 2 vacant Public Service Student Aides, reduce Contribution to Other Funds, and reduce Operating Supplies. Minimal impact to service as the department will raise private funds to offset reductions.
(29,549) - - (2)
- Camp Fire - Reduce annual support. Mayor's Office will continue to contribute $30K.
(30,000) - - -
- ARC of Anchorage - Eliminate annual support. (98,000) - - -
- Alignment of budget to 2013 fleet rate schedule (305,526) - - -
2013 Proposed Budget 19,186,787 54 181 25
2013 Proposed General Government Operating Budget
19 - 7
2011Actuals
2012Revised
2013Proposed
13 v 12% Chg
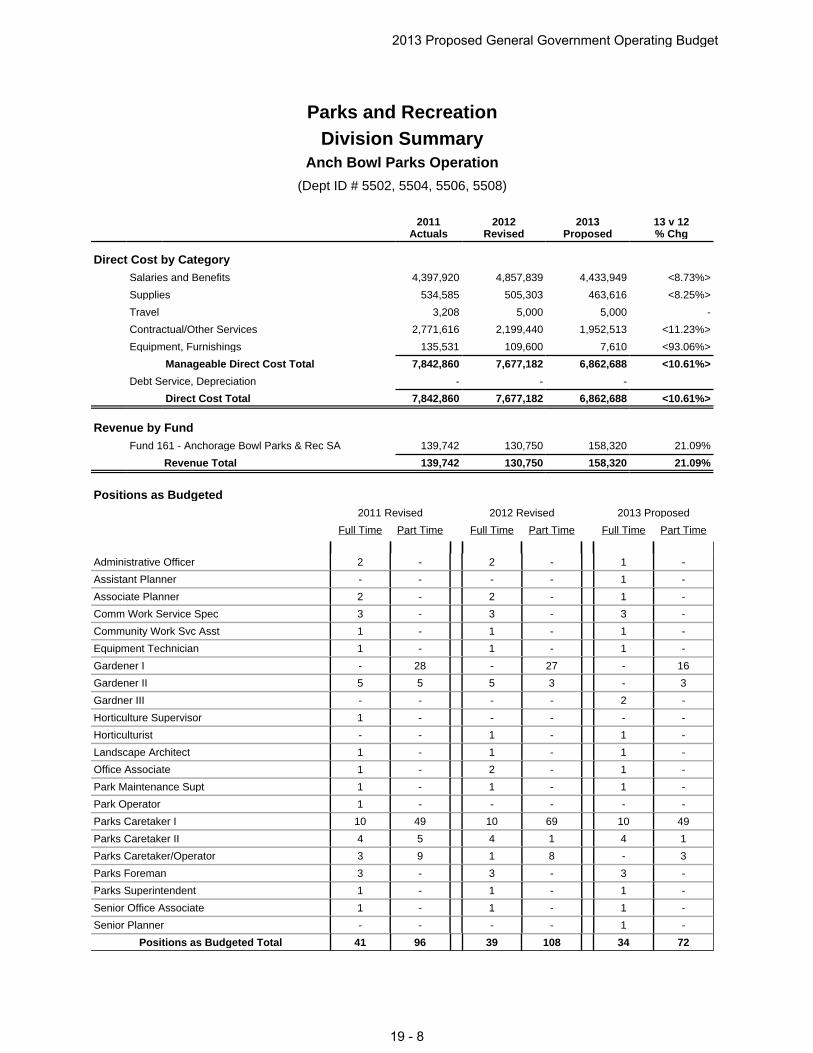
Direct Cost by CategorySalaries and Benefits 4,397,920 4,857,839 4,433,949 <8.73%>
Supplies 534,585 505,303 463,616 <8.25%>
Travel 3,208 5,000 5,000 -
Contractual/Other Services 2,771,616 2,199,440 1,952,513 <11.23%>
Equipment, Furnishings 135,531 109,600 7,610 <93.06%>
Manageable Direct Cost Total 7,842,860 7,677,182 6,862,688 <10.61%>
Debt Service, Depreciation - - -
Direct Cost Total 7,842,860 7,677,182 6,862,688 <10.61%>
Revenue by FundFund 161 - Anchorage Bowl Parks & Rec SA 139,742 130,750 158,320 21.09%
Revenue Total 139,742 130,750 158,320 21.09%
Positions as Budgeted2011 Revised 2012 Revised 2013 Proposed
Full Time Part Time Full Time Part Time Full Time Part Time
Administrative Officer 2 - 2 - 1 -
Assistant Planner - - - - 1 -
Associate Planner 2 - 2 - 1 -
Comm Work Service Spec 3 - 3 - 3 -
Community Work Svc Asst 1 - 1 - 1 -
Equipment Technician 1 - 1 - 1 -
Gardener I - 28 - 27 - 16
Gardener II 5 5 5 3 - 3
Gardner III - - - - 2 -
Horticulture Supervisor 1 - - - - -
Horticulturist - - 1 - 1 -
Landscape Architect 1 - 1 - 1 -
Office Associate 1 - 2 - 1 -
Park Maintenance Supt 1 - 1 - 1 -
Park Operator 1 - - - - -
Parks Caretaker I 10 49 10 69 10 49
Parks Caretaker II 4 5 4 1 4 1
Parks Caretaker/Operator 3 9 1 8 - 3
Parks Foreman 3 - 3 - 3 -
Parks Superintendent 1 - 1 - 1 -
Senior Office Associate 1 - 1 - 1 -
Senior Planner - - - - 1 -
Positions as Budgeted Total 41 96 39 108 34 72
Parks and RecreationDivision Summary
(Dept ID # 5502, 5504, 5506, 5508)
Anch Bowl Parks Operation
2013 Proposed General Government Operating Budget
19 - 8
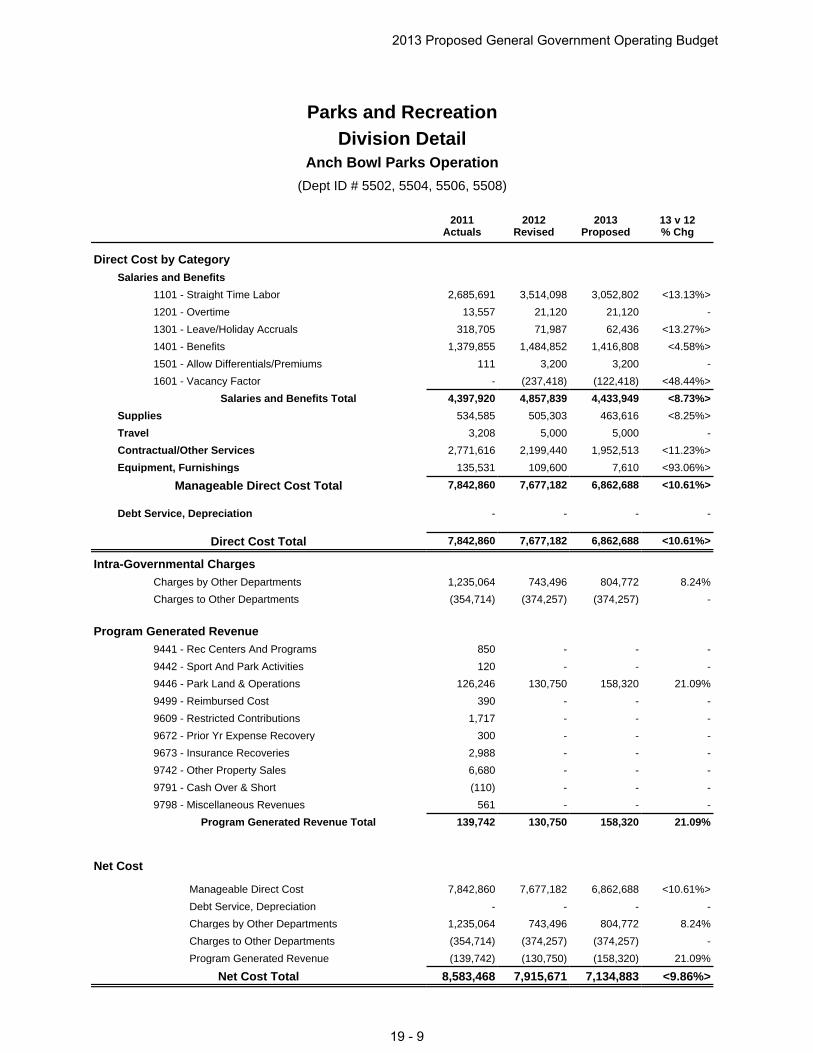
Net Cost
Manageable Direct Cost 7,842,860 7,677,182 6,862,688 <10.61%>
Debt Service, Depreciation - - - -
Charges by Other Departments 1,235,064 743,496 804,772 8.24%
Charges to Other Departments (354,714) (374,257) (374,257) -
Program Generated Revenue (139,742) (130,750) (158,320) 21.09%
Net Cost Total 8,583,468 7,915,671 7,134,883 <9.86%>
Direct Cost by CategorySalaries and Benefits
1101 - Straight Time Labor 2,685,691 3,514,098 3,052,802 <13.13%>
1201 - Overtime 13,557 21,120 21,120 -
1301 - Leave/Holiday Accruals 318,705 71,987 62,436 <13.27%>
1401 - Benefits 1,379,855 1,484,852 1,416,808 <4.58%>
1501 - Allow Differentials/Premiums 111 3,200 3,200 -
1601 - Vacancy Factor - (237,418) (122,418) <48.44%>
Salaries and Benefits Total 4,397,920 4,857,839 4,433,949 <8.73%>
Supplies 534,585 505,303 463,616 <8.25%>
Travel 3,208 5,000 5,000 -
Contractual/Other Services 2,771,616 2,199,440 1,952,513 <11.23%>
Equipment, Furnishings 135,531 109,600 7,610 <93.06%>
Manageable Direct Cost Total 7,842,860 7,677,182 6,862,688 <10.61%>
Debt Service, Depreciation - - - -
Direct Cost Total 7,842,860 7,677,182 6,862,688 <10.61%>
Intra-Governmental ChargesCharges by Other Departments 1,235,064 743,496 804,772 8.24%
Charges to Other Departments (354,714) (374,257) (374,257) -
Program Generated Revenue9441 - Rec Centers And Programs 850 - - -
9442 - Sport And Park Activities 120 - - -
9446 - Park Land & Operations 126,246 130,750 158,320 21.09%
9499 - Reimbursed Cost 390 - - -
9609 - Restricted Contributions 1,717 - - -
9672 - Prior Yr Expense Recovery 300 - - -
9673 - Insurance Recoveries 2,988 - - -
9742 - Other Property Sales 6,680 - - -
9791 - Cash Over & Short (110) - - -
9798 - Miscellaneous Revenues 561 - - -
Program Generated Revenue Total 139,742 130,750 158,320 21.09%
Parks and RecreationDivision Detail
(Dept ID # 5502, 5504, 5506, 5508)
Anch Bowl Parks Operation
2012Revised
2013Proposed
2011Actuals
13 v 12% Chg
2013 Proposed General Government Operating Budget
19 - 9
2011Actuals
2012Revised
2013Proposed
13 v 12% Chg
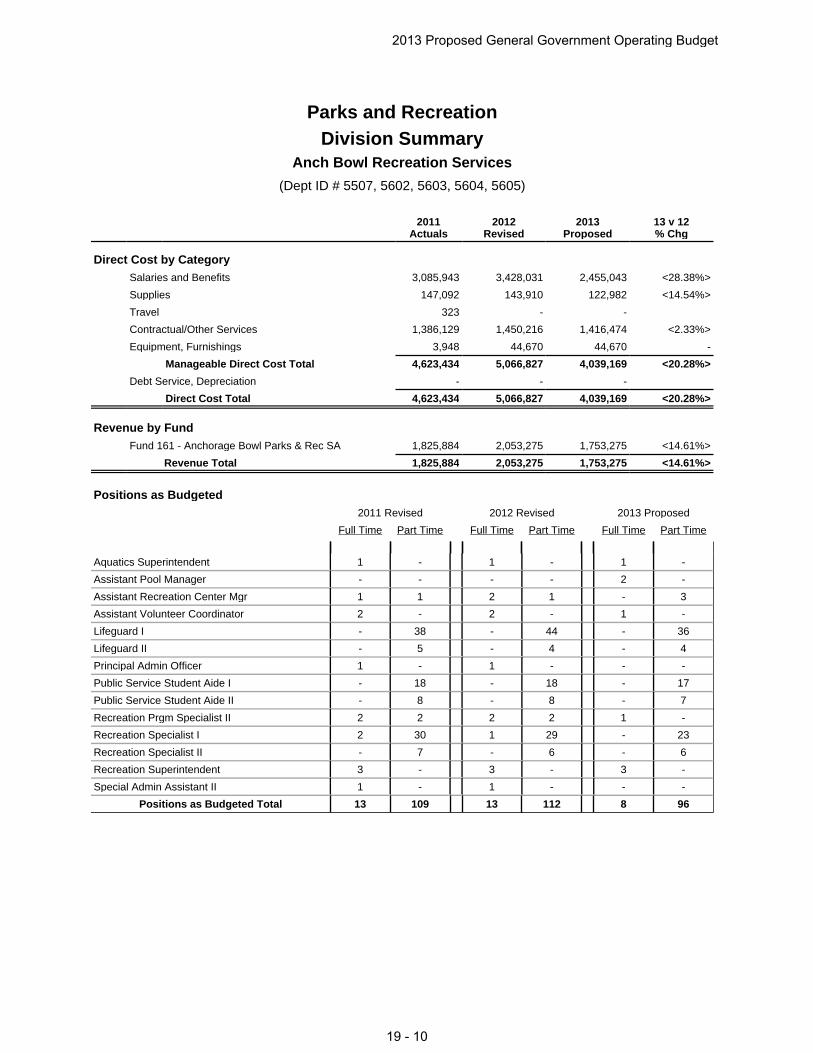
Direct Cost by CategorySalaries and Benefits 3,085,943 3,428,031 2,455,043 <28.38%>
Supplies 147,092 143,910 122,982 <14.54%>
Travel 323 - -
Contractual/Other Services 1,386,129 1,450,216 1,416,474 <2.33%>
Equipment, Furnishings 3,948 44,670 44,670 -
Manageable Direct Cost Total 4,623,434 5,066,827 4,039,169 <20.28%>
Debt Service, Depreciation - - -
Direct Cost Total 4,623,434 5,066,827 4,039,169 <20.28%>
Revenue by FundFund 161 - Anchorage Bowl Parks & Rec SA 1,825,884 2,053,275 1,753,275 <14.61%>
Revenue Total 1,825,884 2,053,275 1,753,275 <14.61%>
Positions as Budgeted2011 Revised 2012 Revised 2013 Proposed
Full Time Part Time Full Time Part Time Full Time Part Time
Aquatics Superintendent 1 - 1 - 1 -
Assistant Pool Manager - - - - 2 -
Assistant Recreation Center Mgr 1 1 2 1 - 3
Assistant Volunteer Coordinator 2 - 2 - 1 -
Lifeguard I - 38 - 44 - 36
Lifeguard II - 5 - 4 - 4
Principal Admin Officer 1 - 1 - - -
Public Service Student Aide I - 18 - 18 - 17
Public Service Student Aide II - 8 - 8 - 7
Recreation Prgm Specialist II 2 2 2 2 1 -
Recreation Specialist I 2 30 1 29 - 23
Recreation Specialist II - 7 - 6 - 6
Recreation Superintendent 3 - 3 - 3 -
Special Admin Assistant II 1 - 1 - - -
Positions as Budgeted Total 13 109 13 112 8 96
Parks and RecreationDivision Summary
(Dept ID # 5507, 5602, 5603, 5604, 5605)
Anch Bowl Recreation Services
2013 Proposed General Government Operating Budget
19 - 10
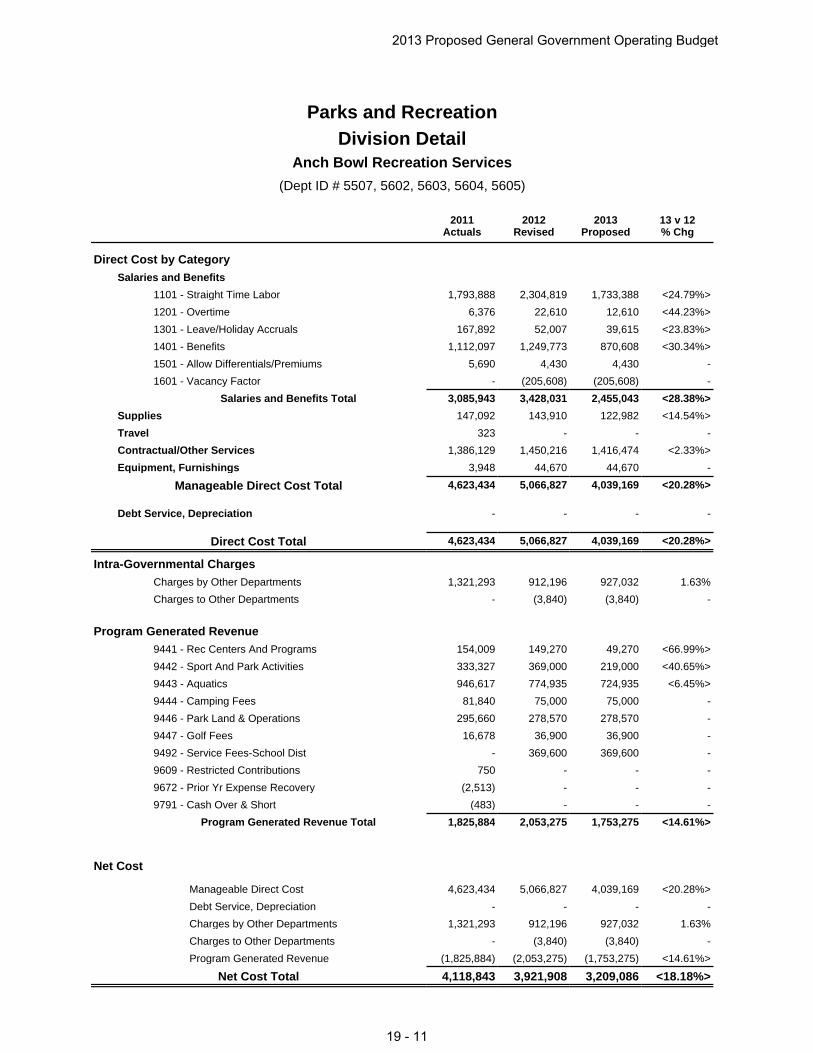
Net Cost
Manageable Direct Cost 4,623,434 5,066,827 4,039,169 <20.28%>
Debt Service, Depreciation - - - -
Charges by Other Departments 1,321,293 912,196 927,032 1.63%
Charges to Other Departments - (3,840) (3,840) -
Program Generated Revenue (1,825,884) (2,053,275) (1,753,275) <14.61%>
Net Cost Total 4,118,843 3,921,908 3,209,086 <18.18%>
Direct Cost by CategorySalaries and Benefits
1101 - Straight Time Labor 1,793,888 2,304,819 1,733,388 <24.79%>
1201 - Overtime 6,376 22,610 12,610 <44.23%>
1301 - Leave/Holiday Accruals 167,892 52,007 39,615 <23.83%>
1401 - Benefits 1,112,097 1,249,773 870,608 <30.34%>
1501 - Allow Differentials/Premiums 5,690 4,430 4,430 -
1601 - Vacancy Factor - (205,608) (205,608) -
Salaries and Benefits Total 3,085,943 3,428,031 2,455,043 <28.38%>
Supplies 147,092 143,910 122,982 <14.54%>
Travel 323 - - -
Contractual/Other Services 1,386,129 1,450,216 1,416,474 <2.33%>
Equipment, Furnishings 3,948 44,670 44,670 -
Manageable Direct Cost Total 4,623,434 5,066,827 4,039,169 <20.28%>
Debt Service, Depreciation - - - -
Direct Cost Total 4,623,434 5,066,827 4,039,169 <20.28%>
Intra-Governmental ChargesCharges by Other Departments 1,321,293 912,196 927,032 1.63%
Charges to Other Departments - (3,840) (3,840) -
Program Generated Revenue9441 - Rec Centers And Programs 154,009 149,270 49,270 <66.99%>
9442 - Sport And Park Activities 333,327 369,000 219,000 <40.65%>
9443 - Aquatics 946,617 774,935 724,935 <6.45%>
9444 - Camping Fees 81,840 75,000 75,000 -
9446 - Park Land & Operations 295,660 278,570 278,570 -
9447 - Golf Fees 16,678 36,900 36,900 -
9492 - Service Fees-School Dist - 369,600 369,600 -
9609 - Restricted Contributions 750 - - -
9672 - Prior Yr Expense Recovery (2,513) - - -
9791 - Cash Over & Short (483) - - -
Program Generated Revenue Total 1,825,884 2,053,275 1,753,275 <14.61%>
Parks and RecreationDivision Detail
(Dept ID # 5507, 5602, 5603, 5604, 5605)
Anch Bowl Recreation Services
2012Revised
2013Proposed
2011Actuals
13 v 12% Chg
2013 Proposed General Government Operating Budget
19 - 11
2011Actuals
2012Revised
2013Proposed
13 v 12% Chg
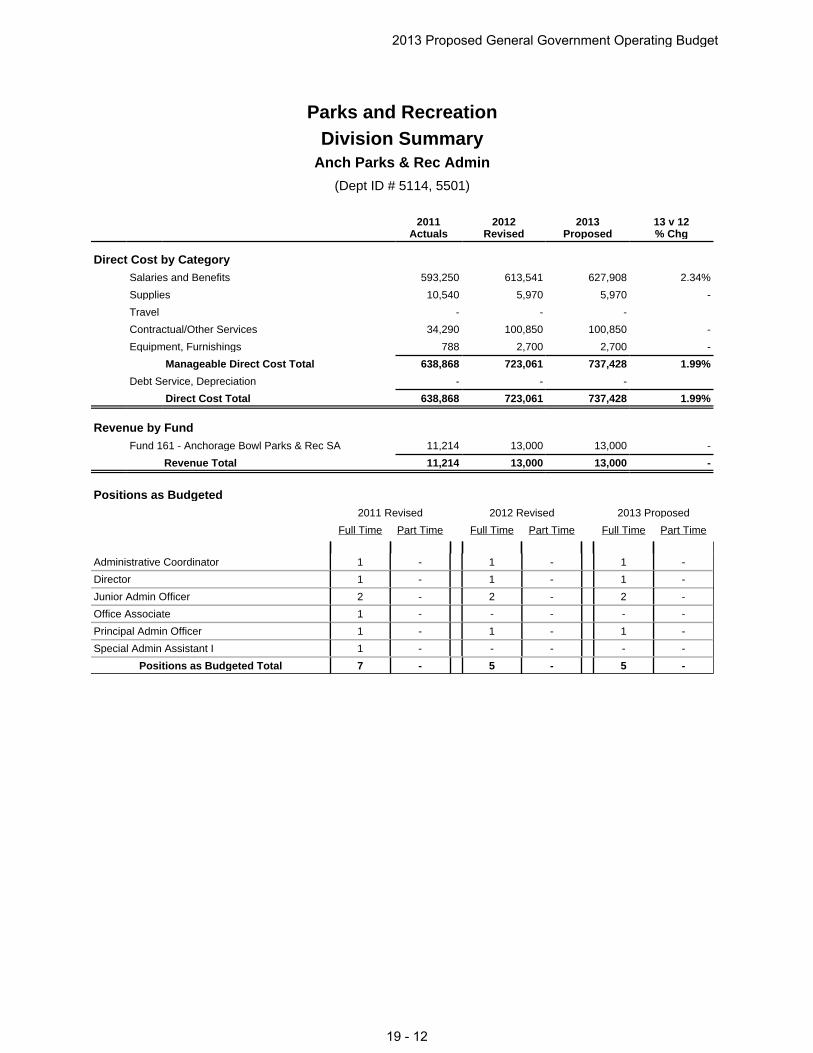
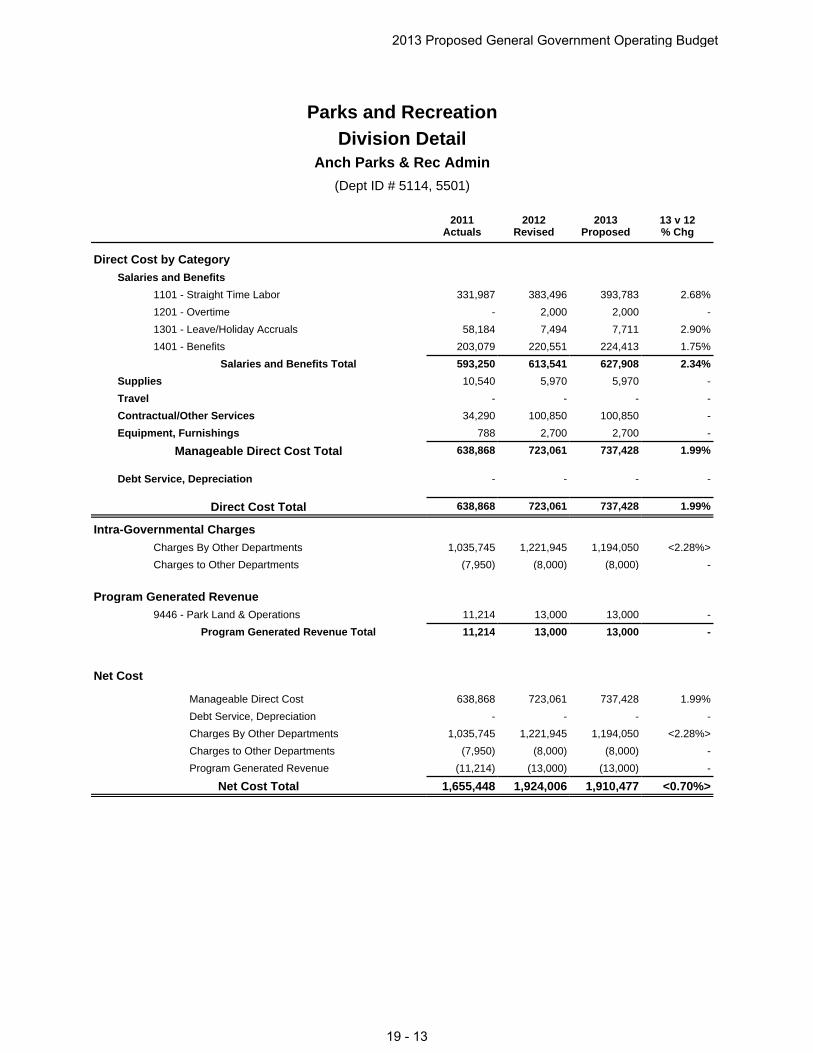
Direct Cost by CategorySalaries and Benefits 593,250 613,541 627,908 2.34%
Supplies 10,540 5,970 5,970 -
Travel - - -
Contractual/Other Services 34,290 100,850 100,850 -
Equipment, Furnishings 788 2,700 2,700 -
Manageable Direct Cost Total 638,868 723,061 737,428 1.99%
Debt Service, Depreciation - - -
Direct Cost Total 638,868 723,061 737,428 1.99%
Revenue by FundFund 161 - Anchorage Bowl Parks & Rec SA 11,214 13,000 13,000 -
Revenue Total 11,214 13,000 13,000 -
Positions as Budgeted2011 Revised 2012 Revised 2013 Proposed
Full Time Part Time Full Time Part Time Full Time Part Time
Administrative Coordinator 1 - 1 - 1 -
Director 1 - 1 - 1 -
Junior Admin Officer 2 - 2 - 2 -
Office Associate 1 - - - - -
Principal Admin Officer 1 - 1 - 1 -
Special Admin Assistant I 1 - - - - -
Positions as Budgeted Total 7 - 5 - 5 -
Parks and RecreationDivision Summary
(Dept ID # 5114, 5501)
Anch Parks & Rec Admin
2013 Proposed General Government Operating Budget
19 - 12
Net Cost
Manageable Direct Cost 638,868 723,061 737,428 1.99%
Debt Service, Depreciation - - - -
Charges By Other Departments 1,035,745 1,221,945 1,194,050 <2.28%>
Charges to Other Departments (7,950) (8,000) (8,000) -
Program Generated Revenue (11,214) (13,000) (13,000) -
Net Cost Total 1,655,448 1,924,006 1,910,477 <0.70%>
Direct Cost by CategorySalaries and Benefits
1101 - Straight Time Labor 331,987 383,496 393,783 2.68%
1201 - Overtime - 2,000 2,000 -
1301 - Leave/Holiday Accruals 58,184 7,494 7,711 2.90%
1401 - Benefits 203,079 220,551 224,413 1.75%
Salaries and Benefits Total 593,250 613,541 627,908 2.34%
Supplies 10,540 5,970 5,970 -
Travel - - - -
Contractual/Other Services 34,290 100,850 100,850 -
Equipment, Furnishings 788 2,700 2,700 -
Manageable Direct Cost Total 638,868 723,061 737,428 1.99%
Debt Service, Depreciation - - - -
Direct Cost Total 638,868 723,061 737,428 1.99%
Intra-Governmental ChargesCharges By Other Departments 1,035,745 1,221,945 1,194,050 <2.28%>
Charges to Other Departments (7,950) (8,000) (8,000) -
Program Generated Revenue9446 - Park Land & Operations 11,214 13,000 13,000 -
Program Generated Revenue Total 11,214 13,000 13,000 -
Parks and RecreationDivision Detail
(Dept ID # 5114, 5501)
Anch Parks & Rec Admin
2012Revised
2013Proposed
2011Actuals
13 v 12% Chg
2013 Proposed General Government Operating Budget
19 - 13
2011Actuals
2012Revised
2013Proposed
13 v 12% Chg
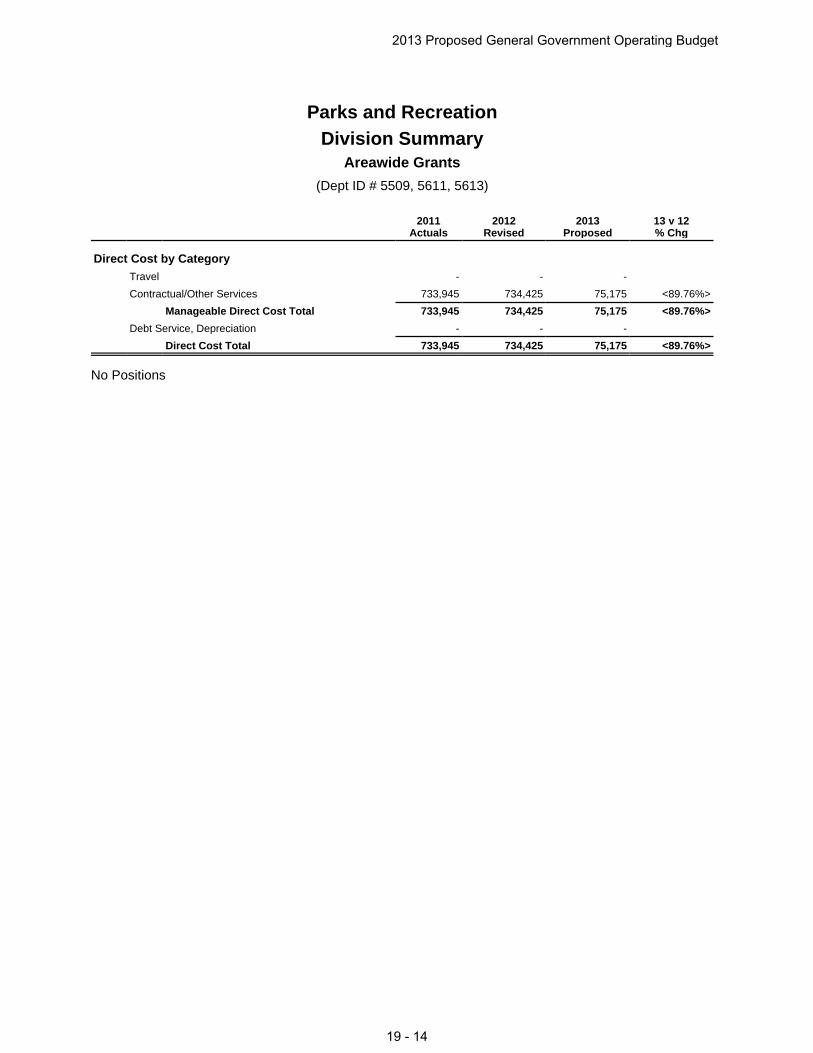
Direct Cost by CategoryTravel - - -
Contractual/Other Services 733,945 734,425 75,175 <89.76%>
Manageable Direct Cost Total 733,945 734,425 75,175 <89.76%>
Debt Service, Depreciation - - -
Direct Cost Total 733,945 734,425 75,175 <89.76%>
No Positions
Parks and RecreationDivision Summary
(Dept ID # 5509, 5611, 5613)
Areawide Grants
2013 Proposed General Government Operating Budget
19 - 14
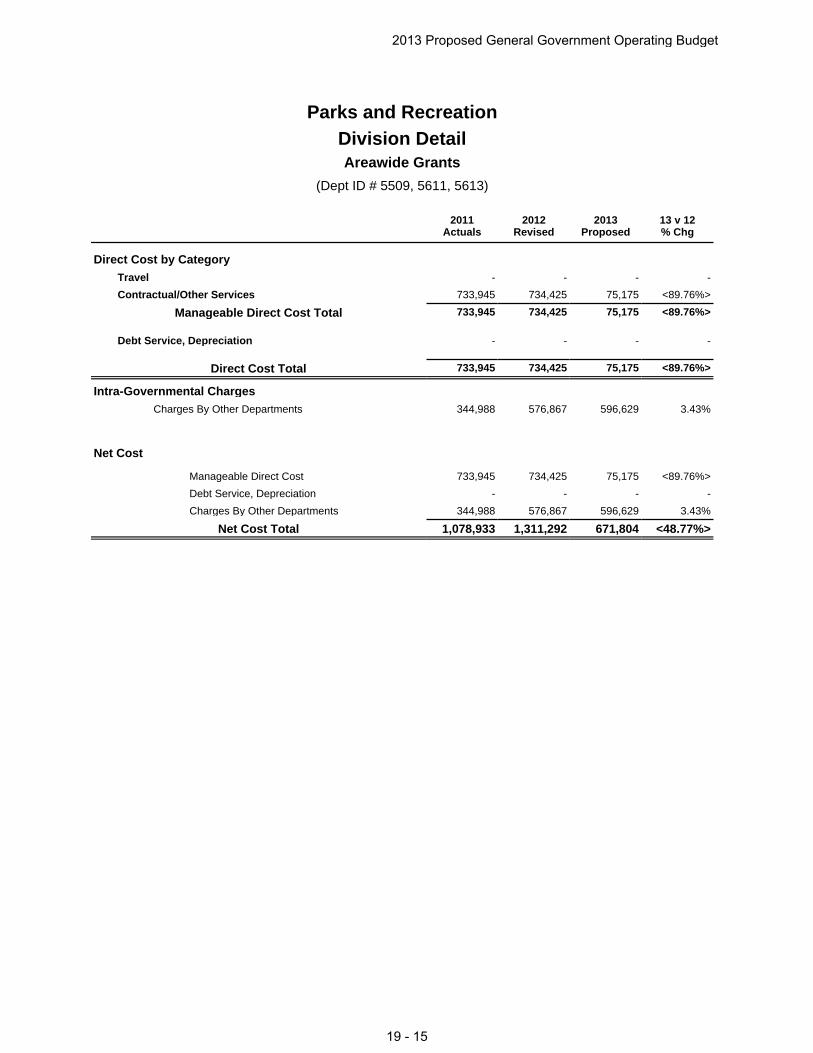
Net Cost
Manageable Direct Cost 733,945 734,425 75,175 <89.76%>
Debt Service, Depreciation - - - -
Charges By Other Departments 344,988 576,867 596,629 3.43%
Net Cost Total 1,078,933 1,311,292 671,804 <48.77%>
Direct Cost by CategoryTravel - - - -
Contractual/Other Services 733,945 734,425 75,175 <89.76%>
Manageable Direct Cost Total 733,945 734,425 75,175 <89.76%>
Debt Service, Depreciation - - - -
Direct Cost Total 733,945 734,425 75,175 <89.76%>
Intra-Governmental ChargesCharges By Other Departments 344,988 576,867 596,629 3.43%
Parks and RecreationDivision Detail
(Dept ID # 5509, 5611, 5613)
Areawide Grants
2012Revised
2013Proposed
2011Actuals
13 v 12% Chg
2013 Proposed General Government Operating Budget
19 - 15

2011Actuals
2012Revised
2013Proposed
13 v 12% Chg
Direct Cost by CategoryTravel - - -
Contractual/Other Services - 29,930 29,930 -
Manageable Direct Cost Total - 29,930 29,930 -
Debt Service, Depreciation 2,559,163 3,097,416 3,066,643 <0.99%>
Direct Cost Total 2,559,163 3,127,346 3,096,573 <0.98%>
Revenue by FundFund 161 - Anchorage Bowl Parks & Rec SA 67,416 43,888 43,888 -
Revenue Total 67,416 43,888 43,888 -
No Positions
Parks and RecreationDivision Summary
(Dept ID # 5121)
Debt Service - Fund 161
2013 Proposed General Government Operating Budget
19 - 16
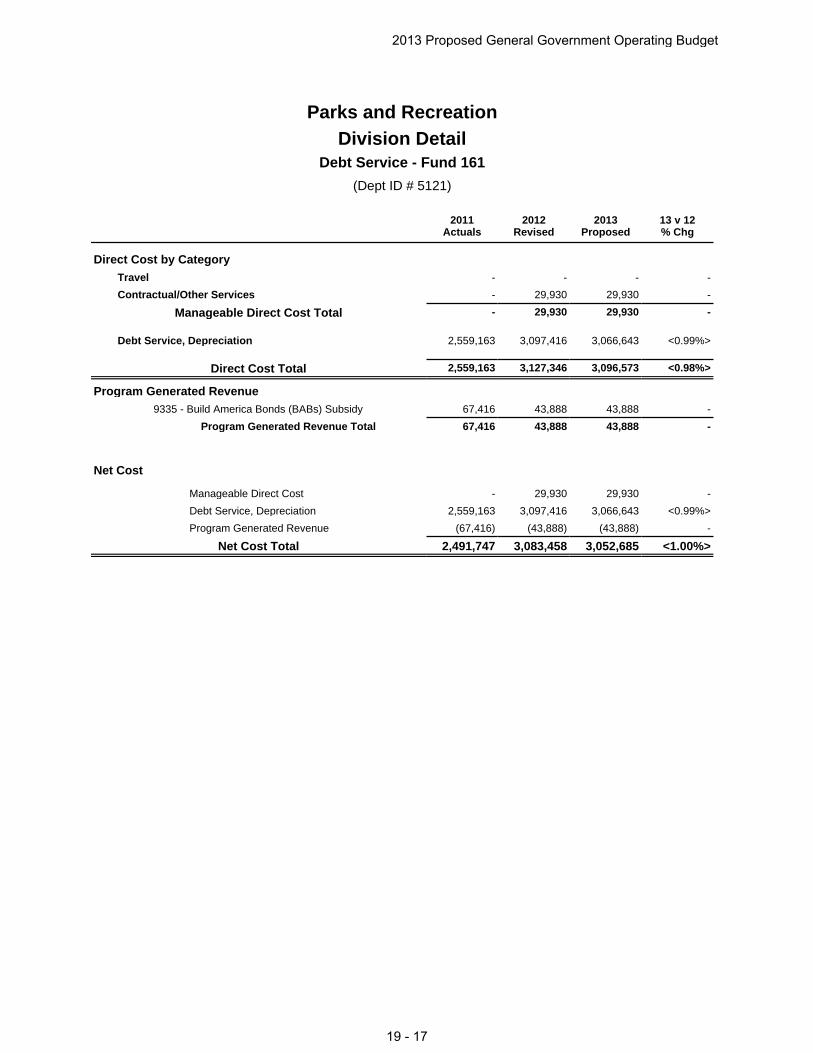
Net Cost
Manageable Direct Cost - 29,930 29,930 -
Debt Service, Depreciation 2,559,163 3,097,416 3,066,643 <0.99%>
Program Generated Revenue (67,416) (43,888) (43,888) -
Net Cost Total 2,491,747 3,083,458 3,052,685 <1.00%>
Direct Cost by CategoryTravel - - - -
Contractual/Other Services - 29,930 29,930 -
Manageable Direct Cost Total - 29,930 29,930 -
Debt Service, Depreciation 2,559,163 3,097,416 3,066,643 <0.99%>
Direct Cost Total 2,559,163 3,127,346 3,096,573 <0.98%>
Program Generated Revenue9335 - Build America Bonds (BABs) Subsidy 67,416 43,888 43,888 -
Program Generated Revenue Total 67,416 43,888 43,888 -
Parks and RecreationDivision Detail
(Dept ID # 5121)
Debt Service - Fund 161
2012Revised
2013Proposed
2011Actuals
13 v 12% Chg
2013 Proposed General Government Operating Budget
19 - 17
2011Actuals
2012Revised
2013Proposed
13 v 12% Chg
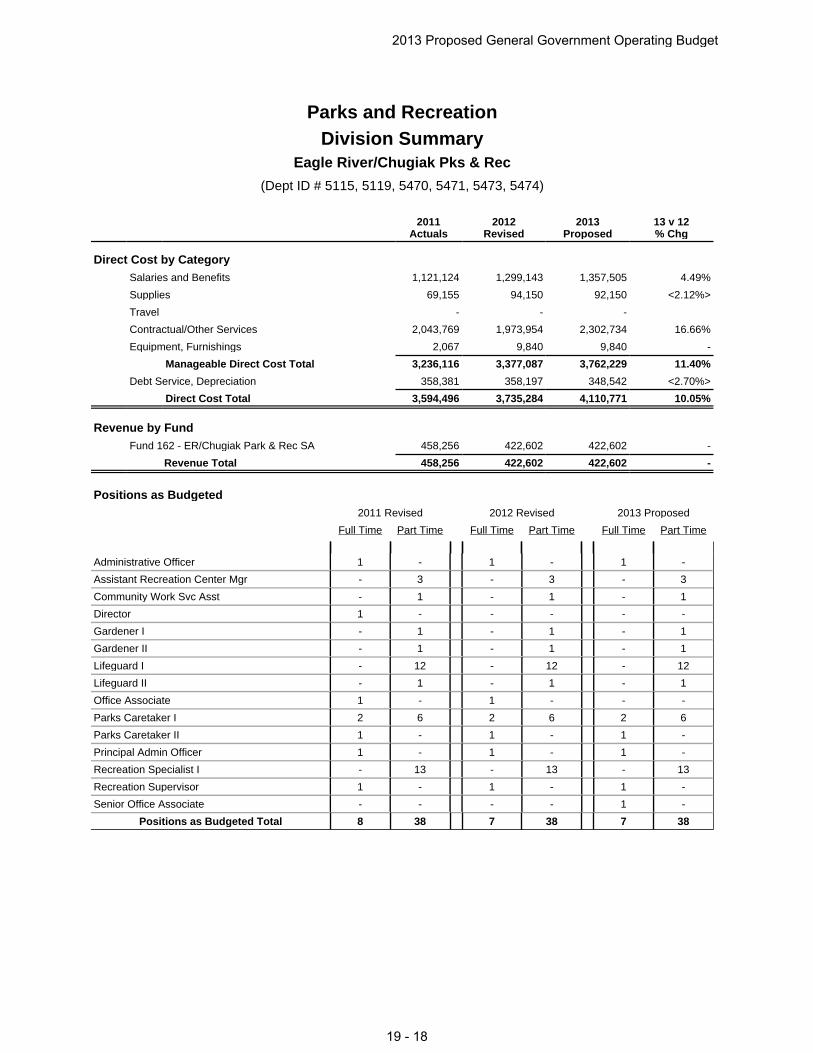
Direct Cost by CategorySalaries and Benefits 1,121,124 1,299,143 1,357,505 4.49%
Supplies 69,155 94,150 92,150 <2.12%>
Travel - - -
Contractual/Other Services 2,043,769 1,973,954 2,302,734 16.66%
Equipment, Furnishings 2,067 9,840 9,840 -
Manageable Direct Cost Total 3,236,116 3,377,087 3,762,229 11.40%
Debt Service, Depreciation 358,381 358,197 348,542 <2.70%>
Direct Cost Total 3,594,496 3,735,284 4,110,771 10.05%
Revenue by FundFund 162 - ER/Chugiak Park & Rec SA 458,256 422,602 422,602 -
Revenue Total 458,256 422,602 422,602 -
Positions as Budgeted2011 Revised 2012 Revised 2013 Proposed
Full Time Part Time Full Time Part Time Full Time Part Time
Administrative Officer 1 - 1 - 1 -
Assistant Recreation Center Mgr - 3 - 3 - 3
Community Work Svc Asst - 1 - 1 - 1
Director 1 - - - - -
Gardener I - 1 - 1 - 1
Gardener II - 1 - 1 - 1
Lifeguard I - 12 - 12 - 12
Lifeguard II - 1 - 1 - 1
Office Associate 1 - 1 - - -
Parks Caretaker I 2 6 2 6 2 6
Parks Caretaker II 1 - 1 - 1 -
Principal Admin Officer 1 - 1 - 1 -
Recreation Specialist I - 13 - 13 - 13
Recreation Supervisor 1 - 1 - 1 -
Senior Office Associate - - - - 1 -
Positions as Budgeted Total 8 38 7 38 7 38
Parks and RecreationDivision Summary
(Dept ID # 5115, 5119, 5470, 5471, 5473, 5474)
Eagle River/Chugiak Pks & Rec
2013 Proposed General Government Operating Budget
19 - 18
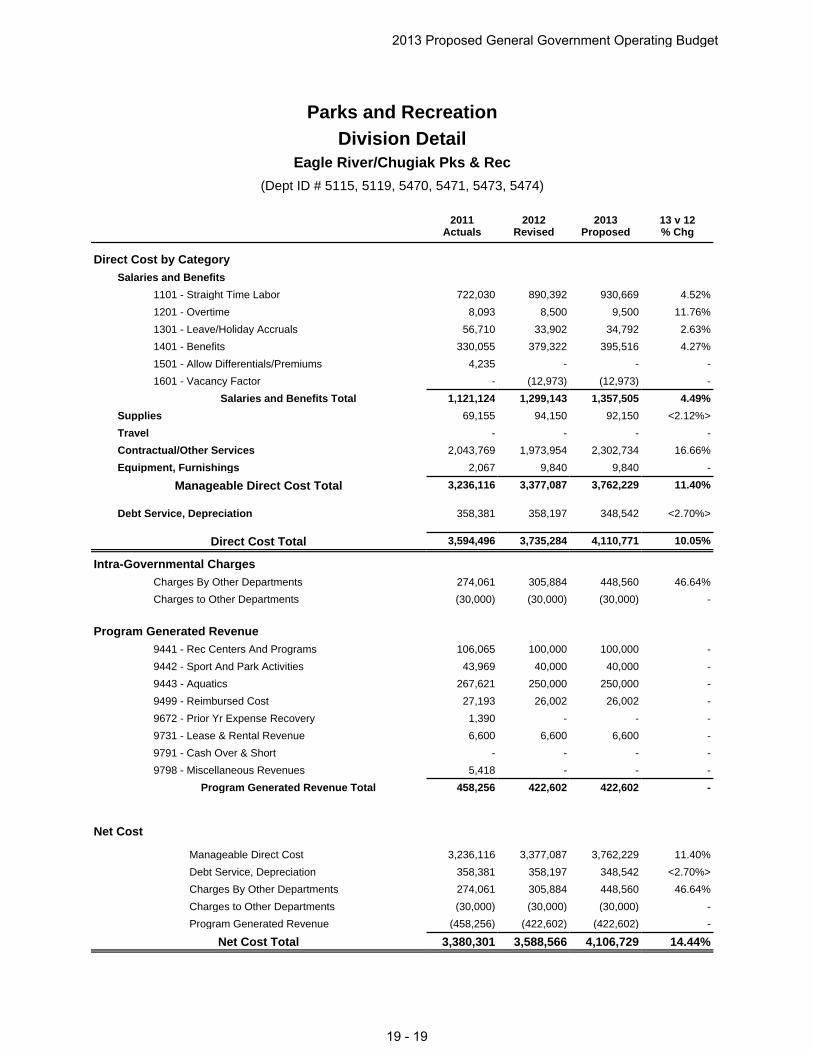
Net Cost
Manageable Direct Cost 3,236,116 3,377,087 3,762,229 11.40%
Debt Service, Depreciation 358,381 358,197 348,542 <2.70%>
Charges By Other Departments 274,061 305,884 448,560 46.64%
Charges to Other Departments (30,000) (30,000) (30,000) -
Program Generated Revenue (458,256) (422,602) (422,602) -
Net Cost Total 3,380,301 3,588,566 4,106,729 14.44%
Direct Cost by CategorySalaries and Benefits
1101 - Straight Time Labor 722,030 890,392 930,669 4.52%
1201 - Overtime 8,093 8,500 9,500 11.76%
1301 - Leave/Holiday Accruals 56,710 33,902 34,792 2.63%
1401 - Benefits 330,055 379,322 395,516 4.27%
1501 - Allow Differentials/Premiums 4,235 - - -
1601 - Vacancy Factor - (12,973) (12,973) -
Salaries and Benefits Total 1,121,124 1,299,143 1,357,505 4.49%
Supplies 69,155 94,150 92,150 <2.12%>
Travel - - - -
Contractual/Other Services 2,043,769 1,973,954 2,302,734 16.66%
Equipment, Furnishings 2,067 9,840 9,840 -
Manageable Direct Cost Total 3,236,116 3,377,087 3,762,229 11.40%
Debt Service, Depreciation 358,381 358,197 348,542 <2.70%>
Direct Cost Total 3,594,496 3,735,284 4,110,771 10.05%
Intra-Governmental ChargesCharges By Other Departments 274,061 305,884 448,560 46.64%
Charges to Other Departments (30,000) (30,000) (30,000) -
Program Generated Revenue9441 - Rec Centers And Programs 106,065 100,000 100,000 -
9442 - Sport And Park Activities 43,969 40,000 40,000 -
9443 - Aquatics 267,621 250,000 250,000 -
9499 - Reimbursed Cost 27,193 26,002 26,002 -
9672 - Prior Yr Expense Recovery 1,390 - - -
9731 - Lease & Rental Revenue 6,600 6,600 6,600 -
9791 - Cash Over & Short - - - -
9798 - Miscellaneous Revenues 5,418 - - -
Program Generated Revenue Total 458,256 422,602 422,602 -
Parks and RecreationDivision Detail
(Dept ID # 5115, 5119, 5470, 5471, 5473, 5474)
Eagle River/Chugiak Pks & Rec
2012Revised
2013Proposed
2011Actuals
13 v 12% Chg
2013 Proposed General Government Operating Budget
19 - 19
2011Actuals
2012Revised
2013Proposed
13 v 12% Chg
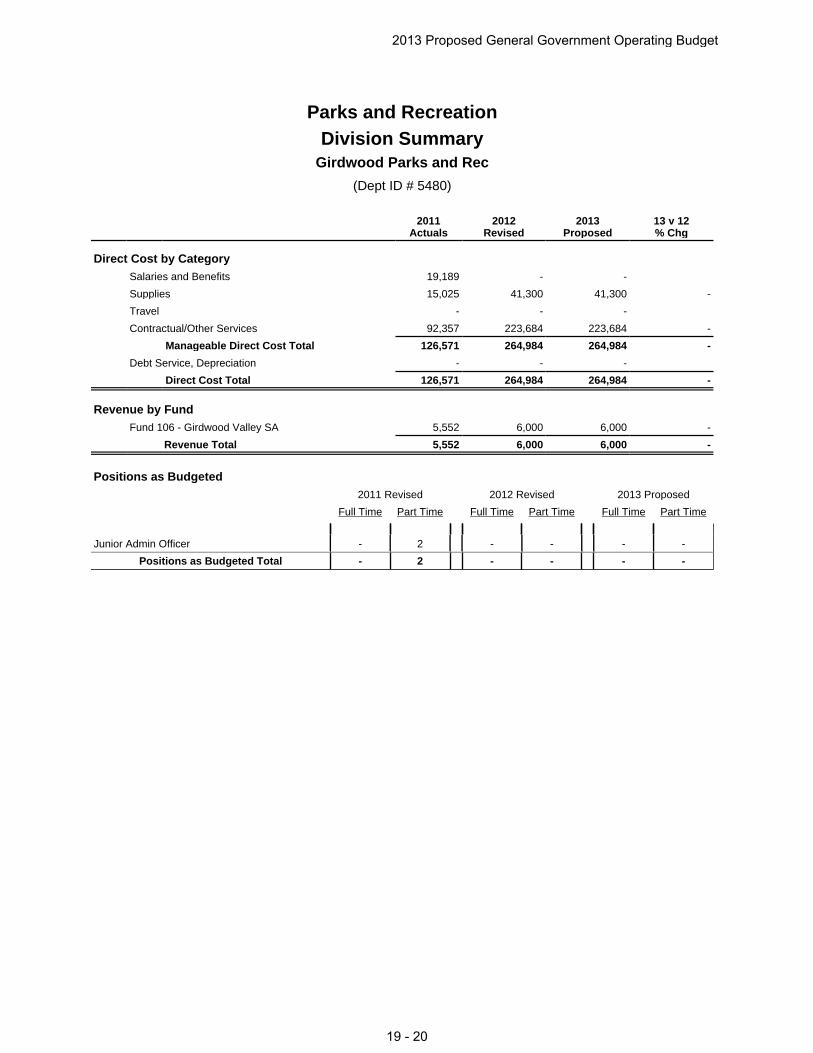
Direct Cost by CategorySalaries and Benefits 19,189 - -
Supplies 15,025 41,300 41,300 -
Travel - - -
Contractual/Other Services 92,357 223,684 223,684 -
Manageable Direct Cost Total 126,571 264,984 264,984 -
Debt Service, Depreciation - - -
Direct Cost Total 126,571 264,984 264,984 -
Revenue by FundFund 106 - Girdwood Valley SA 5,552 6,000 6,000 -
Revenue Total 5,552 6,000 6,000 -
Positions as Budgeted2011 Revised 2012 Revised 2013 Proposed
Full Time Part Time Full Time Part Time Full Time Part Time
Junior Admin Officer - 2 - - - -
Positions as Budgeted Total - 2 - - - -
Parks and RecreationDivision Summary
(Dept ID # 5480)
Girdwood Parks and Rec
2013 Proposed General Government Operating Budget
19 - 20
Net Cost
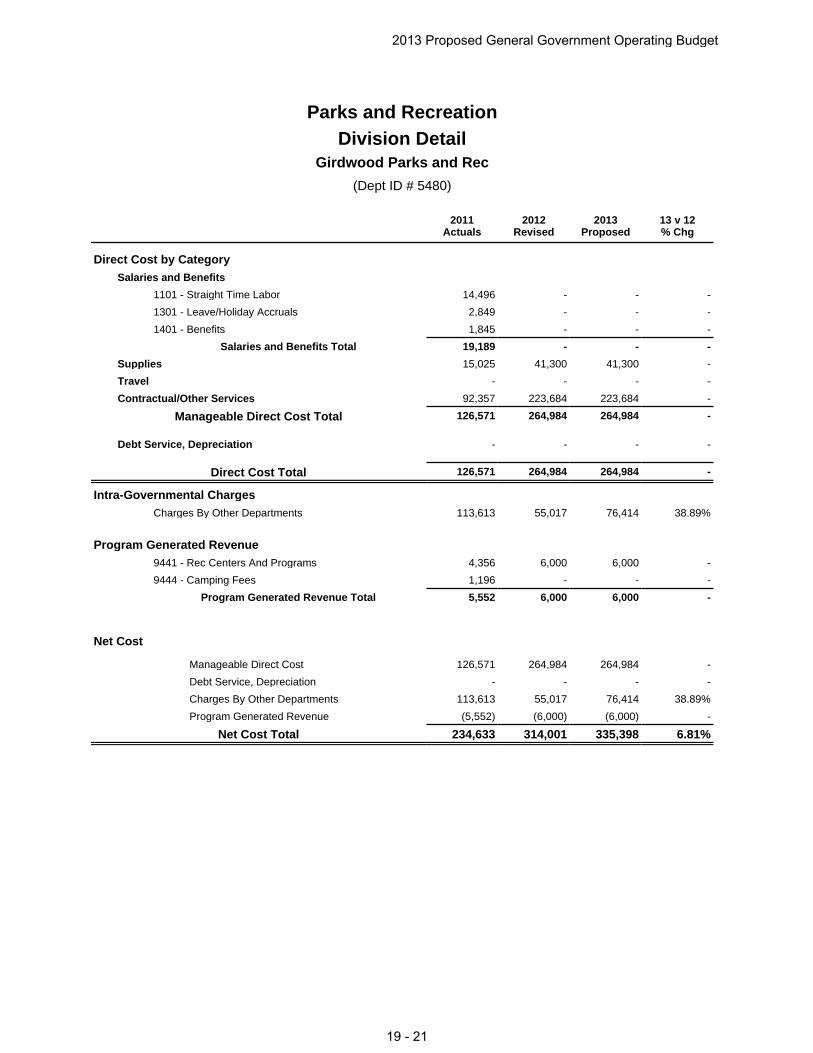
Manageable Direct Cost 126,571 264,984 264,984 -
Debt Service, Depreciation - - - -
Charges By Other Departments 113,613 55,017 76,414 38.89%
Program Generated Revenue (5,552) (6,000) (6,000) -
Net Cost Total 234,633 314,001 335,398 6.81%
Direct Cost by CategorySalaries and Benefits
1101 - Straight Time Labor 14,496 - - -
1301 - Leave/Holiday Accruals 2,849 - - -
1401 - Benefits 1,845 - - -
Salaries and Benefits Total 19,189 - - -
Supplies 15,025 41,300 41,300 -
Travel - - - -
Contractual/Other Services 92,357 223,684 223,684 -
Manageable Direct Cost Total 126,571 264,984 264,984 -
Debt Service, Depreciation - - - -
Direct Cost Total 126,571 264,984 264,984 -
Intra-Governmental ChargesCharges By Other Departments 113,613 55,017 76,414 38.89%
Program Generated Revenue9441 - Rec Centers And Programs 4,356 6,000 6,000 -
9444 - Camping Fees 1,196 - - -
Program Generated Revenue Total 5,552 6,000 6,000 -
Parks and RecreationDivision Detail
(Dept ID # 5480)
Girdwood Parks and Rec
2012Revised
2013Proposed
2011Actuals
13 v 12% Chg
2013 Proposed General Government Operating Budget
19 - 21
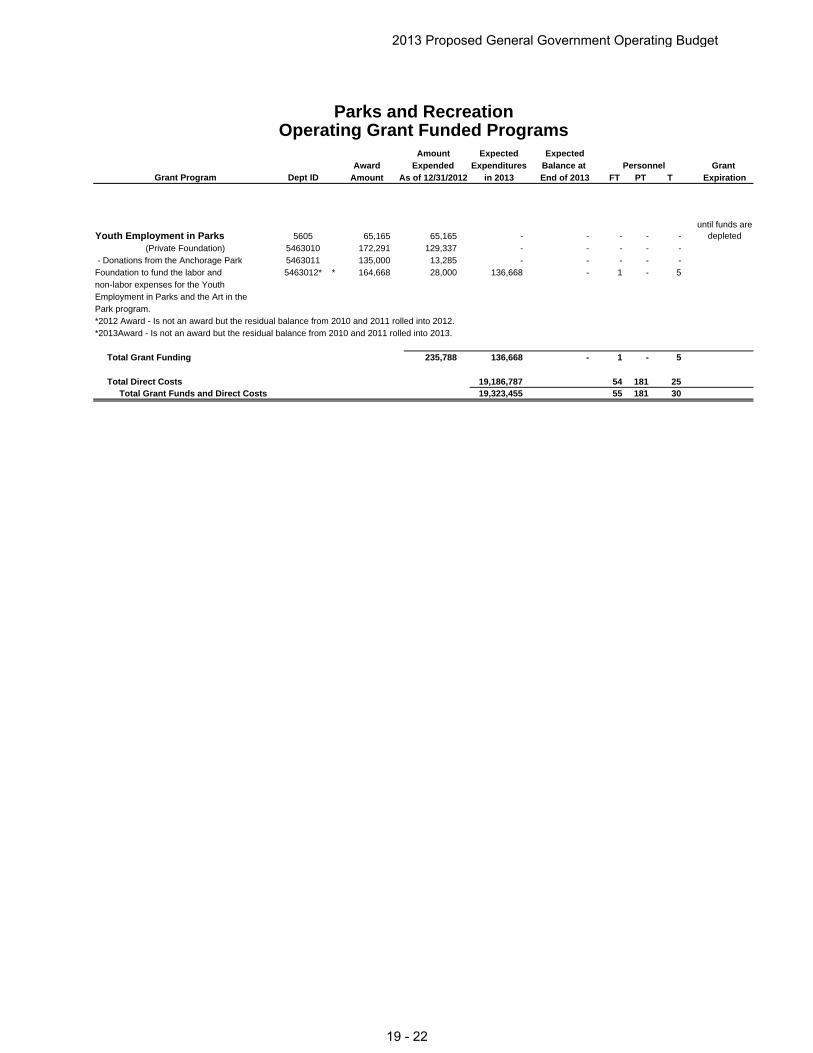
Amount Expected ExpectedAward Expended Expenditures Balance at Grant
Grant Program Dept ID Amount As of 12/31/2012 in 2013 End of 2013 FT PT T Expiration
Youth Employment in Parks 5605 65,165 65,165 - - - - - until funds are
depleted
(Private Foundation) 5463010 172,291 129,337 - - - - - - Donations from the Anchorage Park 5463011 135,000 13,285 - - - - - Foundation to fund the labor and 5463012* * 164,668 28,000 136,668 - 1 - 5 non-labor expenses for the Youth Employment in Parks and the Art in thePark program.
Total Grant Funding 235,788 136,668 - 1 - 5
Total Direct Costs 19,186,787 54 181 25 Total Grant Funds and Direct Costs 19,323,455 55 181 30
*2013Award - Is not an award but the residual balance from 2010 and 2011 rolled into 2013.
Parks and RecreationOperating Grant Funded Programs
Personnel
*2012 Award - Is not an award but the residual balance from 2010 and 2011 rolled into 2012.
2013 Proposed General Government Operating Budget
19 - 22

Anchorage: Performance. Value. Results

Parks and Recreation Department Anchorage: Performance. Value. Results.
Mission
Provide for “Healthy Parks, Healthy People, Healthy Future” through ensuring Anchorage parks, facilities and programs are well maintained, safe, accessible and enjoyable.
Core Services
• Park Operations – maintain and improve the health of the Municipality of Anchorage park system for the benefit of present and future generations through managed development; and routine care and maintenance of parks, trails, green spaces, trees, and facilities.
• Community Development – promote community giving to foster economic growth and community volunteerism in the care and improvement of park assets and in the delivery of parks and recreation services.
• Recreation Services - promote healthy lifestyles by delivering year-round recreation and volunteer programs in the Municipality of Anchorage’s parks, pools, and recreation facilities.
Accomplishment Goals
• Provide opportunities for residents and visitors to enjoy Anchorage’s parks and facilities.
• Deliver parks and recreation opportunities in a cost-efficient manner. • Provide recreation opportunities that are safe, secure and enjoyable. • Engage residents to actively participate and volunteer in the community. • Foster private-public partnerships and innovated funding sources to establish a
balance in the financing of parks and recreation services and in the development of capital improvement projects through state and federal grants, user fees, volunteer support, and private contributions.
Performance Measures Progress in achieving goals shall be measured by: Measure #1:
The number of parks and recreation opportunity hours offered through the Parks and Recreation Department
Parks & Recreation Opportunity Hours
2009 Actual
2010 Actual
2011 Actual
Q-1 Actual
Q-2 Actual
Annual Number of Parks & Recreation Opportunity Hours
21,438,759 21,005,889 19,811,730
3,642721 6517,751
Measure #2:
The average tax support for a parks and recreation opportunity hour.
Tax Support 2009 Actual
2010 Actual
2011 Actual
Q-1 Actual
Q-2 Actual
Annual Tax Support Per Opportunity Hour
$0.57 $0.57 $0.58
$0.67 $0.56
2013 Proposed General Government Operating Budget
19 - 23
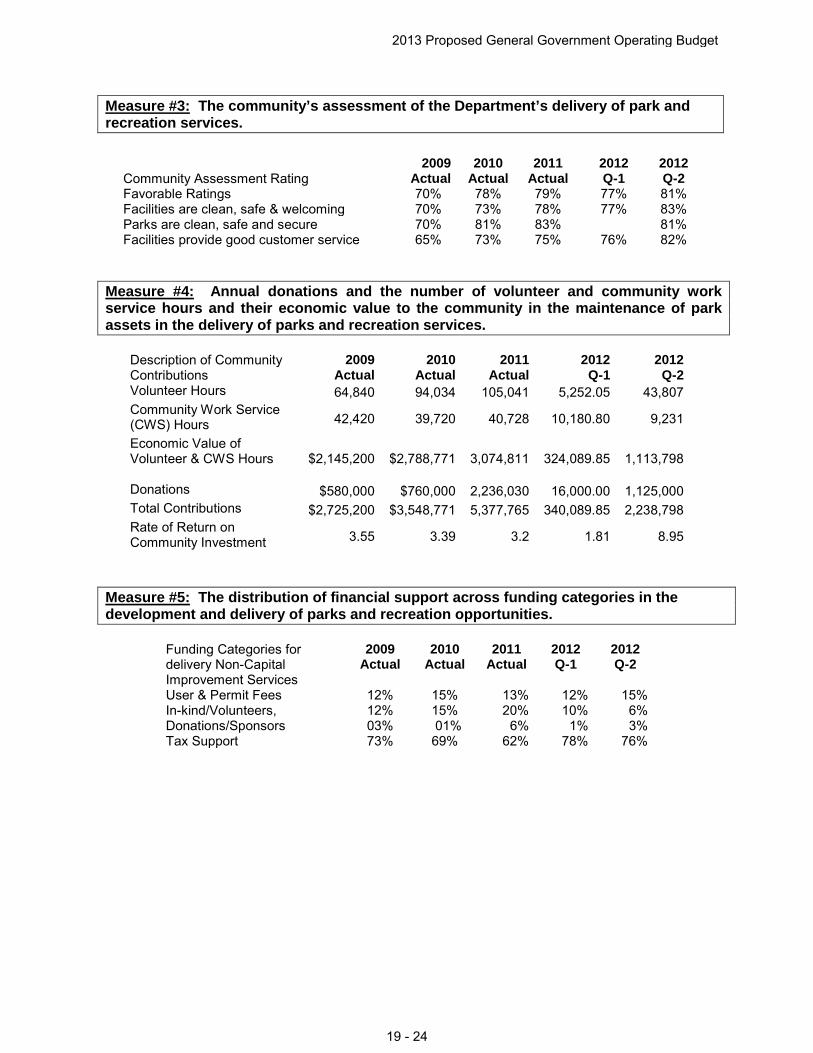
Measure #3:
The community’s assessment of the Department’s delivery of park and recreation services.
Measure #4:
Annual donations and the number of volunteer and community work service hours and their economic value to the community in the maintenance of park assets in the delivery of parks and recreation services.
Description of Community Contributions
2009 Actual
2010 Actual
2011 Actual
2012 Q-1
2012 Q-2
Volunteer Hours 64,840 94,034 105,041 5,252.05 43,807 Community Work Service (CWS) Hours 42,420 39,720 40,728 10,180.80 9,231
Economic Value of Volunteer & CWS Hours $2,145,200 $2,788,771 3,074,811 324,089.85 1,113,798
Donations $580,000 $760,000 2,236,030 16,000.00 1,125,000 Total Contributions $2,725,200 $3,548,771 5,377,765 340,089.85 2,238,798 Rate of Return on Community Investment 3.55 3.39 3.2 1.81 8.95
Measure #5:
The distribution of financial support across funding categories in the development and delivery of parks and recreation opportunities.
Funding Categories for delivery Non-Capital Improvement Services
2009 Actual
2010 Actual
2011 Actual
2012 Q-1
2012 Q-2
User & Permit Fees 12% 15% 13% 12% 15% In-kind/Volunteers, 12% 15% 20% 10% 6% Donations/Sponsors 03% 01% 6% 1% 3% Tax Support 73% 69% 62% 78% 76%
Community Assessment Rating
2009 Actual
2010 Actual
2011 Actual
2012 Q-1
2012 Q-2
Favorable Ratings 70% 78% 79% 77% 81% Facilities are clean, safe & welcoming 70% 73% 78% 77% 83% Parks are clean, safe and secure 70% 81% 83% 81% Facilities provide good customer service 65% 73% 75% 76% 82%
2013 Proposed General Government Operating Budget
19 - 24
Parks Operations Division Parks and Recreation Department
Anchorage: Performance. Value. Results. Purpose
A stewardship requirement of the Department is to provide safe, aesthetically pleasing and usable parks and recreation facilities for public use. To accomplish this requirement daily recurrent, frequently-scheduled service and monitoring of the facilities is essential to meet the needs of ever-increasing user groups, to support new and existing recreation programs and to reduce liability risks throughout the system. The Parks Operations Division will fulfill its stewardship requirement by organizing and implementing a maintenance zone management system.
Direct Services
• Park Development -
•
is responsible for open space planning, site planning, landscape reclamation, project management and technical services associated with the delivery of new or updated park and recreation infrastructures and for generating community involvement and private funds for park improvement projects.
Park Maintenance
• Horticulture and Forestry – the Horticulture Section is responsible for the operation of the Municipal Greenhouse, the annual growth of 83,000 flowers, and the landscaping and maintenance of 350 beautification sites. The Forestry Section is responsible for the strategic planning and maintenance of Anchorage’s tree canopy and natural parks.
– maintains the Anchorage Bowl Park Inventory of 10,861 acres of park land that includes 113 developed parks and 107 undeveloped parks. Property includes 220 miles of trails and greenbelts that link neighborhoods with surrounding natural open spaces and wildlife habitat.
• Community Work Service – the staff and participants assists the other Sections of the Parks Operations Division in cleaning, beautifying and repairing park property and facilities.
Accomplishment Goals
• Through the practice of routine maintenance, maintain Municipal park assets to ensure optimum risk management by keeping parks, trails, and facilities in a state of good
•
repair, and that are safe and welcoming.
Through planned and managed development improve the safety, appearance and usability of Anchorage Neighborhood Parks in an effective and cost efficient manner.
Performance Measures Progress in achieving goals will be measured by:
2013 Proposed General Government Operating Budget
19 - 25
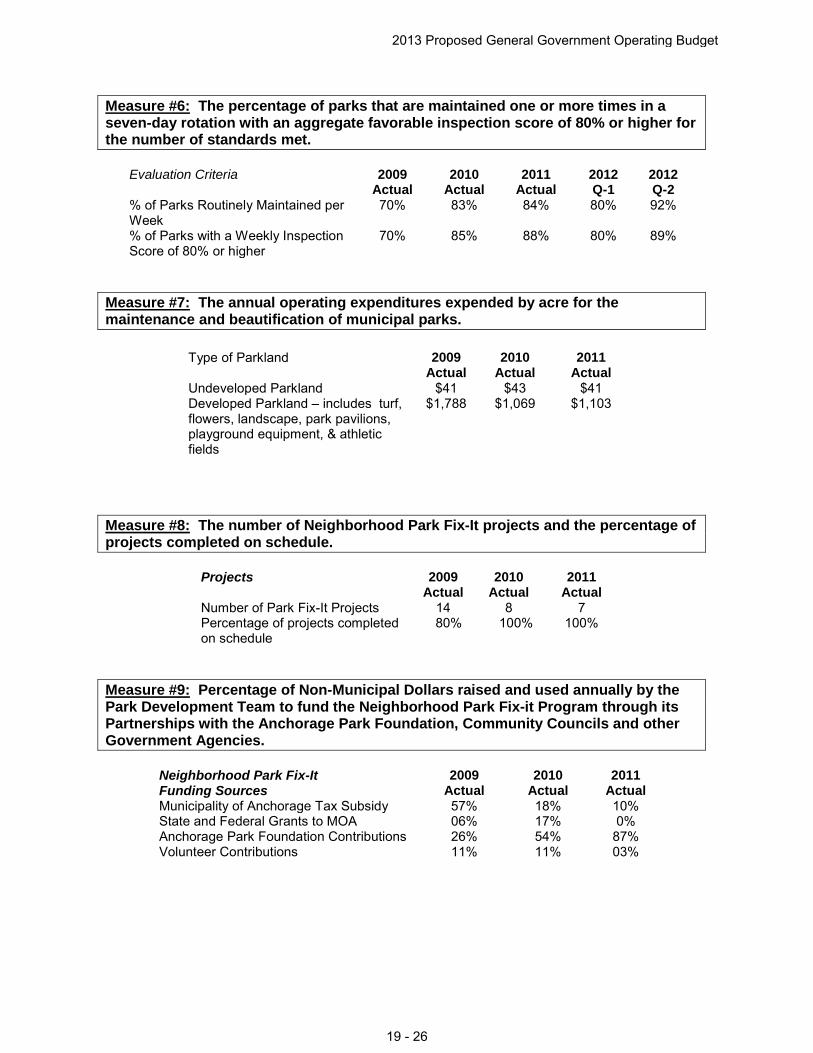
Measure #6:
The percentage of parks that are maintained one or more times in a seven-day rotation with an aggregate favorable inspection score of 80% or higher for the number of standards met.
Evaluation Criteria 2009 Actual
2010 Actual
2011 Actual
2012 Q-1
2012 Q-2
% of Parks Routinely Maintained per Week
70% 83% 84% 80% 92%
% of Parks with a Weekly Inspection Score of 80% or higher
70% 85% 88% 80% 89%
Measure #7:
The annual operating expenditures expended by acre for the maintenance and beautification of municipal parks.
Measure #8:
The number of Neighborhood Park Fix-It projects and the percentage of projects completed on schedule.
Projects 2009 Actual
2010 Actual
2011 Actual
Number of Park Fix-It Projects 14 8 7 Percentage of projects completed on schedule
80% 100% 100%
Measure #9:
Percentage of Non-Municipal Dollars raised and used annually by the Park Development Team to fund the Neighborhood Park Fix-it Program through its Partnerships with the Anchorage Park Foundation, Community Councils and other Government Agencies.
Neighborhood Park Fix-It Funding Sources
2009 Actual
2010 Actual
2011 Actual
Municipality of Anchorage Tax Subsidy 57% 18% 10% State and Federal Grants to MOA 06% 17% 0% Anchorage Park Foundation Contributions 26% 54% 87% Volunteer Contributions 11% 11% 03%
Type of Parkland 2009 Actual
2010 Actual
2011 Actual
Undeveloped Parkland $41 $43 $41 Developed Parkland – includes turf, flowers, landscape, park pavilions, playground equipment, & athletic fields
$1,788 $1,069 $1,103
2013 Proposed General Government Operating Budget
19 - 26
Recreation Services Division Parks and Recreation Department
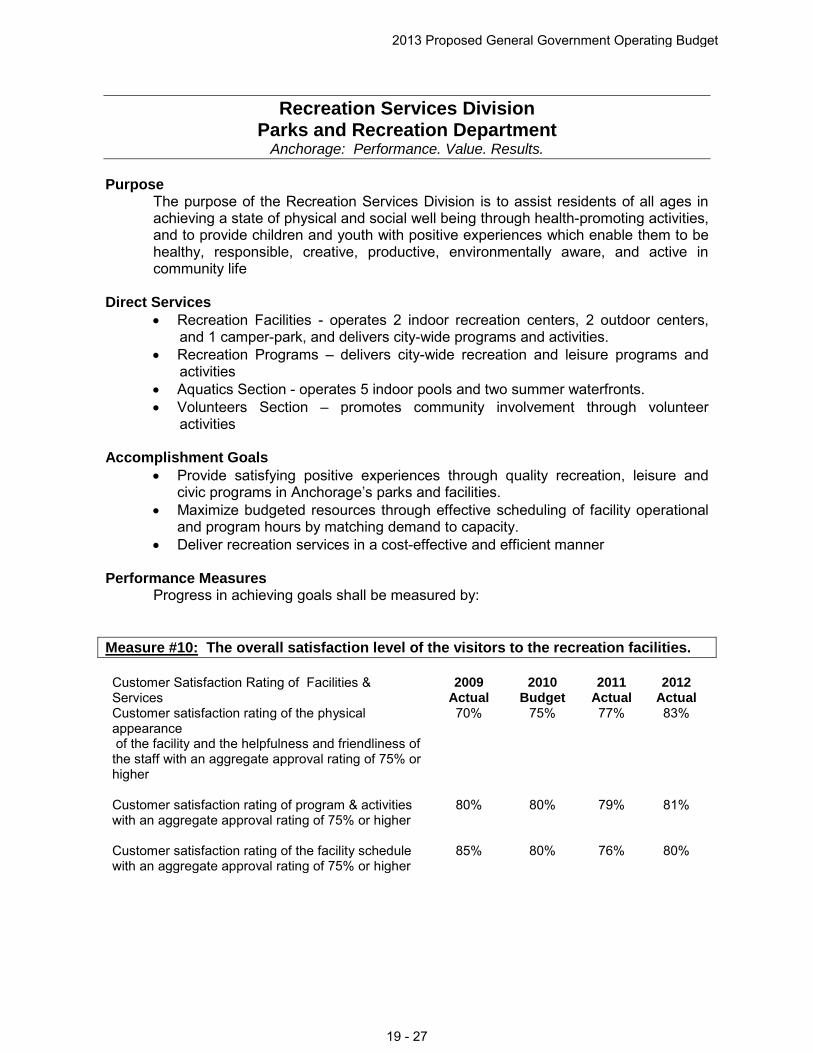
Anchorage: Performance. Value. Results. Purpose
The purpose of the Recreation Services Division is to assist residents of all ages in achieving a state of physical and social well being through health-promoting activities, and to provide children and youth with positive experiences which enable them to be healthy, responsible, creative, productive, environmentally aware, and active in community life
Direct Services
• Recreation Facilities - operates 2 indoor recreation centers, 2 outdoor centers, and 1 camper-park, and delivers city-wide programs and activities.
• Recreation Programs – delivers city-wide recreation and leisure programs and activities
• Aquatics Section - operates 5 indoor pools and two summer waterfronts. • Volunteers Section – promotes community involvement through volunteer
activities Accomplishment Goals
• Provide satisfying positive experiences through quality recreation, leisure and civic programs in Anchorage’s parks and facilities.
• Maximize budgeted resources through effective scheduling of facility operational and program hours by matching demand to capacity.
• Deliver recreation services in a cost-effective and efficient manner Performance Measures
Progress in achieving goals shall be measured by: Measure #10:
The overall satisfaction level of the visitors to the recreation facilities.
Customer Satisfaction Rating of Facilities & Services
2009 Actual
2010 Budget
2011 Actual
2012 Actual
Customer satisfaction rating of the physical appearance of the facility and the helpfulness and friendliness of the staff with an aggregate approval rating of 75% or higher
70% 75% 77% 83%
Customer satisfaction rating of program & activities with an aggregate approval rating of 75% or higher
80% 80% 79% 81%
Customer satisfaction rating of the facility schedule with an aggregate approval rating of 75% or higher
85% 80% 76% 80%
2013 Proposed General Government Operating Budget
19 - 27
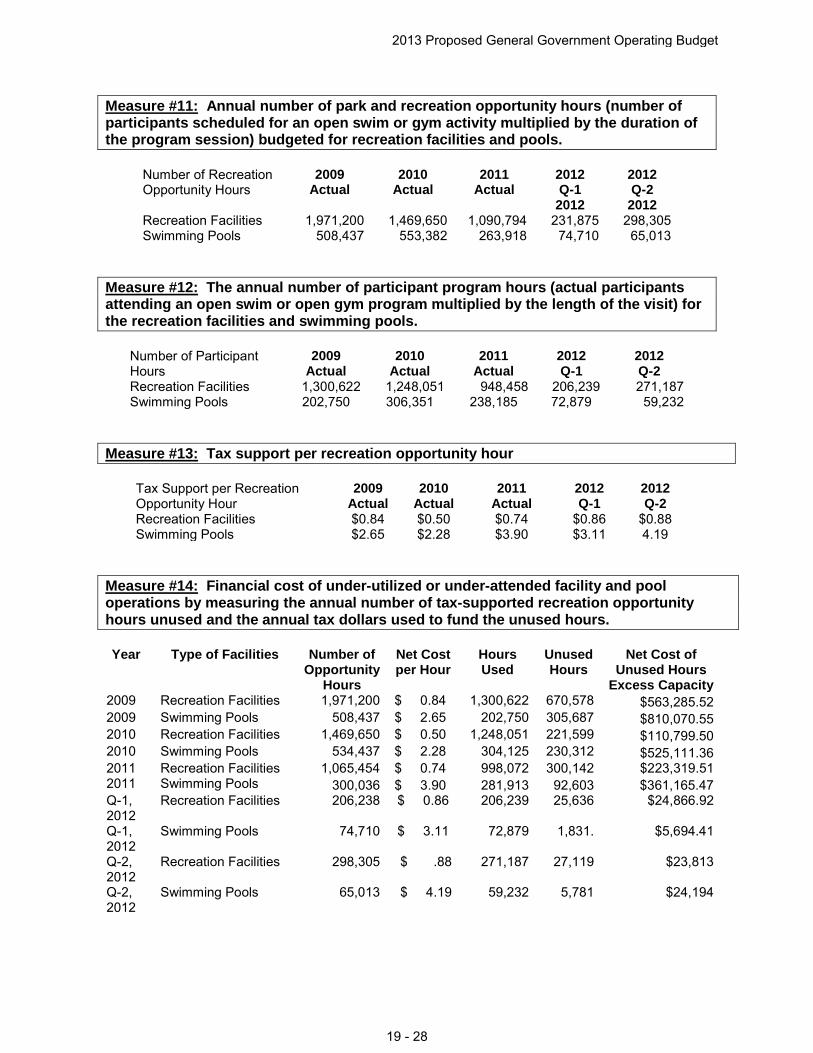
Measure #11:
Annual number of park and recreation opportunity hours (number of participants scheduled for an open swim or gym activity multiplied by the duration of the program session) budgeted for recreation facilities and pools.
Number of Recreation Opportunity Hours
2009 Actual
2010 Actual
2011 Actual
2012 Q-1 2012
2012 Q-2 2012
Recreation Facilities 1,971,200 1,469,650 1,090,794 231,875 298,305 Swimming Pools 508,437 553,382 263,918 74,710 65,013
Measure #12:
The annual number of participant program hours (actual participants attending an open swim or open gym program multiplied by the length of the visit) for the recreation facilities and swimming pools.
Number of Participant Hours
2009 Actual
2010 Actual
2011 Actual
2012 Q-1
2012 Q-2
Recreation Facilities 1,300,622 1,248,051 948,458 206,239 271,187 Swimming Pools 202,750 306,351 238,185 72,879 59,232
Measure #13:
Tax support per recreation opportunity hour
Tax Support per Recreation Opportunity Hour
2009 Actual
2010 Actual
2011 Actual
2012 Q-1
2012 Q-2
Recreation Facilities $0.84 $0.50 $0.74 $0.86 $0.88 Swimming Pools $2.65 $2.28 $3.90 $3.11 4.19
Measure #14:
Financial cost of under-utilized or under-attended facility and pool operations by measuring the annual number of tax-supported recreation opportunity hours unused and the annual tax dollars used to fund the unused hours.
Year Type of Facilities Number of Opportunity
Hours
Net Cost per Hour
Hours Used
Unused Hours
Net Cost of Unused Hours
Excess Capacity 2009 Recreation Facilities 1,971,200 $ 0.84 1,300,622 670,578 $563,285.52 2009 Swimming Pools 508,437 $ 2.65 202,750 305,687 $810,070.55 2010 Recreation Facilities 1,469,650 $ 0.50 1,248,051 221,599 $110,799.50 2010 Swimming Pools 534,437 $ 2.28 304,125 230,312 $525,111.36 2011 Recreation Facilities 1,065,454 $ 0.74 998,072 300,142 $223,319.51 2011 Swimming Pools 300,036 $ 3.90 281,913 92,603 $361,165.47 Q-1, 2012
Recreation Facilities 206,238 $ 0.86 206,239 25,636 $24,866.92
Q-1, 2012
Swimming Pools 74,710 $ 3.11 72,879 1,831. $5,694.41
Q-2, 2012
Recreation Facilities 298,305 $ .88 271,187 27,119 $23,813
Q-2, 2012
Swimming Pools 65,013 $ 4.19 59,232 5,781 $24,194
2013 Proposed General Government Operating Budget
19 - 28
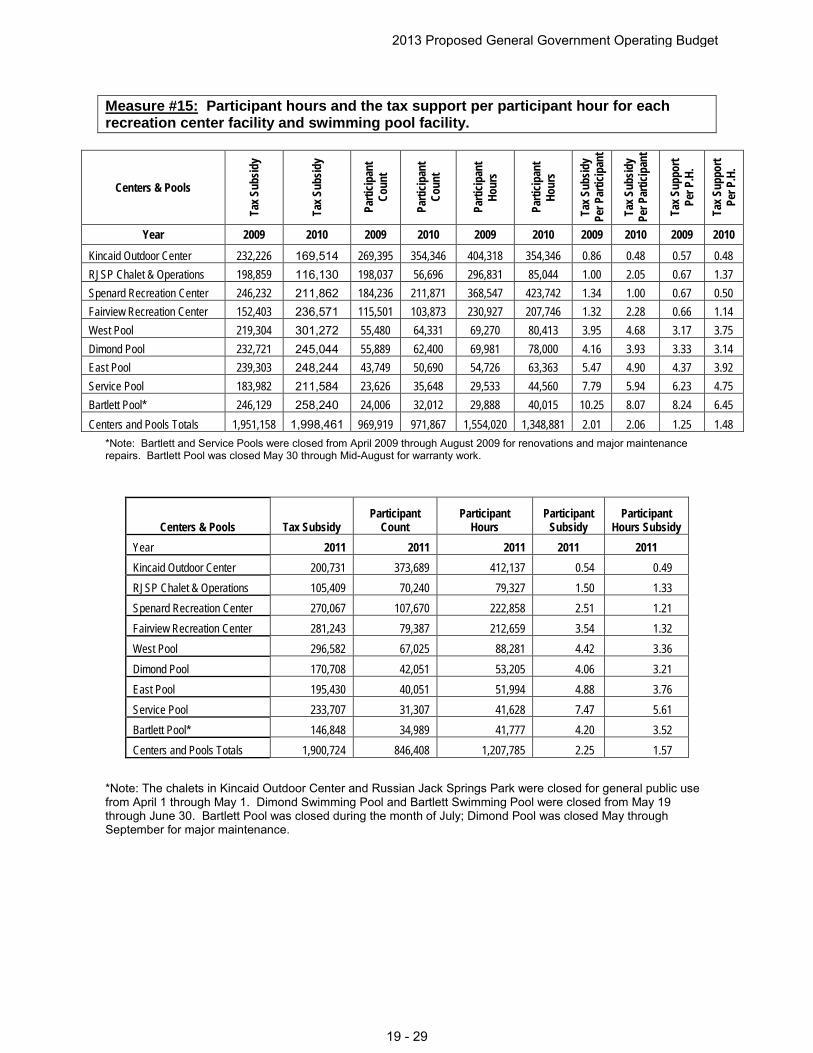
Measure #15:
Participant hours and the tax support per participant hour for each recreation center facility and swimming pool facility.
Centers & Pools
Tax S
ubsid
y
Tax S
ubsid
y
Parti
cipan
t Co
unt
Parti
cipan
t Co
unt
Parti
cipan
t Ho
urs
Parti
cipan
t Ho
urs
Tax S
ubsid
y Pe
r Par
ticip
ant
Tax S
ubsid
y Pe
r Par
ticip
ant
Tax S
uppo
rt Pe
r P.H
.
Tax S
uppo
rt Pe
r P.H
.
Year 2009 2010 2009 2010 2009 2010 2009 2010 2009 2010
Kincaid Outdoor Center 232,226 169,514 269,395 354,346 404,318 354,346 0.86 0.48 0.57 0.48 RJSP Chalet & Operations 198,859 116,130 198,037 56,696 296,831 85,044 1.00 2.05 0.67 1.37 Spenard Recreation Center 246,232 211,862 184,236 211,871 368,547 423,742 1.34 1.00 0.67 0.50 Fairview Recreation Center 152,403 236,571 115,501 103,873 230,927 207,746 1.32 2.28 0.66 1.14 West Pool 219,304 301,272 55,480 64,331 69,270 80,413 3.95 4.68 3.17 3.75 Dimond Pool 232,721 245,044 55,889 62,400 69,981 78,000 4.16 3.93 3.33 3.14 East Pool 239,303 248,244 43,749 50,690 54,726 63,363 5.47 4.90 4.37 3.92 Service Pool 183,982 211,584 23,626 35,648 29,533 44,560 7.79 5.94 6.23 4.75 Bartlett Pool* 246,129 258,240 24,006 32,012 29,888 40,015 10.25 8.07 8.24 6.45 Centers and Pools Totals 1,951,158 1,998,461 969,919 971,867 1,554,020 1,348,881 2.01 2.06 1.25 1.48
*Note: Bartlett and Service Pools were closed from April 2009 through August 2009 for renovations and major maintenance repairs. Bartlett Pool was closed May 30 through Mid-August for warranty work.
Centers & Pools Tax Subsidy Participant
Count Participant
Hours Participant
Subsidy Participant
Hours Subsidy Year 2011 2011 2011 2011 2011 Kincaid Outdoor Center 200,731 373,689 412,137 0.54 0.49 RJSP Chalet & Operations 105,409 70,240 79,327 1.50 1.33 Spenard Recreation Center 270,067 107,670 222,858 2.51 1.21 Fairview Recreation Center 281,243 79,387 212,659 3.54 1.32 West Pool 296,582 67,025 88,281 4.42 3.36 Dimond Pool 170,708 42,051 53,205 4.06 3.21 East Pool 195,430 40,051 51,994 4.88 3.76 Service Pool 233,707 31,307 41,628 7.47 5.61 Bartlett Pool* 146,848 34,989 41,777 4.20 3.52 Centers and Pools Totals 1,900,724 846,408 1,207,785 2.25 1.57
*Note: The chalets in Kincaid Outdoor Center and Russian Jack Springs Park were closed for general public use from April 1 through May 1. Dimond Swimming Pool and Bartlett Swimming Pool were closed from May 19 through June 30. Bartlett Pool was closed during the month of July; Dimond Pool was closed May through September for major maintenance.
2013 Proposed General Government Operating Budget
19 - 29
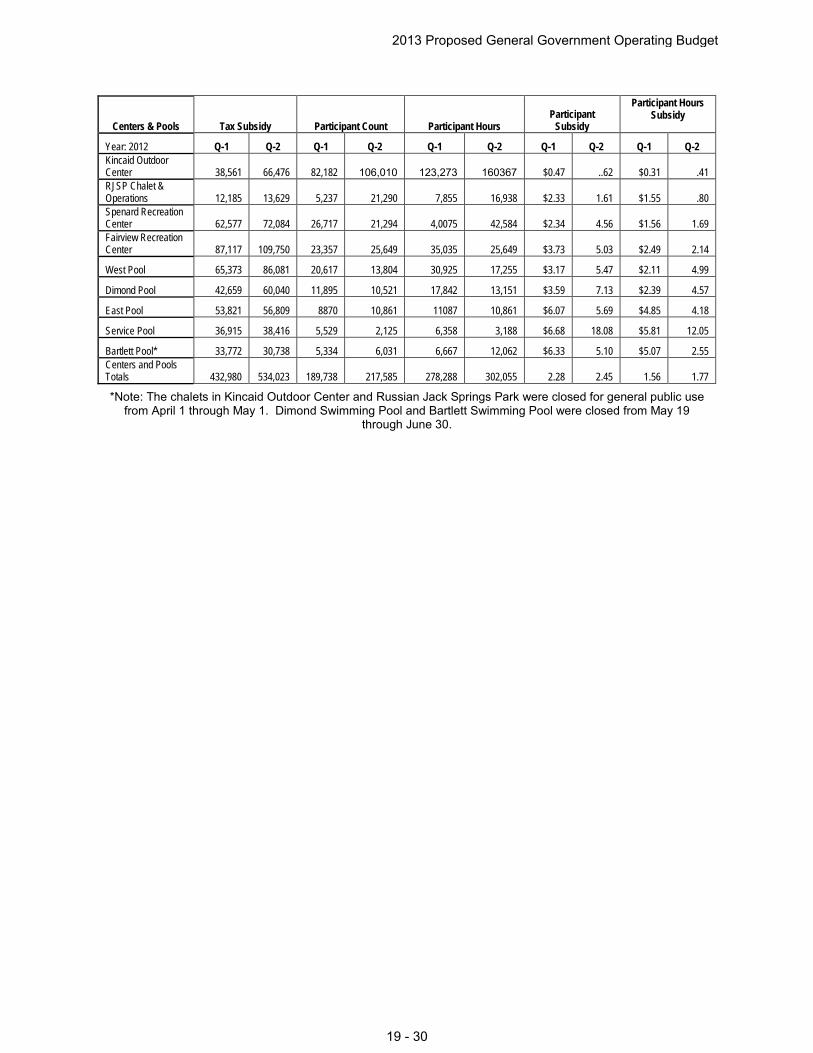
Centers & Pools Tax Subsidy Participant Count Participant Hours Participant
Subsidy
Participant Hours Subsidy
Year: 2012 Q-1 Q-2 Q-1 Q-2 Q-1 Q-2 Q-1 Q-2 Q-1 Q-2 Kincaid Outdoor Center 38,561 66,476 82,182 106,010 123,273 160367 $0.47 ..62 $0.31 .41 RJSP Chalet & Operations 12,185 13,629 5,237 21,290 7,855 16,938 $2.33 1.61 $1.55 .80 Spenard Recreation Center 62,577 72,084 26,717 21,294 4,0075 42,584 $2.34 4.56 $1.56 1.69 Fairview Recreation Center 87,117 109,750 23,357 25,649 35,035 25,649 $3.73 5.03 $2.49 2.14
West Pool 65,373 86,081 20,617 13,804 30,925 17,255 $3.17 5.47 $2.11 4.99
Dimond Pool 42,659 60,040 11,895 10,521 17,842 13,151 $3.59 7.13 $2.39 4.57
East Pool 53,821 56,809 8870 10,861 11087 10,861 $6.07 5.69 $4.85 4.18
Service Pool 36,915 38,416 5,529 2,125 6,358 3,188 $6.68 18.08 $5.81 12.05
Bartlett Pool* 33,772 30,738 5,334 6,031 6,667 12,062 $6.33 5.10 $5.07 2.55 Centers and Pools Totals
432,980
534,023
189,738
217,585
278,288
302,055
2.28
2.45
1.56
1.77
*Note: The chalets in Kincaid Outdoor Center and Russian Jack Springs Park were closed for general public use from April 1 through May 1. Dimond Swimming Pool and Bartlett Swimming Pool were closed from May 19
through June 30.
2013 Proposed General Government Operating Budget
19 - 30
Eagle River/Chugiak Parks & Recreation Division Parks & Recreation Department Anchorage: Performance. Value. Results.
Purpose
The Eagle River/Chugiak Parks and Recreation's mission is to enhance the quality of life for our growing community of approximately 35,000 residents by developing and maintaining our parks, trails, and facilities.
Direct Services
• Operations support and maintain a park inventory of over 2,500 acres with 16 developed and 13 undeveloped park properties. Properties include 32 km of groomed ski trails, 10 playground areas, 11 picnic shelters, 14 athletic fields/courts, 3 major facilities (Beach Lake Chalet, Chugiak Pool, and Harry J. McDonald Memorial Center) and 2 million sq. ft. of turf.
• Our summer day camp program services 800 children every summer for 10 weeks.
• We plant and maintain over 3,000 flowers and 50 hanging baskets each summer while coordinating approximately 100 community volunteers at 15 flower bed locations.
• We maintain safe pedestrian access to Anchorage School District sites by providing winter maintenance/snow removal along 15 hazardous walking routes totaling over 10.6 miles.
Accomplishment Goals
• Ensure Eagle River/Chugiak parks and trails are clean, safe, and secure through routine maintenance and seasonal programming.
• Aquatic programs will be offered year round for public safety and recreation.
• Beach Lake Chalet and trails provide year round permitted recreational opportunities for the community.
Performance Measures
Progress in achieving goals shall be measured by:
2013 Proposed General Government Operating Budget
19 - 31
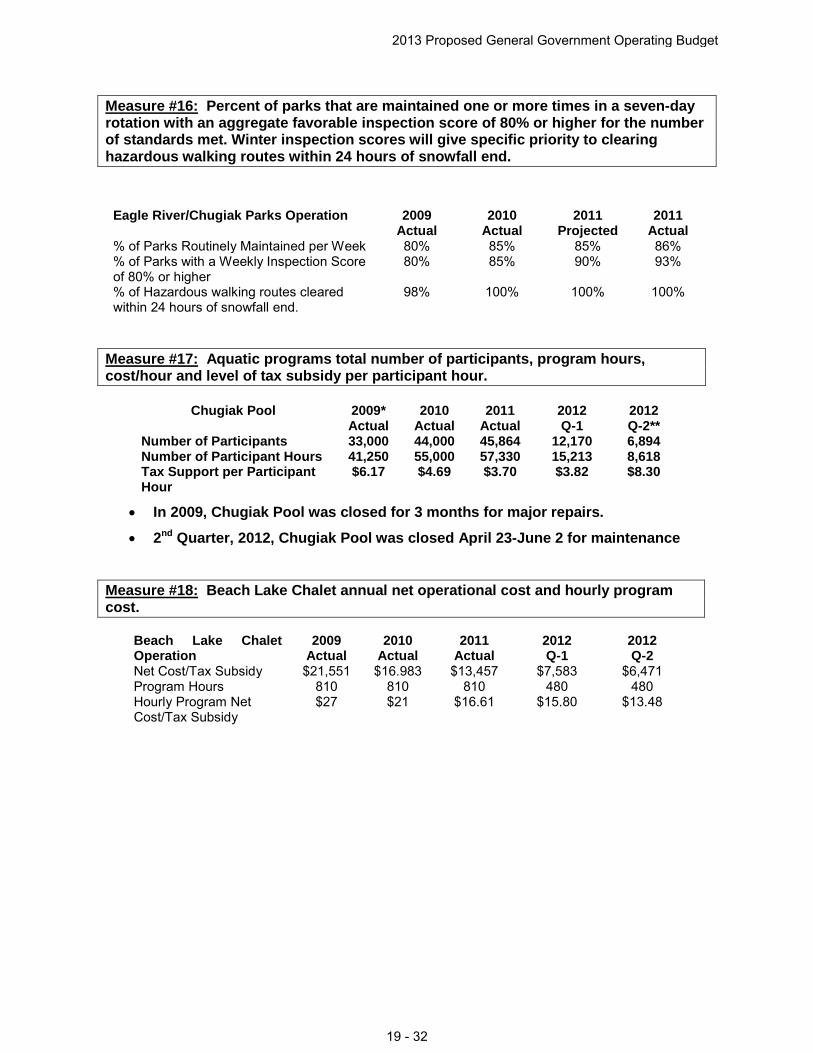
Measure #16:
Percent of parks that are maintained one or more times in a seven-day rotation with an aggregate favorable inspection score of 80% or higher for the number of standards met. Winter inspection scores will give specific priority to clearing hazardous walking routes within 24 hours of snowfall end.
Measure #17:
Aquatic programs total number of participants, program hours, cost/hour and level of tax subsidy per participant hour.
Chugiak Pool 2009* Actual
2010 Actual
2011 Actual
2012 Q-1
2012 Q-2**
Number of Participants 33,000 44,000 45,864 12,170 6,894 Number of Participant Hours 41,250 55,000 57,330 15,213 8,618 Tax Support per Participant Hour
$6.17 $4.69 $3.70 $3.82 $8.30
• In 2009, Chugiak Pool was closed for 3 months for major repairs.
• 2nd
Quarter, 2012, Chugiak Pool was closed April 23-June 2 for maintenance
Measure #18:
Beach Lake Chalet annual net operational cost and hourly program cost.
Beach Lake Chalet Operation
2009 Actual
2010 Actual
2011 Actual
2012 Q-1
2012 Q-2
Net Cost/Tax Subsidy $21,551 $16.983 $13,457 $7,583 $6,471 Program Hours 810 810 810 480 480 Hourly Program Net Cost/Tax Subsidy
$27 $21 $16.61 $15.80 $13.48
Eagle River/Chugiak Parks Operation 2009 Actual
2010 Actual
2011 Projected
2011 Actual
% of Parks Routinely Maintained per Week 80% 85% 85% 86% % of Parks with a Weekly Inspection Score of 80% or higher
80% 85% 90% 93%
% of Hazardous walking routes cleared within 24 hours of snowfall end.
98% 100% 100% 100%
2013 Proposed General Government Operating Budget
19 - 32
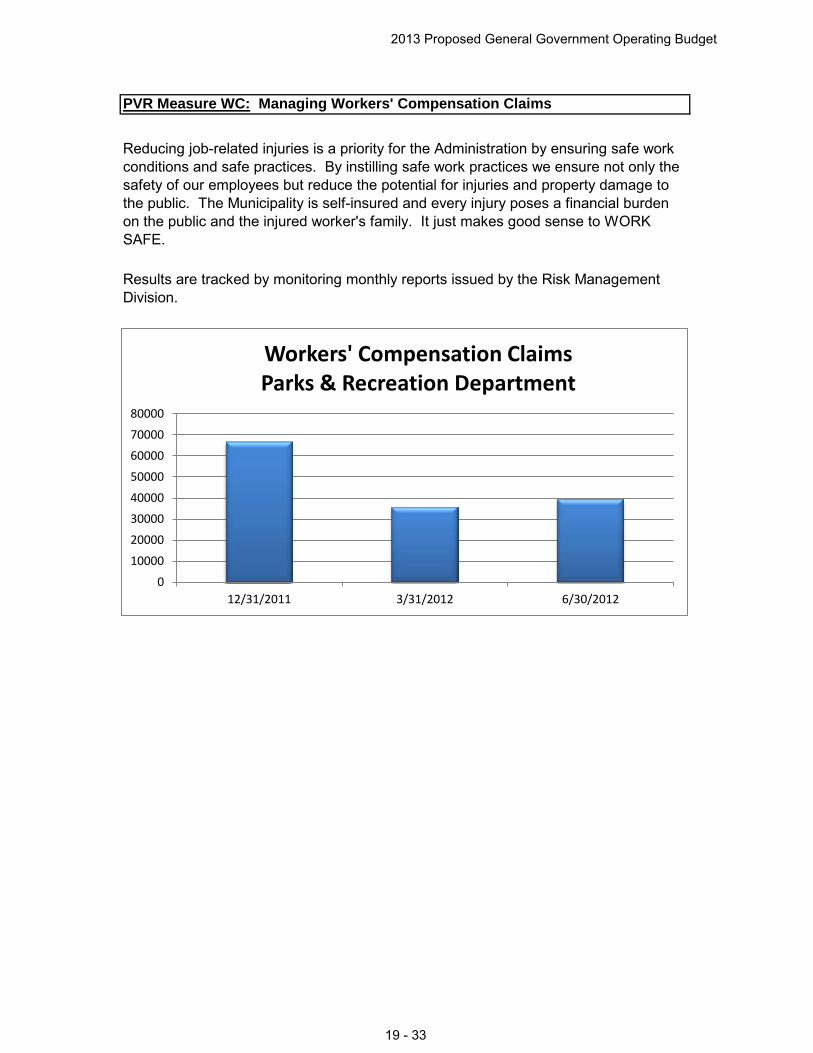
PVR Measure WC: Managing Workers' Compensation Claims
Reducing job-related injuries is a priority for the Administration by ensuring safe work conditions and safe practices. By instilling safe work practices we ensure not only the safety of our employees but reduce the potential for injuries and property damage to the public. The Municipality is self-insured and every injury poses a financial burden on the public and the injured worker's family. It just makes good sense to WORK SAFE.
Results are tracked by monitoring monthly reports issued by the Risk Management Division.
0
10000
20000
30000
40000
50000
60000
70000
80000
12/31/2011 3/31/2012 6/30/2012
Workers' Compensation Claims Parks & Recreation Department
2013 Proposed General Government Operating Budget
19 - 33
This page intentionally left blank.
2013 Proposed General Government Operating Budget
19 - 34


