
March 2018
Pay and Benefits Information
Pack
Louise Lindsay
Director of Human Resources and Organisational Change
Dear staff colleagues,
In their message to all staff last week, the President and Provost announced a wider consultation across all staff to look carefully at the
balance between investments in people and in facilities as we plan total pay and benefits packages for the coming years. As part of this
consultation process, we promised to share a detailed information pack with all staff.
This is the contextual information that will inform the Provost’s Board deliberations on the pay parameters for the local pay negotiations
that begin in May. Our Trades Unions (UNITE, UNISON and UCU) represent all staff during these negotiations, not just union members.
In the negotiations with the Trades Unions, we will need to consider the overall size of uplift to be allocated to staff pay increases and
other staff benefits, balanced against other demands on resource. There will also be discussion on any priority areas for targeted pay
investment. In previous years, for example, this has resulted in tapered awards to provide greater percentage increases to the lower
grades and minimum contract worker rates.
This first information pack focuses on staff demographic and pay data. It will be followed by a supplementary pack of information about
our investment in our teaching and research infrastructure such as estates and facilities. The pack contains information on:
• our staff profile and demographics
• our principles of pay and recognition
• the cost and distribution of our previous pay awards
• benchmark and inflation data and
• staff survey feedback on pay and benefits
Please review the data and contribute your views, either collectively through your Head of Department or individually, by responding to
the questions at the end of the pack. Please send responses to me at [email protected] by Friday 13th April.
Louise Lindsay
Director of Human Resources and Organisational Change
Pay and Benefits Information
Pack
March 2018
1

Staff Profile and
Demographics
Pay and Benefits Information
Pack
March 2018
2

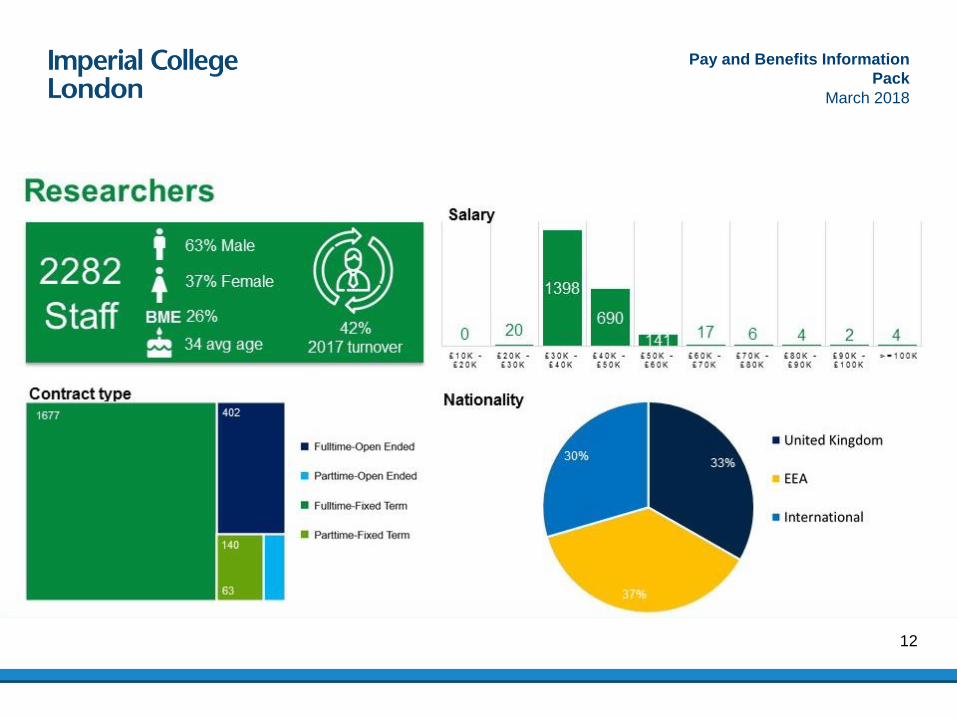
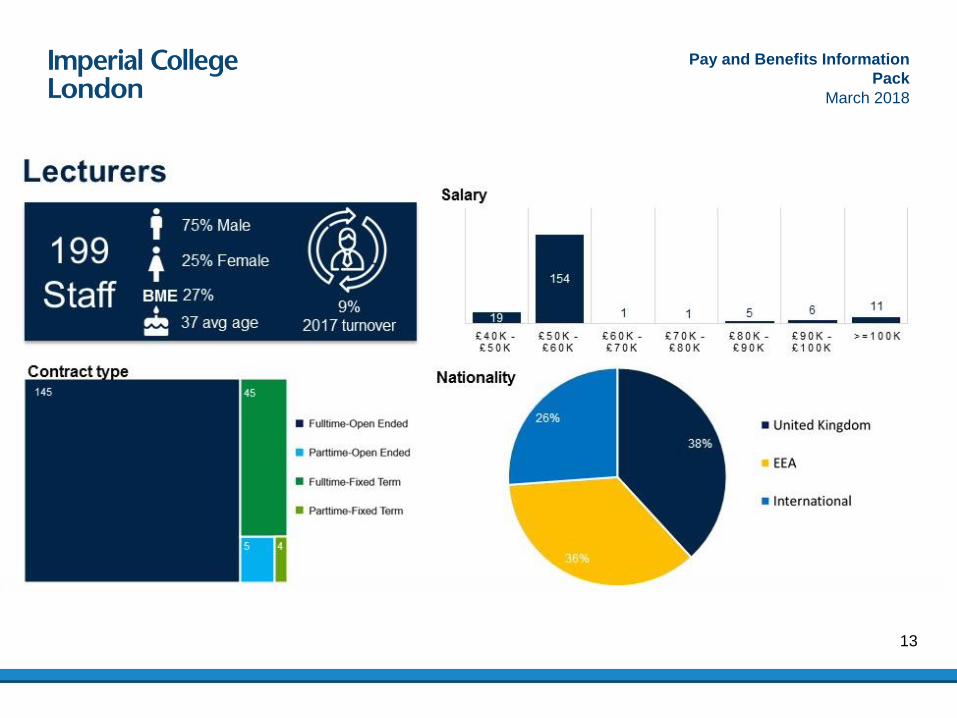
Staff Profile
Pay and Benefits Information
Pack
March 2018
3

Staff Profile continued…
79436
249
358
23
852
821
617
37
11
26
255
241
76
24
54
63
25
40
462
174
323
816
249
1473
107 187 11792
0%
10%
20%
30%
40%
50%
60%
70%
80%
90%
100%
BusinessSchool Engineering Medicine NaturalSciences SupportServices
TechnicalServices
ProfessionalServices
OperationalServices
Learning&Teaching
NHSNurses
ClinicalResearch
ClinicalAcademic
SeniorResearchInvestigator
Research
Academic
66 132
402
539
730
1030
443
111
40
25
21
5274
109
70
143
28
33
58
71
44
58
132
150
129
501998
807
729
83 132 128160
0%
10%
20%
30%
40%
50%
60%
70%
80%
90%
100%
<1year 1-3years 4-10years >10years
TechnicalServices
ProfessionalServices
OperationalServices
Learning&Teaching
NHSNurses
ClinicalResearch
ClinicalAcademic
SeniorResearchInvestigator
Research
Academic
Academic &
Research47.76% of staff
79436
249
358
23
852
821
617
37
11
26
255
241
76
24
54
63
25
40
462
174
323
816
249
1473
107 187 11792
0%
10%
20%
30%
40%
50%
60%
70%
80%
90%
100%
BusinessSchool Engineering Medicine NaturalSciences SupportServices
TechnicalServices
ProfessionalServices
OperationalServices
Learning&Teaching
NHSNurses
ClinicalResearch
ClinicalAcademic
SeniorResearchInvestigator
Research
Academic
Support services52.24% of staff
Staff group numbers by faculties Staff group numbers by length of service
Pay and Benefits Information
Pack
March 2018
4
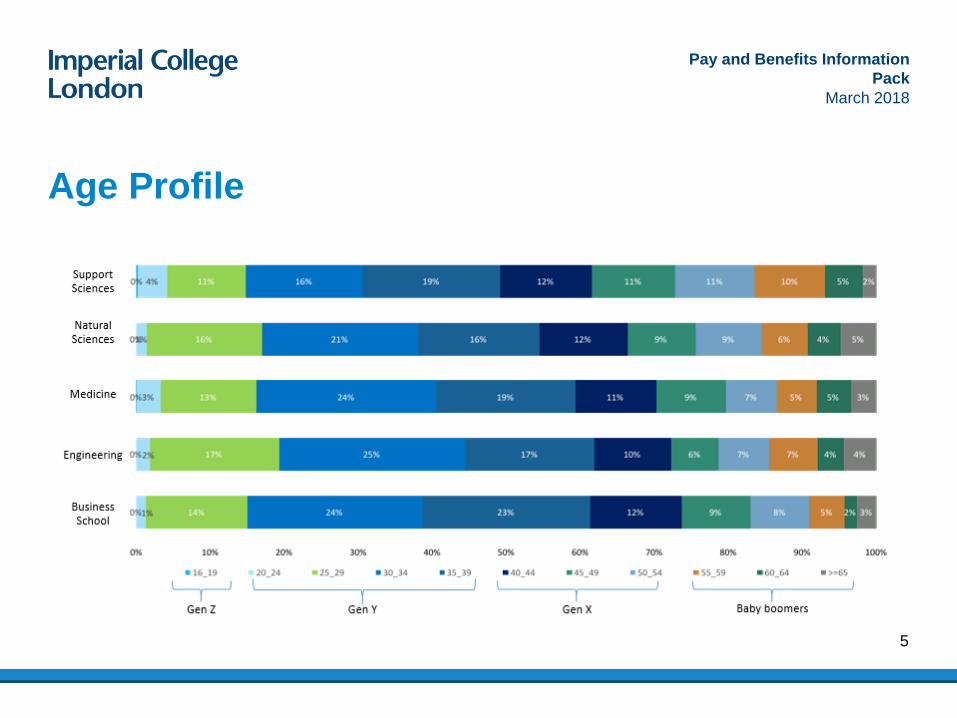
Age Profile
Pay and Benefits Information
Pack
March 2018
5

Pay and Benefits Information
Pack
March 2018
6
Pay and Benefits Information
Pack
March 2018
7

Pay and Benefits Information
Pack
March 2018
8

Pay and Benefits Information
Pack
March 2018
9
Pay and Benefits Information
Pack
March 2018
10

Pay and Benefits Information
Pack
March 2018
11
Pay and Benefits Information
Pack
March 2018
12
Pay and Benefits Information
Pack
March 2018
13

Pay and Benefits Information
Pack
March 2018
14

Pay and Benefits Information
Pack
March 2018
15
Pay and
Benefits
Pay and Benefits Information
Pack
March 2018
16

Principles of Pay and Recognition as applied at Imperial
College London
• We are committed to offering staff a pay and benefits package that is equitable, fair, and appropriately
reflects the College standing as a world leading University.
• We regularly benchmarks rates of pay against internal and appropriate external comparators.
• We aim to pay mid to upper quartile rates of pay for its staff against appropriate external comparators
wherever possible within its financial constraints.
• Our annual pay review for all staff on local pay bargaining terms and conditions is jointly negotiated
through local pay bargaining with the College Trade Unions. The review considers all elements of
reward that impact on staff costs.
• Equal pay audits are conducted annually and remedial steps taken where required.
• Individual pay rates are benchmarked annually and staff are advised when the benchmarking exercise
for their area is to be undertaken.
• Noting that we need to work within the financial constraint of a publicity funded organisation, we strive to
offer a package of benefits, facilities and a working environment that:
- is consistent with our position as a world leading University
- contributes to high levels of employee satisfaction and
- reflects the College as an employer of choice
• We benchmark our provisions against other organisations publicly recognised as good places to work17
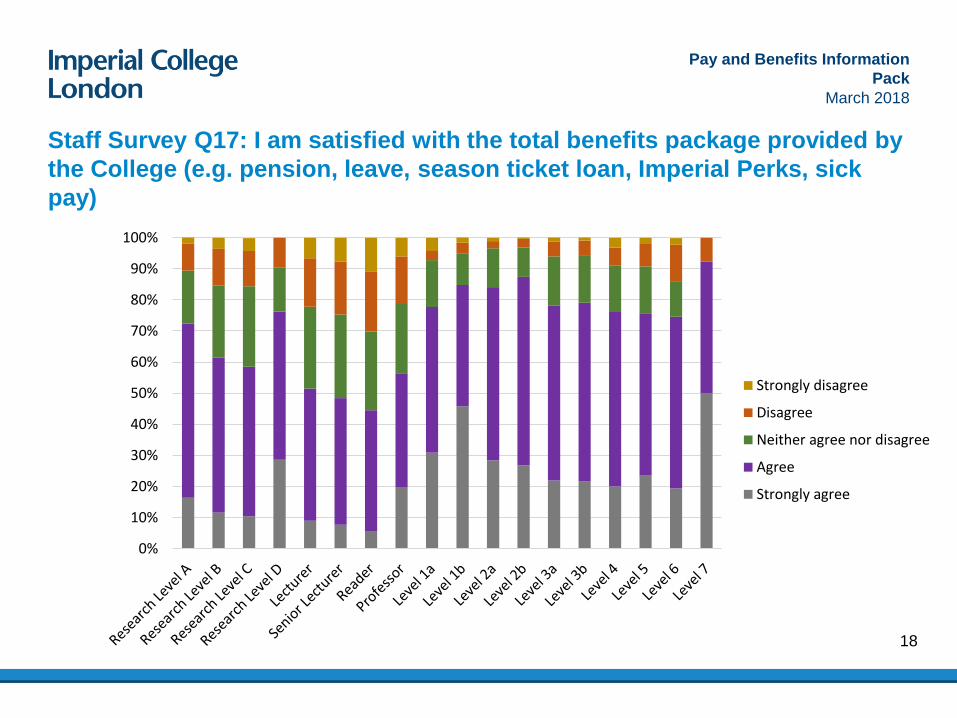
Staff Survey Q17: I am satisfied with the total benefits package provided by
the College (e.g. pension, leave, season ticket loan, Imperial Perks, sick
pay)
0%
10%
20%
30%
40%
50%
60%
70%
80%
90%
100%
Strongly disagree
Disagree
Neither agree nor disagree
Agree
Strongly agree
Pay and Benefits Information
Pack
March 2018
18
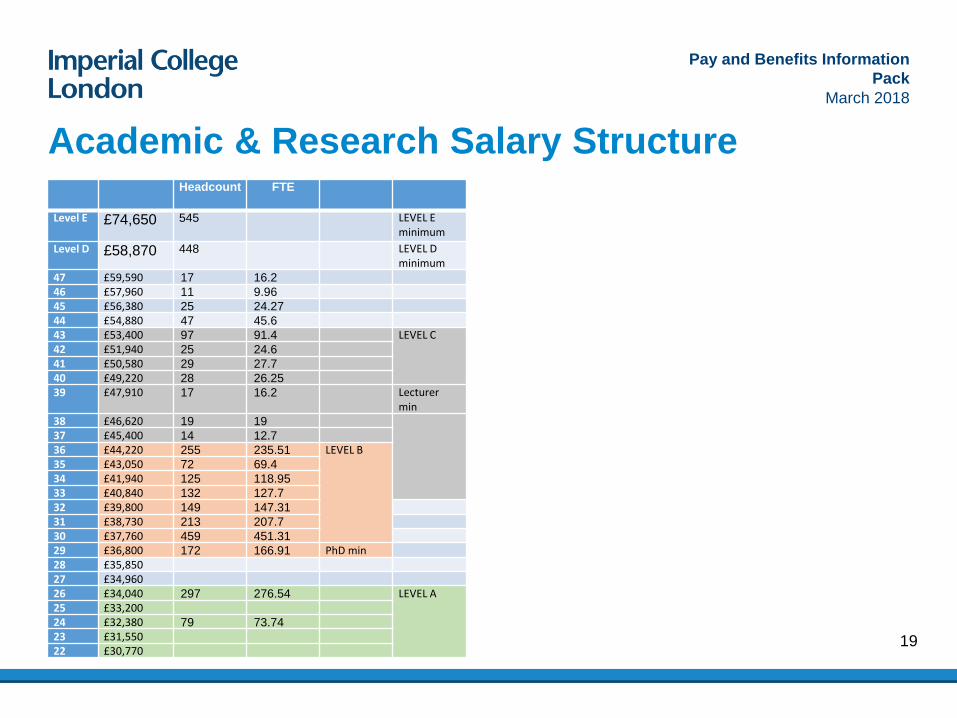
Academic & Research Salary StructureHeadcount FTE
Level E £74,650 545 LEVEL E minimum
Level D £58,870 448 LEVEL D minimum
47 £59,590 17 16.2
46 £57,960 11 9.96
45 £56,380 25 24.27
44 £54,880 47 45.6
43 £53,400 97 91.4 LEVEL C42 £51,940 25 24.6
41 £50,580 29 27.7
40 £49,220 28 26.25
39 £47,910 17 16.2 Lecturer min
38 £46,620 19 19
37 £45,400 14 12.7
36 £44,220 255 235.51 LEVEL B35 £43,050 72 69.4
34 £41,940 125 118.95
33 £40,840 132 127.732 £39,800 149 147.31
31 £38,730 213 207.7
30 £37,760 459 451.31
29 £36,800 172 166.91 PhD min28 £35,85027 £34,96026 £34,040 297 276.54 LEVEL A25 £33,20024 £32,380 79 73.74
23 £31,55022 £30,770
Pay and Benefits Information
Pack
March 2018
19

Professional,
Technical,
Operational &
Learning &
Teaching
Headcount FTE
Spine Point 01-Aug-17
27 26.29 Level 7
52 £68,460 17 15.6
51 £66,510 25 24.4
50 £64,690 42 38.93 Level 6 minimum3
49 £62,980 100 98.17 Level 5
48 £61,250 31 30.8
47 £59,590 70 66.08
46 £57,960 65 63.81
45 £56,380 73 70.59
44 £54,880 216 204.73 Level 4
43 £53,400 48 46.2
42 £51,940 58 54.45
41 £50,580 72 68.69
40 £49,220 73 70.89
39 £47,910 110 106.65
38 £46,620 102 99.23
37 £45,400 128 122.21
36 £44,220 277 256.08 Level 3b
35 £43,050 59 55.17
34 £41,940 61 59.7
33 £40,840 71 66.26
32 £39,800 68 65.9
31 £38,730 100 97.24
30 £37,760 125 118.74
29 £36,800 137 129.18
28 £35,850 149 139.3
27 £34,960 285 267.89 Level 3a
26 £34,040 75 72.07
25 £33,200 80 76.59
24 £32,380 110 106.01
23 £31,550 120 116.58
22 £30,770 116 111.13
21 £30,000 123 108.47 Level 2b
20 £29,250 30 28.57
19 £28,570 39 34.96
18 £27,850 47 43.93
17 £27,190 82 76.74
16 £26,570 69 67.24 Level 2a
15 £25,950 21 20.5
14 £25,330 26 25.14
13 £24,780 30 29.2
12 £24,230 3 3
11 £23,700 25 24.12 Level 1b10 £23,150 7 6.25
9 £22,660 3 2.01
8 £22,150 7 6.67
7 £21,680 13 13
6 £21,220 10 9.7
5 £20,820 16 15.23
4 £20,410
3 £20,070 137 132.18 Level 1a2
2 £19,780 121 87.78
1 £19,490 29 24.52
20

Cost and distribution of pay
The pay award figure represents the cost to the College, including where research funders do not meet
the additional costs arising from pay awards. In such cases, the College has to cover the increased
salary costs.
Pay and Benefits Information
Pack
March 2018
21

Pay Award
2015 Pay Award
• A rise across the board of either 0.8% or £450. The impact of this change meant 5,074 received an increase
greater than 1% (up to 2.5% at the lowest spine point). 2,402 staff earning more than £45,000 received less than
1% but not less than £450 and rising to an £800 increase for a salary of £100K and a £1,200 increase for a salary
of £150K
• The College regular contractor hourly rate increased to £9.23 per hour
2016 Pay Award
• A rise in the minimum salary for Research Assistants from point 22 to point 24.
• A rise in the minimum salary for Research Associates with a PhD from points 27/28 to point 29.
• A *tapered rise of 1.2% for all pay up to £61,000 and 0.5% on the balance of earnings above this figure.
• The College regular contractor hourly rate increased in line with the percentage uplift to spine point one (1.2%).
2017 Pay Award
• A *tapered rise of 2% for all pay up to £67,110 and 0.5% on the balance of earnings above this figure
• A 3% rise for spine 1 and 2.5% for spine 2
• The College regular contractor hourly rate increased to £10.00 per hour
*The College has configured the last two pay awards as tapered because the tapered approach greatly benefits the
lower and middle grades.
Pay and Benefits Information
Pack
March 2018
22

2016 Pay Relativity: Number of payments
Pay and Benefits Information
Pack
March 2018
302
94240
241
Academic & Research SalaryIncreases
Academic & Research One- OffPayments
Professional, Operational andTechnical Services and Learning& Teaching Salary Increases
Professional, Operational andTechnical Services and Learning& Teaching One-Off Payments
23

£0
£10,000,000
£20,000,000
£30,000,000
£40,000,000
£50,000,000
£60,000,000
£70,000,000
Leve
l 1a
Leve
l 1b
Leve
l 2a
Leve
l 2b
Leve
l 3a
Leve
l 3b
Leve
l 4
Leve
l 5
Leve
l 6
Leve
l 7
Re
sear
ch -
Lev
el A
Re
sear
ch -
Lev
el B
Re
sear
ch -
Lev
el C
Lect
ure
r -
Leve
l C
Re
sear
ch -
Lev
el D
Sen
ior
Lect
ure
r -
Leve
l D
Re
ade
r -
Leve
l D
Re
sear
ch -
Lev
el E
Pro
fess
or
- Le
vel E
Clin
ical
Lec
ture
r -
New
Clin
ical
Pro
fess
or
- N
ew
Clin
ical
Rea
de
r -
New
Clin
ical
Sen
ior
Lect
ure
r -
Ne
w
Re
sear
ch C
linic
al -
Ne
w
Pro
fess
or
- C
linic
al
Nu
rsin
g B
and
5
Nu
rsin
g B
and
6
Nu
rsin
g B
and
7
Salary Spend by Grade
Overall SalarySpend (exl oncosts)
Pay and Benefits Information
Pack
March 2018
24

Staff Benefit usage/ take-up
5980
543
15001111
67 49 249566
66843
120
948
133 19399
7799
0
1000
2000
3000
4000
5000
6000
7000
8000
9000
Pay and Benefits Information
Pack
March 2018
25

Staff benefit spend
£12,000 £15,000 £32,000
£118,000
£43,000 £59,000 £72,000
£250,000
£429,000
£0£50,000
£100,000£150,000£200,000£250,000£300,000£350,000£400,000£450,000£500,000
Pay and Benefits Information
Pack
March 201855.6
1.9 2.60
204060
PensionScheme
Memberships
Childcarevouchers
FamilyFriendlyLeave
£M
26

Pay and Benefits Information
Pack
March 2018
USS
Academic and Research
staff: 2,910
Professional staff: 1,19727

Pension Scheme Members: November 2017
Age Band NHS SAUL USS Grand Total
16_19 6 6
20_24 1 169 48 218
25_29 21 463 475 959
30_34 122 538 881 1541
35_39 115 489 767 1371
40_44 61 313 524 898
45_49 57 244 436 737
50_54 35 241 390 666
55_59 29 214 302 545
60_64 17 107 193 317
>=65 5 29 91 125
Grand Total 463 2813 4107 7383
Pay and Benefits Information
Pack
March 2018
28

Benchmark
information
Pay and Benefits Information
Pack
March 2018
29
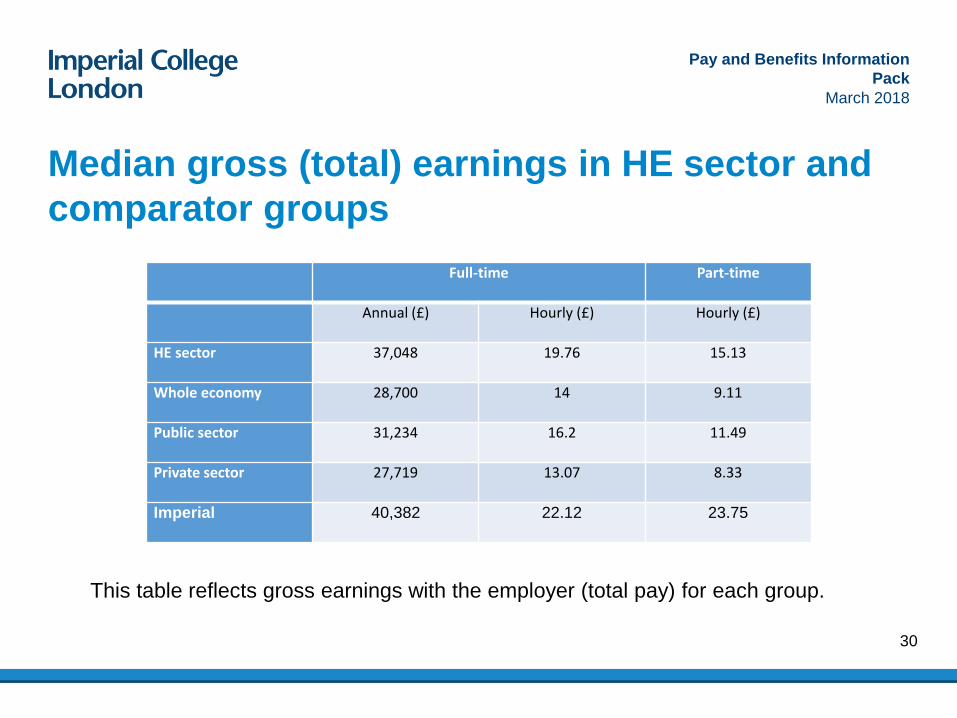
Median gross (total) earnings in HE sector and
comparator groups
This table reflects gross earnings with the employer (total pay) for each group.
Full-time Part-time
Annual (£) Hourly (£) Hourly (£)
HE sector 37,048 19.76 15.13
Whole economy 28,700 14 9.11
Public sector 31,234 16.2 11.49
Private sector 27,719 13.07 8.33
Imperial 40,382 22.12 23.75
Pay and Benefits Information
Pack
March 2018
30
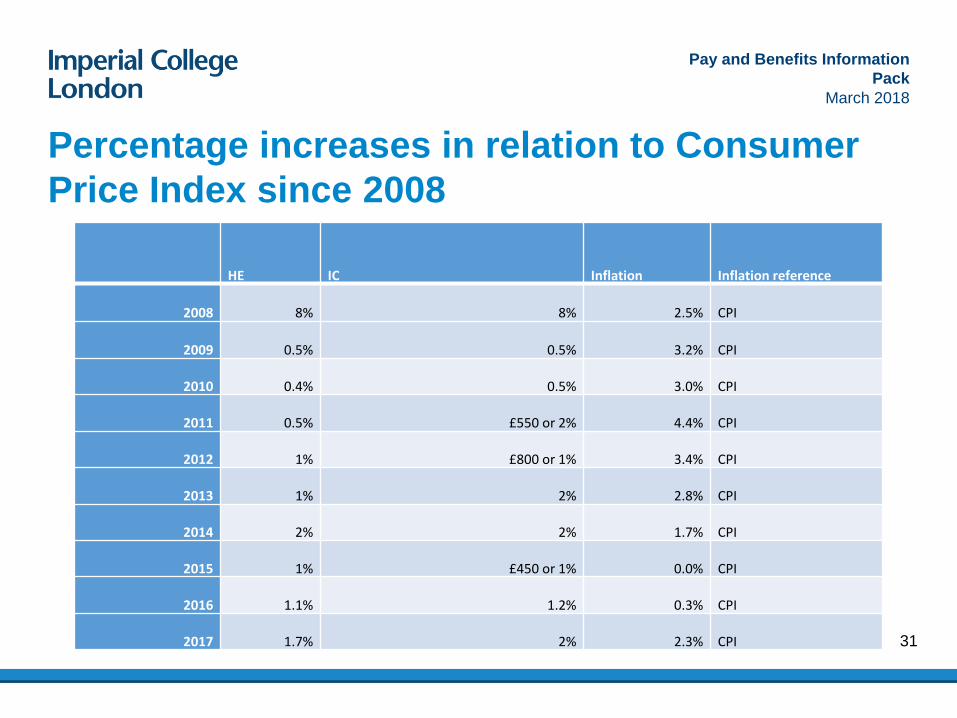
Percentage increases in relation to Consumer
Price Index since 2008
HE IC Inflation Inflation reference
2008 8% 8% 2.5% CPI
2009 0.5% 0.5% 3.2% CPI
2010 0.4% 0.5% 3.0% CPI
2011 0.5% £550 or 2% 4.4% CPI
2012 1% £800 or 1% 3.4% CPI
2013 1% 2% 2.8% CPI
2014 2% 2% 1.7% CPI
2015 1% £450 or 1% 0.0% CPI
2016 1.1% 1.2% 0.3% CPI
2017 1.7% 2% 2.3% CPI
Pay and Benefits Information
Pack
March 2018
31

London Living Wage
The College Worker and Regular Contractor (includes cleaners) rates are updated on 1
August each year. The London Living Wage rate from 2015 is updated on 1 October each
year.
London Living Wage
National Minimum Wage National Living Wage
College Regular Contractor Rate (includes cleaners)
College Worker Rate (casual staff)
2005 £6.70 £5.05 £5.052006 £7.05 £5.35 £5.352007 £7.20 £5.52 £5.522008 £7.45 £5.73 £5.732009 £7.60 £5.80 £5.802010 £7.85 £5.93 £5.932011 £8.30 £6.08 £6.082012 £8.55 £6.19 £6.192013 £8.80 £6.31 £7.57 £7.252014 £9.15 £6.50 £7.80 £7.252015 £9.40 (October) £6.70 £8.04 / £9.23 (Aug) £7.402016 £9.75 £6.95 £7.20 £9.47 £9.472017 £10.20 £7.05 £7.50 £10.00 £10.00
Pay and Benefits Information
Pack
March 2018
32
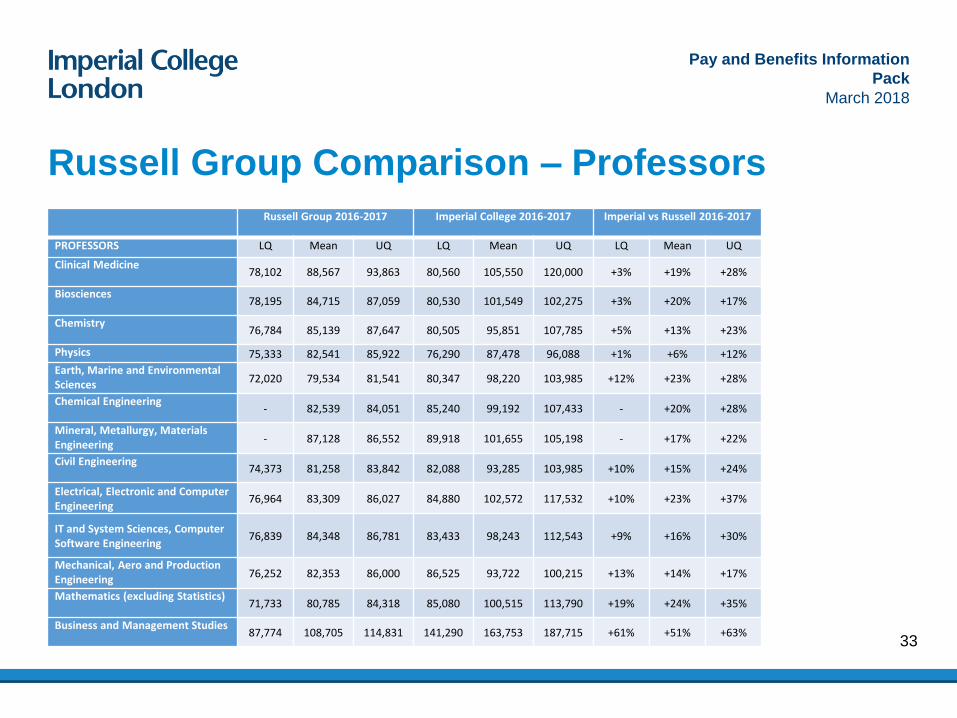
Russell Group Comparison – Professors
Russell Group 2016-2017 Imperial College 2016-2017 Imperial vs Russell 2016-2017
PROFESSORS LQ Mean UQ LQ Mean UQ LQ Mean UQ
Clinical Medicine78,102 88,567 93,863 80,560 105,550 120,000 +3% +19% +28%
Biosciences78,195 84,715 87,059 80,530 101,549 102,275 +3% +20% +17%
Chemistry76,784 85,139 87,647 80,505 95,851 107,785 +5% +13% +23%
Physics 75,333 82,541 85,922 76,290 87,478 96,088 +1% +6% +12%
Earth, Marine and Environmental Sciences
72,020 79,534 81,541 80,347 98,220 103,985 +12% +23% +28%
Chemical Engineering- 82,539 84,051 85,240 99,192 107,433 - +20% +28%
Mineral, Metallurgy, Materials Engineering
- 87,128 86,552 89,918 101,655 105,198 - +17% +22%
Civil Engineering74,373 81,258 83,842 82,088 93,285 103,985 +10% +15% +24%
Electrical, Electronic and Computer Engineering
76,964 83,309 86,027 84,880 102,572 117,532 +10% +23% +37%
IT and System Sciences, Computer Software Engineering
76,839 84,348 86,781 83,433 98,243 112,543 +9% +16% +30%
Mechanical, Aero and Production Engineering
76,252 82,353 86,000 86,525 93,722 100,215 +13% +14% +17%
Mathematics (excluding Statistics)71,733 80,785 84,318 85,080 100,515 113,790 +19% +24% +35%
Business and Management Studies87,774 108,705 114,831 141,290 163,753 187,715 +61% +51% +63%
Pay and Benefits Information
Pack
March 2018
33

Russell Group Comparison – Readers and
Senior LecturersREADERS AND SENIORLECTURERS
Russell Group 2016-2017 Imperial College 2016-2017 Imperial vs Russell 2016-2017
LQ Mean UQ LQ Mean UQ LQ Mean UQ
Clinical Medicine55,496 57,104 57,964 59,570 64,781 66,660 +7% +13% +15%
Biosciences55,158 56,437 57,651 59,275 63,529 66,388 +7% +13% +15%
Chemistry55,409 56,532 56,679 61,530 64,912 66,960 +11% +15% +18%
Physics54,994 56,501 58,053 57,710 62,084 62,546 +5% +10% +8%
Earth, Marine and Environmental Sciences 54,753 55,776 56,807 63,255 65,452 68,035 +16% +17% +20%
Chemical Engineering - 56,597 - 63,711 66,177 68,698 - +17% -
Mineral, Metallurgy, Materials Engineering - 57,474 - 62,105 64,478 65,916 - +12% -
Civil Engineering54,520 56,416 56,239 59,210 62,446 65,108 +9% +11% +16%
Electrical, Electronic and Computer Engineering
55,655 56,329 56,740 61,820 68,118 71,030 +11% +21% +25%
IT and System Sciences, Computer Software Engineering
54,633 55,599 56,732 63,328 67,953 71,770 +16% +22% +27%
Mechanical, Aero and Production Engineering 55,058 56,726 58,172 60,616 65,446 70,378 +10% +15% +21%
Mathematics(excluding Statistics)
55,521 56,425 57,669 60,593 63,485 64,815 +9% +13% +12%
Business and Management Studies
56,565 60,826 60,388 106,479 112,316 117,570 +88% +85% +95%
Pay and Benefits Information
Pack
March 2018
34

UK salaries lag behind those of academics in other countries, with
the gap being more pronounced at less senior levels
Table 8: Average salaries for academic ranks 2016-17
Country Professor Associate
Professor
Senior
Lecturer
Lecturer
Australia 116,708 97,200 82,740 69,566
South Africa 153,561 124,309 103,457 87,901
Malaysia 113,775 74,025 59,571 49,614
India 93,631 76,388 43,472 38,583
UK 108,413 81,509 69,157 55,891
Imperial 119,768 93,287 77,910 75,693
Table 9: Average salaries for US academic ranks, by institution type, 2015-16
Professor Associate
Professor
Assistant
Professor
Lecturer
4- year public colleges 110,000 82,000 70,000 59,000
4- year private colleges 120,977 81,040 67,146 62,823
Research ‘highest’
(Carnegie classification)
150,000 97,000 84,000 63,000
Source: ACU and UCEA. PPP =
adjusted for purchase power parity.
The ACU survey uses purchasing
power parity (PPP) and converts
all salary ranges to US dollars in
order to enhance comparability.
Source: Chronicle. All figures in
USD
Pay and Benefits Information
Pack
March 2018
35

Research Assistants and Associates, Professional,
Technical & Operational Benchmark from XpertHR
Role GradeHeadc
ounts
Imperial Average
2016
Imperial 2017
London Average
2016
London 2017
ICL to London
Ave 2016
ICL to London
Ave 2017
ICL to London
Ave 2016
ICL to London
Ave 2017
Research Assistants
A 459 £33,134 £33,277 £35,619 £35,100 -£2,485 -£1,823 93.02% 94.81%
Research Associates
B 1,601 £38,297 £38,835 £37,150 £37,158 £1,147 £1,677 103.09% 104.51%
Catering Assistants
1A 109 £18,943 £19,250 £16,818 £16,973 £2,125 £2,277 112.64% 113.42%
Administrators 2B 46 £27,952 £28,438 £23,944 £23,561 £4,008 £4,876 116.74% 120.70%
Administrators 3A 130 £32,523 £33,339 £27,319 £27,151 £5,204 £6,187 119.05% 122.79%
Adviser / Co-ordinator
3B 866 £39,821 £40,464 £35,466 £33,801 £4,355 £6,664 112.28% 119.71%
Technician 3A 48 £32,361 £34,037 £28,339 £27,037 £4,022 £7,000 114.19% 125.89%
Technician 3B 115 £41,347 £42,219 £37,709 £36,308 £3,638 £5,911 109.65% 116.28%
Manager 4 764 £51,217 £51,386 £47,670 £48,130 £3,547 £3,255 107.44% 106.76%
Manager 5 297 £60,494 £62,418 £57,685 £58,197 £2,809 £4,222 104.87% 107.25%
Pay and Benefits Information
Pack
March 2018
36

Questions
1. Do you agree with the principles of pay and recognition on page 17 of the pack? Is there anything you
would add or propose to change?
2. After reviewing the information pack and benchmark data, are there any staff groups or particular
benefits that you consider should be prioritised for investment to ensure we can recruit and retain high
quality staff? Please give reasons why
3. Each 1% pay increase currently costs £4.4m pa of which £1.4m is for those on externally funded
contracts (see page 21 for more details). Applying a percentage increase to pay obviously has a
varying benefit in absolute terms - a 1% increase for a member of staff earning £40,000 is £400, for a
member earning £100,000 it is £1,000. This has led Provost’s Board to agree a tapered award in
recent years (see page 22 of the pack). Do you support a fixed percentage approach or a tapered or
capped (in absolute £ terms) approach for the pay award? If the latter, at what salary level do you
consider that taper or cap should begin to apply?
4. Are there any other comments you wish to make?
Please send responses via the consultation form.
Pay and Benefits Information
Pack
March 2018
37


