eJIFCC2017Vol28No1pp006-024Page 6
In this issue: Recent Advances in Pediatric Laboratory Medicine
Pediatric obesity and cardiometabolic disorders: risk factors and biomarkersE. Levy1,2, A.K. Saenger3, M.W. Steffes3, E. Delvin2,4
1 Department of Nutrition, University of Montreal, Montreal, Quebec, Canada2 CHU Sainte-Justine Research Center, Nutrition, Gastroenterology and Hepatology Division, University of Montreal, Montreal, Quebec, Canada3 Department of Laboratory Medicine and Pathology, University of Minnesota Health, Minneapolis, MN, USA4 Department of Biochemistry, University of Montreal, Montreal, Quebec, Canada
A R T I C L E I N F O A B S T R A C T
Obesity remains the most prevailing disorder in childhood males and females worldwide. Its high prevalence markedly predisposes children to insulin resistance, hypertension, hyperlipidemia and liver disorders while enhancing the risk of type 2 diabetes and cardiovascular diseases. In this review, the rela-tionship of obesity with genetic and environmental factors will be described and the underlined causes will briefly be reported. As obesity in children consti-tutes an increasingly health concern, important po-tential biomarkers have been discussed for the diag-nosis, treatment and follow-up of the wide range of overweight-related complications. Awareness about the applicability and limitations of these preven-tive and predictive biomarkers will intensify the re-search and medical efforts for new developments in order to efficiently struggle against childhood obesity.
Corresponding author:Edgard Delvin, Ph.D.CHU Sainte-Justine Research Center3175 Côte Ste-Catherine Montréal, Québec, H3T 1C5CanadaPhone: (514) 345-4931 ext. 6268E-mail: [email protected]
Key words:pediatric obesity, insulin resistance, inflammation, oxidative stress, biomarkers
eJIFCC2017Vol28No1pp006-024Page 7
E. Levy, A.K. Saenger, M.W. Steffes, E. DelvinPediatric obesity and cardiometabolic disorders: risk factors and biomarkers
INTRODUCTION
The prevalence of childhood obesity is rapidly increasing and presents a major public health concern in developed and developing countries (1-4), and assessment of obesity is of utmost im-portance to paediatricians. However, there are varying definitions of obesity in children and ad-olescents, along with ethnic-specific variations in body fat content and distribution, which com-plicate this undertaking (5). Moreover, these di-vergences may explain prevalence dissimilarities associated with cardiometabolic diseases (CMD) (e.g. insulin resistance, hypertension, dyslipid-emia and diabetes) in adulthood (6-11). In the
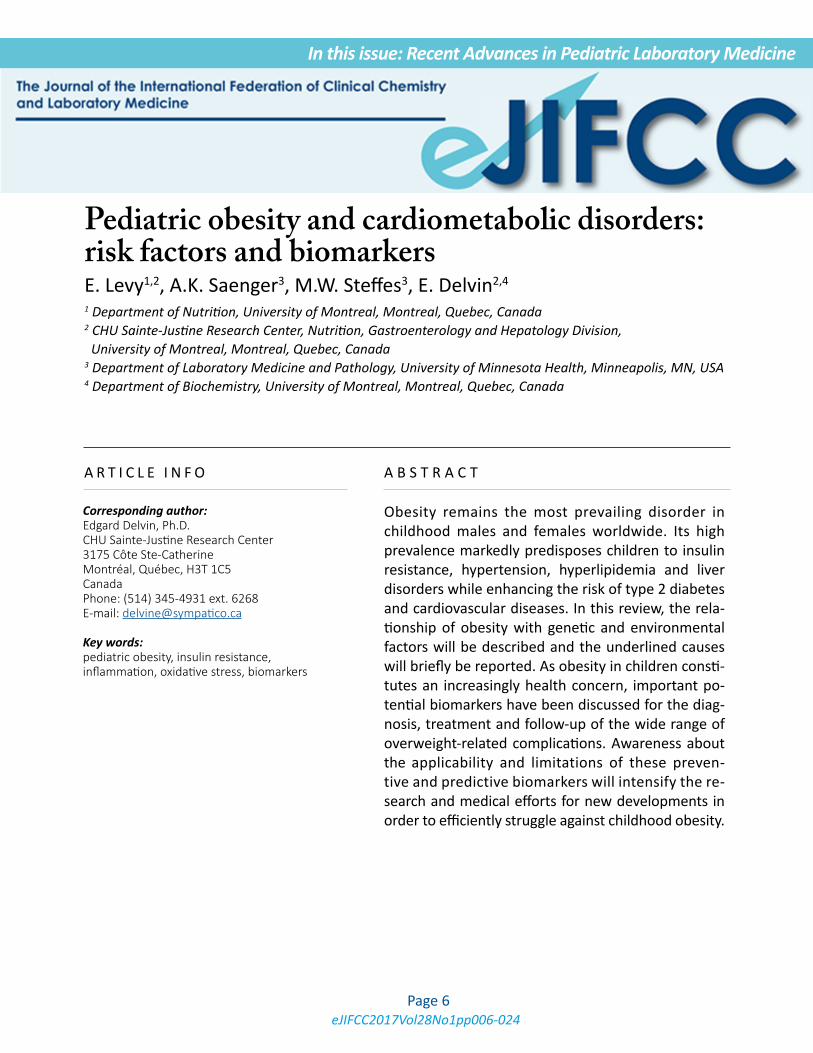
context of epidemiological studies, body mass index (BMI, weight/height2) in adults is currently considered as a diagnostic test (separator variable) which is able to identify overweight (25 kg/m2) and obese (30 kg/m2) individuals and may pre-dispose to increased CMD risk, morbidity and mortality (12, 13). However, no similar definite values can be used in childhood and adolescence because of the substantial changes in BMI, which occur naturally from birth to adulthood (14, 15), and because of the limited data in youth that re-late BMI trajectory to cardiovascular events later in life. Age- and sex-specific BMI cut-offs were developed to define overweight and obese us-ing different nationally representative age- and
*Adapted with permission from data of Table 4 from Cole TJ et al. (16). Data obtained by averaging the national centiles.BMI: Body Mass Index. Filled circles: curve for overweight boys; filled square: curve for obese boys; filled upward triangles: curve for overweight girls; filled downward triangles: curve for obese girls.
0 4 8 12 16 2015
20
25
30
Age (Years)
BMI k
g/m
2
Figure 1 International age- and sex-specific cut-off points for BMI for overweight and obesity
eJIFCC2017Vol28No1pp006-024Page 8
E. Levy, A.K. Saenger, M.W. Steffes, E. DelvinPediatric obesity and cardiometabolic disorders: risk factors and biomarkers
sex-specific data sets, following recommenda-tions from the International Obesity Task Force (16, 17). International age- and sex-specific BMI cut-offs for overweight and obese girls and boys are illustrated in Figure 1. Applying this concept to BMI trajectory, Attard et al. (18) demonstrat-ed that the odds for diabetes were 2.35 higher for those with a BMI of 30 kg/m2 relative to young male adults who had maintained a BMI of 23 kg/m2 over an average of 12 years. These data suggest there is potential for improving the ability to assess the effect of paediatric obe-sity on development of diseases at a later time point. Secular trends demonstrate that the prev-alence has plateaued in some countries (19) or even decreased (20), but has continued to rise in others, independent of how overweight and obesity are defined in childhood (1, 21-23). The
apparent contradiction could partially depend on the span of the retrospective studies and on the years included. Nevertheless, the present high number of young adults with the stigmata of the metabolic syndrome (MetS), and the re-lated non-alcoholic fatty liver disease (NAFLD) justifies that it be considered a major world pub-lic health issue (24). This review briefly describes the various potential causes of obesity in youth and underscores the available biomarkers for as-sociated conditions.
Definite BMI thresholds to identify an increased risk for CMD cannot be used in childhood and ado-lescence. Age- and sex-specific BMI cut-offs to de-fine overweight and obesity and predict trajectory into adulthood should be utilized using different nationally representative age- and sex-specific data.
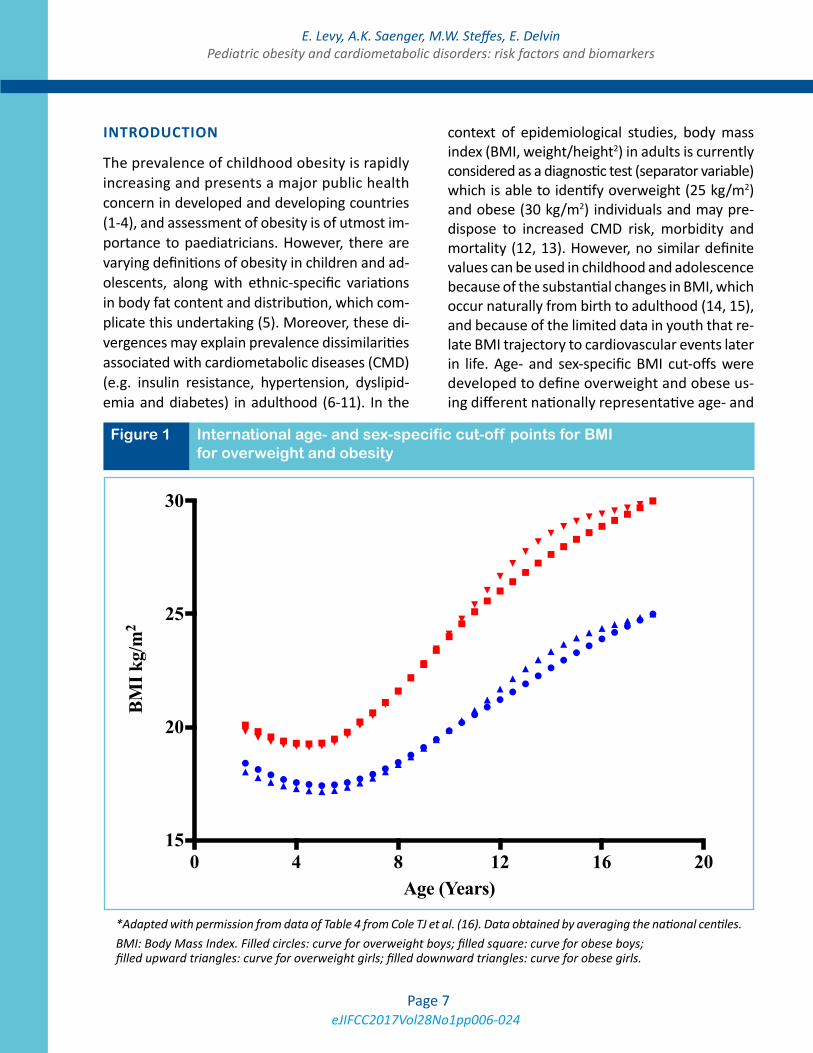
Figure 2 Factors involved in the development of obesity
Obesity Environment Nutrition
eJIFCC2017Vol28No1pp006-024Page 9
E. Levy, A.K. Saenger, M.W. Steffes, E. DelvinPediatric obesity and cardiometabolic disorders: risk factors and biomarkers
OBESITY AND LIFESTYLE
Lifestyle is broadly defined as the way or man-ner by which a person or a group of people lives. However, lifestyle can be influenced by a complex set of factors that are intertwined and can affect the quality of living and health (Figure 2). The socioeconomic position (SEP) stands out among these factors because it has a direct impact on the quality of nutrition and the living environ-ment, including access to adequate physical ac-tivity facilities and education. Consequently, a comprehensive view must be adopted whenev-er addressing this topic but a majority of stud-ies tend to focus in this area in a fragmented manner.
One such study, based on self-reports, demon-strated that poor children in the United States have worse health compared to wealthy chil-dren. This difference in health status diverged further as the children aged; thereby suggest-ing the adult health gradient had its origins in childhood. However, other than family income no other factors were considered which could explain these results (25). SEP may also impact the quality of nutrition. Darmon et al. (26) re-ported that higher-quality diets consisting of whole grains, lean meats, fish, low-fat dairy products, fresh vegetables and fruits were as-sociated with greater affluence, whereas en-ergy-dense and nutrient-poor diets (refined grains, added fats) are preferentially consumed by persons of lower SEP. Likewise, in a system-atic review, Cameron et al. (27) reported that children of lower SEP had a steeper weight gain trajectory initiating at birth and led to a greater prevalence of obesity in children and adults. Pre-pregnancy maternal BMI, diabetes, pre-pregnancy diet, smoking during pregnancy, low birth weight, breastfeeding initiation and duration, early introduction of solids, mater-nal and infant diet quality, and some aspects of the home food environment were among the
early-life predictors of later obesity and amid links with SEP. Furthermore, lack of physical activity is an additional risk factor for develop-ing obesity. A longitudinal study involving re-peated 7-day physical activity recall question-naires over a 5-year period demonstrated that greater fluctuations in physical activity led to an increase in body fat in adolescent girls and boys (28). An interventional study supported these conclusions, demonstrating interruption of sed-entary time with brief moderate-intensity walk-ing resulted in an improvement of short-term metabolic function in non-overweight children without increasing subsequent energy intake (29). Despite the difficulty in directly comparing studies because of the variety of environmen-tal factors and defined end-points, systematic reviews consistently highlight that better and safer access to physical activity resources are directly related to increased leisure time physi-cal activity in children and adolescents, which subsequently decreases the risk of developing obesity (30-34).
Access to physical activity resources is directly related to higher leisure time physical activity in children and adolescents and decreases the risk of developing obesity.
OBESITY AND GENETIC/EPIGENETIC FACTORS
In addition to the risk factors previously dis-cussed, genetic background and foetal pro-gramming through epigenetic modifications are equally important in the development of obesity and related diseases. There is also in-creasing evidence suggesting synergetic ef-fects between gene variant loci involved in metabolic traits and dietary or lifestyle factors. Maes et al. (35) compiled data from more than 25,000 twin pairs and 50,000 biological and adoptive family members and reported that genetic components contribute 40-70% to the
eJIFCC2017Vol28No1pp006-024Page 10
E. Levy, A.K. Saenger, M.W. Steffes, E. DelvinPediatric obesity and cardiometabolic disorders: risk factors and biomarkers
inter-individual variability in common obesity. Another study showed that parental obesity doubled the risk of adult obesity among both obese and non-obese children less than 10 years of age (36). Few studies have investigat-ed the gene-environment interactions related to sedentary behaviour using large cohorts. The Identification and prevention of Dietary- and lifestyle-induced health EFfects In Children and infantS cohort (IDEFICS) used a subsample of 4406 participants to demonstrate that the fat mass and obesity-related gene (FTO) poly-morphism (rs9939609) could explain ~9% of the obesity variance, thereby suggesting the FTO gene was sensitive to the social environ-ment (37). To date, genome wide association studies (GWAS) have provided evidence for a number of gene variants associated with the
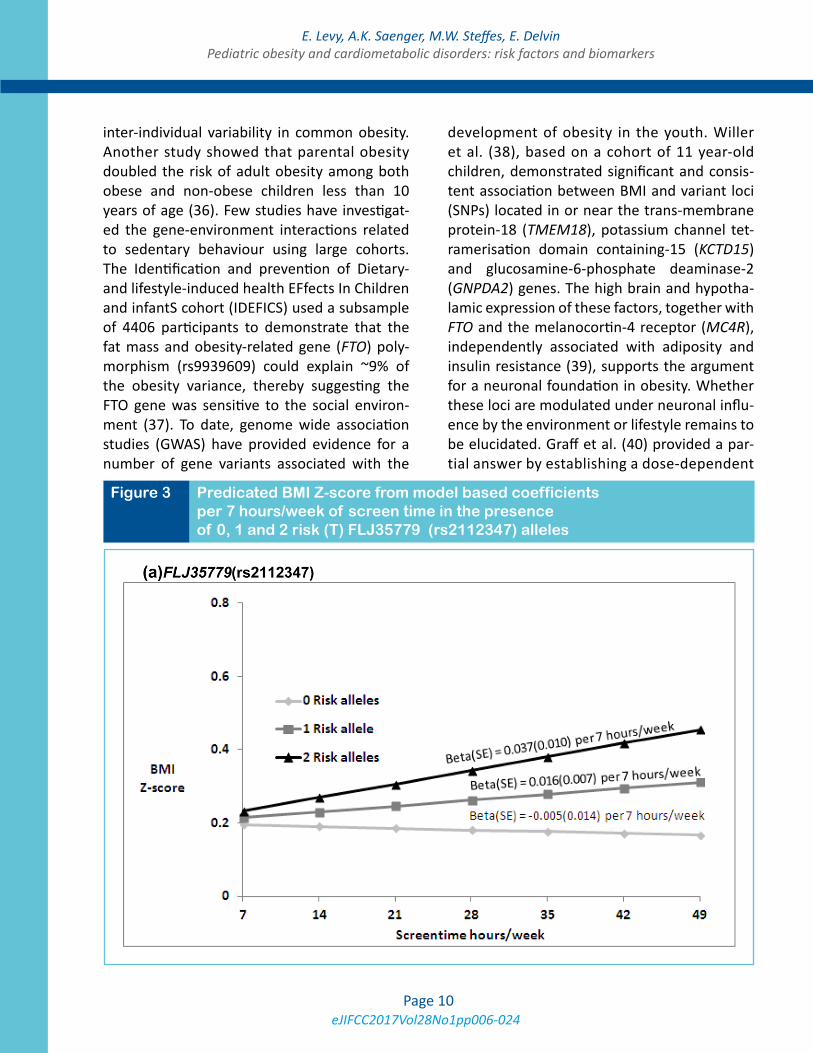
development of obesity in the youth. Willer et al. (38), based on a cohort of 11 year-old children, demonstrated significant and consis-tent association between BMI and variant loci (SNPs) located in or near the trans-membrane protein-18 (TMEM18), potassium channel tet-ramerisation domain containing-15 (KCTD15) and glucosamine-6-phosphate deaminase-2 (GNPDA2) genes. The high brain and hypotha-lamic expression of these factors, together with FTO and the melanocortin-4 receptor (MC4R), independently associated with adiposity and insulin resistance (39), supports the argument for a neuronal foundation in obesity. Whether these loci are modulated under neuronal influ-ence by the environment or lifestyle remains to be elucidated. Graff et al. (40) provided a par-tial answer by establishing a dose-dependent
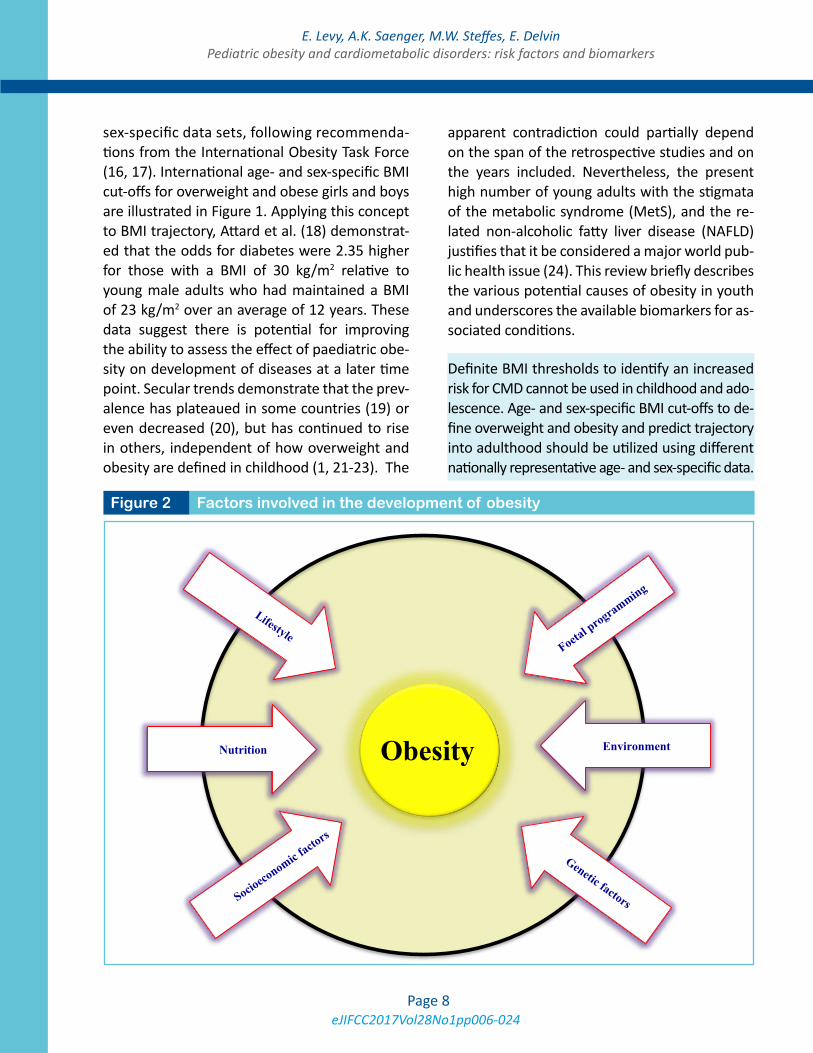
Figure 3 Predicated BMI Z-score from model based coefficients per 7 hours/week of screen time in the presence of 0, 1 and 2 risk (T) FLJ35779 (rs2112347) alleles
eJIFCC2017Vol28No1pp006-024Page 11
E. Levy, A.K. Saenger, M.W. Steffes, E. DelvinPediatric obesity and cardiometabolic disorders: risk factors and biomarkers
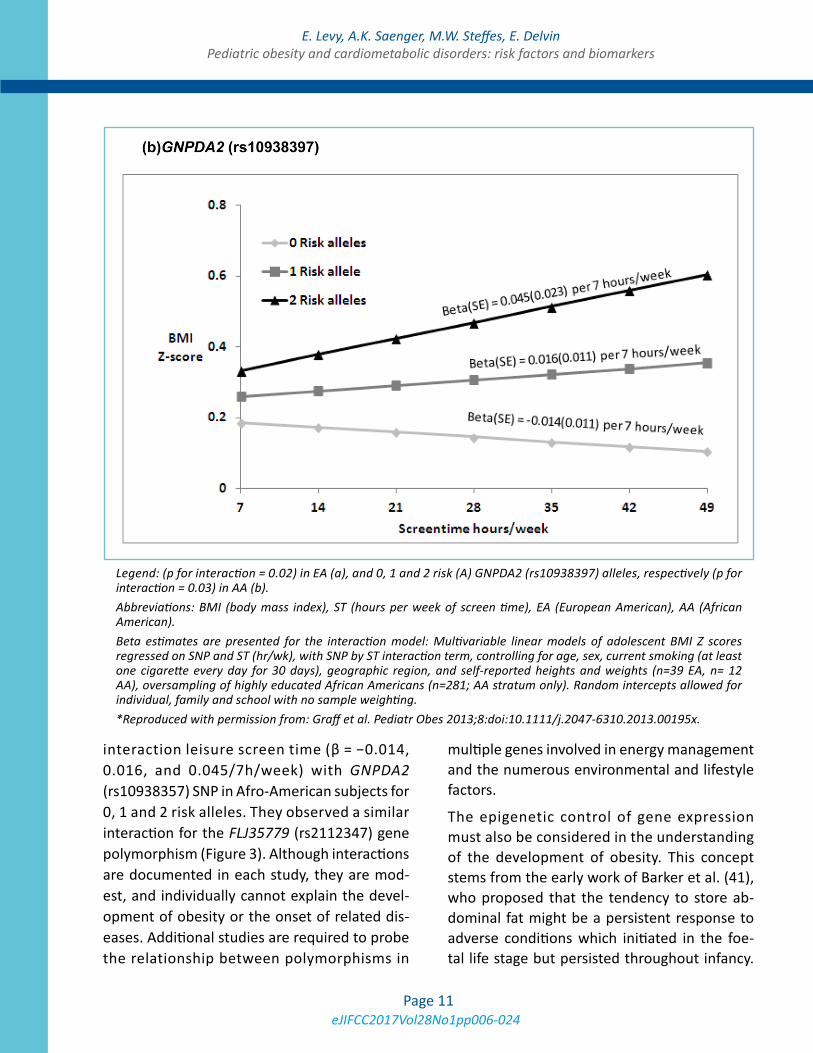
interaction leisure screen time (β = −0.014, 0.016, and 0.045/7h/week) with GNPDA2 (rs10938357) SNP in Afro-American subjects for 0, 1 and 2 risk alleles. They observed a similar interaction for the FLJ35779 (rs2112347) gene polymorphism (Figure 3). Although interactions are documented in each study, they are mod-est, and individually cannot explain the devel-opment of obesity or the onset of related dis-eases. Additional studies are required to probe the relationship between polymorphisms in
multiple genes involved in energy management and the numerous environmental and lifestyle factors.
The epigenetic control of gene expression must also be considered in the understanding of the development of obesity. This concept stems from the early work of Barker et al. (41), who proposed that the tendency to store ab-dominal fat might be a persistent response to adverse conditions which initiated in the foe-tal life stage but persisted throughout infancy.
ta es ima s a e res nte fo t era m de u i a ia l ear mo ls f
o c t M Z s ores regr sse on S P (hr ) w th P y i e act n, ont oll ng for age, sex, ur n smo at lea t
o phi eg on, and sel - eported he ght we gh s (n 3 E , A ,ersamp ing o highly educated Afr can A ans n 81; AA stra um only Randomercep s al owed for i dividual family an oo w h no samp weightin .
t p ;
Legend: (p for interaction = 0.02) in EA (a), and 0, 1 and 2 risk (A) GNPDA2 (rs10938397) alleles, respectively (p for interaction = 0.03) in AA (b). Abbreviations: BMI (body mass index), ST (hours per week of screen time), EA (European American), AA (African American). Beta estimates are presented for the interaction model: Multivariable linear models of adolescent BMI Z scores regressed on SNP and ST (hr/wk), with SNP by ST interaction term, controlling for age, sex, current smoking (at least one cigarette every day for 30 days), geographic region, and self-reported heights and weights (n=39 EA, n= 12 AA), oversampling of highly educated African Americans (n=281; AA stratum only). Random intercepts allowed for individual, family and school with no sample weighting.*Reproduced with permission from: Graff et al. Pediatr Obes 2013;8:doi:10.1111/j.2047-6310.2013.00195x.
eJIFCC2017Vol28No1pp006-024Page 12
E. Levy, A.K. Saenger, M.W. Steffes, E. DelvinPediatric obesity and cardiometabolic disorders: risk factors and biomarkers
A myriad of peer-reviewed publications have confirmed this initial hypothesis (42-46). Lee et al. (47) suggest there is a gene-foetal environ-ment interaction, one of which occurs through in utero exposure to maternal cigarette smok-ing and leads to a preference in adolescence for moderately enhanced fatty foods by silenc-ing the opioid receptor mu-1 gene (OPRM1) in-volved in the brain reward system. Small ges-tational age (SGA) is also well recognized and linked to an increased risk for rapid postnatal weight gain and subsequent development of obesity and chronic metabolic diseases later in life. The Auckland Birth weight Collaborative Study demonstrated that smoking, low preg-nancy weight, maternal short stature, maternal diet, ethnic origin of mother and hypertension are all “environmental” risk factors for SGA (48). A subgroup of the cohort later established that polymorphic FTO (rs9939609, intron), KCNJ11 (rs5219, missense Lys23Glu), BDNF (rs925946, 9.2 kb upstream), PFKP (rs6602024, intron), PTER (rs10508503, 179 kb upstream) and SEC16B (rs10913469, intron) genes, were related to obesity, type 2 diabetes, and SGA which indicates the important interaction be-tween genetic factors and fœtal environment (49). Finally, a prospective singleton normal pregnancy cohort study demonstrated a direct
relationship between the maternal adipo-kines, leptin (a satiety factor) and adiponectin (an insulin sensitizer). The study included 339 healthy women without pre-existing diabetes who were evaluated at 24-28 and 32-35 weeks of gestation and the cord blood (foetal com-partment) assessed at birth (50). Foetal insulin sensitivity was negatively associated with cord blood leptin and positively with pro-insulin con-centrations, suggesting the maternal impact on foetal adipokines may be an early life pathway in maternal-foetal transmission of the propen-sity to develop obesity and insulin resistance later in life. These examples provide compelling evidence on the role and impact of the foetal environment and development of chronic dis-eases later in life.
Parental obesity more than doubles the risk of adult obesity among obese and non-obese children.
Gene-environment interactions are modest, and individually are not able to explain the development of obesity and the onset of related diseases.
There are compelling evidence highlighting the role of foetal environment and development of chronic diseases later in life.
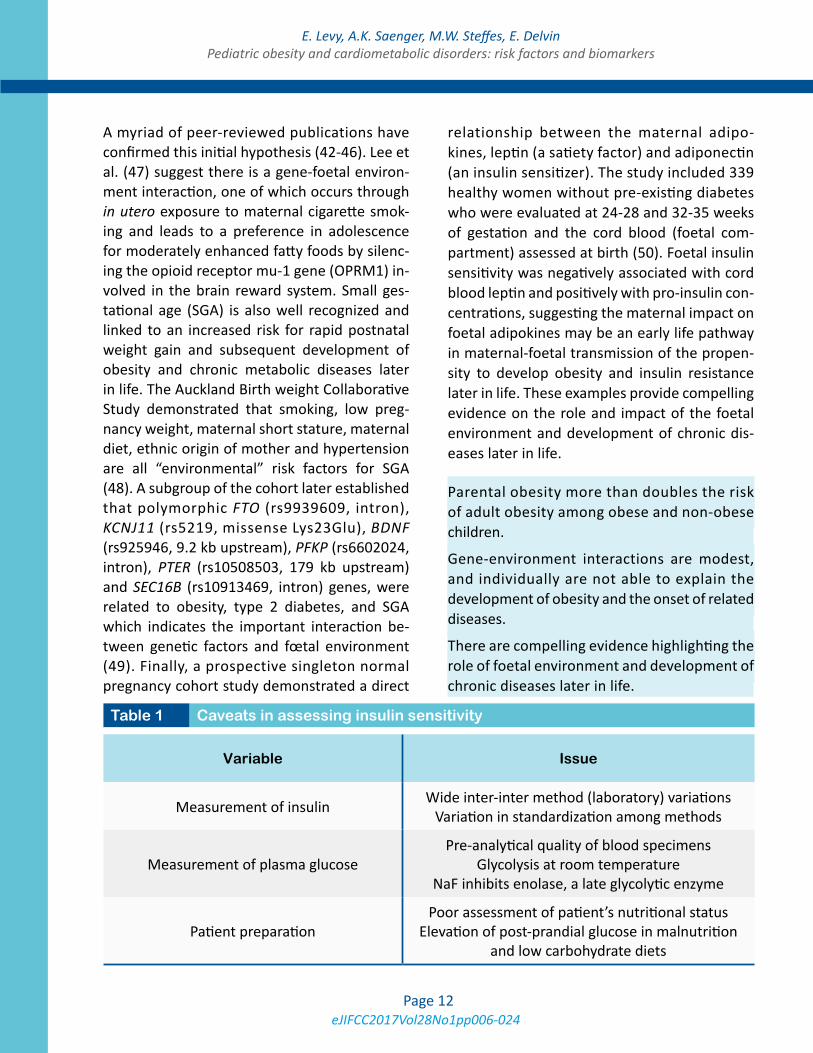
Table 1 Caveats in assessing insulin sensitivity
Variable Issue
Measurement of insulin Wide inter-inter method (laboratory) variations Variation in standardization among methods
Measurement of plasma glucosePre-analytical quality of blood specimens
Glycolysis at room temperature NaF inhibits enolase, a late glycolytic enzyme
Patient preparation Poor assessment of patient’s nutritional status
Elevation of post-prandial glucose in malnutrition and low carbohydrate diets
eJIFCC2017Vol28No1pp006-024Page 13
E. Levy, A.K. Saenger, M.W. Steffes, E. DelvinPediatric obesity and cardiometabolic disorders: risk factors and biomarkers
OBESITY AND MICROBIOTA
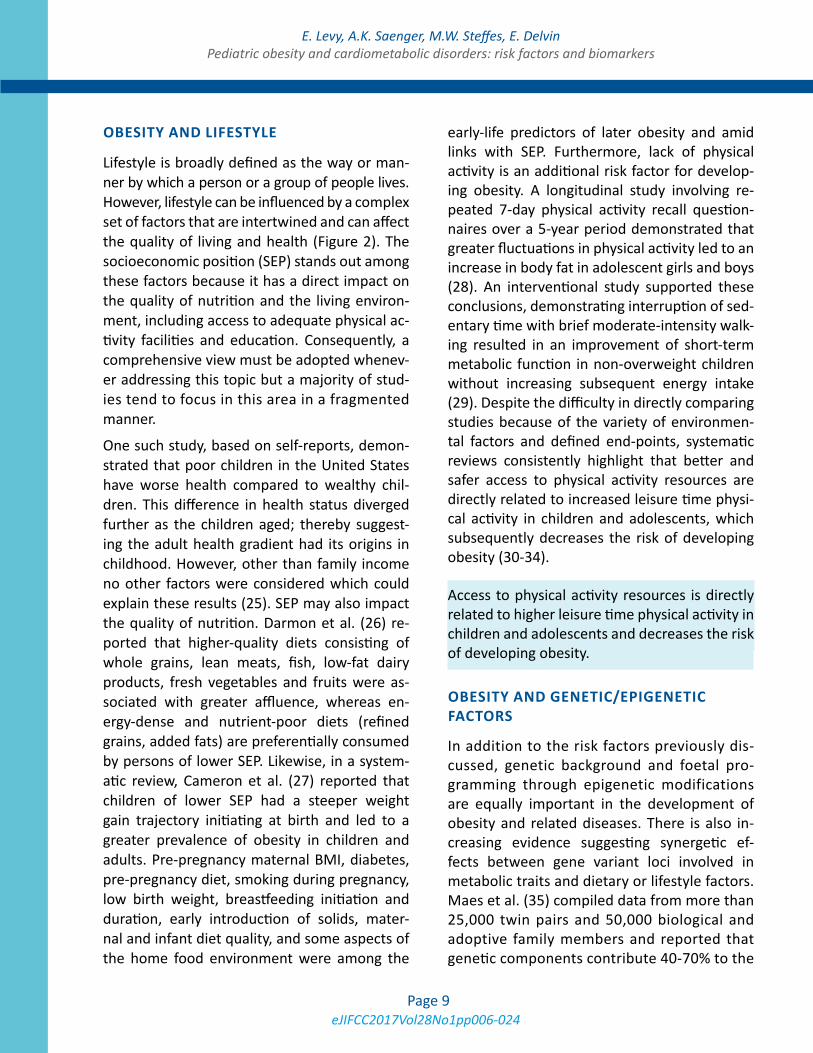
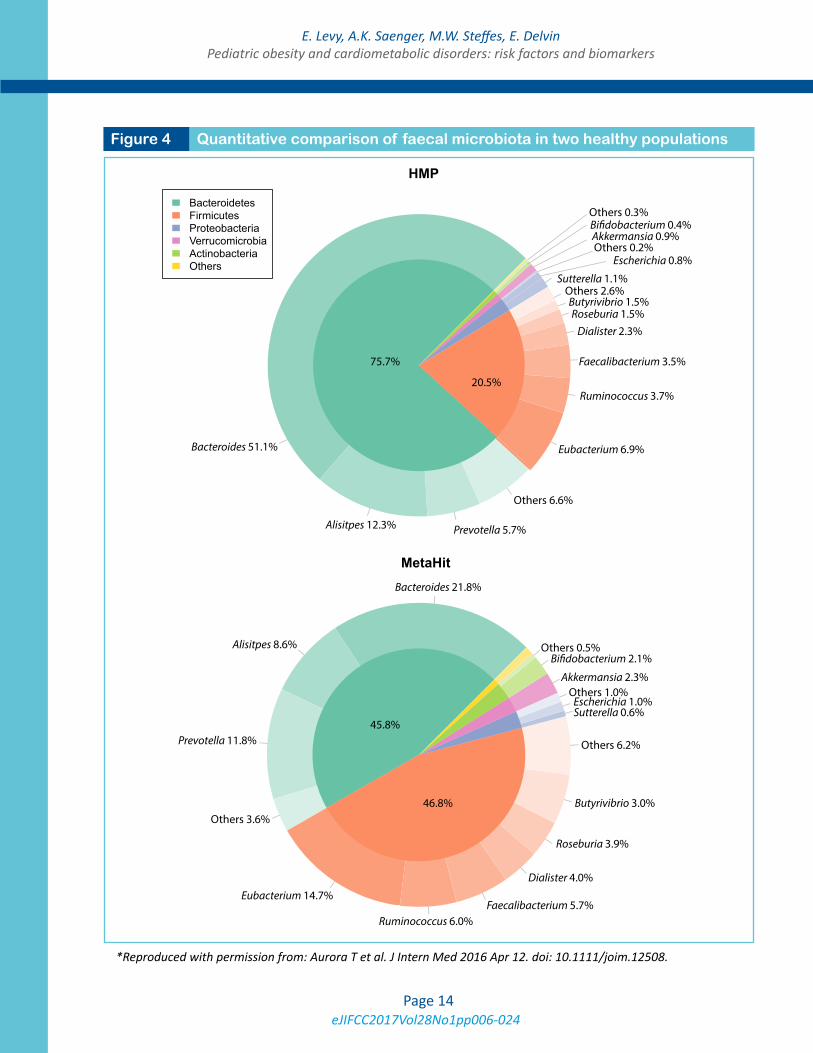
In addition to the above considerations, the gut microbiota may increasingly be shown to impact the course of metabolic diseases. This aspect is briefly reviewed. The synergistic relationship between the human body and the vast microbi-otic environment present on all interfaces with the exterior, particularly the gut lumen, has become of major interest to the medical com-munity. The microbiome cell number far out-numbers somatic or germ cells and represents a far more varied gene diversity than the human genome (51). The advent of high throughput genome sequencing technologies allowed the first meta-sequence of the human gut microbi-ome to be conducted, utilizing stool collected from 124 individuals, and characterized > 3X10⁶ genes from approximately 1000 different mi-croscopic species (52-54). An excellent review by Arora et al. (55) discusses the composition of the gut microbiota and its association with metabolic diseases. Figure 4, taken from this review, shows that 2 phyla, namely Firmicutes and Bacteriodetes, constitute healthy adult gut
microbiota and their relative proportions differ among populations.
Neonatal intestinal flora evolves according to its early environmental exposures, nutrition pat-terns (maternal or industrial milk), hygiene lev-els and therapeutic drug usage (56). Differences in intestinal flora patterns during the first six months of life may have potential impact and downstream consequences on the later devel-opment of chronic conditions such as type 2 diabetes and allergies (57, 58).
The gut microbiota has emerged as a new im-portant player in the pathogenesis of obesity, potentially explained by the fact that each mi-crobiotic species transforms the undigested and partially digested food into metabolites that may influence the physiological systems of the host. Therefore, a loss in diversity may lead to unwanted effects (55). This hypothesis is supported by the observation that composi-tion of the gut microflora is globally less di-verse in obese subjects, with a relative enrich-ment in Firmicutes and a impoverishment in Bacteroïdes (59). Moreover, detailed analysis
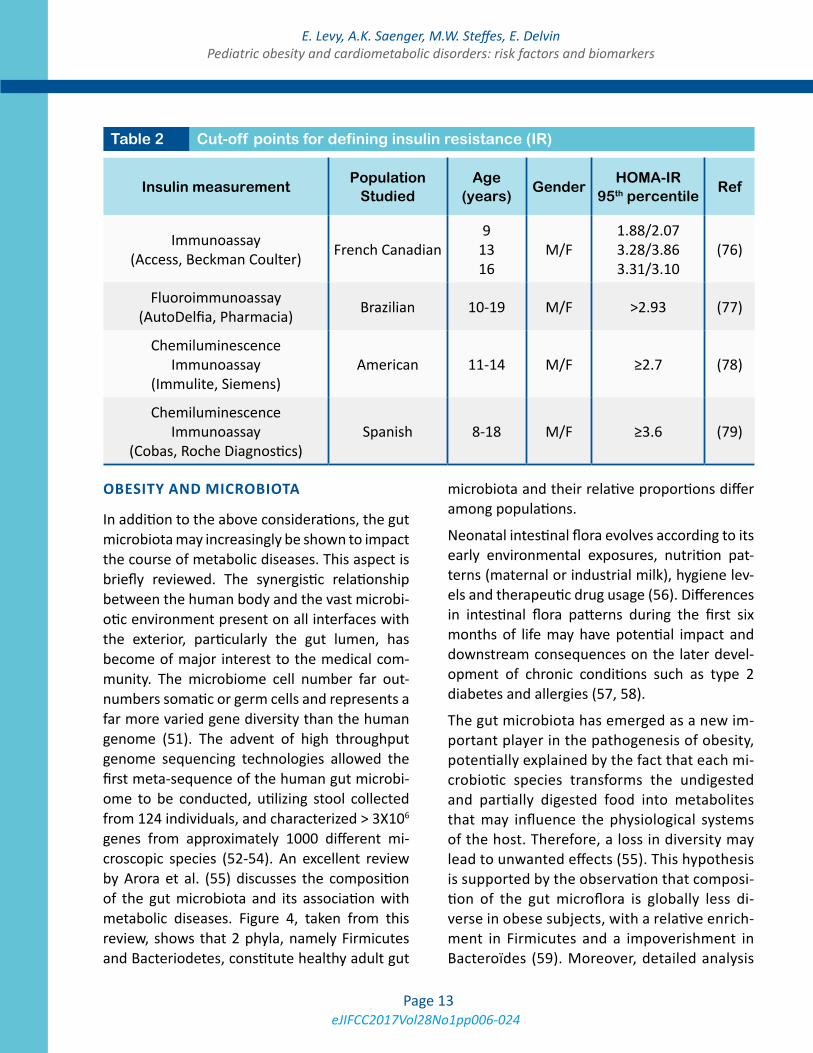
Table 2 Cut-off points for defining insulin resistance (IR)
Insulin measurementPopulation
StudiedAge
(years)Gender
HOMA-IR 95th percentile
Ref
Immunoassay (Access, Beckman Coulter) French Canadian
9 13 16
M/F1.88/2.07 3.28/3.86 3.31/3.10
(76)
Fluoroimmunoassay (AutoDelfia, Pharmacia) Brazilian 10-19 M/F >2.93 (77)
Chemiluminescence Immunoassay
(Immulite, Siemens)American 11-14 M/F ≥2.7 (78)
Chemiluminescence Immunoassay
(Cobas, Roche Diagnostics)Spanish 8-18 M/F ≥3.6 (79)
eJIFCC2017Vol28No1pp006-024Page 14
E. Levy, A.K. Saenger, M.W. Steffes, E. DelvinPediatric obesity and cardiometabolic disorders: risk factors and biomarkers
Figure 4 Quantitative comparison of faecal microbiota in two healthy populations
*Reproduced with permission from: Aurora T et al. J Intern Med 2016 Apr 12. doi: 10.1111/joim.12508.
firsth r d ing rth A m
BacteroidetesFirmicutesProteobacteriaVerrucomicrobiaActinobacteriaOthers
Bacteroides 51.1%
Alisitpes 12.3% Prevotella 5.7%
Others 6.6%
Eubacterium 6.9%
Ruminococcus 3.7%
Faecalibacterium 3.5%
Dialister 2.3%Roseburia 1.5%
Others 2.6%Sutterella 1.1%
Escherichia 0.8%
Akkermansia 0.9%Others 0.2%
0.4%Others 0.3%
Butyrivibrio 1.5%
Bacteroides 21.8%
Alisitpes 8.6%
Prevotella 11.8%
Others 3.6%
Eubacterium 14.7%
Ruminococcus 6.0%Faecalibacterium 5.7%
Dialister 4.0%
Roseburia 3.9%
Others 6.2%
Sutterella 0.6%
Butyrivibrio 3.0%
Escherichia 1.0%
Akkermansia 2.3%Others 1.0%
2.1%Others 0.5%
HMP
MetaHit
75.7%
20.5%
45.8%
46.8%
eJIFCC2017Vol28No1pp006-024Page 15
E. Levy, A.K. Saenger, M.W. Steffes, E. DelvinPediatric obesity and cardiometabolic disorders: risk factors and biomarkers
of the flora in obese subjects reveals a bimod-al distribution: those with a low gene count (LGC) characterised by the predominance of 5 pro-inflammatory bacteria and a less diver-sified metagenome, and those with a high gene count (HGC) with a high percentage of 4 anti-inflammatory bacteria genii (60). The LGC group presents with insulin-resistance, dyslipidemia and low-level infiltration of adi-pose tissue with pro-inflammatory cytokine secreting immunity cells. It has recently been established that levels of butyrate-producing bacteria are reduced in patients with type-2 diabetes, whereas levels of Lactobacillus sp. are increased, thus the reduction of butyrate-producing bacteria may be causally linked to type 2 diabetes. The causal relationship for these differences in humans remains to be
elucidated but opens the way to possible treat-ment of obesity via dietary manipulation. For example, a low calorie regiment composed of plant fibres, proteins and low carbohydrates potentially increases the microbiota diversity (61). Interestingly, bariatric surgery also in-creases the gut microbiota diversity (62, 63). As each microbiotic species transforms the undigested and partially digested food into metabolites that may influence the physiolog-ical systems of the host, a loss in diversity may lead to unwanted effects.
The gut microbiota, a new player in the world of obesity and cardiometabolic diseases, is increasingly called upon to elucidate findings related to these diseases and may eventually impact their course and treatment.
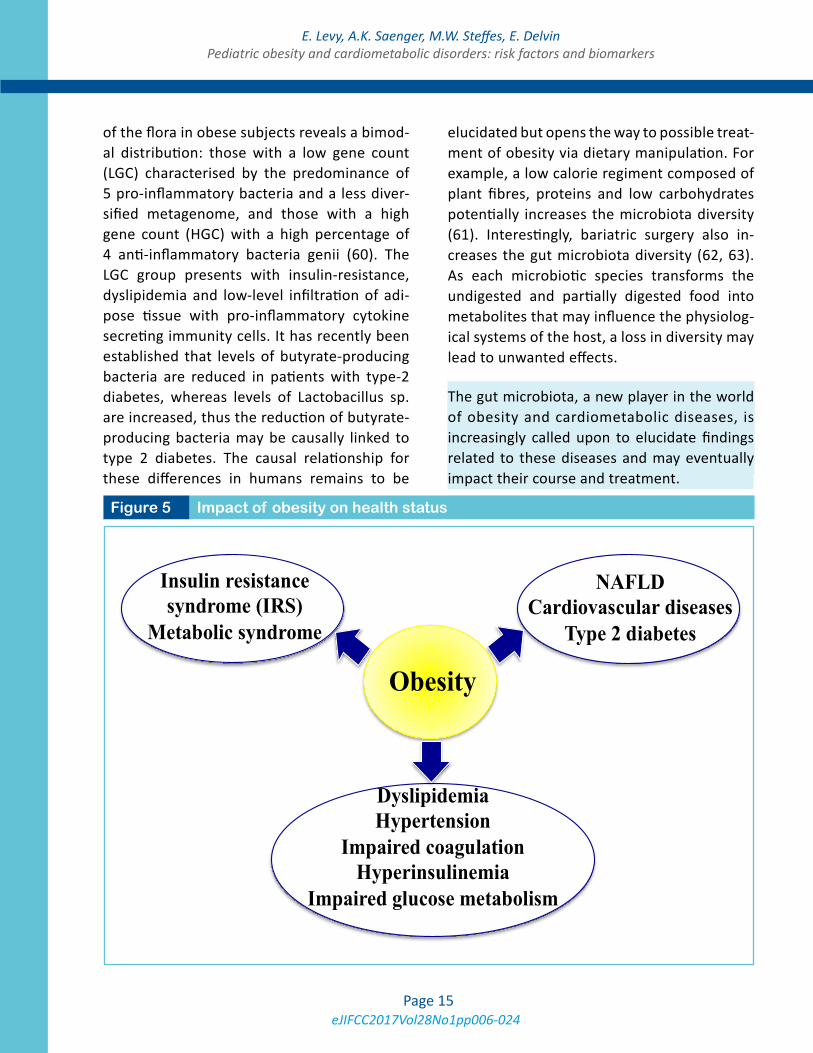
Figure 5 Impact of obesity on health status
NAFLD Cardiovascular diseases
Type 2 diabetes
Insulin resistance syndrome (IRS)
Metabolic syndrome
Dyslipidemia Hypertension
Impaired coagulation Hyperinsulinemia
Impaired glucose metabolism
Obesity
eJIFCC2017Vol28No1pp006-024Page 16
E. Levy, A.K. Saenger, M.W. Steffes, E. DelvinPediatric obesity and cardiometabolic disorders: risk factors and biomarkers
BIOMARKERS
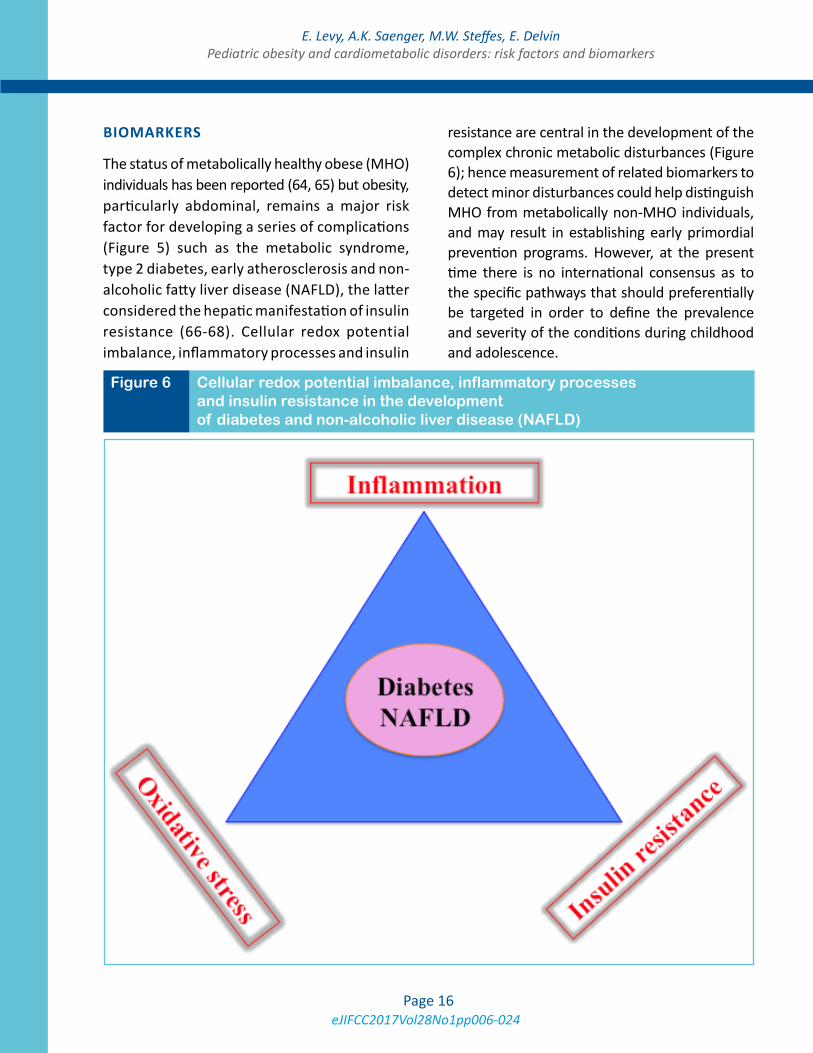
The status of metabolically healthy obese (MHO) individuals has been reported (64, 65) but obesity, particularly abdominal, remains a major risk factor for developing a series of complications (Figure 5) such as the metabolic syndrome, type 2 diabetes, early atherosclerosis and non-alcoholic fatty liver disease (NAFLD), the latter considered the hepatic manifestation of insulin resistance (66-68). Cellular redox potential imbalance, inflammatory processes and insulin
resistance are central in the development of the complex chronic metabolic disturbances (Figure 6); hence measurement of related biomarkers to detect minor disturbances could help distinguish MHO from metabolically non-MHO individuals, and may result in establishing early primordial prevention programs. However, at the present time there is no international consensus as to the specific pathways that should preferentially be targeted in order to define the prevalence and severity of the conditions during childhood and adolescence.
Figure 6 Cellular redox potential imbalance, inflammatory processes and insulin resistance in the development of diabetes and non-alcoholic liver disease (NAFLD)
eJIFCC2017Vol28No1pp006-024Page 17
E. Levy, A.K. Saenger, M.W. Steffes, E. DelvinPediatric obesity and cardiometabolic disorders: risk factors and biomarkers
IMAGING TECHNIQUES
In the last decade, utilization of ultrasonogra-phy, transient elastography and magnetic reso-nance imaging (MRI) has increased significantly. In the context of the present review these tech-niques, except for MRI, are not suitable for the detection of metabolic disturbances and are primarily used to evaluate the extent of liver damage. Although widely available, ultrasonog-raphy is unable to accurately detect or quantify early liver fatty acid infiltrations. Furthermore, this technique is prone to observer- and oper-ator-dependent variability and its use in obese patients is subject of debate (69, 70). Transient elastography, based on the assessment of liver stiffness, has also been shown to be useful in presence of significant fibrosis and cirrhosis (71). Liver magnetic resonance imaging–es-timated proton density fat fraction (PDFF) is more sensitive and favourably comparable to histopathology scores (72). This technology is currently restricted to tertiary care institutions, is expensive, and demands experienced staff. In summary, these imaging techniques are useful in detecting steatosis, but they are relatively inefficient in determining early stage liver dam-age. Biomarkers easily measured in central lab-oratories are therefore of utmost importance and should center on insulin resistance, inflam-mation and oxidative stress, as this triad is the signature of NAFLD.
INSULIN RESISTANCE
The term insulin resistance (IR) frequently re-fers to a physiological state characterized by a diminished biological response to insulin. More precisely, IR refers to a holistic reduction of glu-cose uptake in response to physiological insulin concentrations, primarily in muscle tissue. The optimal assessment of IR in children and ado-lescents remains controversial. Following the Consensus Conference on Childhood IR in 2010,
experts highlighted: 1) the paucity of data re-garding cut-offs to define insulin resistance; 2) poor performance of surrogate measures such as fasting plasma insulin; and 3) lack of justification for screening children, even obese children, because there are no accepted treat-ments for euglycemic IR (73). However, the development of robust methods for assessing insulin sensitivity (IS) in paediatric populations remains of great interest, particularly for epi-demiological studies to monitor metabolic tra-jectory into adulthood.
The hyperinsulinemic-euglycemic clamp is the gold standard for determining total-body IS (73). However, it is not applicable in the context of population screening or routine clinical work-up. In 2014 Brown and Yanovski (74) published an excellent review on this technique as well as surrogate measures and their pitfalls. The hyper-insulinemic-euglycemic clamp, as its name indi-cates, depends on repeated measures of both insulin and blood glucose, each having their own potential analytical pitfalls that may hinder inter-laboratory comparison (Table 1).
Reliable interpretation of hyperinsulinemic-euglycemic clamp studies is also dependent upon normal inter-individual biological differ-ences such as insulin clearance rates and time required to reach a steady state. Alternative methods include the insulin tolerance test (ITT), the hyperglycemic clamp, the insulin-modified or frequently sampled intravenous glucose tol-erance test (FSIGT) and the more frequently used oral glucose tolerance test (OGTT) (74).
FASTING INSULIN AND THE HOMA-IR
Assessment of IR or IS is frequently conduct-ed using single measurements due to ease of availability and simplicity. Measurement of fasting insulin concentrations are consid-ered representative of insulin hepatic sensi-tivity (low concentrations) or resistance (high
eJIFCC2017Vol28No1pp006-024Page 18
E. Levy, A.K. Saenger, M.W. Steffes, E. DelvinPediatric obesity and cardiometabolic disorders: risk factors and biomarkers
concentrations). In theory, this information is valuable and may alert clinicians to even-tual liver function impairment but there are issues around defining an abnormal elevated fasting insulin concentration because the data on reference values in fasting insulinemia are scarce. In addition, the lack of standardization or harmonization between different insulin assays hampers direct comparison between laboratories, peer-reviewed publications, and impedes coherent measures for treatment guidelines. This was highlighted in 2007 by the IFCC Working Group on Standardization of Insulin Assays, in an evaluation of 12 commer-cial insulin methods (75). The within-assay CVs ranged from 3.7% to 39.0% and between assay CVs from 12% to 66% (75). In 2009 the working group reported that 4 out of 10 insulin assays, when re-calibrated with a purified recombinant insulin preparation, had ≥ 95% of the 39 indi-vidual donor sera results within 32% of the tar-get value assigned by an isotope dilution-mass spectrometry assay. In addition, 7 of 10 assays had a bias >15% in 36 to 100% of individual samples. The consensus group concluded that agreement between assays would improve us-ing an international reference material and a higher order mass spectrometry method (76). Subsequent high-throughput mass spectrom-etry immunoassays have been developed to quantitate human intact insulin as well as in-sulin analogs, which may allow an accurate definition of insulinemia to be determined (77, 78). Accurate measurement of plasma insulin is of paramount importance for establishing comparable Homeostasis Model Assessment of IR (HOMA-IR) reference values across labo-ratories, although variation between ethnic populations may be a confounding factor that should be taken into consideration. At the pres-ent time HOMA-IR cut-offs are still highly meth-od dependent. Table 2 illustrates the distribu-tion of published cut-off points for defining IR,
and confirm the warning of Wallace et al. (79): “The HOMA model has become a widely used clinical and epidemiological tool and, when used appropriately, it can yield valuable data. However, as with all models, the primary input data need to be robust, and the data need to be interpreted carefully.” To address this issue, the IFCC (http://www.ifcc.org/ifcc-scientific-di-vision/sd-working-groups/wg-sia/), in collabo-ration with the American Diabetes Association (ADA) and the European Association for the Study of Diabetes (EASD), has created the Working group on Standardisation of Insulin Assays (WG-SIA) with the mandate of improv-ing the standardization of assays for insulin by the development of a candidate reference method based on liquid chromatography-tan-dem mass spectrometry, and of a lyophilized recombinant human insulin preparation as pri-mary reference material.
Although insulin resistance is a well-recognized clinical entity, there are currently no interna-tionally accepted definition of its expression in children and adolescents. One well-character-ized definition requires the presence of three or more factors which can be age-adjusted to de-fine hyperinsulinaemia: Overweight, high sys-tolic blood pressure, hypertriglyceridemia, low HDL-cholesterol and impaired fasting plasma glucose (84).
Data on normal reference intervals for fasting insulinemia are scarce.
Lack of standardized or harmonized insulin as-says hampers comparison between laboratories and impedes coherent measures for treatment guidelines.
Distinguishing MHO young patients from those unhealthy bears a major clinical importance as they are, for reasons that are yet to be defined, resistant to develop CMD; hence follow-up and treatment differ (64). Low-grade inflammation
eJIFCC2017Vol28No1pp006-024Page 19
E. Levy, A.K. Saenger, M.W. Steffes, E. DelvinPediatric obesity and cardiometabolic disorders: risk factors and biomarkers
and cellular redox potential imbalance are, to-gether with insulin resistance, key-role players in the development of the non-healthy state in obese subjects.
INFLAMMATION
Inflammation is the second cause in the devel-opment of CMD and NAFLD related to paediat-ric obesity. A number of biomarkers have been identified but primarily in the context of clini-cal trials, thus their specificity, sensitivity and predictive values have yet to be defined for screening and diagnostic purposes. C-Reactive Protein (CRP), a member of the pantraxin fam-ily involved in plaque instability, is the most commonly utilized inflammatory biomarker. Although the sensitivity of CRP is generally high, the specificity is low, particularly in the setting of potential low-grade inflammation. Nevertheless, discrete elevation in circulating CRP concentrations has been associated in the definition of the metabolic syndrome (84, 85). Its advantage resides in its wide accessibility by central laboratories. However, as for any other biomarkers, well-defined age-, sex- and ethnicity-adjusted reference values or thresh-olds have to be defined if they are to be used for clinical purposes. The analytical sensitiv-ity, even for the high-sensitivity CRP (hsCRP) test, however, limits the definition of refer-ence ranges. One European population-based study reported that 44% of the 9855 children tested exhibited serum CRP concentrations below the detection limit (0.2 mg/l) and con-firmed our observation (85) to the effect that obesity influenced serum CRP concentrations (86).
C-Reactive Protein (CRP) is the most commonly utilized biomarker of inflammation. The speci-ficity of CRP is questionable, particularly in the setting of low-level inflammation.
Well-defined age-, sex- and ethnicity-adjusted reference values or thresholds have to be de-fined if they are to be used for clinical purposes.
Visceral adipose tissue per se and its resident macrophages contribute importantly to sys-temic inflammation by secreting adipokines and pro- and anti-inflammatory cytokines. Indeed, clinical studies have consistently shown elevat-ed blood concentrations of pro-inflammatory cytokines such as IL-6, IL-8, TNFα, PAI-1, resis-tin and amylin in overweight and obese insulin-resistant youth (87-90). However, this relation-ship does not imply unanimity. A recent report has noted that the relationship between pro-in-flammatory and metabolic markers commonly observed in adults and pubertal adolescents is reversed in healthy black and white children before puberty, which warrants questions as to whether these inverse relationships modify the trajectory later in life (91). Population-based studies focused on evaluating pro-inflammatory and metabolic markers to determine which bio-markers constitute sensitive and specific tools in the context of a diagnosis of insulin resis-tance would be valuable.
OXIDATIVE STRESS
Oxidative stress is often a neglected cause of paediatric obesity-related morbidities, and no biomarkers have been successfully validated yet for routine clinical use. To our knowledge there are no clinical research studies demon-strating that circulating concentrations of malo-nyldialdehyde (MDA), Hydroxynonenal (HNE), advanced glycation end-products (AGEs) and 8-hydroxy-2-deoxyguanosine (8-OH-dG), which are surrogate markers for lipids, proteins and deoxyribonucleic acid damages respectively, are effective diagnostic tools for CMD in child-hood and adolescence.
In an observational study performed on 35 children between the ages of 12 and 18 years,
eJIFCC2017Vol28No1pp006-024Page 20
E. Levy, A.K. Saenger, M.W. Steffes, E. DelvinPediatric obesity and cardiometabolic disorders: risk factors and biomarkers
Khelishadi et al. (92) reported that the age- and sex-adjusted changes in ox-LDL, waist circum-ference, CRP, MDA and body fat mass had the highest correlations with changes in coronary intima media thickness. More recently, in a population-based study, Galan-Chilet et al. (93) demonstrated a positive association of seleni-um at plasma concentrations above ~110 μg/L for 8-oxo-dG, but an inverse association with GSSG/GSH and MDA. They further identified potential risk genotypes associated with in-creased levels of oxidative stress markers with high selenium levels.
CONCLUSIONS
There is currently no single biomarker which can adequately define obesity-related CMD risk in paediatrics or adults. Prospective clinical trials should focus on devising a score based on well-characterized and appropriately validated biomarkers.
REFERENCES
1. Broyles S, Katzmarzyk PT, Srinivasan SR, Chen W, Bouchard C, Freedman DS, et al. The pediatric obesity epidemic continues unabated in Bogalusa, Louisiana. Pe-diatrics. 2010;125(5):900-5.
2. Brune M, Hochberg Z. Secular trends in new childhood epidemics: insights from evolutionary medicine. BMC medicine. 2013;11:226.
3. Gupta N, Shah P, Nayyar S, Misra A. Childhood obesity and the metabolic syndrome in developing countries. In-dian journal of pediatrics. 2013;80 Suppl 1:S28-37.
4. Cote AT, Harris KC, Panagiotopoulos C, Sandor GG, Devlin AM. Childhood obesity and cardiovascular dys-function. Journal of the American College of Cardiology. 2013;62(15):1309-19.
5. Nazare JA, Smith JD, Borel AL, Haffner SM, Balkau B, Ross R, et al. Ethnic influences on the relations between abdominal subcutaneous and visceral adiposity, liver fat, and cardiometabolic risk profile: the International Study of Prediction of Intra-Abdominal Adiposity and Its Re-lationship With Cardiometabolic Risk/Intra-Abdominal Adiposity. The American journal of clinical nutrition. 2012;96(4):714-26.
6. Dulloo AG, Jacquet J, Solinas G, Montani JP, Schutz Y. Body composition phenotypes in pathways to obesity and the metabolic syndrome. International journal of obesity (2005). 2010;34 Suppl 2:S4-17.
7. Yoon KH, Lee JH, Kim JW, Cho JH, Choi YH, Ko SH, et al. Epidemic obesity and type 2 diabetes in Asia. Lancet (London, England). 2006;368(9548):1681-8.
8. Carson AP, Howard G, Burke GL, Shea S, Levitan EB, Muntner P. Ethnic differences in hypertension in-cidence among middle-aged and older adults: the multi-ethnic study of atherosclerosis. Hypertension. 2011;57(6):1101-7.
9. Maskarinec G, Grandinetti A, Matsuura G, Sharma S, Mau M, Henderson BE, et al. Diabetes prevalence and body mass index differ by ethnicity: the Multiethnic Co-hort. Ethnicity & disease. 2009;19(1):49-55.
10. Liska D, Dufour S, Zern TL, Taksali S, Cali AM, Dziura J, et al. Interethnic differences in muscle, liver and ab-dominal fat partitioning in obese adolescents. PloS one. 2007;2(6):e569.
11. Azuma K, Kadowaki T, Cetinel C, Kadota A, El-Saed A, Kadowaki S, et al. Higher liver fat content among Japa-nese in Japan compared with non-Hispanic whites in the United States. Metabolism: clinical and experimental. 2009;58(8):1200-7.
12. World Health Organization. Interim Report of the Commission on Ending Childhood Obesity. Geneva, Swit-zerland: World Health Organization, 2015.
13. World Health Organization. Obesity: preventing and managing the global epidemic Report of a WHO Consul-tation (WHO Technical Report Series 894). Geneva, Swit-zerland: World Health Organization, 2000.
14. Rolland-Cachera MF, Sempe M, Guilloud-Bataille M, Patois E, Pequignot-Guggenbuhl F, Fautrad V. Adiposity indices in children. The American journal of clinical nutri-tion. 1982;36(1):178-84.
15. de Onis M, Garza C, Onyango AW, Rolland-Cachera MF. [WHO growth standards for infants and young chil-dren]. Archives de pediatrie : organe officiel de la Societe francaise de pediatrie. 2009;16(1):47-53.
16. Bellizzi MC, Dietz WH. Workshop on childhood obe-sity: summary of the discussion. The American journal of clinical nutrition. 1999;70(1):173s-5s.
17. Cole TJ, Bellizzi MC, Flegal KM, Dietz WH. Establish-ing a standard definition for child overweight and obesity worldwide: international survey. BMJ (Clinical research ed). 2000;320(7244):1240-3.
18. Attard SM, Herring AH, Howard AG, Gordon-Larsen P. Longitudinal trajectories of BMI and cardiovascular
eJIFCC2017Vol28No1pp006-024Page 21
E. Levy, A.K. Saenger, M.W. Steffes, E. DelvinPediatric obesity and cardiometabolic disorders: risk factors and biomarkers
disease risk: the national longitudinal study of adolescent health. Obesity (Silver Spring, Md). 2013;21(11):2180-8.
19. Olds T, Maher C, Zumin S, Peneau S, Lioret S, Castet-bon K, et al. Evidence that the prevalence of childhood overweight is plateauing: data from nine countries. In-ternational journal of pediatric obesity : IJPO : an official journal of the International Association for the Study of Obesity. 2011;6(5-6):342-60.
20. Sjoberg A, Lissner L, Albertsson-Wikland K, Marild S. Recent anthropometric trends among Swedish school children: evidence for decreasing prevalence of over-weight in girls. Acta paediatrica (Oslo, Norway : 1992). 2008;97(1):118-23.
21. Wabitsch M, Moss A, Kromeyer-Hauschild K. Unex-pected plateauing of childhood obesity rates in devel-oped countries. BMC medicine. 2014;12:17.
22. Meszaros Z, Meszaros J, Volgyi E, Sziva A, Pampakas P, Prokai A, et al. Body mass and body fat in Hungarian schoolboys: differences between 1980-2005. Journal of physiological anthropology. 2008;27(5):241-5.
23. Zong XN, Li H. Secular trends in prevalence and risk factors of obesity in infants and preschool children in 9 Chinese cities, 1986-2006. PloS one. 2012;7(10):e46942.
24. Marchesini G, Brizi M, Bianchi G, Tomassetti S, Bu-gianesi E, Lenzi M, et al. Nonalcoholic fatty liver dis-ease: a feature of the metabolic syndrome. Diabetes. 2001;50(8):1844-50.
25. Case AL, D.; Paxson, D. Economic Status and Health in Childhood: The Origins of the Gradient. Amer Econ Rev. 2002;92(5):1308-34.
26. Darmon N, Drewnowski A. Does social class predict diet quality? The American journal of clinical nutrition. 2008;87(5):1107-17.
27. Cameron AJ, Spence AC, Laws R, Hesketh KD, Lioret S, Campbell KJ. A Review of the Relationship Between Socioeconomic Position and the Early-Life Predictors of Obesity. Current obesity reports. 2015;4(3):350-62.
28. Belanger M, O’Loughlin J, Karp I, Barnett TA, Sabis-ton CM. Physical activity fluctuations and body fat during adolescence. Pediatric obesity. 2012;7(1):73-81.
29. Belcher BR, Berrigan D, Papachristopoulou A, Brady SM, Bernstein SB, Brychta RJ, et al. Effects of Inter-rupting Children’s Sedentary Behaviors With Activ-ity on Metabolic Function: A Randomized Trial. The Journal of clinical endocrinology and metabolism. 2015;100(10):3735-43.
30. Feng J, Glass TA, Curriero FC, Stewart WF, Schwartz BS. The built environment and obesity: A systematic re-view of the epidemiologic evidence. Health & Place. 2010;16(2):175-90.
31. Ding D, Sallis JF, Kerr J, Lee S, Rosenberg DE. Neigh-borhood environment and physical activity among youth a review. American journal of preventive medicine. 2011;41(4):442-55.
32. Ding D, Gebel K. Built environment, physical activity, and obesity: What have we learned from reviewing the literature? Health & Place. 2012;18(1):100-5.
33. Datar A, Nicosia N, Shier V. Parent perceptions of neighborhood safety and children’s physical activity, sed-entary behavior, and obesity: evidence from a national longitudinal study. American journal of epidemiology. 2013;177(10):1065-73.
34. Prins RG, Kamphuis CB, van Empelen P, Beenack-ers MA, Brug J, Mackenbach JP, et al. Explaining socio-demographic differences in disengagement from sports in adolescence. European journal of public health. 2013;23(5):811-6.
35. Maes HH, Neale MC, Eaves LJ. Genetic and environ-mental factors in relative body weight and human adipos-ity. Behavior genetics. 1997;27(4):325-51.
36. Whitaker RC, Wright JA, Pepe MS, Seidel KD, Dietz WH. Predicting obesity in young adulthood from child-hood and parental obesity. The New England journal of medicine. 1997;337(13):869-73.
37. Foraita R, Gunther F, Gwozdz W, Reisch LA, Russo P, Lauria F, et al. Does the FTO gene interact with the so-cioeconomic status on the obesity development among young European children? Results from the IDEFICS study. International journal of obesity (2005). 2015;39(1):1-6.
38. Willer CJ, Speliotes EK, Loos RJ, Li S, Lindgren CM, Heid IM, et al. Six new loci associated with body mass index highlight a neuronal influence on body weight regu-lation. Nature genetics. 2009;41(1):25-34.
39. Chambers JC, Elliott P, Zabaneh D, Zhang W, Li Y, Froguel P, et al. Common genetic variation near MC4R is associated with waist circumference and insulin resis-tance. Nature genetics. 2008;40(6):716-8.
40. Graff M, North KE, Richardson AS, Young KM, Mohlke KL, Lange LA, et al. Screen time behaviours may interact with obesity genes, independent of physical activity, to influence adolescent BMI in an ethnically diverse cohort. Pediatric obesity. 2013;8(6):e74-9.
41. Law CM, Barker DJ, Osmond C, Fall CH, Simmonds SJ. Early growth and abdominal fatness in adult life. Journal of epidemiology and community health. 1992;46(3):184-6.
42. Leduc L, Levy E, Bouity-Voubou M, Delvin E. Fetal pro-gramming of atherosclerosis: possible role of the mito-chondria. European journal of obstetrics, gynecology, and reproductive biology. 2010;149(2):127-30.
eJIFCC2017Vol28No1pp006-024Page 22
E. Levy, A.K. Saenger, M.W. Steffes, E. DelvinPediatric obesity and cardiometabolic disorders: risk factors and biomarkers
43. Lane RH. Fetal programming, epigenetics, and adult onset disease. Clinics in perinatology. 2014;41(4):815-31.
44. Desai M, Jellyman JK, Ross MG. Epigenomics, gesta-tional programming and risk of metabolic syndrome. In-ternational journal of obesity (2005). 2015;39(4):633-41.
45. Alexander BT, Dasinger JH, Intapad S. Fetal program-ming and cardiovascular pathology. Comprehensive Phys-iology. 2015;5(2):997-1025.
46. Rolland-Cachera MF, Akrout M, Peneau S. Nutrient Intakes in Early Life and Risk of Obesity. Int J Environ Res Public Health. 2016;13(6).
47. Lee KW, Abrahamowicz M, Leonard GT, Richer L, Per-ron M, Veillette S, et al. Prenatal exposure to cigarette smoke interacts with OPRM1 to modulate dietary prefer-ence for fat. Journal of psychiatry & neuroscience : JPN. 2015;40(1):38-45.
48. Thompson JM, Clark PM, Robinson E, Becroft DM, Pattison NS, Glavish N, et al. Risk factors for small-for-gestational-age babies: The Auckland Birthweight Col-laborative Study. Journal of paediatrics and child health. 2001;37(4):369-75.
49. Morgan AR, Thompson JM, Murphy R, Black PN, Lam WJ, Ferguson LR, et al. Obesity and diabetes genes are as-sociated with being born small for gestational age: results from the Auckland Birthweight Collaborative study. BMC medical genetics. 2010;11:125.
50. Luo ZC, Nuyt AM, Delvin E, Fraser WD, Julien P, Audi-bert F, et al. Maternal and fetal leptin, adiponectin levels and associations with fetal insulin sensitivity. Obesity (Sil-ver Spring, Md). 2013;21(1):210-6.
51. Greenhalgh K, Meyer KM, Aagaard KM, Wilmes P. The human gut microbiome in health: establishment and re-silience of microbiota over a lifetime. Environmental mi-crobiology. 2016.
52. Qin J, Li R, Raes J, Arumugam M, Burgdorf KS, Man-ichanh C, et al. A human gut microbial gene catalogue established by metagenomic sequencing. Nature. 2010;464(7285):59-65.
53. Huttehower C GD, Knight R, Abubucker S, Badger JH, Chinwalla AT et al. For the Human Microbiome Project Con-sortium. Structure, function and diversity of the healthy human microbiome. Nature. 2012;486(7402):207-14.
54. Methé BA NK, Pop M, Creasy HH, Giglio MG, Hutten-hower C. et al. For the Human Microbiome Project Con-sortsium;. A framework for human microbiome research. Nature. 2012;486(7402):215-21.
55. Arora T, Backhed F. The gut microbiota and metabolic disease: current understanding and future perspectives. Journal of internal medicine. 2016.
56. Cong X, Xu W, Janton S, Henderson WA, Matson A, McGrath JM, et al. Gut Microbiome Developmental Pat-terns in Early Life of Preterm Infants: Impacts of Feeding and Gender. PloS one. 2016;11(4):e0152751.
57. Yatsunenko T, Rey FE, Manary MJ, Trehan I, Domin-guez-Bello MG, Contreras M, et al. Human gut mi-crobiome viewed across age and geography. Nature. 2012;486(7402):222-7.
58. Debré PLG, J.Y. Intestinal microbiota. Bull Acad Natle Méd. 2014;198(9):1667-84.
59. Angelakis E, Armougom F, Million M, Raoult D. The relationship between gut microbiota and weight gain in humans. Future microbiology. 2012;7(1):91-109.
60. Le Chatelier E, Nielsen T, Qin J, Prifti E, Hildeb-rand F, Falony G, et al. Richness of human gut micro-biome correlates with metabolic markers. Nature. 2013;500(7464):541-6.
61. Festi D, Schiumerini R, Eusebi LH, Marasco G, Taddia M, Colecchia A. Gut microbiota and metabolic syndrome. World journal of gastroenterology. 2014;20(43):16079-94.
62. Aron-Wisnewsky J, Dore J, Clement K. The importance of the gut microbiota after bariatric surgery. Nature re-views Gastroenterology & hepatology. 2012;9(10):590-8.
63. Furet JP, Kong LC, Tap J, Poitou C, Basdevant A, Bouil-lot JL, et al. Differential adaptation of human gut micro-biota to bariatric surgery-induced weight loss: links with metabolic and low-grade inflammation markers. Diabe-tes. 2010;59(12):3049-57.
64. Bluher S, Schwarz P. Metabolically healthy obe-sity from childhood to adulthood - Does weight status alone matter? Metabolism: clinical and experimental. 2014;63(9):1084-92.
65. Prince RL, Kuk JL, Ambler KA, Dhaliwal J, Ball GD. Pre-dictors of metabolically healthy obesity in children. Dia-betes care. 2014;37(5):1462-8.
66. Cook S, Kavey RE. Dyslipidemia and pediatric obesi-ty. Pediatric clinics of North America. 2011;58(6):1363-73, ix.
67. Finn P. Dyslipidemia in Overweight and Obese School-Aged Children. NASN school nurse (Print). 2015;30(5):255-7.
68. Ali O, Cerjak D, Kent JW, Jr., James R, Blangero J, Zhang Y. Obesity, central adiposity and cardiometabolic risk fac-tors in children and adolescents: a family-based study. Pediatric obesity. 2014;9(3):e58-62.
69. Schwenzer NF, Springer F, Schraml C, Stefan N, Mach-ann J, Schick F. Non-invasive assessment and quan-tification of liver steatosis by ultrasound, computed
eJIFCC2017Vol28No1pp006-024Page 23
E. Levy, A.K. Saenger, M.W. Steffes, E. DelvinPediatric obesity and cardiometabolic disorders: risk factors and biomarkers
tomography and magnetic resonance. Journal of hepatol-ogy. 2009;51(3):433-45.
70. Strauss S, Gavish E, Gottlieb P, Katsnelson L. Interob-server and intraobserver variability in the sonographic assessment of fatty liver. AJR American journal of roent-genology. 2007;189(6):W320-3.
71. Alkhouri N, Sedki E, Alisi A, Lopez R, Pinzani M, Feld-stein AE, et al. Combined paediatric NAFLD fibrosis index and transient elastography to predict clinically significant fibrosis in children with fatty liver disease. Liver interna-tional : official journal of the International Association for the Study of the Liver. 2013;33(1):79-85.
72. Tang A, Tan J, Sun M, Hamilton G, Bydder M, Wolfson T, et al. Nonalcoholic fatty liver disease: MR imaging of liver proton density fat fraction to assess hepatic steato-sis. Radiology. 2013;267(2):422-31.
73. Levy-Marchal C, Arslanian S, Cutfield W, Sinaiko A, Druet C, Marcovecchio ML, et al. Insulin resistance in children: consensus, perspective, and future directions. The Journal of clinical endocrinology and metabolism. 2010;95(12):5189-98.
74. Brown RJ, Yanovski JA. Estimation of insulin sensitivity in children: methods, measures and controversies. Pedi-atric diabetes. 2014;15(3):151-61.
75. Marcovina S, Bowsher RR, Miller WG, Staten M, My-ers G, Caudill SP, et al. Standardization of insulin immu-noassays: report of the American Diabetes Association Workgroup. Clinical chemistry. 2007;53(4):711-6.
76. Miller WG, Thienpont LM, Van Uytfanghe K, Clark PM, Lindstedt P, Nilsson G, et al. Toward standard-ization of insulin immunoassays. Clinical chemistry. 2009;55(5):1011-8.
77. Oran PE, Jarvis JW, Borges CR, Sherma ND, Nelson RW. Mass spectrometric immunoassay of intact insulin and related variants for population proteomics studies. Proteomics Clinical applications. 2011;5(7-8):454-9.
78. Van Der Gugten JG, Wong S, Holmes DT. Quantita-tion of Insulin Analogues in Serum Using Immunoaffin-ity Extraction, Liquid Chromatography, and Tandem Mass Spectrometry. Methods in molecular biology (Clifton, NJ). 2016;1378:119-30.
79. Wallace TM, Levy JC, Matthews DR. Use and abuse of HOMA modeling. Diabetes care. 2004;27(6):1487-95.
80. Allard P, Delvin EE, Paradis G, Hanley JA, O’Loughlin J, Lavallee C, et al. Distribution of fasting plasma insu-lin, free fatty acids, and glucose concentrations and of homeostasis model assessment of insulin resistance in a representative sample of Quebec children and adoles-cents. Clinical chemistry. 2003;49(4):644-9.
81. Rocco ER, Mory DB, Bergamin CS, Valente F, Miran-da VL, Calegare BF, et al. Optimal cutoff points for body mass index, waist circumference and HOMA-IR to iden-tify a cluster of cardiometabolic abnormalities in nor-mal glucose-tolerant Brazilian children and adolescents. Arquivos brasileiros de endocrinologia e metabologia. 2011;55(8):638-45.
82. Bindler RC, Daratha KB. Relationship of weight sta-tus and cardiometabolic outcomes for adolescents in the TEAMS study. Biological research for nursing. 2012;14(1):65-70.
83. de Onis M, Martinez-Costa C, Nunez F, Nguefack-Tsa-gue G, Montal A, Brines J. Association between WHO cut-offs for childhood overweight and obesity and cardiomet-abolic risk. Public health nutrition. 2013;16(4):625-30.
84. Lambert M, Paradis G, O’Loughlin J, Delvin EE, Hanley JA, Levy E. Insulin resistance syndrome in a representa-tive sample of children and adolescents from Quebec, Canada. International journal of obesity and related met-abolic disorders : journal of the International Association for the Study of Obesity. 2004;28(7):833-41.
85. Lambert M, Delvin EE, Paradis G, O’Loughlin J, Hanley JA, Levy E. C-reactive protein and features of the meta-bolic syndrome in a population-based sample of children and adolescents. Clinical chemistry. 2004;50(10):1762-8.
86. Schlenz H, Intemann T, Wolters M, Gonzalez-Gil EM, Nappo A, Fraterman A, et al. C-reactive protein reference percentiles among pre-adolescent children in Europe based on the IDEFICS study population. International journal of obesity (2005). 2014;38 Suppl 2:S26-31.
87. Hotamisligil GS, Shargill NS, Spiegelman BM. Adi-pose expression of tumor necrosis factor-alpha: di-rect role in obesity-linked insulin resistance. Science. 1993;259(5091):87-91.
88. Lambert M, O’Loughlin J, Delvin EE, Levy E, Chiolero A, Paradis G. Association between insulin, leptin, adipo-nectin and blood pressure in youth. Journal of hyperten-sion. 2009;27(5):1025-32.
89. Kim J, Bhattacharjee R, Kheirandish-Gozal L, Khalyfa A, Sans Capdevila O, Tauman R, et al. Insulin sensitiv-ity, serum lipids, and systemic inflammatory markers in school-aged obese and nonobese children. International journal of pediatrics. 2010;2010:846098.
90. Izadpanah A, Barnard RJ, Almeda AJ, Baldwin GC, Bridges SA, Shellman ER, et al. A short-term diet and exer-cise intervention ameliorates inflammation and markers of metabolic health in overweight/obese children. Ameri-can journal of physiology Endocrinology and metabolism. 2012;303(4):E542-50.
91. Zabaleta J, Velasco-Gonzalez C, Estrada J, Ravussin E, Pelligrino N, Mohler MC, et al. Inverse correlation of

eJIFCC2017Vol28No1pp006-024Page 24
E. Levy, A.K. Saenger, M.W. Steffes, E. DelvinPediatric obesity and cardiometabolic disorders: risk factors and biomarkers
serum inflammatory markers with metabolic param-eters in healthy, Black and White prepubertal youth. International journal of obesity (2005). 2014;38(4): 563-8.
92. Kelishadi R, Hashemi M, Mohammadifard N, Asgary S, Khavarian N. Association of changes in oxidative and proinflammatory states with changes in vascular function
after a lifestyle modification trial among obese children. Clinical chemistry. 2008;54(1):147-53.
93. Galan-Chilet I, Tellez-Plaza M, Guallar E, De Marco G, Lopez-Izquierdo R, Gonzalez-Manzano I, et al. Plasma selenium levels and oxidative stress biomarkers: A gene–environment interaction population-based study. Free Radical Biology and Medicine. 2014;74:229-36.


