142
PERFORMANCE ANALYSIS OF THE NIGERIAN 132KV PRE AND POST REFORM NETWORK.
ENGR. (PROF.) C.O. AHIAKWOAND
ENGR. MARVIN B. SIGALO
ABSTRACTThis paper examines the efforts of the Nigerian Government at revamping the power sector by analyzing the performance of the sector before and after the reform. Specifically, this was done by analyzing the performance of the 132 KV pre-reform and post-reform transmission network by considering the load flow of the post reform network, using the Newton Raphson algorithm. Computer Programs on MATLAB software were developed and data obtained from Afam and Oshogbo Control Centers were used to analyze the performance of the post reform transmission network relative to the pre reform transmission network. The analysis determined the voltage magnitude and phase angles at the buses, the real and reactive powers, power dispatched and received on the lines, as well as power losses. The result of the load flow analysis indicates that the performance of the post power reform network is a lot better than that of the pre reform network as better voltage profiles and lower transmission losses exist.
1.0. INTRODUCTIONThe economic, technological and social advancement of a nation is dependent upon the adequate and constant availability of electric power supply. The capacity of the Nigerian Electricity Supply Industry to provide the needed electric power for the aforementioned advancement of the country has had a lot to be desired of it in post-independence Nigeria as there began to exist an imbalance of demand and supply of electricity in the nation. Various attempts have been made by successive Nigerian governments to tackle this predicament. Amongst these include the unbundling of NEPA and the Power Sector Reform which took place in 2005. The Power Sector Reform was aimed at tackling the myriads of problems that existed in the vertically-integrated and government-owned Power Sector.
The energy deficiency Nigeria is facing is owing to mixed challenges. Specifically, for the 132KV transmission network system, this can be traced to radial lines with no redundancies, obsolete substation equipment which is not serviceable owing to the non-availability of spare parts, low system reliability owing to lack of maintenance of equipment, overloaded transmission lines and substations, inadequate coverage of infrastructure, limited funds for development projects, high technical and non-technical losses, limited training opportunities and community issues during projects execution, administrative problems such as corruption. As a result, the existing 132 KV transmission lines of the Nigerian Electric Power Transmission System are not adequate to transport the power generated from the total installed capacities of all the generating units put together.Owing to the importance of electricity, in Nigeria, gradual attempts have been made at improving upon electricity availability. A major step taken was the Power Sector Reform which was aimed at tackling the myriads of problems existing in the Power Sector. A load flow analysis of the presently available Transmission Network in Nigeria gives an insight
to the performance of the network, and by extension, the effect of the power sector reform. Load flow study entails finding the magnitude and phase angle at each bus , the real and reactive power flowing in each transmission line and the power losses on the transmission lines and in the system as a whole. Load flow analysis is the backbone of power of power system analysis and design.
A lot of research has also been done analyzing the performance of the Nigerian Electric Power Transmission Network, pre- and post- Power Sector Reform, by either using various transmissions lines as case study or by studying the network as a whole. These performance analyses are useful in assessing the status /condition of the network and detecting/identifying the flaws in the network, with the ultimate aim of proffering solutions to the network's weaknesses and/or designing a network that is as void as possible of these weaknesses. Isaac et al (2014) researched on investigating the selection of a suitable slack bus in the Nigerian Power System, using the 330 KV network as a case study.The study was carried out by performing the load flow analysis method of Newton-Raphson iterative algorithms to provide real time result of a power flow simulation using Matlab software package. In comparing the base case result gotten from using the Newton-Raphson iterative with the result from the Gauss-Seidel iterative method, the results were the same but the iterations for convergence were different. The Newton-Raphson converged at 5 iterations while the Gauss-Seidel converged after 174 iterations. This therefore proved that the Newton-Raphson method has faster convergence, which results in lower use of computer memory hence the best method for use in carrying out load flow analysis on large power systems. After much comparison, analysis and observations it is therefore best to select the largest generator bus as the slack bus. Ganiyu et al (2015) developed a model polynomial for the assessment of power system outages on the Nigerian transmission network using curve fitting tools analysis.
2.0. PROBLEM STATEMENTThe transmission of electric power in Nigeria is not efficient and stable. With respect to the 132 KV lines, this is owing to the fact that the existing lines cannot transport the power generated from the total installed capacities of all the generating units put together. This paper was embarked upon to give an insight to the performance of the Nigerian 132KV network using Newton Raphson Algorithm to determine the load flow analysis, in order to guide the electricity expansion needs of the country.
2.1. Performance of the Pre-Power Reform 132 KV Transmission NetworkThe Nigerian 132 KV Transmission Network was weak and stressed. In most parts of the country, poor voltage profiles existed in the network, particularly that of the North. The network was deficit of dispatch and control infrastructure and high transmission losses, yielding it to very frequent system collapse. There was a record of high non-technical losses, a transmission capability of less than 6000 MW, low infrastructure coverage of less than 40% of the country and a low capita of generation of less than 25W. The existing infrastructure included 6,801.49km of 132kV of transmission lines , 32No. of 330/132kV Substations with total installed transformation capacity of 7,688 MVA (equivalent to 6,534.8MW), 105No. of 132/33/11kV Substations with total installed transformation capacity of 9,130MVA (equivalent
Performance Analysis Of The Nigerian 132kv Pre And Post Reform Network.
143

to7,760.5MW). The average available capacity on 330/132kV was 7,364MVA and 8,448MVA on 132/33kV which is 95.8% and 94.1% of Installed capacity respectively. The average transmission loss was 13%.
2.2. Stages of Expansion of the Pre-Power Reform 132 KV Transmission Network.Very little to no restructuring of the Nigerian 132 KV Transmission Network was undertaken Pre-Power Reform. This was as a result of the poor funding to the power sector by the federal government. This is as depicted in figure 2.1. Awosope(2014)shows a picture thatreinforces the fact that funding of the industry was very low or even non-existing between 1983 and 1998. According to him, until the advent of civil rule in 1999, no major development was witnessed in the Industry. At this time, the whole infrastructure has become dilapidated and hence needed to be scrapped and rebuilt. Year 1999 is a significant year in the history of Nigeria due to the transmutation of the nation from military rule to civilian governance.
2.3. Draw-backs in the Pre-Power Reform 132 KV Transmission NetworkPrior to the Power Sector Reform, the Nigerian 132 KV Transmission Network faced a lot of challenges which include the following:radial lines with no redundancies, obsolete substation equipment, overloaded transmission lines and Substations, inadequate coverage of infrastructure, high t infrastructure, high technical and non-technical losses.
3.0. 132 KV POST – POWER REFORM NETWORK3.1. Innovations/ Improvements in the Networki. Improved System Reliability: TCN re-established favorable system reliability
supporting capabilities (spinning reserves and Under Frequency Load Shedding program) that were previously established in 2011 though subsequently lost. These directly contributed to realizing fewer system collapse events than would otherwise have occurred and better frequency control." (Presidential Task Force on Power, 2015). This is as depicted on table below.
Table 1:System Collapse Events – 2010-2014(Presidential Task Force On Power, 2015)
SYSTEM COLLAPSES
YEAR FULL PARTIAL TOTAL
Pre-reform years 28 22 50
2010 23 19 42
2011 13 6 19
2012 15 8 23
2013 22 2 24
2014 9 4 13
144
Nigerian Journal Of Oil And Gas Technology

i. Reduced Transmission Overloading: Table 2.6 below reflects the improvements in the degree of overloading of transformers in the 132 KV post-power reform network.
Table 2:Historical Grid Transformer Peak Overloading(Presidential Task Force On Power, 2015)
TRANSFORMER
PEAK % LOAD
2010 2011 2012 2013 2014
100% + 33 37 25 10 14
95% - 99% 16 23 24 20 20
90% - 94% 28 37 31 24 27
85% - 89% 26 19 18 14 21
i. Network Expansion: From a reinforcement perspective, 2478 MVA of 330/132 kV ,
3212 MVA of 132/33 KV,60 No of 330/132 transformers as well as 97 No. of 132/33 kV
transformers have been added to the grid since after the power sector reform. In addition,
150 MVA of 330/132 kV and 180 MVA of 132/33 kV of failed network transformers have
been replaced.1069 km of 132 kV transmission lines have been erected and three 132 kV
substations built. Table 2.7 illustrates The Grid Reinforcement Time Snapshot :
Table 3:Grid Reinforcement Time Snapshot (Presidential Task Force On Power, 2015)
ITEM Pre power reform 2011 2014
Number of 330/132KV Transformers
32 52 92
Total 330/132KV Capacity(MVA)
7688 8138 10166
Length of 132 KV Transmission Line(KM)
6801.49 6881 7870
Number of 132/33 KV Transformers
195 255 292
Total 132/33 KV Capacity(MVA)
8448 9770 11660
I. Reduced Average Transmission System Loss and Improved Loss Measurement:
Performance Analysis Of The Nigerian 132kv Pre And Post Reform Network.
145

YEAR TRANSMISSION LOSSES % AVERAGE
HIGH LOW
2010 12.43 7.31 9.9
2011 12.45 7.84 12.4
2012 14.34 9.70 12.2
2013 13.16 6.92 9.9
2014 12.90 7.48 9.7
i. Improved Power Quality Delivery and Monitoring: This has been undergone to ensure better frequency management as well as improved voltage. For frequency management, this was achieved by the installation of a power quality-monitoring device at National Control Centre (NCC), gaining the potential of tracking and analyzing system frequency performance. For improved area voltage, the installation of two 50 MVA capacitor banks in Kano was undertaken.
1.1. Performance of the NetworkThe Nigerian 132 KV Pre Power Reform Transmission Network was weak and stressed. In most parts of the country, poor voltage profiles existed in the network, particularly that of the North. The network was deficit of dispatch and control infrastructure and high transmission losses, yielding it to very frequent system collapse. The post reform network is not as weak and stressed owing to reinforcements and expansions it has undergone, however, Nigeria's power sector transmission infrastructure continues to be challenged as it still remains a weak link in the electricity supply chain. Moreover, even with the completion of the extant PHCN and NIPP transmission projects the gap between generation capacity and the capacity of the grid is expected to be disparate. Despite the prevalent funding, TCN recorded the completion of a number of projects ranging from construction of transmission lines, substations at 132 KV levels and transformer reinforcements. The completion of these projects spanning through the years, resulted in achieving added capacities in 1065 KM of 132 KV transmission lines and 5690 MVA transformer capacity. This realization is connected to the recent attainment of the present wheeling capability of the grid of 101088 MW.
2.0. LOAD FLOW STUDYLoad-flow study is a of the flow of electric power in an interconnected numerical analysissystem. It analyzes the power systems in normal steady-state operation.Power-flow or load-flow studies are important for planning future expansion of power systems as well as in determining the best operation of existing systems. The power flow study is an analysis of the system's capability to adequately supply the connected load. The total system
146
Nigerian Journal Of Oil And Gas Technology

losses, as well as individual line losses, also are tabulated. Performing a load flow study on an existing system provides insight and recommendations as to the system operation and optimization of control settings to obtain maximum capacity while minimizing the operating costs. The results of such an analysis are in terms of active power, reactive power, magnitude and phase angle. A power-flow study usually uses simplified notation such as a and one-line diagram per-unit system AC power, and focuses on various aspects of parameters, such as voltages, voltage angles, real power and reactive power. Specifically, the data needed for power flow analysis includes a one line diagram, either a Y or Z (value of series impedance and shunt admittance bus bus
of transmission line are necessary to form Z ) and power input from generator/from bus
interconnection. The principal information obtained from the power-flow study is the magnitude and phase angle of the voltage at each , and the real and reactive power flowing in each line. This chapter busdiscusses the Newton Raphson method in the solution of load flow problems.
3.0. THE CASE STUDY: THE NIGERIAN 132 KV TRANSMISSION NETWORK.The base system introduced consists of an existing Nigerian Electric Power Transmission System in which is contained 132 KV transmission lines. The data collected comprises of the single line diagram of the Nigerian 132 KV Post-Power Reform Network , information on the per unit data of each of the 132KV as well as 330KV /132 KV Line Parameters. These are available in the appendices. The software used for simulation was the Matrix Laboratory (MATLAB) version R2007b.
3.1. Modeling and Calculation MethodsBefore the load flow analysis was embarked upon, an excerpt of the network was modeled with all the generators, loads and transmission lines. The excerpt of the network that was used in the modeling is as shown below.
Figure 1: Schematic Representation of a 5 Bus System from the Nigerian 132KV Network 5.2. Bus Classification1. Slack (swing) bus
Performance Analysis Of The Nigerian 132kv Pre And Post Reform Network.
147
The voltage magnitude is specified at this bus. Further, the voltage phase angle δ is also fixed at othis bus. Generally, it is specified as 0 so that all voltage phase angles are measured with respect
to voltage at this bus. For this reason, the slack bus is also known as the reference bus. All the system losses are supplied by the generation at this bus. Furthermore, the system voltage profile is also influenced by the voltage specified at this bus. Bus 1 (GEREGU GT) was chosen as the Slack/Reference bus.
2. Voltage Controlled Bus or Generator Bus (PV Bus)At a generator bus or voltage controlled bus, the reactive power Q and δ are the values that are g g
not known and to be computed. A voltage controlled bus is any bus in the system where the voltage magnitude can be controlled. The real power developed by a synchronous generator can be varied by changing the prime mover input. This in turn changes the machine rotor axis position with respect to a synchronously rotating or reference axis or a reference bus. In other words, the phase angle of the rotor δis directly related to the real power generated by the machine. The voltage magnitude on the other hand is mainly influenced by the excitation current in the field winding. Thus at the generator bus, the real power generation , P , and the voltage g
magnitude, V , can be specified. Buses 2 (Akaokuta 3) and 3(Dangote GT) were identified as the g
Generator(voltage-controlled) Buses.
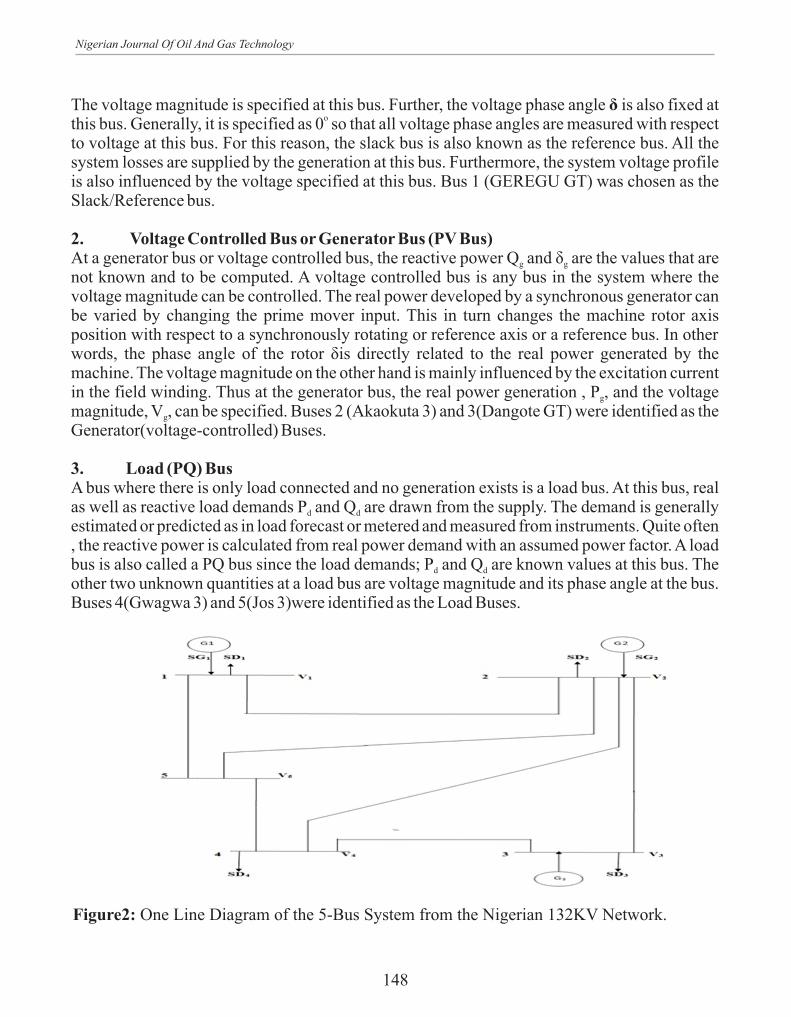
3. Load (PQ) BusA bus where there is only load connected and no generation exists is a load bus. At this bus, real as well as reactive load demands P and Q are drawn from the supply. The demand is generally d d
estimated or predicted as in load forecast or metered and measured from instruments. Quite often , the reactive power is calculated from real power demand with an assumed power factor. A load bus is also called a PQ bus since the load demands; P and Q are known values at this bus. The d d
other two unknown quantities at a load bus are voltage magnitude and its phase angle at the bus. Buses 4(Gwagwa 3) and 5(Jos 3)were identified as the Load Buses.
Figure2: One Line Diagram of the 5-Bus System from the Nigerian 132KV Network.
148
Nigerian Journal Of Oil And Gas Technology

Figure 3: Equivalent Circuit of 5 Bus Systems from the Nigerian 132 KV Network.
Figure 3: Modified Equivalent Circuit (Admittance Network) of the 5 Bus System
1.0. THE LOAD FLOW INPUTSThe load flow inputs for the five bus system in consideration are the bus data and the line data. These are as below.
Performance Analysis Of The Nigerian 132kv Pre And Post Reform Network.
149

Table 5: Bus Data for the System
Bus No Bus
Type
Vsp Theta PGi QGi PLi QLir Qmin Qmax
1 Slack 1.06 0.00 0.00 0.00 0.00 0.00 0.00 0.00
2 PV 1.04 0.00 -350.00 -65.10 150.00 0.85 -60.00 -70.00
3 PV 1.01 0.00 -290.00 53.90 180.00 0.00 0.00 40.00
4 PQ 1.00 0.00 0.00 0.00 80.00 0.00 0.00 0.00
5 PQ 1.00 0.00 0.00 0.00 180.00 0.85 0.00 0.00
Table 6: Line Data for the System
From Bus To Bus R(pu) X(pu)
1 2 0.01938 0.05917
1 5 0.05403 0.22304
2 3 0.04699 0.19797
2 4 0.05811 0.17632
2 5 0.05695 0.17388
3 4 0.06701 0.17103
4 5 0.01335 0.04211
1.0. BUS ADMITTANCE MATRIX FORMATION.Load flow calculations employ either bus admittance matrix or bus impedance matrix. However, for the purpose of this research, the bus admittance matrix is employed because it is simpler to use. With reference to figure 3.x above, all the nodes of the system were numbered from o to 5, where node 0 is the reference/ground node. All generators were replaced by equivalent current sources in parallel with admittance. As well all lines, transformers and loads are replaced by equivalent admittances wherever possible. The elements of the bus admittance matrix are formed as follows : Y = self- admittance or driving point admittance = sum of the admittances ii
150
Nigerian Journal Of Oil And Gas Technology

th th connected to the ith node ; Y = mutual or transfer admittance between the i node and the kik
node = - sum of admittances connected from node i to node k .That is, y = -y . The impedances ik ki
of the loads on the
The general equation for an n-bus network based on Kirchoff’s current law and admittance form is [Ibus] = [Ybus] [Vbus]Where [Ibus] is the node current matrix, [Vbus] is the node voltage matrix and [Ybus] is the bus admittance matrix. 7.2. The load flow problemThe power flow equations are
Performance Analysis Of The Nigerian 132kv Pre And Post Reform Network.
151
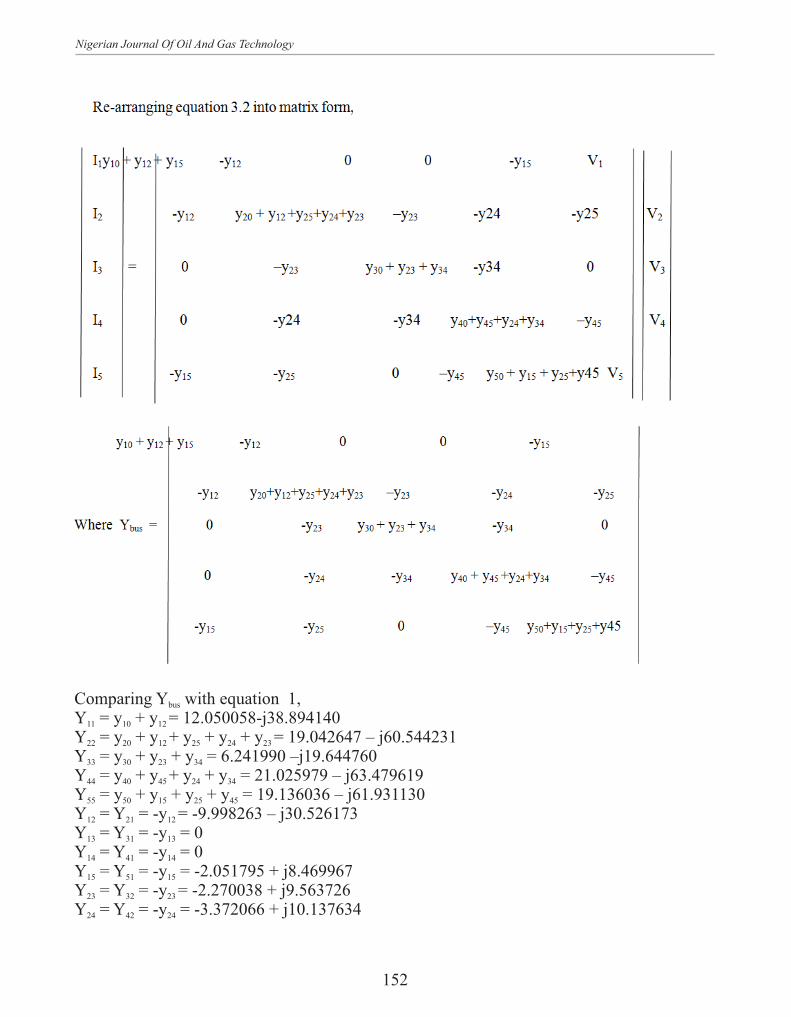
Comparing Y with equation 1, bus
Y = y + y = 12.050058-j38.89414011 10 12
Y = y + y + y + y + y = 19.042647 – j60.54423122 20 12 25 24 23
Y = y + y + y = 6.241990 –j19.64476033 30 23 34
Y = y + y + y + y = 21.025979 – j63.47961944 40 45 24 34
Y = y + y + y + y = 19.136036 – j61.93113055 50 15 25 45
Y = Y = -y = -9.998263 – j30.52617312 21 12
Y = Y = -y = 013 31 13
Y = Y = -y = 014 41 14
Y = Y = -y = -2.051795 + j8.46996715 51 15
Y = Y = -y = -2.270038 + j9.56372623 32 23
Y = Y = -y = -3.372066 + j10.13763424 42 24
152
Nigerian Journal Of Oil And Gas Technology

Y = Y = -y = -3.402279 + j10.38785525 52 25
Y = Y = -y = -3.971951 + j10.13763434 43 34
Y = Y = -y = 035 53 35
Y = Y = -y = -13.681961 + j43.15710845 54 45
Substituting these values into Ybus, we haveY = bus
8.0. THE LOAD FLOW SOLUTIONThe load flow solution method adopted in this thesis is the Newton Raphson method. It is the most robust power flow algorithm used in practice. Specifically, it was the algorithm of choice for this thesis because it has quadratic convergence characteristics, the variables can be expressed in rectangular coordinates as well as polar coordinates, the choice of slack bus is arbitrary , it has a low computation time per iteration and the number of iterations is independent of the size of the system.
The polar coordinate system approach of the Netwon Raphson method was employed as against the rectangular coordinate system because the results of the former have a fewer number of equations and a smaller size of Jacobian, relative to the latter. 8.1. The Polar Coordinates System Approach of the Newton Raphson MethodThe complex power injected by the generating sources into the ith bus of a power system is :
Performance Analysis Of The Nigerian 132kv Pre And Post Reform Network.
153

154
Nigerian Journal Of Oil And Gas Technology

FLOW CHART FOR PERFORMANCE ANALYSIS USING NEWTON RAPHSON METHOD
The results obtained from the Newton Raphson Load Flow Analysis of the 5 bus system, an excerpt from the Nigerian 132 KV network system, are as summarized in the tables 7 and 8 below.
Performance Analysis Of The Nigerian 132kv Pre And Post Reform Network.
155

Table 7: Newton Raphson Load Flow Analysis
Bus
No
V(pu) Angle
Degree
Injection Generation Load
MW
MVar
MW
MVar
MW
MVar
1 1.0600
0.0000
274.433
-11.419
274.433
-11.419
0.000
0.000
2 1.0450
-2.9439
36.600
2.013
58.300 14.713
21.700
12.700
3 1.0100 -9.3222 -188.400 -3.547 -94.200 15.453 94.200 19.000
4 1.0322
-5.9852
-95.600
7.800
-47.800 3.900
47.800
-3.900
5 1.0382
-4.7934
-15.200
-3.200
-7.600
-1.600
7.600
1.600
TOTAL 11.833 -8.353 183.133 21.047 171.300 29.400
1.1. Line Flows and Line LossesThe power flow in the line i-k at bus i is given as :
* *S = P + jQ = V (V * - V *)y + V V yik ik ik i i k ik i i iko
And the power flow in the line i-k at bus k is given as :*S = V (V * - V *)y * + V V yki k k i ik k k kio
The power losses in the (i-k)th line are given by S + S for all line flowsik ki
Table 8: Line flows and Line Losses in the 5 Bus System
From Bus
To Bus
P(MW) Q(MVar) From Bus
To Bus
P(MW) Q(MVar) Line Losses
MW
MVar
1 2 191.018
-3.880
2
1
-187.870
13.491
3.148
9.611
1 5 83.415
3.922
5
1
-81.738 3.000
1.677
6.921
2 3 121.923 14.611 3 2 -118.679 -0.943 3.244 13.6682 4 63.578 -4.053 4 2 -62.499 7.329 1.080 3.2772 5 38.969
-3.996
5
2
-38.569 5.217
0.400
1.222
3 4 -69.721
3.169
4
3
71.321
0.914
1.600
4.083
4 5 -104.422
4.543
5
4
105.107
-2.384
0.684
2.159TOTAL LOSS 11.833 40.941
1.1. DiscussionThe Nigerian 132 KV Pre Power Reform Transmission Network was weak and stressed. In most parts of the country, poor voltage profiles existed in the network, particularly that of the North. The network was deficit of dispatch and control infrastructure and high transmission losses, yielding it to very frequent system collapse.
This thesis deals with the post power reform network. The voltage magnitude results are within the acceptable range. The analysis of the dispatched power as well as the power received on each line shows that the line losses are considerably small. The total loss on the power system is 11.833 MW or 40.941 MVar. Pre power sector reform,. The post reform network is not as weak and stressed owing to reinforcements and expansions it has undergone.
156
Nigerian Journal Of Oil And Gas Technology

2.0. ConclusionThis paperanalyzed the performance of the Nigerian 132 KV Post Power Reform Network in Nigeria by performing a load flow study on the network. The line data as well as the bus data for an excerpt of the network were obtained and used in the load flow analysis. A load flow problem was formulated and the Newton Raphson method was used in solving it because of its reliability and fast rate of convergence as compared to other methods of solving load flow problems. The voltage magnitudes, phase angles, real and reactive powers of the buses in the network were obtained. As well, the line flows and losses along the lines were obtained. The load flow equation obtained was complex and nonlinear. As a result, the Newton Raphson Algorithm was used in performing the analysis of the equation. Programming on Matlab was formulated on the algorithm. The result of the load flow analysis indicates that the performance of the post power reform network is a lot better than that of the pre reform
network as better voltage profiles and lower transmission networks exist.
REFERENCES:Antonio, G.M.E. , Jose, L.M.R. and Jesus R.S. (2004) , Slack Bus Selection to Minimize the System Power
Imbalance in Load Flow Studies, IEEE Trans., pp 19, 987-995.Alumona, T.L. (2014), Overview of Losses and Solutions in Power Transmission Lines, Nnamdi Azikiwe
University/Electrical Engineering, Awka, Nigeria.Awosope, C.A. (2014) , Nigerian Electricity Industry : Issues, Challenges and Solutions, Public Lecture Series,
Volume 3, No 2, ISSN 2006.0327, Media and Corporate Affairs, Ota, Nigeria.pp 38, 40, 42, 45.thDrummer , G.W.A., Tooley, M.H and Winton , R.C.(1997) , An Elementary Guide to Reliability, 5 Edition,
Butterworth-Heinemann Publishers , Oxford. pp 28, 29.Ekpo, A. H. (2009), 'The Global Economic Crisis and the Crises in the Nigerian Economy',
Presidential Address to the 50th Conference of the Nigerian Economic Society, September, Abuja-Nigeria.
Elias, E.O (2006) , Electric power sector and sustenance, environment, Nigerian Society of Engineers Conference andAnnual General Meeting, GATEWAY 2006 , Hinterterworth-Heinemann Publishers, Oxford.
Folurunso, O. and Olowu , T.O. (2014), The Nigerian Power System Till Date : A Review , International Journal of Advanced Foundation and Research in Science and Engineering (IJAFRSE), Volume 1, Issue 5, Impact Factor 1036, Science Central Value : 10.33.pp 27-28
Ganiyu A. A, Ogunmakinde, P, Jimoh, O. (2015) A Model for Assessment of Power System Outages on Nigerian , Transmission Network, The International Journal Of Engineering And Science (IJES),Volume 4, Issue 4, ISSN (e) : 2319-1813.pp 76.
Isaac , S., James,K., Adebayo , D., Ayokunle, A. (2014) , Review of System Collapse Incidences on the 330 KV Nigerian National Grid, International Journal of Engineering Science Intervention,Volume 3, Issue 4.pp 55-59.
Isaac A. S., Okwechime, N.M., and Ademola,A. (2013) , Investigating the Selection of a Suitable Slack Bus: A Case Study of the Multi-Generating Stations of the Nigerian 330-Kv Power System Network. International Journal of Engineering Science Intervention,Volume 1, Issue 2.pp 19,20.
Iseolorunkanmi, O.J. (2014), Electricity Sector Reform in Nigeria, Journal of Sustainable Development Studies, Volume 6, Number 1, ISSN 2201-4268.pp 162, 169.
Odiah R.I (2014), Challenges surrounding power investment in Nigeria: Insights and perspectives from owners and developers, International Journal of Electrical Electronic Engineering Studies, Volume 2, Number 1, European Centre for Research Training and Development UK,pp1-12.
Oke, M.O. and Bamigbola, O.M. (2015), Mathematical Theory and Modelling, ISSN 2224-5804(paper), ISSN 2225-0522(online), Volume 3, Number 7.pp 28, 30-31.
Olatoye , O. S (2014); Maintenance of Electric power system and equipment, Nigerian Society of Engineers, Proceedings of the National Engineering Conference on Engineering Maintenance, pp 44-77.
Oluwatoyin , T.O. (2015), Uninterrupted Supply of Power Electricity in Nigeria, BJAST, Volume 10(5), Article no : BJAST 17043,pp 10,11.
Performance Analysis Of The Nigerian 132kv Pre And Post Reform Network.
157


