PERFORMANCE OF PHILIPPINE AGRICULTURE JANUARY – DECEMBER 2009
HIGHLIGHTS
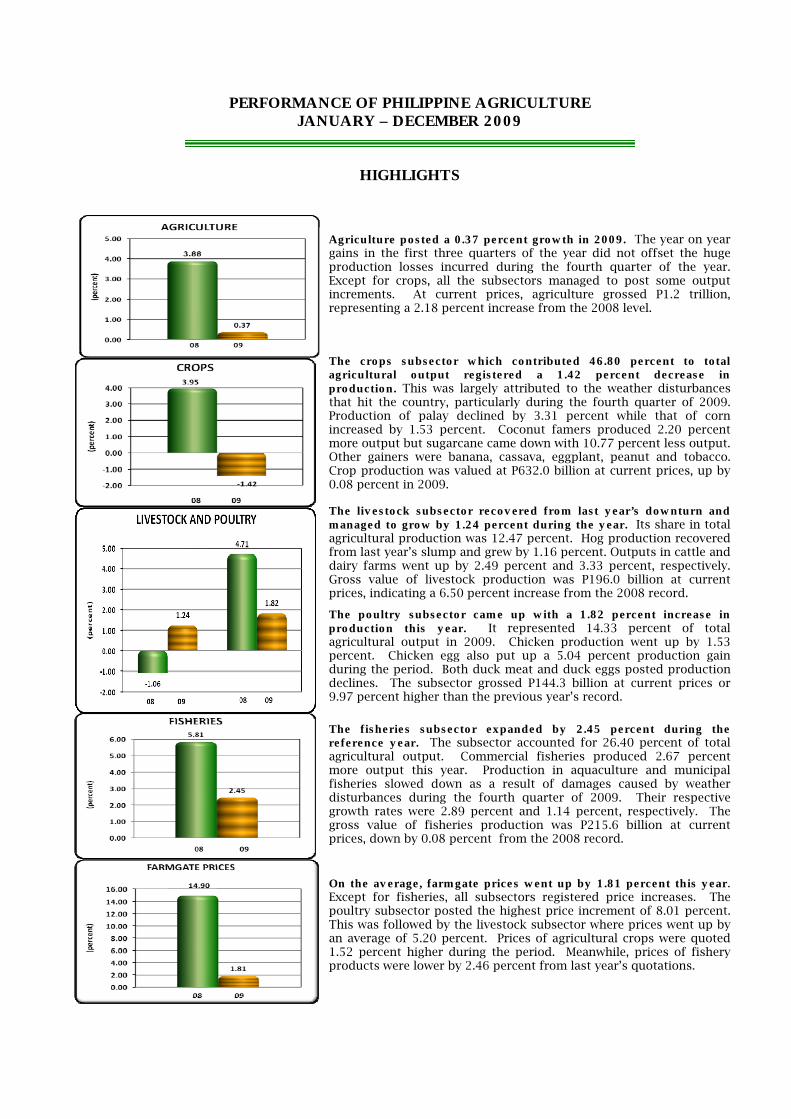
Agriculture posted a 0.37 percent growth in 2009. The year on year gains in the first three quarters of the year did not offset the huge production losses incurred during the fourth quarter of the year. Except for crops, all the subsectors managed to post some output increments. At current prices, agriculture grossed P1.2 trillion, representing a 2.18 percent increase from the 2008 level.
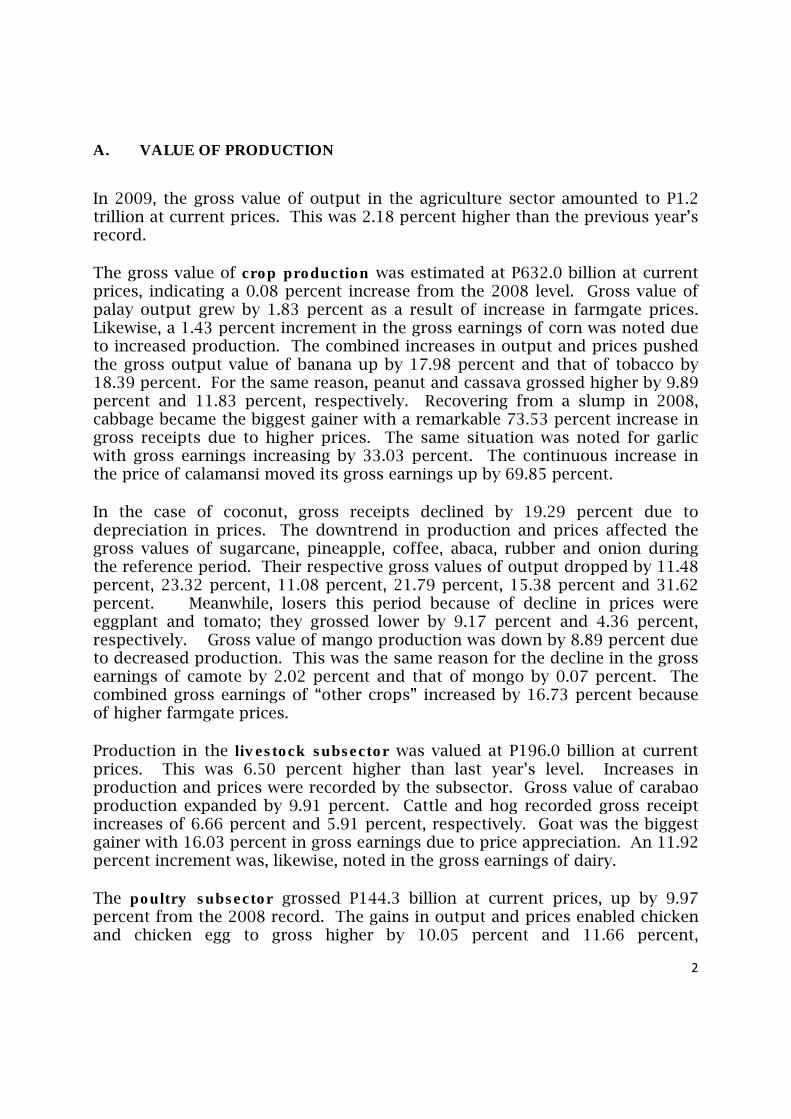
The crops subsector which contributed 46.80 percent to total agricultural output registered a 1.42 percent decrease in production. This was largely attributed to the weather disturbances that hit the country, particularly during the fourth quarter of 2009. Production of palay declined by 3.31 percent while that of corn increased by 1.53 percent. Coconut famers produced 2.20 percent more output but sugarcane came down with 10.77 percent less output. Other gainers were banana, cassava, eggplant, peanut and tobacco. Crop production was valued at P632.0 billion at current prices, up by 0.08 percent in 2009.
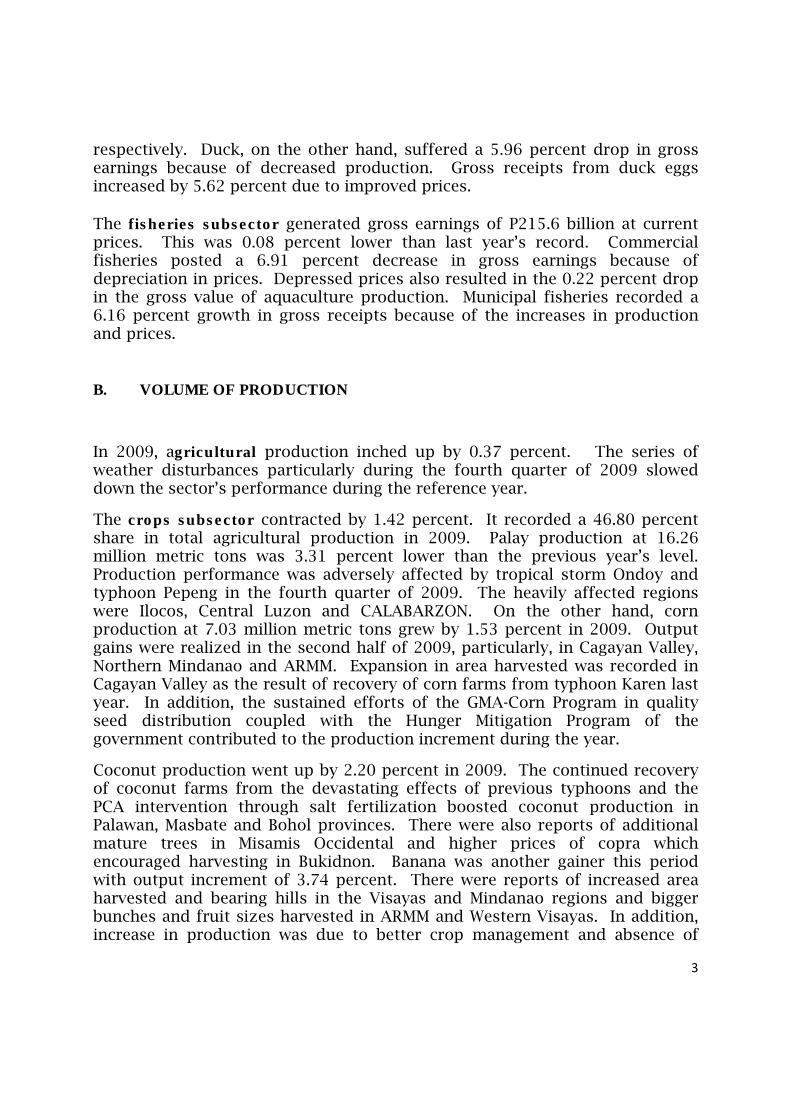
The livestock subsector recovered from last year’s downturn and managed to grow by 1.24 percent during the year. Its share in total agricultural production was 12.47 percent. Hog production recovered from last year’s slump and grew by 1.16 percent. Outputs in cattle and dairy farms went up by 2.49 percent and 3.33 percent, respectively. Gross value of livestock production was P196.0 billion at current prices, indicating a 6.50 percent increase from the 2008 record.
The poultry subsector came up with a 1.82 percent increase in production this year. It represented 14.33 percent of total agricultural output in 2009. Chicken production went up by 1.53 percent. Chicken egg also put up a 5.04 percent production gain during the period. Both duck meat and duck eggs posted production declines. The subsector grossed P144.3 billion at current prices or 9.97 percent higher than the previous year’s record.
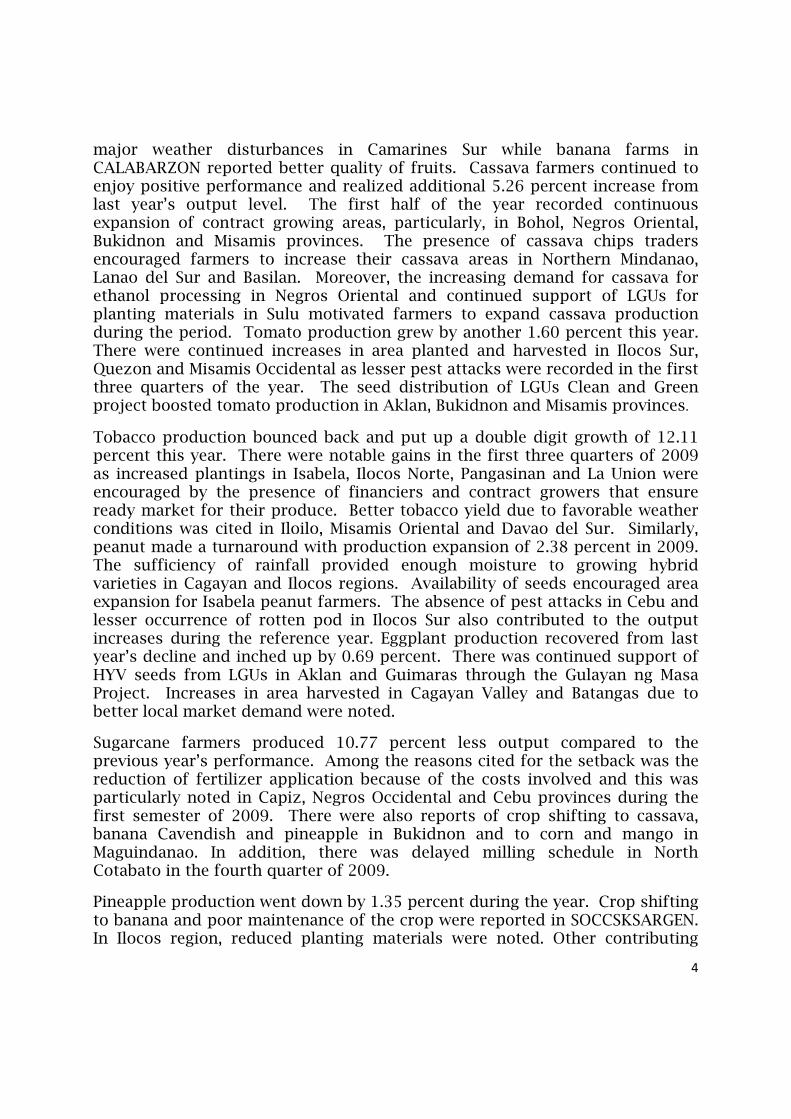
The fisheries subsector expanded by 2.45 percent during the reference year. The subsector accounted for 26.40 percent of total agricultural output. Commercial fisheries produced 2.67 percent more output this year. Production in aquaculture and municipal fisheries slowed down as a result of damages caused by weather disturbances during the fourth quarter of 2009. Their respective growth rates were 2.89 percent and 1.14 percent, respectively. The gross value of fisheries production was P215.6 billion at current prices, down by 0.08 percent from the 2008 record.
On the average, farmgate prices went up by 1.81 percent this year. Except for fisheries, all subsectors registered price increases. The poultry subsector posted the highest price increment of 8.01 percent. This was followed by the livestock subsector where prices went up by an average of 5.20 percent. Prices of agricultural crops were quoted 1.52 percent higher during the period. Meanwhile, prices of fishery products were lower by 2.46 percent from last year’s quotations.
2
A. VALUE OF PRODUCTION
In 2009, the gross value of output in the agriculture sector amounted to P1.2 trillion at current prices. This was 2.18 percent higher than the previous year’s record. The gross value of crop production was estimated at P632.0 billion at current prices, indicating a 0.08 percent increase from the 2008 level. Gross value of palay output grew by 1.83 percent as a result of increase in farmgate prices. Likewise, a 1.43 percent increment in the gross earnings of corn was noted due to increased production. The combined increases in output and prices pushed the gross output value of banana up by 17.98 percent and that of tobacco by 18.39 percent. For the same reason, peanut and cassava grossed higher by 9.89 percent and 11.83 percent, respectively. Recovering from a slump in 2008, cabbage became the biggest gainer with a remarkable 73.53 percent increase in gross receipts due to higher prices. The same situation was noted for garlic with gross earnings increasing by 33.03 percent. The continuous increase in the price of calamansi moved its gross earnings up by 69.85 percent. In the case of coconut, gross receipts declined by 19.29 percent due to depreciation in prices. The downtrend in production and prices affected the gross values of sugarcane, pineapple, coffee, abaca, rubber and onion during the reference period. Their respective gross values of output dropped by 11.48 percent, 23.32 percent, 11.08 percent, 21.79 percent, 15.38 percent and 31.62 percent. Meanwhile, losers this period because of decline in prices were eggplant and tomato; they grossed lower by 9.17 percent and 4.36 percent, respectively. Gross value of mango production was down by 8.89 percent due to decreased production. This was the same reason for the decline in the gross earnings of camote by 2.02 percent and that of mongo by 0.07 percent. The combined gross earnings of “other crops” increased by 16.73 percent because of higher farmgate prices. Production in the livestock subsector was valued at P196.0 billion at current prices. This was 6.50 percent higher than last year’s level. Increases in production and prices were recorded by the subsector. Gross value of carabao production expanded by 9.91 percent. Cattle and hog recorded gross receipt increases of 6.66 percent and 5.91 percent, respectively. Goat was the biggest gainer with 16.03 percent in gross earnings due to price appreciation. An 11.92 percent increment was, likewise, noted in the gross earnings of dairy. The poultry subsector grossed P144.3 billion at current prices, up by 9.97 percent from the 2008 record. The gains in output and prices enabled chicken and chicken egg to gross higher by 10.05 percent and 11.66 percent,
3
respectively. Duck, on the other hand, suffered a 5.96 percent drop in gross earnings because of decreased production. Gross receipts from duck eggs increased by 5.62 percent due to improved prices. The fisheries subsector generated gross earnings of P215.6 billion at current prices. This was 0.08 percent lower than last year’s record. Commercial fisheries posted a 6.91 percent decrease in gross earnings because of depreciation in prices. Depressed prices also resulted in the 0.22 percent drop in the gross value of aquaculture production. Municipal fisheries recorded a 6.16 percent growth in gross receipts because of the increases in production and prices. B. VOLUME OF PRODUCTION
In 2009, agricultural production inched up by 0.37 percent. The series of weather disturbances particularly during the fourth quarter of 2009 slowed down the sector’s performance during the reference year.
The crops subsector contracted by 1.42 percent. It recorded a 46.80 percent share in total agricultural production in 2009. Palay production at 16.26 million metric tons was 3.31 percent lower than the previous year’s level. Production performance was adversely affected by tropical storm Ondoy and typhoon Pepeng in the fourth quarter of 2009. The heavily affected regions were Ilocos, Central Luzon and CALABARZON. On the other hand, corn production at 7.03 million metric tons grew by 1.53 percent in 2009. Output gains were realized in the second half of 2009, particularly, in Cagayan Valley, Northern Mindanao and ARMM. Expansion in area harvested was recorded in Cagayan Valley as the result of recovery of corn farms from typhoon Karen last year. In addition, the sustained efforts of the GMA-Corn Program in quality seed distribution coupled with the Hunger Mitigation Program of the government contributed to the production increment during the year.
Coconut production went up by 2.20 percent in 2009. The continued recovery of coconut farms from the devastating effects of previous typhoons and the PCA intervention through salt fertilization boosted coconut production in Palawan, Masbate and Bohol provinces. There were also reports of additional mature trees in Misamis Occidental and higher prices of copra which encouraged harvesting in Bukidnon. Banana was another gainer this period with output increment of 3.74 percent. There were reports of increased area harvested and bearing hills in the Visayas and Mindanao regions and bigger bunches and fruit sizes harvested in ARMM and Western Visayas. In addition, increase in production was due to better crop management and absence of
4
major weather disturbances in Camarines Sur while banana farms in CALABARZON reported better quality of fruits. Cassava farmers continued to enjoy positive performance and realized additional 5.26 percent increase from last year’s output level. The first half of the year recorded continuous expansion of contract growing areas, particularly, in Bohol, Negros Oriental, Bukidnon and Misamis provinces. The presence of cassava chips traders encouraged farmers to increase their cassava areas in Northern Mindanao, Lanao del Sur and Basilan. Moreover, the increasing demand for cassava for ethanol processing in Negros Oriental and continued support of LGUs for planting materials in Sulu motivated farmers to expand cassava production during the period. Tomato production grew by another 1.60 percent this year. There were continued increases in area planted and harvested in Ilocos Sur, Quezon and Misamis Occidental as lesser pest attacks were recorded in the first three quarters of the year. The seed distribution of LGUs Clean and Green project boosted tomato production in Aklan, Bukidnon and Misamis provinces.
Tobacco production bounced back and put up a double digit growth of 12.11 percent this year. There were notable gains in the first three quarters of 2009 as increased plantings in Isabela, Ilocos Norte, Pangasinan and La Union were encouraged by the presence of financiers and contract growers that ensure ready market for their produce. Better tobacco yield due to favorable weather conditions was cited in Iloilo, Misamis Oriental and Davao del Sur. Similarly, peanut made a turnaround with production expansion of 2.38 percent in 2009. The sufficiency of rainfall provided enough moisture to growing hybrid varieties in Cagayan and Ilocos regions. Availability of seeds encouraged area expansion for Isabela peanut farmers. The absence of pest attacks in Cebu and lesser occurrence of rotten pod in Ilocos Sur also contributed to the output increases during the reference year. Eggplant production recovered from last year’s decline and inched up by 0.69 percent. There was continued support of HYV seeds from LGUs in Aklan and Guimaras through the Gulayan ng Masa Project. Increases in area harvested in Cagayan Valley and Batangas due to better local market demand were noted.
Sugarcane farmers produced 10.77 percent less output compared to the previous year’s performance. Among the reasons cited for the setback was the reduction of fertilizer application because of the costs involved and this was particularly noted in Capiz, Negros Occidental and Cebu provinces during the first semester of 2009. There were also reports of crop shifting to cassava, banana Cavendish and pineapple in Bukidnon and to corn and mango in Maguindanao. In addition, there was delayed milling schedule in North Cotabato in the fourth quarter of 2009.
Pineapple production went down by 1.35 percent during the year. Crop shifting to banana and poor maintenance of the crop were reported in SOCCSKSARGEN. In Ilocos region, reduced planting materials were noted. Other contributing
5
factors to the decline were high cost of inputs in Bicol and smaller fruit sizes in Caraga and Zamboanga Peninsula.
Abaca production dropped by 3.76 percent. The low market demand in Iloilo, Agusan del Norte and Surigao del Sur slowed down harvesting during the period. This was further aggravated by the poor quality of abaca fiber in Bohol that discouraged trading of the commodity. The adverse effects of bunchy tops and mosaic disease in Leyte and Southern Leyte further pulled down abaca production.
Mongo came down with a 6.48 percent production decline. Rains during the second half of 2009 in Davao del Sur, Davao del Norte, Compostela Valley and Maguindanao contributed to lower production. This was also true for mongo production in Ilocos and Cagayan Valley regions as rotten pods were harvested due to heavy rainfall brought by typhoon Pepeng in the last quarter of the year. Garlic production was down by 7.93 percent. There were reports of crop shifting to onion and tomato in Mindoro Occidental and to corn, tobacco and tomato in Ilocos Region as farmers were unable to compete with the low-priced imported garlic in the market. Decrease in area harvested in Isabela and Iloilo was a response to lower market demand and high production cost. Cabbage production in Benguet and Mt. Province registered a 3.21 percent cut because of heavy rainfall and strong winds brought by tropical storm Ondoy and typhoon Pepeng. Rubber production decreased by 0.83 percent as lesser tappings were reported in Agusan del Sur, Compostela Valley and Davao City due to low price. Lower rate of fertilization of rubber farms was reported in Zamboanga del Sur. Reduced number of mature trees was noted in Zamboanga del Norte.
The downtrend in coffee production was manifested by the 1.02 percent decrease in production this year. The prevailing peace and order situation in Sulu and excessive rains during the flowering stage hampered harvesting in coffee farms. In addition, production was affected by the low-buying price of coffee in Caraga provinces. The continuous neglect of coffee farms in Cavite and Davao del Norte was also cited.
Mango production slid further by 12.77 percent during the reference year. In Ilocos region, trees were toppled down by typhoon Emong and flowering of young fruits was aborted because of typhoon Pepeng. Too much rains also adversely affected the mango trees in their flowering stage in Central Luzon, Bicol, Western and Central Visayas and Caraga regions.
Camote production went down by another 2.12 percent this year and this was largely attributed to the weevils and attacks of rats in Agusan del Sur and Surigao del Norte. The continuous rainfall in Leyte, Albay and Caraga provinces was another contributing factor to the setback. The peace and order problems hindered harvesting of camote in Surigao del Sur. Onion farms in Pangasinan
6
were flooded during the vegetative stage in the last quarter of the year and this further pulled down production by 1.45 percent.
Calamansi growers in Mindoro Occidental were affected by continuous rains during the flowering stage in the second half of 2009. Another 3.75 percent decline in production was recorded. Tropical storm Ondoy and typhoon Pepeng also brought damages to calamansi farms in Cagayan Valley and Central Luzon.
The combined production of “other” crops declined by 0.53 percent during the year. Among the items that suffered damage from the weather disturbances during the year were papaya, watermelon and vegetables like cauliflower, pechay, ampalaya, stringbeans, gourd, squash fruit and white potato.
The livestock subsector which accounted for 12.47 percent of total agricultural production produced 1.24 percent more output in 2009. Hog production managed to post a 1.16 percent gain this year. The increment in the number of stocks of fatteners resulted in increased number of animals sold for slaughter in the Visayas and Mindanao regions during the first three quarters of the year. The control of the Porcine Respiratory and Reproductive Syndrome (PRRS) due to vaccination in the Luzon regions resulted in the recovery of farms in the third quarter of 2009.
Carabao production was up by 0.35 percent during the year. The volume of slaughtering in abattoirs in Central Luzon, CALABARZON and the Visayas regions in the first half of 2009 increased in response to higher demand for carabeef when prices of fish and other meat substitutes went up. Cattle production went up by 2.49 percent in 2009. All quarters of the year posted increases in number of slaughtering in abattoirs. Dairy continued to expand as another 3.33 percent output increment was recorded this year.
Goat production declined by 0.81 percent during the year. The first three quarters recorded decreases in the number of animals slaughtered due to lower demand in Ilocos, Western Visayas, Davao and SOCCSKSARGEN regions.
The poultry subsector which shared 14.33 percent in total agricultural production grew by 1.82 percent in 2009. Chicken production was up by 1.53 percent. Increased broiler production in commercial farms in the first half of 2009 was reported in Central Luzon, CALABARZON, Central Visayas and Northern Mindanao. Production of chicken eggs went up by 5.04 percent. Higher inventory of layers and better egg-laying efficiency were observed throughout the year. These were reported in Central Luzon, CALABARZON and Northern Mindanao regions.
Duck production, on the other hand, continued to go down and this year, production slid by 8.35 percent. This was attributed to the lower culling of
7
layers during the first three quarters of the year. In the fourth quarter, floods affected duck producing provinces in CALABARZON which resulted in lesser pasture area for duck raising. Duck egg production recorded another 6.64 percent decline during the year as a result of non-replacement of layer stocks which were damaged during the typhoons.
The fisheries subsector which accounted for 26.40 percent of total agricultural output expanded by 2.45 percent in 2009. Commercial fisheries managed to maintain its positive performance and realized another 2.67 percent increment during the period. In the first two quarters of the year, increased fishing trips were noted due to successive lowering of fuel prices. More unloadings from private landing centers due to high demand from canneries and dried fish retailers in Zamboanga City and Zamboanga del Sur also contributed to the increase. In addition, favorable weather conditions resulted in increased frequency of fishing operations in Western Visayas. More unloadings of tuna species were observed in Sulu and Basilan.
Municipal fisheries production inched up by 1.14 percent during the year. Significant increments were noted in the first quarter and fourth quarter of 2009 as operational costs were lower during the period because of low price of fuel. Another contributing factor was the BFAR intervention on fishing gear and boat distribution to sustenance fishermen in Samar, Palawan and Masbate. Strict enforcement of fishery laws against illegal fishing and encroachment of commercial fishing boats to municipal waters led to bigger volume of catch of sustenance fishermen during the period. Moreover, the species from damaged aquafarms were caught by inland fishermen in Apayao, Ilocos Norte, Pangasinan, Cagayan, Nueva Vizcaya, Nueva Ecija and Rizal in the last quarter of 2009. In the same period, there were BFAR interventions through fingerlings dispersal in Nueva Vizcaya, Pampanga, Camarines Sur, Masbate, Misamis Occidental, Misamis Oriental, Bukidnon and Lanao del Norte.
There was a slowdown in aquaculture but it managed to post production increase of 2.89 percent during the year. This was explained by area expansion, better water quality and lesser mortality from brackishwater species in Pampanga, Tarlac and Antique. Good market demand, proper pond management, good quality tiger prawn and crablets and usage of commercial feeds were cited in Lanao del Norte and Misamis Occidental. Meanwhile, bigger sizes of freshwater pen species and availability of funds to operate were reported in Maguindanao. For seaweeds, favorable weather conditions and availability of locally produced planting materials from BFAR-LGU encouraged seaweed farmers in Palawan, Camarines Norte and Tawi-Tawi to plant more. There was also area expansion in Bohol due to high demand during the period.
8
C. FARMGATE PRICES In 2009, farmgate prices of agricultural commodities increased by an average of 1.81 percent. In the crops subsector, prices went up by an average of 1.52 percent. Palay price sustained its uptrend and recorded a 5.32 percent gain in 2009. In the case of corn, the increase in production and low buying price of yellow corn traders pulled down prices of corn by 0.09 percent. Prices of mango and banana went up by 4.45 and 13.73 percent, respectively. Calamansi price surged by 76.46 percent. Price of cabbage bounced back from last year’s price cut and posted a significant increase of 79.29 percent. Garlic also recovered from last year’s price setback with an increment of 44.49 percent this year. Cassava, mongo and peanut recorded price gains ranging from 6.24 percent to 7.33 percent. The price of camote moved up by 0.11 percent. A 5.60 percent price increase was recorded for tobacco. Coconut price dropped by 21.03 percent. Price of sugarcane was 0.79 percent lower than last year’s level. Coffee price suffered a 10.17 percent cut. Price reductions were recorded for rubber at 14.67 percent and abaca at 18.74 percent. A 22.27 percent decline in price was recorded for pineapple. Prices of tomato, eggplant and onion declined by 5.87 percent, 9.79 percent and 30.62 percent, respectively. Prices in the livestock subsector continued to go up and during the year, there was an average increase of 5.20 percent. Higher prices offered by traders pushed hog prices up by 4.70 percent. Price gains were also noted in cattle at 4.08 percent, carabao at 9.53 percent and goat at 16.97 percent. Dairy price went up by 8.31 percent. The poultry subsector came up with the biggest price appreciation of 8.01 percent. Chicken meat price grew by 8.39 percent. Greater demand from processors was observed in CALABARZON, Central Luzon and Northern Mindanao. Price of chicken eggs was up by 6.31 percent. Prices of duck meat and duck eggs were higher by 2.61 percent and 13.14 percent from last year’s records, respectively. In the fisheries subsector, prices were down by an average of 2.46 percent. Municipal fisheries had an average price increase of 4.98 percent. Commercial fisheries posted an average price cut of 9.34 percent compared to last year’s record. There was increased volume of low-value species like fimbriated sardines and Indian sardines in Zamboanga City and decreased demand for skipjack from canneries in SOCCSKSARGEN because of export slowdown of sardines. In aquaculture, a price reduction of 3.04 percent was observed.
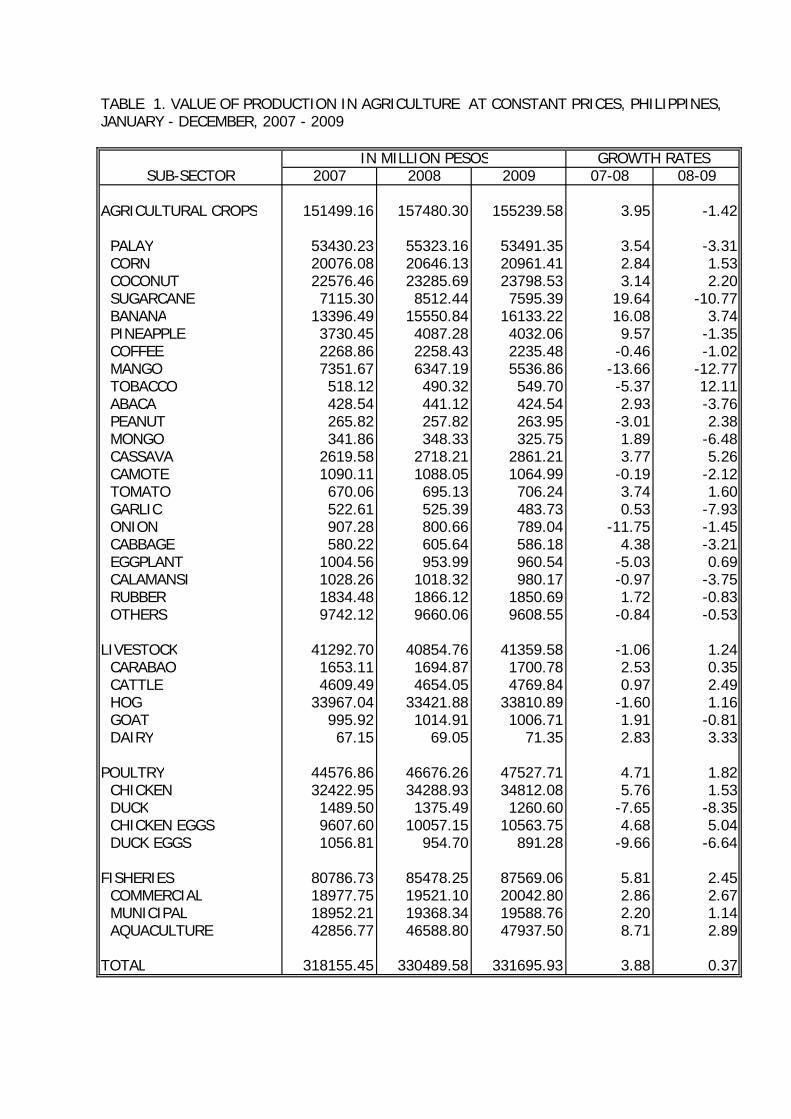
TABLE 1. VALUE OF PRODUCTION IN AGRICULTURE AT CONSTANT PRICES, PHILIPPINES,JANUARY - DECEMBER, 2007 - 2009
IN MILLION PESOS GROWTH RATESSUB-SECTOR 2007 2008 2009 07-08 08-09
AGRICULTURAL CROPS 151499.16 157480.30 155239.58 3.95 -1.42
PALAY 53430.23 55323.16 53491.35 3.54 -3.31 CORN 20076.08 20646.13 20961.41 2.84 1.53 COCONUT 22576.46 23285.69 23798.53 3.14 2.20 SUGARCANE 7115.30 8512.44 7595.39 19.64 -10.77 BANANA 13396.49 15550.84 16133.22 16.08 3.74 PINEAPPLE 3730.45 4087.28 4032.06 9.57 -1.35 COFFEE 2268.86 2258.43 2235.48 -0.46 -1.02 MANGO 7351.67 6347.19 5536.86 -13.66 -12.77 TOBACCO 518.12 490.32 549.70 -5.37 12.11 ABACA 428.54 441.12 424.54 2.93 -3.76 PEANUT 265.82 257.82 263.95 -3.01 2.38 MONGO 341.86 348.33 325.75 1.89 -6.48 CASSAVA 2619.58 2718.21 2861.21 3.77 5.26 CAMOTE 1090.11 1088.05 1064.99 -0.19 -2.12 TOMATO 670.06 695.13 706.24 3.74 1.60 GARLIC 522.61 525.39 483.73 0.53 -7.93 ONION 907.28 800.66 789.04 -11.75 -1.45 CABBAGE 580.22 605.64 586.18 4.38 -3.21 EGGPLANT 1004.56 953.99 960.54 -5.03 0.69 CALAMANSI 1028.26 1018.32 980.17 -0.97 -3.75 RUBBER 1834.48 1866.12 1850.69 1.72 -0.83 OTHERS 9742.12 9660.06 9608.55 -0.84 -0.53
LIVESTOCK 41292.70 40854.76 41359.58 -1.06 1.24 CARABAO 1653.11 1694.87 1700.78 2.53 0.35 CATTLE 4609.49 4654.05 4769.84 0.97 2.49 HOG 33967.04 33421.88 33810.89 -1.60 1.16 GOAT 995.92 1014.91 1006.71 1.91 -0.81 DAIRY 67.15 69.05 71.35 2.83 3.33
POULTRY 44576.86 46676.26 47527.71 4.71 1.82 CHICKEN 32422.95 34288.93 34812.08 5.76 1.53 DUCK 1489.50 1375.49 1260.60 -7.65 -8.35 CHICKEN EGGS 9607.60 10057.15 10563.75 4.68 5.04 DUCK EGGS 1056.81 954.70 891.28 -9.66 -6.64
FISHERIES 80786.73 85478.25 87569.06 5.81 2.45 COMMERCIAL 18977.75 19521.10 20042.80 2.86 2.67 MUNICIPAL 18952.21 19368.34 19588.76 2.20 1.14 AQUACULTURE 42856.77 46588.80 47937.50 8.71 2.89
TOTAL 318155.45 330489.58 331695.93 3.88 0.37
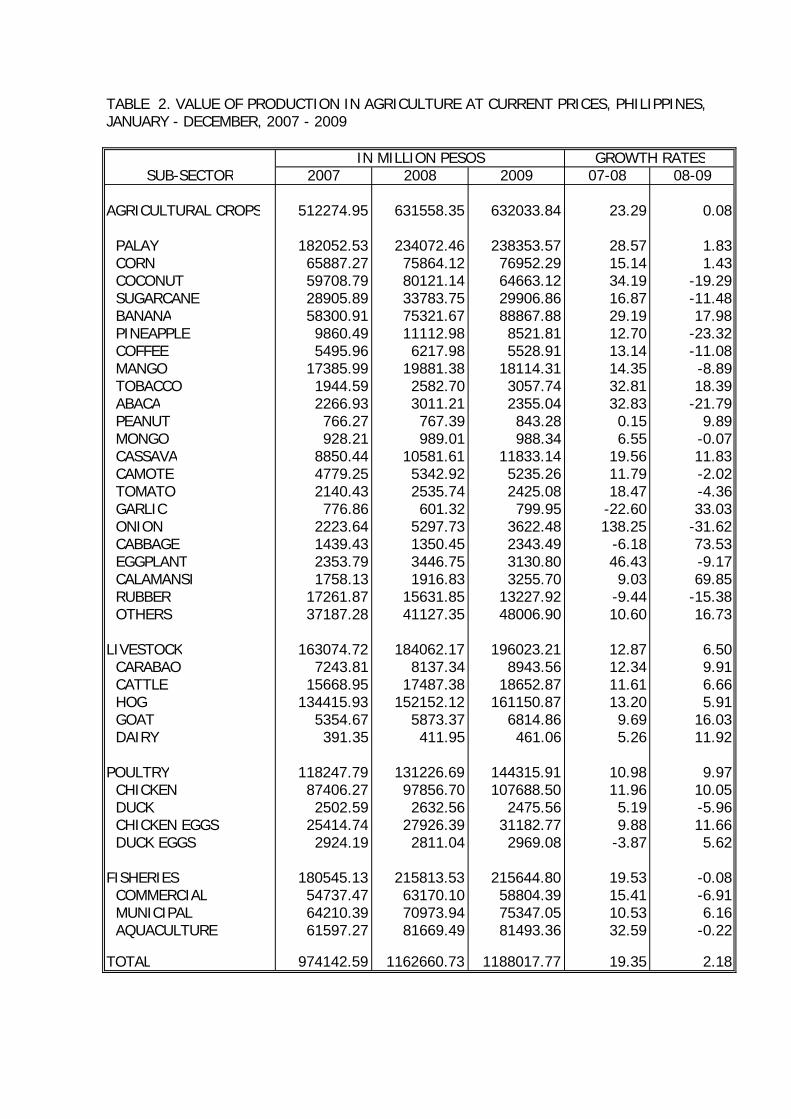
TABLE 2. VALUE OF PRODUCTION IN AGRICULTURE AT CURRENT PRICES, PHILIPPINES,JANUARY - DECEMBER, 2007 - 2009
IN MILLION PESOS GROWTH RATESSUB-SECTOR 2007 2008 2009 07-08 08-09
AGRICULTURAL CROPS 512274.95 631558.35 632033.84 23.29 0.08
PALAY 182052.53 234072.46 238353.57 28.57 1.83 CORN 65887.27 75864.12 76952.29 15.14 1.43 COCONUT 59708.79 80121.14 64663.12 34.19 -19.29 SUGARCANE 28905.89 33783.75 29906.86 16.87 -11.48 BANANA 58300.91 75321.67 88867.88 29.19 17.98 PINEAPPLE 9860.49 11112.98 8521.81 12.70 -23.32 COFFEE 5495.96 6217.98 5528.91 13.14 -11.08 MANGO 17385.99 19881.38 18114.31 14.35 -8.89 TOBACCO 1944.59 2582.70 3057.74 32.81 18.39 ABACA 2266.93 3011.21 2355.04 32.83 -21.79 PEANUT 766.27 767.39 843.28 0.15 9.89 MONGO 928.21 989.01 988.34 6.55 -0.07 CASSAVA 8850.44 10581.61 11833.14 19.56 11.83 CAMOTE 4779.25 5342.92 5235.26 11.79 -2.02 TOMATO 2140.43 2535.74 2425.08 18.47 -4.36 GARLIC 776.86 601.32 799.95 -22.60 33.03 ONION 2223.64 5297.73 3622.48 138.25 -31.62 CABBAGE 1439.43 1350.45 2343.49 -6.18 73.53 EGGPLANT 2353.79 3446.75 3130.80 46.43 -9.17 CALAMANSI 1758.13 1916.83 3255.70 9.03 69.85 RUBBER 17261.87 15631.85 13227.92 -9.44 -15.38 OTHERS 37187.28 41127.35 48006.90 10.60 16.73
LIVESTOCK 163074.72 184062.17 196023.21 12.87 6.50 CARABAO 7243.81 8137.34 8943.56 12.34 9.91 CATTLE 15668.95 17487.38 18652.87 11.61 6.66 HOG 134415.93 152152.12 161150.87 13.20 5.91 GOAT 5354.67 5873.37 6814.86 9.69 16.03 DAIRY 391.35 411.95 461.06 5.26 11.92
POULTRY 118247.79 131226.69 144315.91 10.98 9.97 CHICKEN 87406.27 97856.70 107688.50 11.96 10.05 DUCK 2502.59 2632.56 2475.56 5.19 -5.96 CHICKEN EGGS 25414.74 27926.39 31182.77 9.88 11.66 DUCK EGGS 2924.19 2811.04 2969.08 -3.87 5.62
FISHERIES 180545.13 215813.53 215644.80 19.53 -0.08 COMMERCIAL 54737.47 63170.10 58804.39 15.41 -6.91 MUNICIPAL 64210.39 70973.94 75347.05 10.53 6.16 AQUACULTURE 61597.27 81669.49 81493.36 32.59 -0.22
TOTAL 974142.59 1162660.73 1188017.77 19.35 2.18
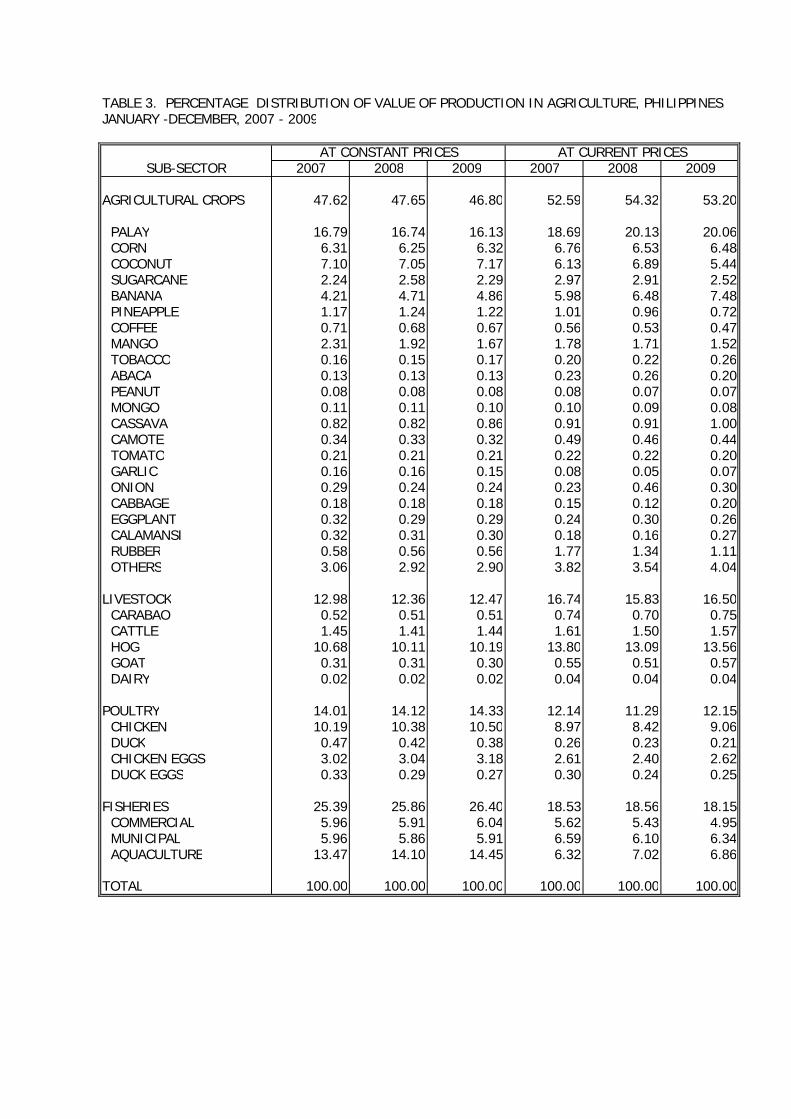
TABLE 3. PERCENTAGE DISTRIBUTION OF VALUE OF PRODUCTION IN AGRICULTURE, PHILIPPINES,JANUARY -DECEMBER, 2007 - 2009
AT CONSTANT PRICES AT CURRENT PRICESSUB-SECTOR 2007 2008 2009 2007 2008 2009
AGRICULTURAL CROPS 47.62 47.65 46.80 52.59 54.32 53.20
PALAY 16.79 16.74 16.13 18.69 20.13 20.06 CORN 6.31 6.25 6.32 6.76 6.53 6.48 COCONUT 7.10 7.05 7.17 6.13 6.89 5.44 SUGARCANE 2.24 2.58 2.29 2.97 2.91 2.52 BANANA 4.21 4.71 4.86 5.98 6.48 7.48 PINEAPPLE 1.17 1.24 1.22 1.01 0.96 0.72 COFFEE 0.71 0.68 0.67 0.56 0.53 0.47 MANGO 2.31 1.92 1.67 1.78 1.71 1.52 TOBACCO 0.16 0.15 0.17 0.20 0.22 0.26 ABACA 0.13 0.13 0.13 0.23 0.26 0.20 PEANUT 0.08 0.08 0.08 0.08 0.07 0.07 MONGO 0.11 0.11 0.10 0.10 0.09 0.08 CASSAVA 0.82 0.82 0.86 0.91 0.91 1.00 CAMOTE 0.34 0.33 0.32 0.49 0.46 0.44 TOMATO 0.21 0.21 0.21 0.22 0.22 0.20 GARLIC 0.16 0.16 0.15 0.08 0.05 0.07 ONION 0.29 0.24 0.24 0.23 0.46 0.30 CABBAGE 0.18 0.18 0.18 0.15 0.12 0.20 EGGPLANT 0.32 0.29 0.29 0.24 0.30 0.26 CALAMANSI 0.32 0.31 0.30 0.18 0.16 0.27 RUBBER 0.58 0.56 0.56 1.77 1.34 1.11 OTHERS 3.06 2.92 2.90 3.82 3.54 4.04
LIVESTOCK 12.98 12.36 12.47 16.74 15.83 16.50 CARABAO 0.52 0.51 0.51 0.74 0.70 0.75 CATTLE 1.45 1.41 1.44 1.61 1.50 1.57 HOG 10.68 10.11 10.19 13.80 13.09 13.56 GOAT 0.31 0.31 0.30 0.55 0.51 0.57 DAIRY 0.02 0.02 0.02 0.04 0.04 0.04
POULTRY 14.01 14.12 14.33 12.14 11.29 12.15 CHICKEN 10.19 10.38 10.50 8.97 8.42 9.06 DUCK 0.47 0.42 0.38 0.26 0.23 0.21 CHICKEN EGGS 3.02 3.04 3.18 2.61 2.40 2.62 DUCK EGGS 0.33 0.29 0.27 0.30 0.24 0.25
FISHERIES 25.39 25.86 26.40 18.53 18.56 18.15 COMMERCIAL 5.96 5.91 6.04 5.62 5.43 4.95 MUNICIPAL 5.96 5.86 5.91 6.59 6.10 6.34 AQUACULTURE 13.47 14.10 14.45 6.32 7.02 6.86
TOTAL 100.00 100.00 100.00 100.00 100.00 100.00
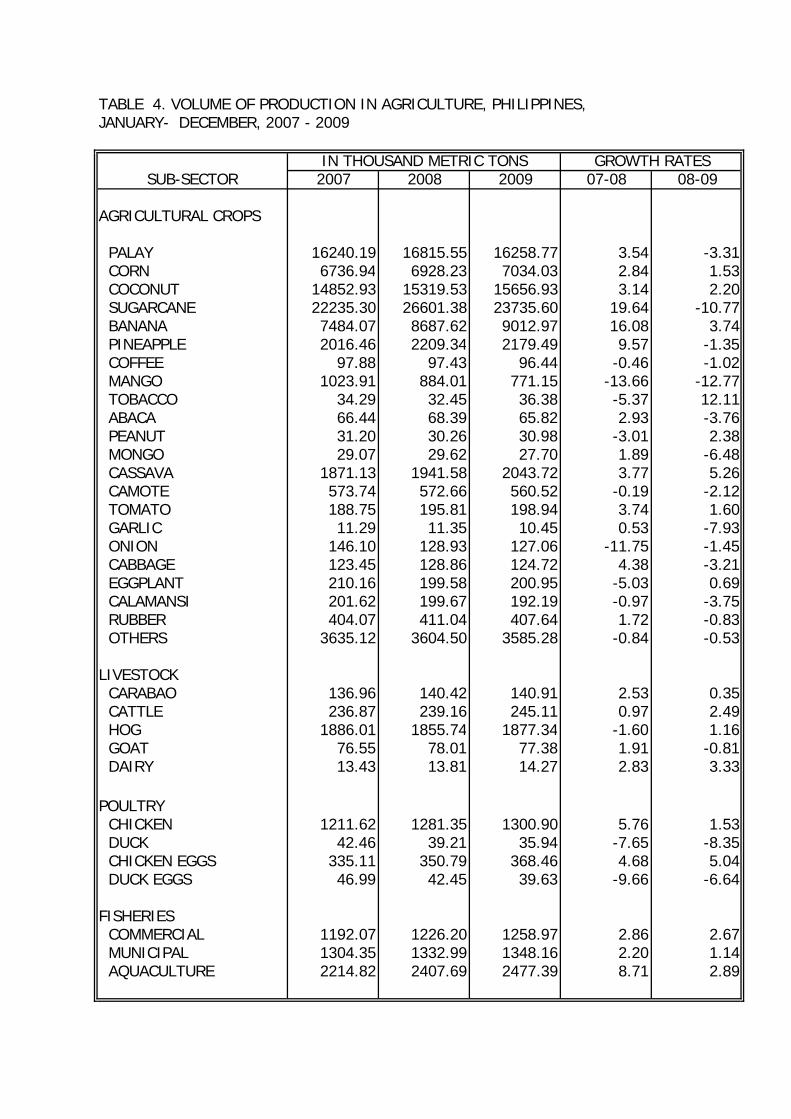
TABLE 4. VOLUME OF PRODUCTION IN AGRICULTURE, PHILIPPINES,JANUARY- DECEMBER, 2007 - 2009
IN THOUSAND METRIC TONS GROWTH RATESSUB-SECTOR 2007 2008 2009 07-08 08-09
AGRICULTURAL CROPS
PALAY 16240.19 16815.55 16258.77 3.54 -3.31 CORN 6736.94 6928.23 7034.03 2.84 1.53 COCONUT 14852.93 15319.53 15656.93 3.14 2.20 SUGARCANE 22235.30 26601.38 23735.60 19.64 -10.77 BANANA 7484.07 8687.62 9012.97 16.08 3.74 PINEAPPLE 2016.46 2209.34 2179.49 9.57 -1.35 COFFEE 97.88 97.43 96.44 -0.46 -1.02 MANGO 1023.91 884.01 771.15 -13.66 -12.77 TOBACCO 34.29 32.45 36.38 -5.37 12.11 ABACA 66.44 68.39 65.82 2.93 -3.76 PEANUT 31.20 30.26 30.98 -3.01 2.38 MONGO 29.07 29.62 27.70 1.89 -6.48 CASSAVA 1871.13 1941.58 2043.72 3.77 5.26 CAMOTE 573.74 572.66 560.52 -0.19 -2.12 TOMATO 188.75 195.81 198.94 3.74 1.60 GARLIC 11.29 11.35 10.45 0.53 -7.93 ONION 146.10 128.93 127.06 -11.75 -1.45 CABBAGE 123.45 128.86 124.72 4.38 -3.21 EGGPLANT 210.16 199.58 200.95 -5.03 0.69 CALAMANSI 201.62 199.67 192.19 -0.97 -3.75 RUBBER 404.07 411.04 407.64 1.72 -0.83 OTHERS 3635.12 3604.50 3585.28 -0.84 -0.53
LIVESTOCK CARABAO 136.96 140.42 140.91 2.53 0.35 CATTLE 236.87 239.16 245.11 0.97 2.49 HOG 1886.01 1855.74 1877.34 -1.60 1.16 GOAT 76.55 78.01 77.38 1.91 -0.81 DAIRY 13.43 13.81 14.27 2.83 3.33
POULTRY CHICKEN 1211.62 1281.35 1300.90 5.76 1.53 DUCK 42.46 39.21 35.94 -7.65 -8.35 CHICKEN EGGS 335.11 350.79 368.46 4.68 5.04 DUCK EGGS 46.99 42.45 39.63 -9.66 -6.64
FISHERIES COMMERCIAL 1192.07 1226.20 1258.97 2.86 2.67 MUNICIPAL 1304.35 1332.99 1348.16 2.20 1.14 AQUACULTURE 2214.82 2407.69 2477.39 8.71 2.89
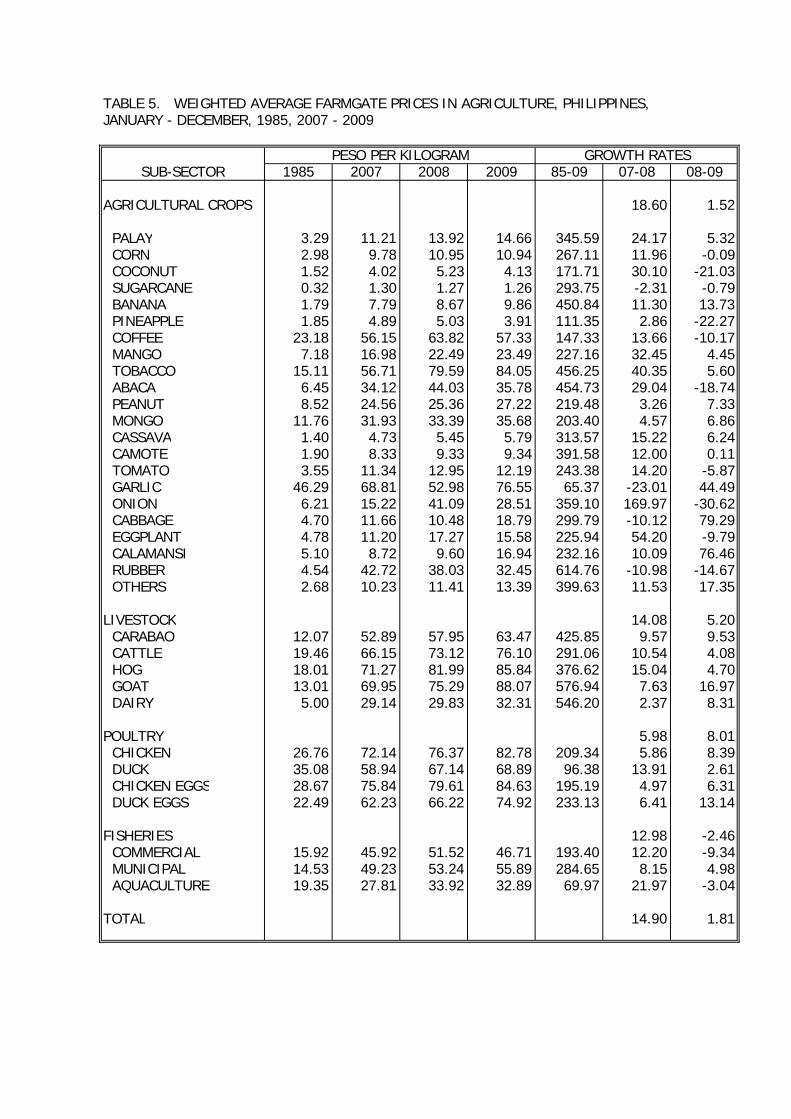
TABLE 5. WEIGHTED AVERAGE FARMGATE PRICES IN AGRICULTURE, PHILIPPINES,JANUARY - DECEMBER, 1985, 2007 - 2009
PESO PER KILOGRAM GROWTH RATESSUB-SECTOR 1985 2007 2008 2009 85-09 07-08 08-09
AGRICULTURAL CROPS 18.60 1.52
PALAY 3.29 11.21 13.92 14.66 345.59 24.17 5.32 CORN 2.98 9.78 10.95 10.94 267.11 11.96 -0.09 COCONUT 1.52 4.02 5.23 4.13 171.71 30.10 -21.03 SUGARCANE 0.32 1.30 1.27 1.26 293.75 -2.31 -0.79 BANANA 1.79 7.79 8.67 9.86 450.84 11.30 13.73 PINEAPPLE 1.85 4.89 5.03 3.91 111.35 2.86 -22.27 COFFEE 23.18 56.15 63.82 57.33 147.33 13.66 -10.17 MANGO 7.18 16.98 22.49 23.49 227.16 32.45 4.45 TOBACCO 15.11 56.71 79.59 84.05 456.25 40.35 5.60 ABACA 6.45 34.12 44.03 35.78 454.73 29.04 -18.74 PEANUT 8.52 24.56 25.36 27.22 219.48 3.26 7.33 MONGO 11.76 31.93 33.39 35.68 203.40 4.57 6.86 CASSAVA 1.40 4.73 5.45 5.79 313.57 15.22 6.24 CAMOTE 1.90 8.33 9.33 9.34 391.58 12.00 0.11 TOMATO 3.55 11.34 12.95 12.19 243.38 14.20 -5.87 GARLIC 46.29 68.81 52.98 76.55 65.37 -23.01 44.49 ONION 6.21 15.22 41.09 28.51 359.10 169.97 -30.62 CABBAGE 4.70 11.66 10.48 18.79 299.79 -10.12 79.29 EGGPLANT 4.78 11.20 17.27 15.58 225.94 54.20 -9.79 CALAMANSI 5.10 8.72 9.60 16.94 232.16 10.09 76.46 RUBBER 4.54 42.72 38.03 32.45 614.76 -10.98 -14.67 OTHERS 2.68 10.23 11.41 13.39 399.63 11.53 17.35
LIVESTOCK 14.08 5.20 CARABAO 12.07 52.89 57.95 63.47 425.85 9.57 9.53 CATTLE 19.46 66.15 73.12 76.10 291.06 10.54 4.08 HOG 18.01 71.27 81.99 85.84 376.62 15.04 4.70 GOAT 13.01 69.95 75.29 88.07 576.94 7.63 16.97 DAIRY 5.00 29.14 29.83 32.31 546.20 2.37 8.31
POULTRY 5.98 8.01 CHICKEN 26.76 72.14 76.37 82.78 209.34 5.86 8.39 DUCK 35.08 58.94 67.14 68.89 96.38 13.91 2.61 CHICKEN EGGS 28.67 75.84 79.61 84.63 195.19 4.97 6.31 DUCK EGGS 22.49 62.23 66.22 74.92 233.13 6.41 13.14
FISHERIES 12.98 -2.46 COMMERCIAL 15.92 45.92 51.52 46.71 193.40 12.20 -9.34 MUNICIPAL 14.53 49.23 53.24 55.89 284.65 8.15 4.98 AQUACULTURE 19.35 27.81 33.92 32.89 69.97 21.97 -3.04
TOTAL 14.90 1.81


