13Performance Tuning:Tools and Utilities
13.1 Introduction
In the previous chapter we discussed backup and recovery. We discussed
why backup was one of the critical parts of any Information Technology
implementation. Hardware redundancy provides availability to the
computer system by making hardware components available as backup
when the main components fail. In the case of data that is stored on the
various hardware devices, such as operating system and database files,
copies of these devices are required to be maintained at remote locations.
When the main device fails, the data could be restored from these remote
copies. We discussed various backup methods, hot, cold, and backups
using RMAN. RMAN provides a more real-time backup method where
backups could be performed while the database is operational without
requiring any part of the database to be down or unusable.
We also looked at the various scenarios when a database, instance,
node, and memory structures could fail, how during these various failure
situations the various recovery methods are applied, and how Oracle
performs the recovery.
Backup is important; equally important is the performance of the
database system because there would no requirement for a backup system
if the current database system is not usable because of its poor perform-
ance. User satisfaction is critical to the success of the enterprise system. On
slowly performing systems, user satisfaction is seldom achievable.
Performance tuning is a very wide subject. There are several approaches
to tuning a system. Tuning could be approached artistically like a violinist
who tightens the strings to get the required sound, or where the
515

performance engineer could make changes to the system by trying to
improve the performance by trial and error. On the other hand, the
performance engineer or DBA could take a more scientific approach to
tuning, where he or she would collect statistics:
n From areas of the application that are performing slowly.
n During various times of the day when more users are using the system.
n From heavily used functional areas of the application, etc.
Based on the data collected, the database performance engineer could
take a more methodical approach to tuning the system. A methodical
approach based on data and evidence is a better method of problem
solving, more like a criminal investigation officer. Analysis should be
backed by evidence. In this case, the collected data would help to
understand the reasons for the slowness or poor performance.
Every reason should be backed by data and a scientific approach
should be taken to tune the system, because there is a reason why a system
is slow. Slow performance could be due to bad configuration, bad code,
bad hardware, bad eyes, or bad anything. Unless there is foolproof
evidence of why it is slow, no scientific approach to finding the root cause
of the problem is possible. The old ancestral methodology that ‘‘tuning
a computer system is an art’’ is not completely true, because tuning is not
a hit-or-miss situation; it is to be approached in a scientific manner with
supporting data.
Performance tuning will be covered in this and the next two chapters.
In this chapter, we will look at the various tools for Oracle database
tuning, its implementation and configuration and in the subsequent two
chapters we will go into the specifics of tuning the database and overall
tuning of a RAC system.
13.2 UTLBSTAT/UTLESTAT
The UTLBSTAT/UTLESTAT scripts are designed to provide a summary
of Oracle activity over a reasonable period of time (>10minutes).
UTLBSTAT creates a snapshot of some of the internal Oracle dynamic
performance views (V$ views). UTLESTAT creates a second snapshot of
these views and reports on the differences between the two snapshots to
a file called report.txt.
The UTLBSTAT/UTLESTAT scripts are shipped as standard with all
Oracle releases. In Version 8.1.6 there is a new tool called STATSPACK
516 13.2 UTLBSTAT/UTLESTAT
which has improved functionality over what UTLBSTAT/UTLESTAT offer.
Using STATSPACK you can collect more statistical information and store
the performance statistics data permanently in Oracle tables enabling
snapshot reporting.
13.3 STATSPACK
Oracle officially introduced a new utility for capturing performance data
in Oracle Version 8.1.6 called STATSPACK. STATSPACK is a successor
to the UTLBSTAT/UTLESTAT processes and works on a similar concept of
capturing snapshots of the various performance views and comparing
them against previous snapshots. UTLBSTAT/UTLESTAT capture statistics
into temporary tables at the beginning, and after the UTLESTAT process
reports on the differences between the two snapshots in the report.txt
file, it deletes the snapshot data. STATSPACK does not delete the snapshot
collection, thus providing access to historical information.
STATSPACK fundamentally differs from UTLBSTAT/UTLESTAT
tuning scripts by collecting more information, and also by storing the
performance statistics data permanently in Oracle tables, which can later
be used for reporting and analysis. The data collected can be analyzed
using the report provided, which includes an ‘‘instance health and load’’
summary page, high-resource SQL statements, as well as the traditional
wait events and initialization parameters.
Permanent tables owned by PERFSTAT (a user created by the
STATSPACK utility) store performance statistics. Instead of creating/
dropping tables each time, data is inserted into the pre-existing tables. This
makes historical data comparisons easier. STATSPACK also separates the
data collection from the report generation. Data is collected when a
‘‘snapshot’’ is taken; viewing the data collected is in the hands of the
performance engineer when he/she runs the script to generate the
performance report.
There is a fundamental difference between the ways the two utilities
compute certain information. For example, the STATSPACK utility
increments a transaction counter on a commit or a rollback operation to
calculate the number of transactions:
’user commits’ þ ’user rollbacks’
UTLBSTAT/UTLESTAT considers a transaction to complete with a
commit only, and so assumes that transactions ¼ ‘‘user commits.’’ For this
reason, comparing per transaction statistics between STATSPACK and
13.3 STATSPACK 517
Chapter13
UTLBSTAT/UTLESTAT may result in significantly different transaction
ratios.
With STATSPACK, Oracle separated the data collection phase from the
reporting phase to allow for greater flexibility to establish performance
baselines as well as to conduct trend reporting. Apart from this basic
enhancement, STATSPACK provides visibility into various areas of
database performance that is not provided by the UTLBSTAT/UTLESTAT
utility. The reporting capability provides comparative views between two
snapshot periods, and provides a high-level summary page indicating the
overall health of the database for the given snapshot period followed by
details on the performance characteristics.
Over the various releases of Oracle, the STATSPACK report has been
considerably enhanced, providing even greater detail of information and
insight to the actual performance problem.
13.3.1 Installing STATSPACK
With Oracle providing all the required scripts, STATSPACK installation
has been made an easy task. All scripts are located in the ORACLE_HOME/
rdbms/admin directory and the scripts are created when Oracle is
installed on the server. STATSPACK scripts can be identified easily as they
are prefixed with sp*.sql.
Prerequisites
Before the actual installation process, it is necessary to ensure that the
basic requirements of installation have been identified and verified.
It should be ensured that the STATSPACK scripts are available in the
appropriate directories:
n On a Unix platform, use the following command:
ls -ltr $ORACLE_HOME/rdbms/admin/sp*.sql
n On a Windows platform they should be available in a similar
location at
%ORACLE_HOME/rdbms/admin/sp*.sql
As we have discussed earlier, the STATSPACK captures snapshots of
performance statistics and stores them in permanent tables. Hence
considerable effort should be provided in sizing the appropriate
tablespaces based on the period of time that the data should be retained
for historical purposes. For easy maintenance, it would be advisable to
518 13.3 STATSPACK

create tablespaces, to allow dropping and re-creation without affecting
regular business data.
SQL>SPACK_DATA_P001create tablespace SPACK_DATA_P001 datafile’/dev/vx/rdsk/oraracdg/partition_500m1a’ size 450M
extent management local uniform size 1Msegment space management auto;
During the process of gathering these snapshots and during subsequent
reporting, Oracle performs a considerable number of sort operations.
Based on the intervals at which the various snapshots are captured and
how busy the system has been during this period, the amount of sort
activity could be very high. In order to isolate the sort activity performed
by STATSPACK from the sort activity performed by the regular
application, it is advisable to create a separate TEMP tablespace
exclusively for STATSPACK:
SQL>SPACK_TEMP_P001
Understanding the STATSPACK scripts
STATSPACK scripts are modularized. The main driver script called
spcreate.sql controls the installation of the STATSPACK utility and
this script calls the spcusr.sql, spctab.sql, and spcpkg.sql
scripts. In order to report any errors during the installation, these scripts
generate .lis files, which are verified to ensure that the installation has
completed successfully.
Figure 13.1 illustrates the script interface and their dependency matrix.
While the straight lines indicate how each of the scripts are called, the
oFigure 13.1
STATSPACK
scripts.
13.3 STATSPACK 519
Chapter13
numbers indicate the order in which they are executed from the
spcreate.sql script. The order also indicates the dependency of each
script on the next.
There are few other scripts that do not have any direct dependency on
the above scripts but require the previous set of scripts to be completed
successfully before they can be run.
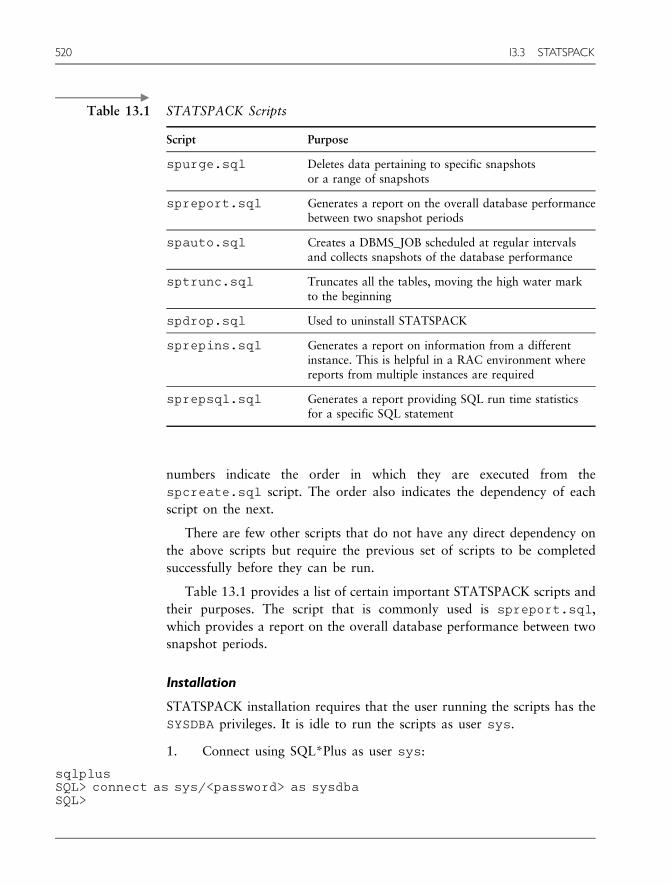
Table 13.1 provides a list of certain important STATSPACK scripts and
their purposes. The script that is commonly used is spreport.sql,
which provides a report on the overall database performance between two
snapshot periods.
Installation
STATSPACK installation requires that the user running the scripts has the
SYSDBA privileges. It is idle to run the scripts as user sys.
1. Connect using SQL*Plus as user sys:
sqlplusSQL> connect as sys/<password> as sysdbaSQL>
oTable 13.1 STATSPACK Scripts
Script Purpose
spurge.sql Deletes data pertaining to specific snapshotsor a range of snapshots
spreport.sql Generates a report on the overall database performancebetween two snapshot periods
spauto.sql Creates a DBMS_JOB scheduled at regular intervalsand collects snapshots of the database performance
sptrunc.sql Truncates all the tables, moving the high water markto the beginning
spdrop.sql Used to uninstall STATSPACK
sprepins.sql Generates a report on information from a differentinstance. This is helpful in a RAC environment wherereports from multiple instances are required
sprepsql.sql Generates a report providing SQL run time statisticsfor a specific SQL statement
520 13.3 STATSPACK
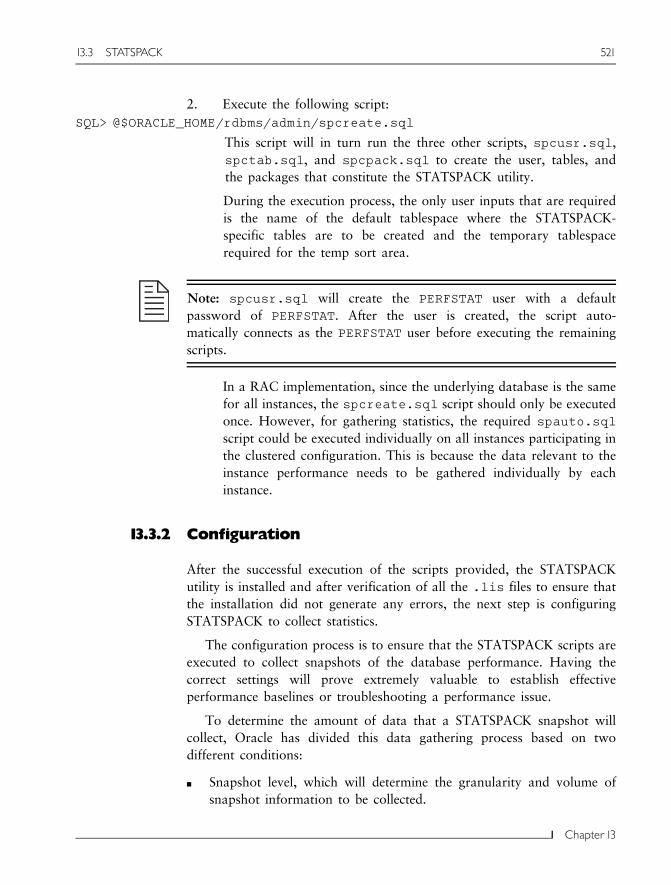
2. Execute the following script:
SQL> @$ORACLE_HOME/rdbms/admin/spcreate.sql
This script will in turn run the three other scripts, spcusr.sql,
spctab.sql, and spcpack.sql to create the user, tables, and
the packages that constitute the STATSPACK utility.
During the execution process, the only user inputs that are required
is the name of the default tablespace where the STATSPACK-
specific tables are to be created and the temporary tablespace
required for the temp sort area.
Note: spcusr.sql will create the PERFSTAT user with a default
password of PERFSTAT. After the user is created, the script auto-
matically connects as the PERFSTAT user before executing the remaining
scripts.
In a RAC implementation, since the underlying database is the same
for all instances, the spcreate.sql script should only be executed
once. However, for gathering statistics, the required spauto.sql
script could be executed individually on all instances participating in
the clustered configuration. This is because the data relevant to the
instance performance needs to be gathered individually by each
instance.
13.3.2 Configuration
After the successful execution of the scripts provided, the STATSPACK
utility is installed and after verification of all the .lis files to ensure that
the installation did not generate any errors, the next step is configuring
STATSPACK to collect statistics.
The configuration process is to ensure that the STATSPACK scripts are
executed to collect snapshots of the database performance. Having the
correct settings will prove extremely valuable to establish effective
performance baselines or troubleshooting a performance issue.
To determine the amount of data that a STATSPACK snapshot will
collect, Oracle has divided this data gathering process based on two
different conditions:
n Snapshot level, which will determine the granularity and volume of
snapshot information to be collected.
13.3 STATSPACK 521
Chapter13
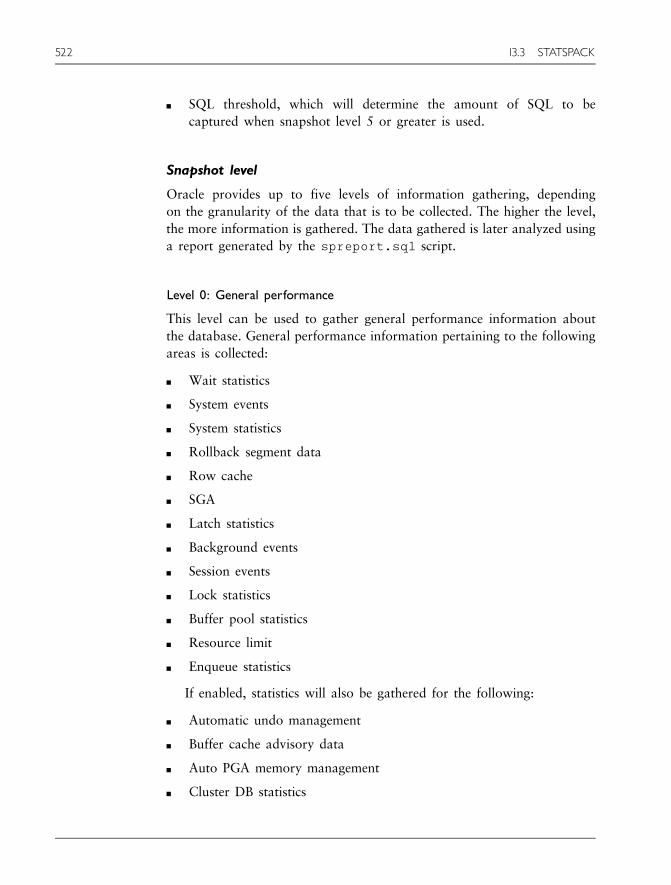
n SQL threshold, which will determine the amount of SQL to be
captured when snapshot level 5 or greater is used.
Snapshot level
Oracle provides up to five levels of information gathering, depending
on the granularity of the data that is to be collected. The higher the level,
the more information is gathered. The data gathered is later analyzed using
a report generated by the spreport.sql script.
Level 0: General performance
This level can be used to gather general performance information about
the database. General performance information pertaining to the following
areas is collected:
n Wait statistics
n System events
n System statistics
n Rollback segment data
n Row cache
n SGA
n Latch statistics
n Background events
n Session events
n Lock statistics
n Buffer pool statistics
n Resource limit
n Enqueue statistics
If enabled, statistics will also be gathered for the following:
n Automatic undo management
n Buffer cache advisory data
n Auto PGA memory management
n Cluster DB statistics
522 13.3 STATSPACK
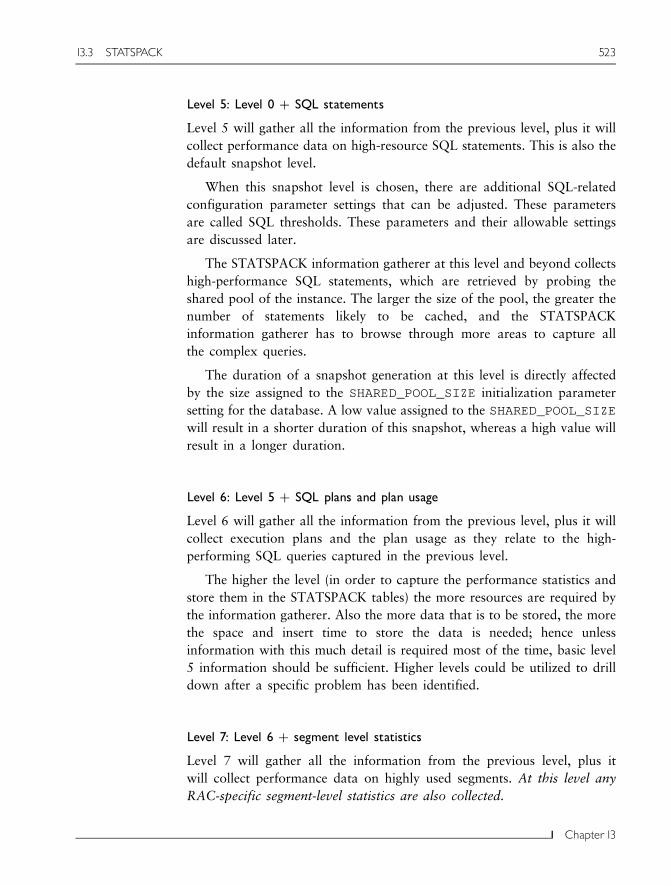
Level 5: Level 0 þ SQL statements
Level 5 will gather all the information from the previous level, plus it will
collect performance data on high-resource SQL statements. This is also the
default snapshot level.
When this snapshot level is chosen, there are additional SQL-related
configuration parameter settings that can be adjusted. These parameters
are called SQL thresholds. These parameters and their allowable settings
are discussed later.
The STATSPACK information gatherer at this level and beyond collects
high-performance SQL statements, which are retrieved by probing the
shared pool of the instance. The larger the size of the pool, the greater the
number of statements likely to be cached, and the STATSPACK
information gatherer has to browse through more areas to capture all
the complex queries.
The duration of a snapshot generation at this level is directly affected
by the size assigned to the SHARED_POOL_SIZE initialization parameter
setting for the database. A low value assigned to the SHARED_POOL_SIZE
will result in a shorter duration of this snapshot, whereas a high value will
result in a longer duration.
Level 6: Level 5 þ SQL plans and plan usage
Level 6 will gather all the information from the previous level, plus it will
collect execution plans and the plan usage as they relate to the high-
performing SQL queries captured in the previous level.
The higher the level (in order to capture the performance statistics and
store them in the STATSPACK tables) the more resources are required by
the information gatherer. Also the more data that is to be stored, the more
the space and insert time to store the data is needed; hence unless
information with this much detail is required most of the time, basic level
5 information should be sufficient. Higher levels could be utilized to drill
down after a specific problem has been identified.
Level 7: Level 6 þ segment level statistics
Level 7 will gather all the information from the previous level, plus it
will collect performance data on highly used segments. At this level any
RAC-specific segment-level statistics are also collected.
13.3 STATSPACK 523
Chapter13

Segment-level information collected at this level helps make decisions
about modification of physical layout on certain segments or tablespaces.
Level 10: Level 7 þ parent^ child latches
Level 10 will gather all the information from the previous level, plus it will
collect parent–child latch information.
Due to the extensive detail of statistics collected at this level,
gathering snapshot information at this level should be done with great
caution.
SQL threshold
While capturing high-resource SQL queries, certain additional criteria or
threshold values can be defined, for example, capture SQL queries with
number of executions greater than 500.
Defining threshold values for various criteria provides additional
levels of filtering when capturing SQL queries that have performance
issues.
Top 5 CR Blocks Served (RAC) per Segment for DB: PRODDB Instance: RAC1Snaps:
-> End Global Cache CR Blocks Served Threshold: 1000CU
Subobject Obj. BlocksOwner Tablespace Object Name Name Type Served %Total-------- ---------- ---------- ---------- ------ ------ ------MVALLATH USPRL_PK_ PK_USPRL _INDX_P003 INDEX 1,065 12.9MVALLATH INDX_TBS20 COMP_INDX7 INDEX 963 11.72MVALLATH USERS PK_USEC INDEX 704 8.57MVALLATH COMP_DATA_ COMPANY _DATA_P003 TABLE 525 6.39MVALLATH USRLI_DATA USER_LOGIN _DATA_P001 TABLE 437 5.32---------------------------------------------------------------------
Top 5 CU Blocks Served (RAC) per Segment for DB: PRODDB Instance: RACSnaps:
-> End Global Cache CU Blocks Served Threshold: 1000CU
Subobject Obj. BlocksOwner Tablespace Object Name Name Type Served %Total-------- ---------- ------------ --------- ----- ------ ------MVALLATH COMP_DATA_ COMPANY _DATA_P002 TABLE 21,536 58.40MVALLATH COMP_DATA_ COMPANY _DATA_P003 TABLE 5,755 15.61MVALLATH USPRL_DATA USER_PROFILE _DATA_P002 TABLE 2,537 6.88MVALLATH USERS PK_USRLI INDEX 662 1.80MVALLATH INDX_TBS30 USRLI_INDX1 _INDX_P001 INDEX 631 1.71---------------------------------------------------------------------
524 13.3 STATSPACK

oTable 13.2 Threshold parameter descriptions and values
Threshold Parameter Description Default Value
Number of executions of the SQL statement 100
Number of disk reads performed by the SQL statement 1000
Number of parse calls performed by the SQL statement 1000
Number of buffer gets performed by the SQL statement 10,000
Size of shareable memory used by the SQL statement 1 MB
Version count for the SQL statement 20
Number of global cache consistent read blocks served (RAC) 1000
Number of global cache current blocks served (RAC) 1000
oTable 13.3 STATSPACK Parameters and Values
Parameter Description Range ofValues
DefaultValues
I_snap_level Snapshot level 0, 5, 6, 7, 10 5
I_uncomment Comment toaccompany snapshot
Text Blank
I_executions_th Number of timesSQL statementexecuted
Integer � 0 100
I_disk_reads_th Number of disk readsthat a statement makes
Integer � 0 1000
I_parse_calls_th Number of parse callsthe statement makes
Integer � 0 1000
I_buffer_gets_th Number of buffer getsthe statement makes
Integer � 0 10,000
I_sharable_mem_th Amount of shareablememory
Integer � 0 1 MB
I_session_id Session ID to capturesession granular statistics
Valid SID fromV$SESSION
0
I_modify_parameter Save the parametersspecified for future
True, False False
13.3 STATSPACK 525
Chapter13

Table 13.2 provides a list of threshold descriptions and their default
values. Thresholds can be set during snapshot collection. If no value is
specified for the threshold parameters, the default values shown are
applied.
Table 13.3 provides a list of parameters that can be used with the
STATSPACK utility during snapshot collection. If the parameters and a
corresponding value are not used, the default values shown are applied
during snapshot gathering.
13.3.3 Execution
Snapshots to collect statistics can be gathered in one of two ways:
n Interactively, by executing the following command:
SQL> EXECUTE STATSPACK.SNAP();
or by passing in a value to one of the parameters listed in Table 13.3.
For example using the I_snap_level parameter to collect snapshot
at a specific level (0, 5, 6, 7, 10)
SQL> EXECUTE STATSPACK.SNAP(I_snap_level¼>n)
where ‘n’ could have a value of 0, 5, 6, 7, or 10.
n Through an automated script that is executed at fixed intervals either
through the Oracle provided DBMS_JOB package or through an
operating-system-based utility such as cron shell or perl script.
Oracle provides, along with the other STATSPACK scripts, a script
spauto.sql to automate the snapshot collection using the
DBMS_JOB package. If the spauto.sql script is executed for
automated snapshot collection, the data is gathered every hour by the
hour:
SQL>$ORACLE_HOME/rdbms/admin/spauto.sql
13.3.4 Reporting
The STATSPACK utility has been installed and configured, and
snapshots have been taken at various intervals. Now the data gathered
needs to be analyzed after extracting the data through a report
generator. Oracle provides a report generator with STATSPACK. This
script will provide the overall health of the database between two snapshot
periods.
526 13.3 STATSPACK
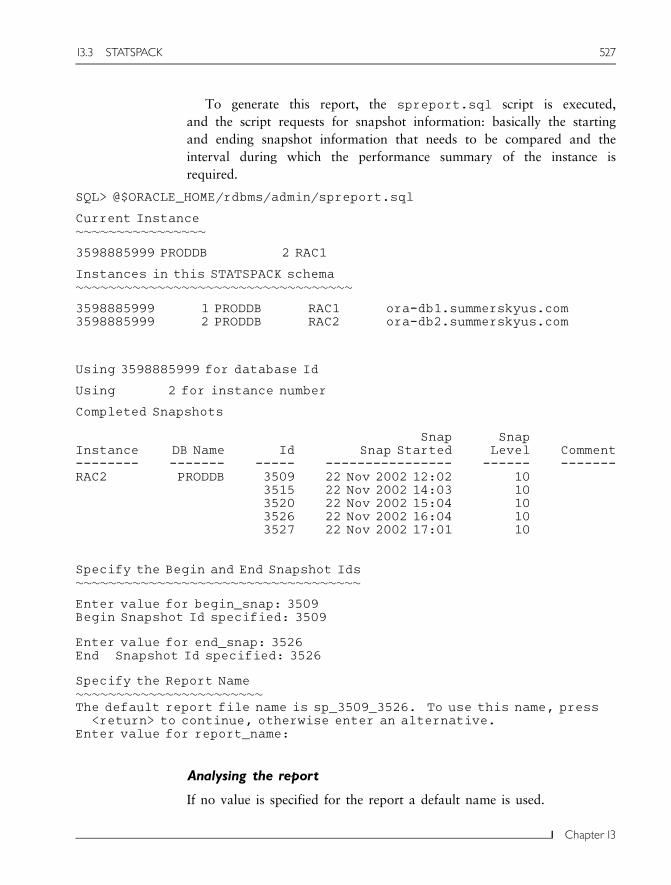
To generate this report, the spreport.sql script is executed,
and the script requests for snapshot information: basically the starting
and ending snapshot information that needs to be compared and the
interval during which the performance summary of the instance is
required.
SQL> @$ORACLE_HOME/rdbms/admin/spreport.sql
Current Instance����������������
3598885999 PRODDB 2 RAC1
Instances in this STATSPACK schema����������������������������������
3598885999 1 PRODDB RAC1 ora-db1.summerskyus.com3598885999 2 PRODDB RAC2 ora-db2.summerskyus.com
Using 3598885999 for database Id
Using 2 for instance number
Completed Snapshots
Snap SnapInstance DB Name Id Snap Started Level Comment-------- ------- ----- ---------------- ------ -------RAC2 PRODDB 3509 22 Nov 2002 12:02 10
3515 22 Nov 2002 14:03 103520 22 Nov 2002 15:04 103526 22 Nov 2002 16:04 103527 22 Nov 2002 17:01 10
Specify the Begin and End Snapshot Ids�����������������������������������
Enter value for begin_snap: 3509Begin Snapshot Id specified: 3509
Enter value for end_snap: 3526End Snapshot Id specified: 3526
Specify the Report Name�����������������������
The default report file name is sp_3509_3526. To use this name, press<return> to continue, otherwise enter an alternative.
Enter value for report_name:
Analysing the report
If no value is specified for the report a default name is used.
13.3 STATSPACK 527
Chapter13
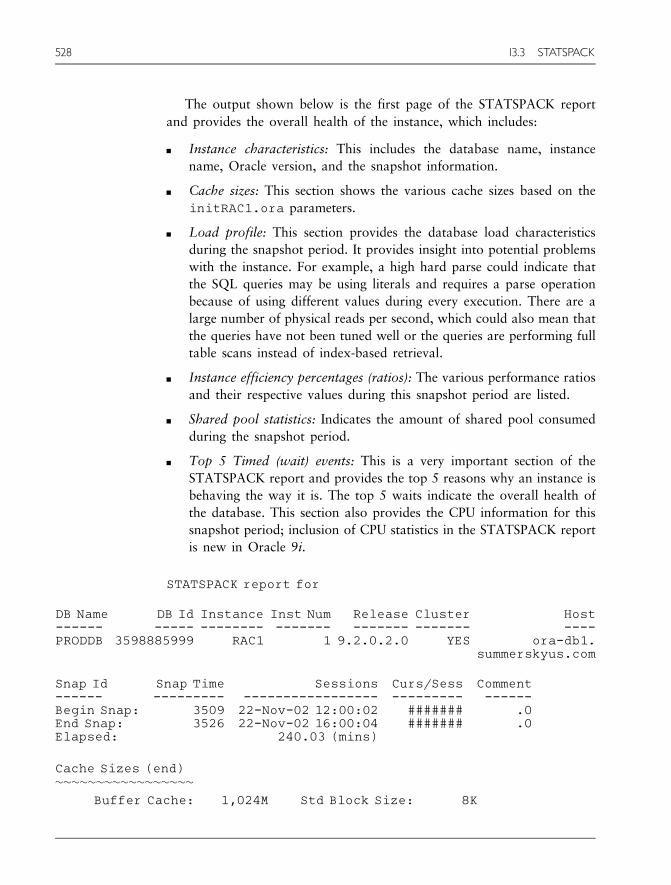
The output shown below is the first page of the STATSPACK report
and provides the overall health of the instance, which includes:
n Instance characteristics: This includes the database name, instance
name, Oracle version, and the snapshot information.
n Cache sizes: This section shows the various cache sizes based on the
initRAC1.ora parameters.
n Load profile: This section provides the database load characteristics
during the snapshot period. It provides insight into potential problems
with the instance. For example, a high hard parse could indicate that
the SQL queries may be using literals and requires a parse operation
because of using different values during every execution. There are a
large number of physical reads per second, which could also mean that
the queries have not been tuned well or the queries are performing full
table scans instead of index-based retrieval.
n Instance efficiency percentages (ratios): The various performance ratios
and their respective values during this snapshot period are listed.
n Shared pool statistics: Indicates the amount of shared pool consumed
during the snapshot period.
n Top 5 Timed (wait) events: This is a very important section of the
STATSPACK report and provides the top 5 reasons why an instance is
behaving the way it is. The top 5 waits indicate the overall health of
the database. This section also provides the CPU information for this
snapshot period; inclusion of CPU statistics in the STATSPACK report
is new in Oracle 9i.
STATSPACK report for
Snap Id Snap Time Sessions Curs/Sess Comment------ --------- ----------------- --------- ------Begin Snap: 3509 22-Nov-02 12:00:02 ####### .0End Snap: 3526 22-Nov-02 16:00:04 ####### .0Elapsed: 240.03 (mins)
Cache Sizes (end)�����������������
Buffer Cache: 1,024M Std Block Size: 8K
DB Name DB Id Instance Inst Num Release Cluster Host------ ----- -------- ------- ------- ------- ----PRODDB 3598885999 RAC1 1 9.2.0.2.0 YES ora-db1.
summerskyus.com
528 13.3 STATSPACK

Shared Pool Size: 256M Log Buffer: 976K
Load Profile������������
Per Second Per Transaction-------------- ---------------
Redo size: 3,103.00 1,360.33Logical reads: 16,323.94 2,772.35Block changes: 119.86 18.70Physical reads: 3,495.09 121.35Physical writes: 28.42 11.50User calls: 114.31 50.11Parses: 168.06 73.68Hard parses: 3958.01 199.00Sorts: 1287.61 126.09Logons: 10,348.00 98.76Executes: 174.20 76.37Transactions: 2.28
% Blocks changed per Read: 0.31 Recursive Call %: 87.42Rollback per transaction% : 13.50 Rows per Sort : 3.79
Instance Efficiency Percentages (Target 100%)���������������������������������������������
Buffer Nowait %: 100.00 Redo NoWait %: 100.00Buffer Hit %: 100.00 In-memory Sort % : 100.00Library Hit %: 100.00 Soft Parse %: 100.00
Execute to Parse %: 3.52 Latch Hit % : 99.98Parse CPU to Parse Elapsd %:92.06 % Non-Parse CPU: 97.95
Shared Pool Statistics Begin End------ ------
Memory Usage %: 40.38 41.62% SQL with executions>1: 66.67 66.39
% Memory for SQL w/exec>1: 63.38 64.26
Top 5 Timed Events������������������
%Total
Event Waits Time (s) Ela Time----------------------- ------ -------- --------CPU time 5,085 49.68enqueue 17,618 3,442 33.63global cache null to x 30,079 399 3.90global cache cr request 105,492 353 3.45log file sync 36,619 272 2.66
------------------------------------------------------
n Workload characteristics: The output section below provides RAC-
specific information; this information is not found in a STATSPACK
report generated for a stand-alone configuration.
13.3 STATSPACK 529
Chapter13

Cluster Statistics for DB: PRODDB Instance: RAC1 Snaps: 3509 -3526
Global Cache Service - Workload Characteristics-----------------------------------------------Ave global cache get time (ms): 2.7Ave global cache convert time (ms): 10.2
Ave build time for CR block (ms): 0.1Ave flush time for CR block (ms): 2.5Ave send time for CR block (ms): 0.2Ave time to process CR block request (ms): 2.8Ave receive time for CR block (ms): 3.7
Ave pin time for current block (ms): 9.1Ave flush time for current block (ms): 0.9Ave send time for current block (ms): 0.2Ave time to process current block request (ms): 10.2Ave receive time for current block (ms): 10.6
Global cache hit ratio: 0.2Ratio of current block defers: 0.1% of messages sent for buffer gets: 0.2% of remote buffer gets: 0.2Ratio of I/O for coherence: 0.2Ratio of local vs remote work: 0.4Ratio of fusion vs physical writes: 0.0
Global Enqueue Service Statistics---------------------------------Ave global lock get time (ms): 1.9Ave global lock convert time (ms): 48.8Ratio of global lock gets vs global lock releases: 1.1
GCS and GES Messaging statistics--------------------------------Ave message sent queue time (ms): 0.1Ave message sent queue time on ksxp (ms): 0.6Ave message received queue time (ms): 0.0Ave GCS message process time (ms): 0.2Ave GES message process time (ms): 0.0% of direct sent messages: 94.2% of indirect sent messages: 5.1% of flow controlled messages: 0.7-------------------------------------------------------
GES Statistics for DB: PRODDB Instance: RAC1 Snaps: 3509-3526Statistic Total per per
Second Trans------------------------------- ----- ------ ------dynamically allocated gcs resourc 0 0.0 0.0dynamically allocated gcs shadows 0 0.0 0.0flow control messages received 0 0.0 0.0flow control messages sent 0 0.0 0.0gcs ast xid 11 0.0 0.0gcs blocked converts 34,077 2.4 1.0gcs blocked cr converts 64,259 4.5 2.0gcs compatible basts 12 0.0 0.0
530 13.3 STATSPACK
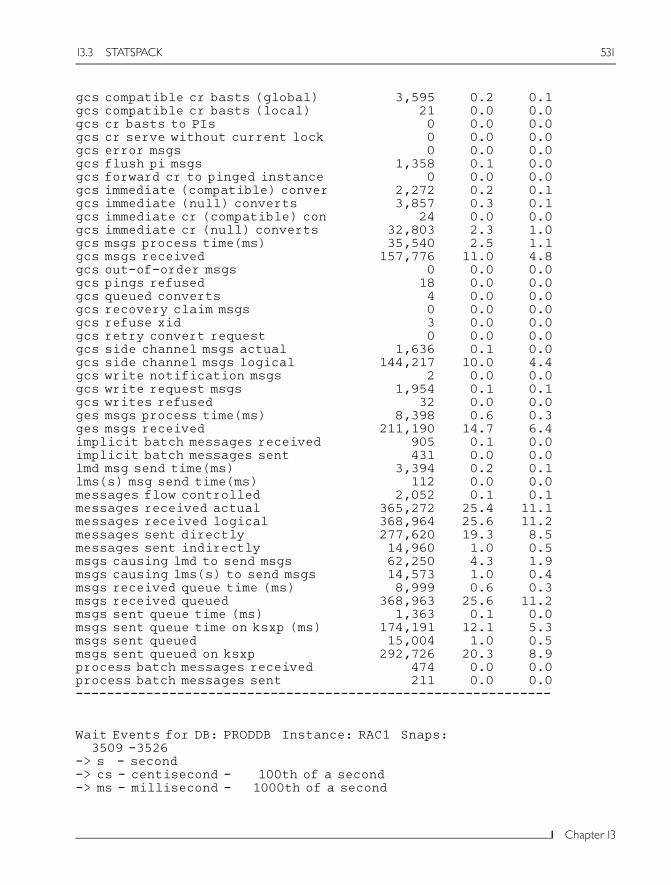
gcs compatible cr basts (global) 3,595 0.2 0.1gcs compatible cr basts (local) 21 0.0 0.0gcs cr basts to PIs 0 0.0 0.0gcs cr serve without current lock 0 0.0 0.0gcs error msgs 0 0.0 0.0gcs flush pi msgs 1,358 0.1 0.0gcs forward cr to pinged instance 0 0.0 0.0gcs immediate (compatible) conver 2,272 0.2 0.1gcs immediate (null) converts 3,857 0.3 0.1gcs immediate cr (compatible) con 24 0.0 0.0gcs immediate cr (null) converts 32,803 2.3 1.0gcs msgs process time(ms) 35,540 2.5 1.1gcs msgs received 157,776 11.0 4.8gcs out-of-order msgs 0 0.0 0.0gcs pings refused 18 0.0 0.0gcs queued converts 4 0.0 0.0gcs recovery claim msgs 0 0.0 0.0gcs refuse xid 3 0.0 0.0gcs retry convert request 0 0.0 0.0gcs side channel msgs actual 1,636 0.1 0.0gcs side channel msgs logical 144,217 10.0 4.4gcs write notification msgs 2 0.0 0.0gcs write request msgs 1,954 0.1 0.1gcs writes refused 32 0.0 0.0ges msgs process time(ms) 8,398 0.6 0.3ges msgs received 211,190 14.7 6.4implicit batch messages received 905 0.1 0.0implicit batch messages sent 431 0.0 0.0lmd msg send time(ms) 3,394 0.2 0.1lms(s) msg send time(ms) 112 0.0 0.0messages flow controlled 2,052 0.1 0.1messages received actual 365,272 25.4 11.1messages received logical 368,964 25.6 11.2messages sent directly 277,620 19.3 8.5messages sent indirectly 14,960 1.0 0.5msgs causing lmd to send msgs 62,250 4.3 1.9msgs causing lms(s) to send msgs 14,573 1.0 0.4msgs received queue time (ms) 8,999 0.6 0.3msgs received queued 368,963 25.6 11.2msgs sent queue time (ms) 1,363 0.1 0.0msgs sent queue time on ksxp (ms) 174,191 12.1 5.3msgs sent queued 15,004 1.0 0.5msgs sent queued on ksxp 292,726 20.3 8.9process batch messages received 474 0.0 0.0process batch messages sent 211 0.0 0.0-------------------------------------------------------------
Wait Events for DB: PRODDB Instance: RAC1 Snaps:3509 -3526
-> s - second-> cs - centisecond - 100th of a second-> ms - millisecond - 1000th of a second
13.3 STATSPACK 531
Chapter13

-> us - microsecond - 1000000th of a second-> ordered by wait time desc, waits desc (idle events last)
AvgTotal Wait wait Waits
Event Waits Timeouts Time (s) (ms) /txn--------------------- ----- ------- -------- ---- ----enqueue 17,618 1,775 3,442 195 0.5global cache null to x 30,079 23 399 13 0.9global cache cr request 105,492 101 353 3 3.2log file sync 36,619 49 272 7 1.1DFS lock handle 92,013 29 235 3 2.8control file parallel write 4,659 0 53 11 0.1buffer busy global cache 1,152 0 44 38 0.0log file parallel write 36,209 36,201 42 1 1.1control file sequential read 18,309 0 35 2 0.6PX Deq: Execute Reply 10,797 0 31 3 0.3PX Deq: Parse Reply 13,099 0 30 2 0.4PX qref latch 29 29 28 981 0.0direct path read 2,625 0 26 10 0.1PX Deq: Join ACK 13,793 6,592 26 2 0.4buffer busy global CR 1,617 0 19 12 0.0global cache open x 2,592 0 13 5 0.1global cache s to x 8,153 3 13 2 0.2SQL*Net more data to client 164,396 0 10 0 5.0PX Deq: Signal ACK 3,990 1,357 10 3 0.1PX Deq: reap credit 210,299 195,058 8 0 6.4IPC send completion sync 6,707 0 8 1 0.2global cache busy 193 0 7 35 0.0wait for master scn 9,528 0 6 1 0.3buffer busy waits 289 0 5 18 0.0db file parallel write 1,803 0 5 3 0.1db file sequential read 424 0 4 9 0.0direct path write 6,032 0 4 1 0.2global cache open s 1,944 0 4 2 0.1row cache lock 126 0 3 27 0.0process startup 12 1 3 261 0.0global cache null to s 875 0 3 3 0.0library cache lock 4,903 0 2 0 0.1latch free 519 228 1 3 0.0CGS wait for IPC msg 50,310 46,897 1 0 1.5name-service call wait 4 1 1 304 0.0ksxr poll remote instances 37,777 23,639 1 0 1.1SQL*Net break/reset to clien 240 0 0 2 0.0KJC: Wait for msg sends to c 939 0 0 0 0.0PX Deq Credit: send blkd 27 0 0 2 0.0library cache pin 39 0 0 1 0.0LGWR wait for redo copy 43 0 0 0 0.0buffer deadlock 84 83 0 0 0.0cr request retry 47 47 0 0 0.0lock escalate retry 18 18 0 0 0.0
532 13.3 STATSPACK
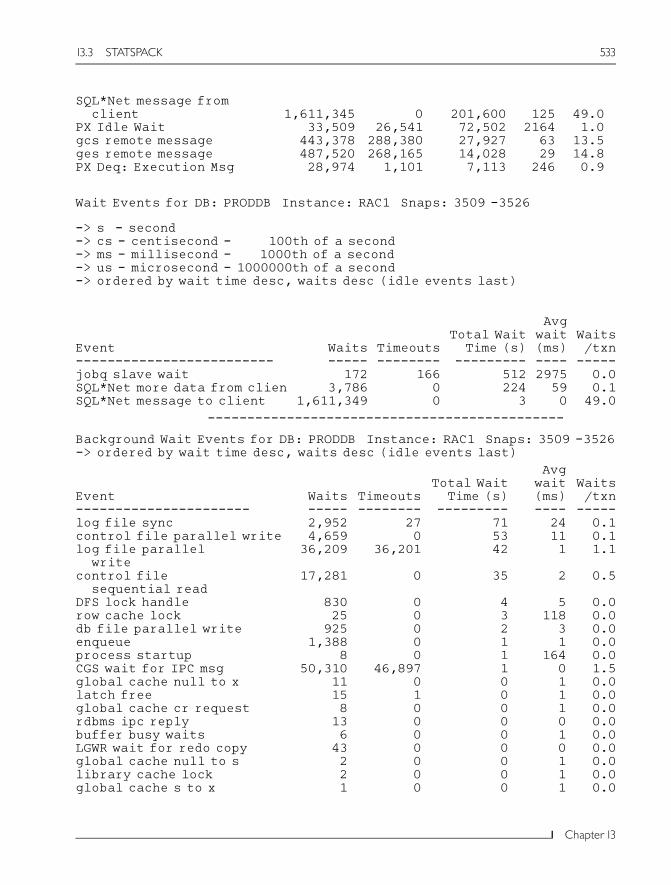
Wait Events for DB: PRODDB Instance: RAC1 Snaps: 3509 -3526
-> s - second-> cs - centisecond - 100th of a second-> ms - millisecond - 1000th of a second-> us - microsecond - 1000000th of a second-> ordered by wait time desc, waits desc (idle events last)
SQL*Net message fromclient 1,611,345 0 201,600 125 49.0
PX Idle Wait 33,509 26,541 72,502 2164 1.0gcs remote message 443,378 288,380 27,927 63 13.5ges remote message 487,520 268,165 14,028 29 14.8PX Deq: Execution Msg 28,974 1,101 7,113 246 0.9
AvgTotal Wait wait Waits
Event Waits Timeouts Time (s) (ms) /txn------------------------- ----- -------- --------- ---- -----jobq slave wait 172 166 512 2975 0.0SQL*Net more data from clien 3,786 0 224 59 0.1SQL*Net message to client 1,611,349 0 3 0 49.0
---------------------------------------------
Background Wait Events for DB: PRODDB Instance: RAC1 Snaps: 3509 -3526-> ordered by wait time desc, waits desc (idle events last)
AvgTotal Wait wait Waits
Event Waits Timeouts Time (s) (ms) /txn---------------------- ----- -------- --------- ---- -----log file sync 2,952 27 71 24 0.1control file parallel write 4,659 0 53 11 0.1log file parallel
write36,209 36,201 42 1 1.1
control filesequential read
17,281 0 35 2 0.5
DFS lock handle 830 0 4 5 0.0row cache lock 25 0 3 118 0.0db file parallel write 925 0 2 3 0.0enqueue 1,388 0 1 1 0.0process startup 8 0 1 164 0.0CGS wait for IPC msg 50,310 46,897 1 0 1.5global cache null to x 11 0 0 1 0.0latch free 15 1 0 1 0.0global cache cr request 8 0 0 1 0.0rdbms ipc reply 13 0 0 0 0.0buffer busy waits 6 0 0 1 0.0LGWR wait for redo copy 43 0 0 0 0.0global cache null to s 2 0 0 1 0.0library cache lock 2 0 0 1 0.0global cache s to x 1 0 0 1 0.0
13.3 STATSPACK 533
Chapter13

Note: For more discussions about many of the above statistics and wait
events, please refer to the subsequent chapters on performance tuning.
13.4 Oracle Enterprise Manager
Oracle Enterprise Manager (OEM) comes bundled with the Oracle
Enterprise Edition and can be installed on the same node as the database
server or can be installed separately on another machine, which is the
preferred approach. For example, if the database server is on a Unix
operating system, OEM could very well be installed on this machine.
However, due to the more textual nature of the operating system, invoking
the GUI interface of OEM would require some emulation tools such as
X-Windows. Due to this dependency and the unfriendly nature, OEM is
normally installed as two separate tiers, the OEM repository and the OEM
console/client. While the client is normally installed on a Windows-based
workstation, the repository could be installed on any operating system,
including Unix.
OEM can be installed from the Oracle Universal Installer (OUI) by
selecting the Oracle 9i Management and Integration option.
OEM comprises a three-tier configuration: the target database that
needs to be controlled or monitored from OEM, the middle tier or the
management server (also called the repository) where all the target
database information is collected and stored, and the client or console tier
used to display the information.
The repository is used to capture and store information pertaining to
the target tier.
The front tier is the console and is used to monitor the database
(target tiers) via the management server, or directly using the local
tnsnames.ora file. If the direct approach is used, it bypasses the
management server and the tool only supports the basic functionality such
global cache open x 1 0 0 1 0.0KJC: Wait for msg
sends to c2 0 0 0 0.0
rdbms ipc message 206,156 126,240 95,578 464 6.3ges remote message 487,521 268,166 14,028 29 14.8gcs remote message 208,763 146,147 13,966 67 6.4smon timer 52 43 13,265 ###### 0.0
--------------------------------------------------------------------
534 13.4 Oracle Enterprise Manager
as database administration. Storing the information in the management
server provides additional functionality, such as sending a page to a DBA
when any alert is encountered and collecting target tier statistics when the
DBA is not monitoring the console for historical information.
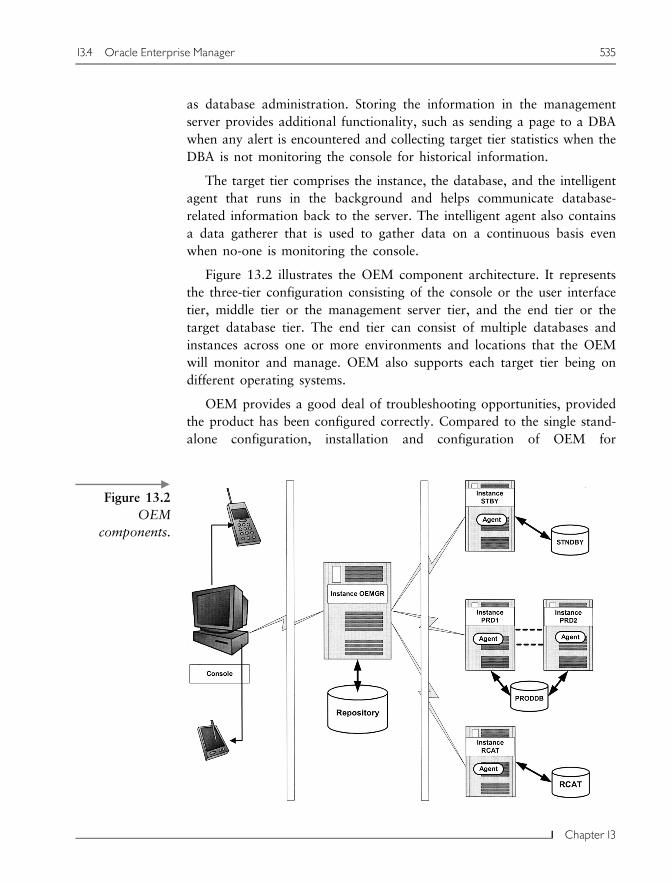
The target tier comprises the instance, the database, and the intelligent
agent that runs in the background and helps communicate database-
related information back to the server. The intelligent agent also contains
a data gatherer that is used to gather data on a continuous basis even
when no-one is monitoring the console.
Figure 13.2 illustrates the OEM component architecture. It represents
the three-tier configuration consisting of the console or the user interface
tier, middle tier or the management server tier, and the end tier or the
target database tier. The end tier can consist of multiple databases and
instances across one or more environments and locations that the OEM
will monitor and manage. OEM also supports each target tier being on
different operating systems.
OEM provides a good deal of troubleshooting opportunities, provided
the product has been configured correctly. Compared to the single stand-
alone configuration, installation and configuration of OEM for
oFigure 13.2
OEM
components.
13.4 Oracle Enterprise Manager 535
Chapter13
troubleshooting and monitoring a clustered database environment requires
certain additional processes.
13.4.1 Installation
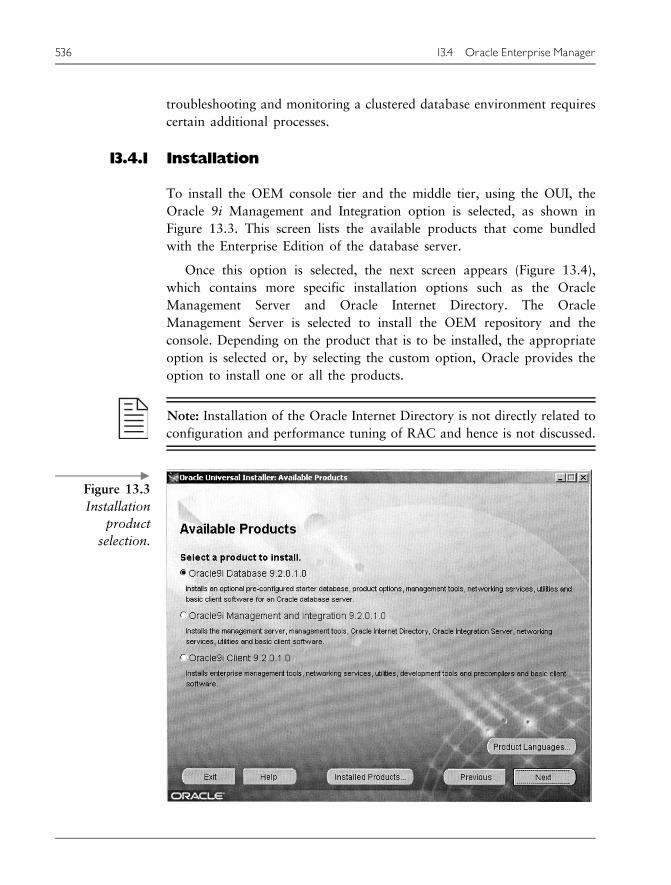
To install the OEM console tier and the middle tier, using the OUI, the
Oracle 9i Management and Integration option is selected, as shown in
Figure 13.3. This screen lists the available products that come bundled
with the Enterprise Edition of the database server.
Once this option is selected, the next screen appears (Figure 13.4),
which contains more specific installation options such as the Oracle
Management Server and Oracle Internet Directory. The Oracle
Management Server is selected to install the OEM repository and the
console. Depending on the product that is to be installed, the appropriate
option is selected or, by selecting the custom option, Oracle provides the
option to install one or all the products.
Note: Installation of the Oracle Internet Directory is not directly related to
configuration and performance tuning of RAC and hence is not discussed.
oFigure 13.3
Installation
product
selection.
536 13.4 Oracle Enterprise Manager

After the selection of this option, OEM is installed along with the client
portion of the product. After the basic installation of the product, the next
set of screens help in the configuration of the management server.
Figure 13.5 shows the management server configuration assistant. In
this screen the information pertaining to the credentials of the management
server, including the host name/address and repository owner’s informa-
tion, is entered.
Through a series of similar configuration screens the management
server is installed.
13.4.2 Configuring OEM for RAC
The management server should be able to discover the existence of the
various databases that are to be managed via OEM. While discovering and
managing individual instances could be as easy as telling the Enterprise
Manager of the node information, such as the IP address of the node or
the node name, on which the databases reside, selecting and configuring
a clustered database requires additional steps.
oFigure 13.4
OEM installa-
tion type
selection.
13.4 Oracle Enterprise Manager 537
Chapter13

Note: If these additional steps are not followed, the database and the
multiple instances will not be visible to OEM as a clustered database, but
rather as one instance with the database attached to it and the others as
separate instances.
Prerequisite
Prior to configuration of the various products required for the discovery of
the clustered database, it is required that the RAC database and the other
subcomponents listed in Chapter 8 (Installation and Configuration) have
been installed and configured.
Configuring the agent
The intelligent agent is a primary component for the discovery of both a
stand-alone configuration and a clustered configuration of the database. The
agent is installed by invoking the agent control (agentctl) utility available
in the ORACLE_HOME/bin directory on the database server machine. The
following are the steps for installing and configuring the agent:
1. The agent needs visibility of all nodes containing the instances
participating in the clustered database configuration. This can be
verified on most Unix platforms with the following command:
ora-db1:RAC1:oracle # lsnodesora-db1.summerskyus.com
oFigure 13.5
Management
server
configuration.
538 13.4 Oracle Enterprise Manager
ora-db2.summerskyus.comora-db1:RAC1:oracle #
2. The next step is to verify if the database has been configured to be
in a clustered state, that is, the database and all instances have been
mapped to each other in the server control utility provided by
Oracle as part of RAC. This can be verified on most Unix platforms
with the following command:
ora-db2:RAC2:oracle # srvctl status database -d PRODDBInstance RAC1 is running on node ora-db1.summerskyus.comInstance RAC2 is running on node ora-db2.summerskyus.com
3. The listener should be aware of all the instances participating in the
clustered configuration. This is verified with the following
command:
ora-db1:RAC1:oracle # lsnrctl statusLSNRCTL for Solaris: Version 9.2.0.2.0 - Production on 06-DEC-2002
11:57:30
Copyright (c) 1991, 2002, Oracle Corporation. All rights reserved.
Connecting to (DESCRIPTION¼(ADDRESS¼(PROTOCOL¼IPC)(KEY¼EXTPROC)))
STATUS of the LISTENER------------------------Alias LISTENERVersion TNSLSNR for Solaris: Version 9.2.0.2.0 - ProductionStart Date 22-NOV-2002 00:36:11Uptime 3 days 16 hr. 54 min. 21 secTrace Level OffSecurity OFFSNMP OFF
Listener Parameter File /apps/oracle/product/9.2.0/network/admin/listener.ora
Listener Log File /apps/oracle/product/9.2.0/network/log/lis-tener.log
Listening Endpoints Summary...(DESCRIPTION¼(ADDRESS¼(PROTOCOL¼ipc)(KEY¼EXTPROC)))(DESCRIPTION¼(ADDRESS¼(PROTOCOL¼tcp)(HOST¼ (ora-db1)(PORT¼1521)))
Services Summary...
Service "PLSExtProc" has 1 instance(s).
Instance "PLSExtProc", status UNKNOWN, has 1 handler(s) for thisservice...
Service "RAC1" has 1 instance(s).Instance "RAC1", status UNKNOWN, has 1 handler(s) for this service...
Service "RAC1.summerskyus.com" has 1 instance(s).Instance "RAC1", status READY, has 1 handler(s) for this service...
Service "PRODDB" has 1 instance(s).
13.4 Oracle Enterprise Manager 539
Chapter13
Instance "PRODDB", status UNKNOWN, has 1 handler(s) for this service...Service "PRODDB.SUMMERSKYUS.COM" has 1 instance(s).Instance "RAC1", status READY, has 1 handler(s) for this service...
The command completed successfullyora-db1:RAC1:oracle #
In the above output, of the two instances participating in the
clustered configuration the listener has registered only one instance.
This is because the following two parameters have not been
configured.
The LOCAL_LISTENER and REMOTE_LISTENER parameters point to
their respective host names as illustrated below:
RAC1.local_listener¼"(ADDRESS¼(PROTOCOL¼TCP)(HOST¼ora-db1.summerskyus.com)(PORT¼1521))"
RAC1.remote_listener¼"(ADDRESS¼(PROTOCOL¼TCP)(HOST¼ora-db2.summerskyus.com)(PORT¼1521))"
LOCAL_LISTENER is the listener for the local instance and
REMOTE_LISTENER is the listener on the remote instance(s) participating
in the clustered configuration. On implementations with two or more
instances, there would be multiple remote listener parameter definitions.
It is good to set these parameters in the parameter file so that
they register automatically during startup and shutdown of instances.
However, these parameters can be set dynamically using the following
commands:
ALTER SYSTEM SET LOCAL_LISTENER¼"(ADDRESS¼(PROTOCOL¼TCP)(HOST¼ora-db1.summerskyus.com)(PORT¼1521))"
ALTER SYSTEM SET REMOTE_LISTENER¼"(ADDRESS¼(PROTOCOL¼TCP)(HOST¼ora-db2.summerskyus.com)(PORT¼1521))"
Once these parameters have been set with the appropriate values, the
listener will register the remote instances.
Note: Registration does not occur until the next time the PMON discovery
routine executes. By default, this happens at 60-second intervals. This
normally occurs when a listener is started after the Oracle instance and
every time that listener fails and is restarted. The 60-second delay can be
overridden using the system-level SQL statement ALTER SYSTEM
REGISTER. This statement forces PMON to register the service
immediately.
540 13.4 Oracle Enterprise Manager
Checking the status of the listener again will reveal all instances
participating in the clustered configuration having registered with the local
listener on the local instance:
ora-db1:RAC1:oracle # lsnrctl statusLSNRCTL for Solaris: Version 9.2.0.2.0 - Production on 06-DEC-2002
11:59:30
Copyright (c) 1991, 2002, Oracle Corporation. All rights reserved.
Connecting to (DESCRIPTION¼(ADDRESS¼(PROTOCOL¼IPC)(KEY¼EXTPROC)))
STATUS of the LISTENER------------------------Alias LISTENERVersion TNSLSNR for Solaris: Version 9.2.0.2.0 - ProductionStart Date 06-DEC-2002 11:54:20Uptime 0 days 0 hr. 5 min. 10 secTrace Level OFFSecurity OFFSNMP OFF
Listener Parameter File/apps/oracle/product/9.2.0/network/admin/lis-tener.ora
Listener Log File/apps/oracle/product/9.2.0/network/log/listener.logListening Endpoints Summary...(DESCRIPTION¼(ADDRESS¼(PROTOCOL¼ipc)(KEY¼EXTPROC)))(DESCRIPTION¼(ADDRESS¼(PROTOCOL¼tcp)(HOST¼ora-db1)(PORT¼1521)))
Services Summary...Service "PLSExtProc" has 1 instance(s).Instance "PLSExtProc", status UNKNOWN, has 1 handler(s) for thisservice...
Service "RAC1" has 1 instance(s).Instance "RAC1", status UNKNOWN, has 1 handler(s) for this service...
Service "RAC1.summerskyus.com" has 1 instance(s).Instance "RAC1", status READY, has 1 handler(s) for this service...
Service "RAC2.summerskyus.com" has 1 instance(s).Instance "RAC2", status READY, has 1 handler(s) for this service...
Service "PRODDB" has 1 instance(s).Instance "PRODDB", status UNKNOWN, has 1 handler(s) for this service...
Service "PRODDB.SUMMERSKYUS.COM" has 2 instance(s).Instance "RAC1", status READY, has 1 handler(s) for this service...Instance "RAC2", status READY, has 1 handler(s) for this service...
The command completed successfullyora-db1:RAC1:oracle #
New Feature: LOCAL_LISTENER and REMOTE_LISTENER parameters
are new in Oracle 9i Release 1. In this release, these parameters can only
be defined by setting them in the init<SID>.ora file and these
parameters take effect during instance startup. Oracle Release 2 has
13.4 Oracle Enterprise Manager 541
Chapter13

provided dynamic configuration of these parameters using the ALTER
SYSTEM SET REMOTE_LISTENER command.
4. The GSD should also be available for the intelligent agent to have
visibility to the clustered database configuration. This is verified
using the following command:
ora-db2:RAC2:oracle # gsdctl statGSD is running on the local node
5. The tnsnames.ora file on the database server should be set up
and configured to provide visibility to all instances.
6. Once all the above agents and daemons have been verified, the
intelligent agent can be started. This can be done with the following
command:
ora-db1:RAC1:oracle # agentctl startDBSNMP for Solaris: Version 9.2.0.1.0 - Production on 06-DEC-2002
11:55:24
Copyright (c) 2002 Oracle Corporation. All rights reserved.Starting Oracle Intelligent Agent......Agent started
Another component that is required by the management server for
collecting database statistics is the data gatherer.
New Feature: In prior versions of Oracle, the data gatherer was configured
as a separate daemon process on the database server. In Oracle 9i, the data
gatherer is part of the intelligent agent and is installed and started when
the agent is started.
Note: Verification and configuration of all the above components is to be
performed on all nodes participating in the clustered configuration. Once
this is completed, the clustered database and the corresponding instances
can be discovered via OEM. Steps required for configuration, starting, and
stopping of the intelligent agent have been discussed in Chapter 8
(Installation and Configuration).
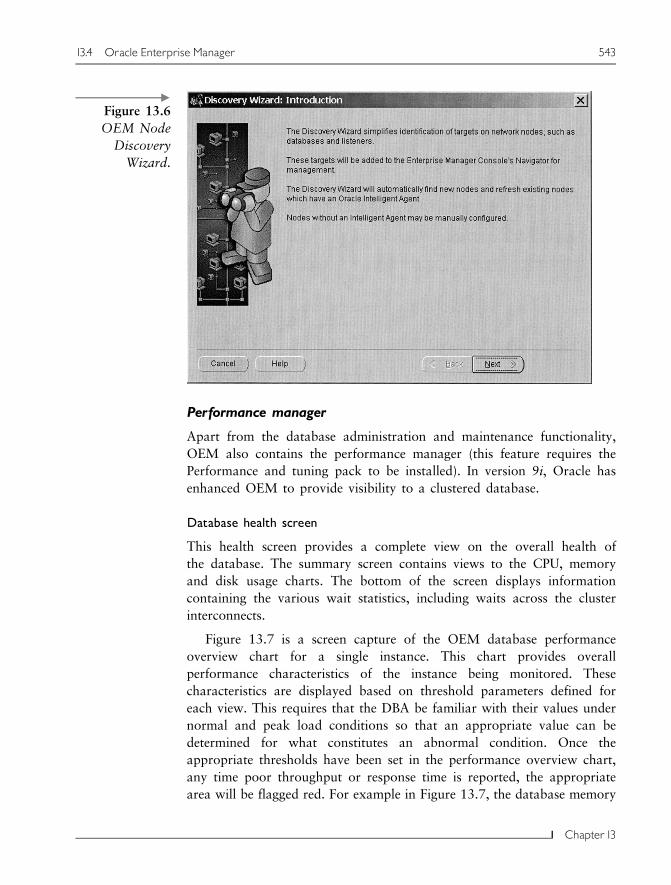
Figure 13.6 illustrates the selection and discovery of the instances of
an Oracle database.
542 13.4 Oracle Enterprise Manager
Performance manager
Apart from the database administration and maintenance functionality,
OEM also contains the performance manager (this feature requires the
Performance and tuning pack to be installed). In version 9i, Oracle has
enhanced OEM to provide visibility to a clustered database.
Database health screen
This health screen provides a complete view on the overall health of
the database. The summary screen contains views to the CPU, memory
and disk usage charts. The bottom of the screen displays information
containing the various wait statistics, including waits across the cluster
interconnects.
Figure 13.7 is a screen capture of the OEM database performance
overview chart for a single instance. This chart provides overall
performance characteristics of the instance being monitored. These
characteristics are displayed based on threshold parameters defined for
each view. This requires that the DBA be familiar with their values under
normal and peak load conditions so that an appropriate value can be
determined for what constitutes an abnormal condition. Once the
appropriate thresholds have been set in the performance overview chart,
any time poor throughput or response time is reported, the appropriate
area will be flagged red. For example in Figure 13.7, the database memory
oFigure 13.6
OEM Node
Discovery
Wizard.
13.4 Oracle Enterprise Manager 543
Chapter13
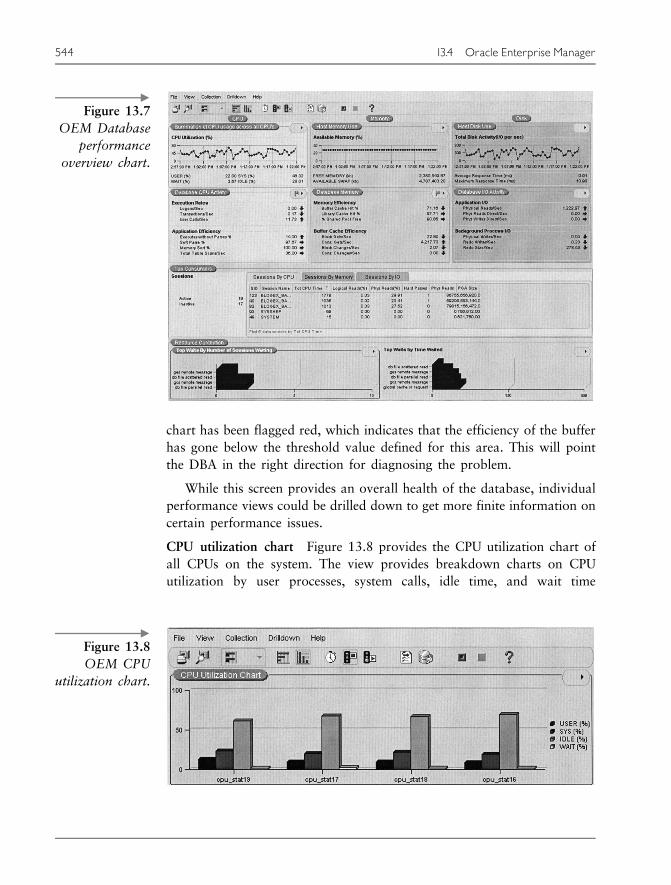
chart has been flagged red, which indicates that the efficiency of the buffer
has gone below the threshold value defined for this area. This will point
the DBA in the right direction for diagnosing the problem.
While this screen provides an overall health of the database, individual
performance views could be drilled down to get more finite information on
certain performance issues.
CPU utilization chart Figure 13.8 provides the CPU utilization chart of
all CPUs on the system. The view provides breakdown charts on CPU
utilization by user processes, system calls, idle time, and wait time
oFigure 13.7
OEM Database
performance
overview chart.
oFigure 13.8
OEM CPU
utilization chart.
544 13.4 Oracle Enterprise Manager
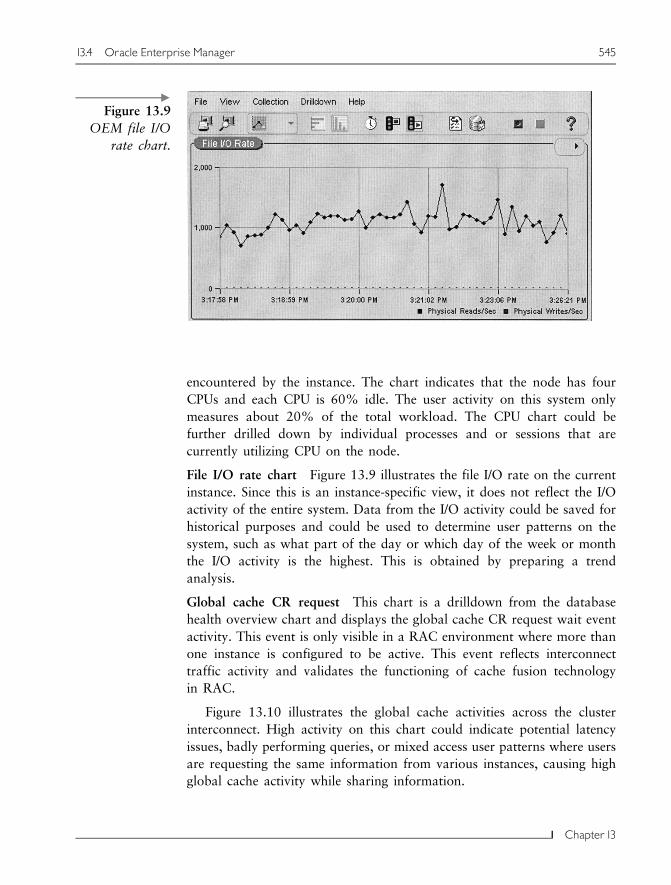
encountered by the instance. The chart indicates that the node has four
CPUs and each CPU is 60% idle. The user activity on this system only
measures about 20% of the total workload. The CPU chart could be
further drilled down by individual processes and or sessions that are
currently utilizing CPU on the node.
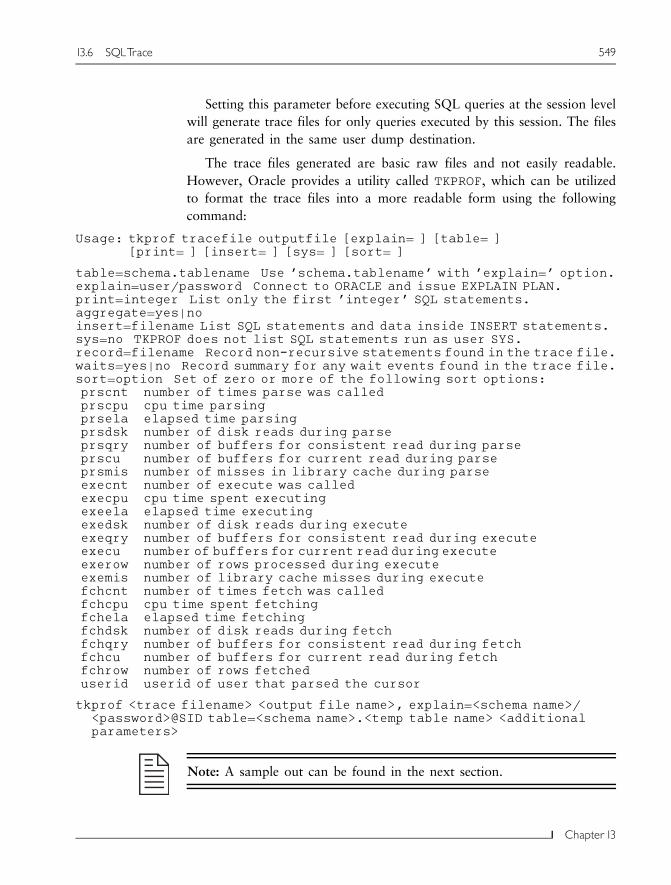
File I/O rate chart Figure 13.9 illustrates the file I/O rate on the current
instance. Since this is an instance-specific view, it does not reflect the I/O
activity of the entire system. Data from the I/O activity could be saved for
historical purposes and could be used to determine user patterns on the
system, such as what part of the day or which day of the week or month
the I/O activity is the highest. This is obtained by preparing a trend
analysis.
Global cache CR request This chart is a drilldown from the database
health overview chart and displays the global cache CR request wait event
activity. This event is only visible in a RAC environment where more than
one instance is configured to be active. This event reflects interconnect
traffic activity and validates the functioning of cache fusion technology
in RAC.
Figure 13.10 illustrates the global cache activities across the cluster
interconnect. High activity on this chart could indicate potential latency
issues, badly performing queries, or mixed access user patterns where users
are requesting the same information from various instances, causing high
global cache activity while sharing information.
oFigure 13.9
OEM file I/O
rate chart.
13.4 Oracle Enterprise Manager 545
Chapter13

13.5 EXPLAIN PLAN
Transactional activity in a system comprises SELECT, INSERT, UPDATE,
and DELETE operations. In order to perform these operations, Oracle
generates an execution plan for the statement. The execution plan is
generated either based on a set of predefined rules (RBO) or based on
the statistics available during the time of creating an execution plan
(CBO). Since these execution plans are generated based on the information
available in the SQL statement (attributes in the WHERE clause) these
plans need to be examined in detail to ensure that they are correct.
If this is not the case, appropriate information can be provided
either by modifying the statement in such a manner to provide the
appropriate selection criteria, or by providing hints to inform the optimizer
of an alternative approach to executing the query (such as providing
hints).
Hints are like clues to a detective investigating a case. They provide
information to help the detective to complete the task more efficiently and
quickly.
One such method of looking at the execution plan generated by Oracle
is by creating an EXPLAIN PLAN. An EXPLAIN PLAN for an SQL
statement is generated using certain environmental settings such as
enabling the AUTOTRACE feature and then executing the statement. The
syntax to enable AUTOTRACE is
SET AUTOT[RACE] {OFF | ON TRACE[ONLY]} [EXP[LAIN]] [STAT[ISTICS]]
oFigure 13.10
OEM global
cache CR
request activity
chart.
546 13.5 EXPLAINPLAN

To set the AUTOTRACE feature the user is required to have the
PLUSTRACE role. In order to create the PLUSTRACE role the plustr-
ce.sql script needs to be executed as user sys. This script is located in
ORACLE_HOME/sqlplus/admin directory.
The command used to generate the EXPLAIN PLAN is
SQL> SET AUTOTRACE TRACEONLY;SQL> SET TIMING ON;
This command sets the environment conditions and required variables.
Subsequently, if the SQL statement is executed, the execution plan or
EXPLAIN PLAN for the statement is generated.
SELECT UP.USPRL_ID,UP.USPRL_FIRST_NAME,UP.USPRL_LAST_NAME,UP.USPRL_CITY,UP.USPRL_STATE_ID,UP.USPRL_LOGIN_NAME,UP.USPRL_EMAIL,UP.USPRL_PHONE,UP.USPRL_ROLE_CD,CMP.COMP_NAME,CMP.COMP_SCAC_CODE,US.USEC_TOTAL_LOGINS,UL.USRLI_ID
FROM USER_PROFILE UP,COMPANY CMP,USER_LOGIN UL,USER_SECURITY US
WHERE UL.USRLI_ACTIVE_STATUS_CD ¼ ’Active’AND UL.USRLI_LOGGED_IN_USPRL_ID ¼ UP.USPRL_IDAND UP.USPRL_COMP_ID ¼ CMP.COMP_IDAND UP.USPRL_ID ¼ US.USEC_USPRL_ID
ORDER BY CMP.COMP_TYPE_CD,CMP.COMP_NAME,UP.USPRL_LAST_NAME
Elapsed: 00:00:09.80
Execution Plan------------------------------------------------------0 SELECT STATEMENT Optimizer¼CHOOSE (Cost¼11 Card¼19 Bytes¼3078)1 0 SORT (ORDER BY) (Cost¼11 Card¼19 Bytes¼3078)2 1 TABLE ACCESS (BY GLOBAL INDEX ROWID) OF ’USER_SECURITY’ (Cost¼2
Card¼1 Bytes¼8)3 2 NESTED LOOPS (Cost¼8 Card¼19 Bytes¼3078)4 3 NESTED LOOPS (Cost¼7 Card¼19 Bytes¼2926)5 4 NESTED LOOPS (Cost¼6 Card¼19 Bytes¼2204)6 5 VIEW OF ’index$_join$_003’ (Cost¼4 Card¼19 Bytes¼342)7 6 HASH JOIN8 7 INDEX (FAST FULL SCAN) OF ’PK_USRLI’ (UNIQUE) (Cost¼3
Card¼19 Bytes¼342)
13.5 EXPLAINPLAN 547
Chapter13

9 7 INDEX (FAST FULL SCAN) OF ’USRLI_INDX1’ (NON-UNIQUE)(Cost¼3 Card¼19 Bytes¼342)
10 5 TABLE ACCESS (BY LOCAL INDEX ROWID) OF ’USER_PROFILE’(Cost¼2 Card¼1 Bytes¼98)
11 10 INDEX (UNIQUE SCAN) OF ’PK_USPRL’ (UNIQUE)12 4 TABLE ACCESS (BY LOCAL INDEX ROWID) OF ’COMPANY’ (Cost¼2
Card¼1425 Bytes¼54150)13 12 INDEX (UNIQUE SCAN) OF ’PK_COMP’ (UNIQUE)14 3 INDEX (RANGE SCAN) OF ’USEC_INDX1’ (NON-UNIQUE)
Statistics------------------------------------------------------
0 recursive calls394 db block gets
433218 consistent gets8366 physical reads
0 redo size27787 bytes sent via SQL*Net to client1007 bytes received via SQL*Net from client
34 SQL*Net roundtrips to/from client1 sorts (memory)0 sorts (disk)
487 rows processed
Note: For a detailed explanation on how to interpret the EXPLAIN PLAN
for an SQL query please refer to Metalink note number 46234.1.
13.6 SQL Trace
SQL Trace is a utility that comes bundled with the Oracle database server.
This utility is used to generate SQL Trace information while the database
is being used for a specific session. The output generated in the form of
trace files from the process contains the execution plans used by the SQL
queries. This information generated in the trace files is used to help
improve the query performance.
SQL Trace is generated at the system level by enabling an
init<SID>.ora parameter SQL_TRACE ¼ TRUE or at the session level
with the following statement:
SQL>ALTER SESSION SET SQL_TRACE ¼ TRUE;
Either method of SQL tracing generates output files for every session
containing trace information in the directory specified by the
USER_DUMP_DEST parameter.
548 13.6 SQLTrace
Setting this parameter before executing SQL queries at the session level
will generate trace files for only queries executed by this session. The files
are generated in the same user dump destination.
The trace files generated are basic raw files and not easily readable.
However, Oracle provides a utility called TKPROF, which can be utilized
to format the trace files into a more readable form using the following
command:
Usage: tkprof tracefile outputfile [explain¼ ] [table¼ ][print¼ ] [insert¼ ] [sys¼ ] [sort¼ ]
table¼schema.tablename Use ’schema.tablename’ with ’explain¼’ option.explain¼user/password Connect to ORACLE and issue EXPLAIN PLAN.print¼integer List only the first ’integer’ SQL statements.aggregate¼yes|noinsert¼filename List SQL statements and data inside INSERT statements.sys¼no TKPROF does not list SQL statements run as user SYS.record¼filename Record non-recursive statements found in the trace file.waits¼yes|no Record summary for any wait events found in the trace file.sort¼option Set of zero or more of the following sort options:prscnt number of times parse was calledprscpu cpu time parsingprsela elapsed time parsingprsdsk number of disk reads during parseprsqry number of buffers for consistent read during parseprscu number of buffers for current read during parseprsmis number of misses in library cache during parseexecnt number of execute was calledexecpu cpu time spent executingexeela elapsed time executingexedsk number of disk reads during executeexeqry number of buffers for consistent read during executeexecu number of buffers for current read during executeexerow number of rows processed during executeexemis number of library cache misses during executefchcnt number of times fetch was calledfchcpu cpu time spent fetchingfchela elapsed time fetchingfchdsk number of disk reads during fetchfchqry number of buffers for consistent read during fetchfchcu number of buffers for current read during fetchfchrow number of rows fetcheduserid userid of user that parsed the cursor
tkprof <trace filename> <output file name>, explain¼<schema name>/<password>@SID table¼<schema name>.<temp table name> <additionalparameters>
Note: A sample out can be found in the next section.
13.6 SQLTrace 549
Chapter13
13.7 Oracle event interface
SQL Trace is a simple straightforward approach to getting to the
execution plan generated by Oracle for the various SQL queries. The
information provided by these trace files is only minimal. While
SQL_TRACE is a good start to getting to the basic execution behavior, it
seldom provides any details on the actual reasons for the performance
characteristics or the reasons why the optimizer showed a specific behavior
during query execution.
Oracle provides certain events that can be enabled at the system
or session level to capture information for all sessions or at the session
level.
Event 10046
Enabling event 10046 at various levels provides varying details about
the execution plans, performance characteristics, and other related
information.
Level 1
This is enabled at the system level using the following statement:
ALTER SYSTEM SET EVENTS ‘10046 TRACE NAME CONTEXT FOREVER, LEVEL 1’;
or at the session level
ALTER SESSION SET EVENTS ‘10046 TRACE NAME CONTEXT FOREVER, LEVEL 1’
Setting event 10046 at level 1 is equivalent to setting the SQL_TRACE
parameter to TRUE in the init<SID>.ora file or enabling trace at a
session level. The output produced by this event is generated in the user
dump destination directory. The trace file could be interpreted in a more
readable format using the TKPROF similar to the SQL_TRACE feature listed
above.
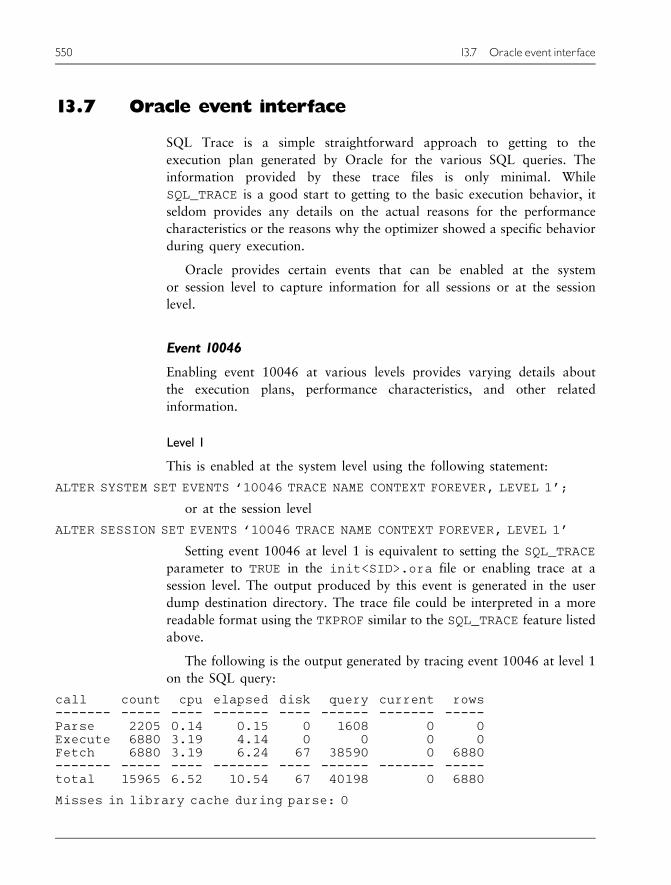
The following is the output generated by tracing event 10046 at level 1
on the SQL query:
call count cpu elapsed disk query current rows------- ----- ---- ------- ---- ------ ------- -----Parse 2205 0.14 0.15 0 1608 0 0Execute 6880 3.19 4.14 0 0 0 0Fetch 6880 3.19 6.24 67 38590 0 6880------- ----- ---- ------- ---- ------ ------- -----total 15965 6.52 10.54 67 40198 0 6880
Misses in library cache during parse: 0
550 13.7 Oracle event interface
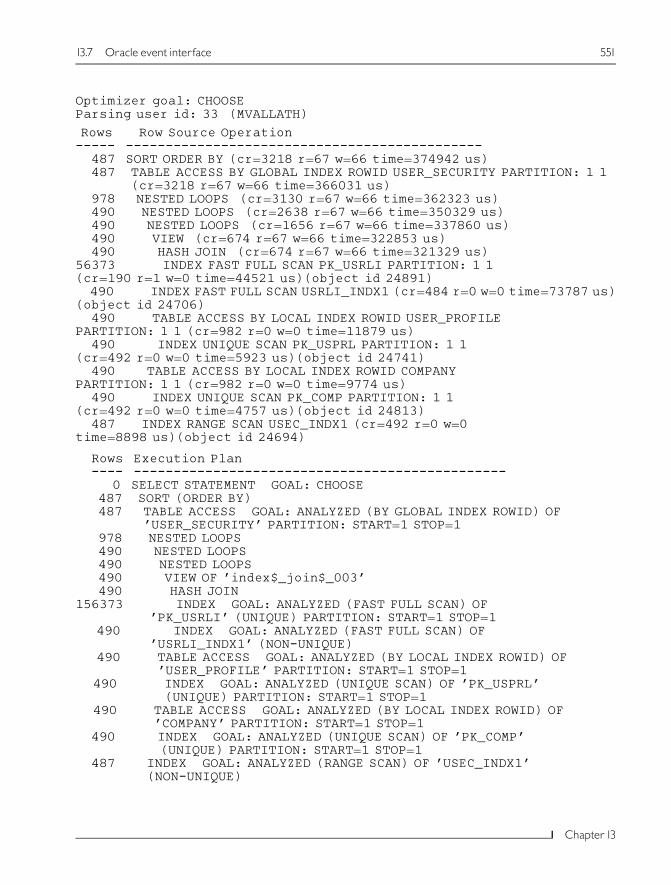
Optimizer goal: CHOOSEParsing user id: 33 (MVALLATH)
Rows Row Source Operation----- ---------------------------------------------
487 SORT ORDER BY (cr¼3218 r¼67 w¼66 time¼374942 us)487 TABLE ACCESS BY GLOBAL INDEX ROWID USER_SECURITY PARTITION: 1 1
(cr¼3218 r¼67 w¼66 time¼366031 us)978 NESTED LOOPS (cr¼3130 r¼67 w¼66 time¼362323 us)490 NESTED LOOPS (cr¼2638 r¼67 w¼66 time¼350329 us)490 NESTED LOOPS (cr¼1656 r¼67 w¼66 time¼337860 us)490 VIEW (cr¼674 r¼67 w¼66 time¼322853 us)490 HASH JOIN (cr¼674 r¼67 w¼66 time¼321329 us)
56373 INDEX FAST FULL SCAN PK_USRLI PARTITION: 1 1(cr¼190 r¼1 w¼0 time¼44521 us)(object id 24891)
490 INDEX FAST FULL SCAN USRLI_INDX1 (cr¼484 r¼0 w¼0 time¼73787 us)(object id 24706)
490 TABLE ACCESS BY LOCAL INDEX ROWID USER_PROFILEPARTITION: 1 1 (cr¼982 r¼0 w¼0 time¼11879 us)
490 INDEX UNIQUE SCAN PK_USPRL PARTITION: 1 1(cr¼492 r¼0 w¼0 time¼5923 us)(object id 24741)
490 TABLE ACCESS BY LOCAL INDEX ROWID COMPANYPARTITION: 1 1 (cr¼982 r¼0 w¼0 time¼9774 us)
490 INDEX UNIQUE SCAN PK_COMP PARTITION: 1 1(cr¼492 r¼0 w¼0 time¼4757 us)(object id 24813)
487 INDEX RANGE SCAN USEC_INDX1 (cr¼492 r¼0 w¼0time¼8898 us)(object id 24694)
Rows Execution Plan---- -----------------------------------------------
0 SELECT STATEMENT GOAL: CHOOSE487 SORT (ORDER BY)487 TABLE ACCESS GOAL: ANALYZED (BY GLOBAL INDEX ROWID) OF
’USER_SECURITY’ PARTITION: START¼1 STOP¼1978 NESTED LOOPS490 NESTED LOOPS490 NESTED LOOPS490 VIEW OF ’index$_join$_003’490 HASH JOIN
156373 INDEX GOAL: ANALYZED (FAST FULL SCAN) OF’PK_USRLI’ (UNIQUE) PARTITION: START¼1 STOP¼1
490 INDEX GOAL: ANALYZED (FAST FULL SCAN) OF’USRLI_INDX1’ (NON-UNIQUE)
490 TABLE ACCESS GOAL: ANALYZED (BY LOCAL INDEX ROWID) OF’USER_PROFILE’ PARTITION: START¼1 STOP¼1
490 INDEX GOAL: ANALYZED (UNIQUE SCAN) OF ’PK_USPRL’(UNIQUE) PARTITION: START¼1 STOP¼1
490 TABLE ACCESS GOAL: ANALYZED (BY LOCAL INDEX ROWID) OF’COMPANY’ PARTITION: START¼1 STOP¼1
490 INDEX GOAL: ANALYZED (UNIQUE SCAN) OF ’PK_COMP’(UNIQUE) PARTITION: START¼1 STOP¼1
487 INDEX GOAL: ANALYZED (RANGE SCAN) OF ’USEC_INDX1’(NON-UNIQUE)
13.7 Oracle event interface 551
Chapter13
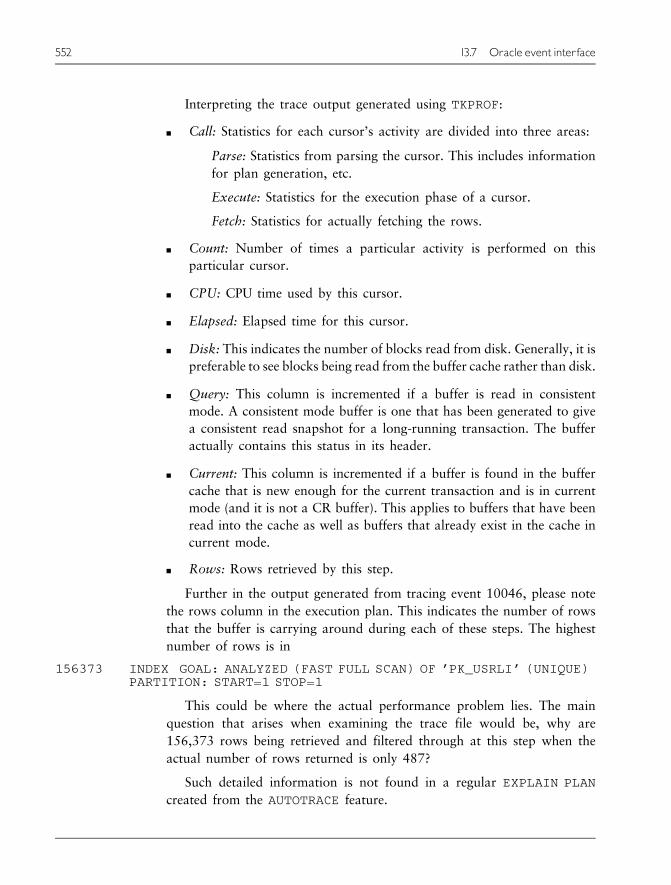
Interpreting the trace output generated using TKPROF:
n Call: Statistics for each cursor’s activity are divided into three areas:
Parse: Statistics from parsing the cursor. This includes information
for plan generation, etc.
Execute: Statistics for the execution phase of a cursor.
Fetch: Statistics for actually fetching the rows.
n Count: Number of times a particular activity is performed on this
particular cursor.
n CPU: CPU time used by this cursor.
n Elapsed: Elapsed time for this cursor.
n Disk: This indicates the number of blocks read from disk. Generally, it is
preferable to see blocks being read from the buffer cache rather than disk.
n Query: This column is incremented if a buffer is read in consistent
mode. A consistent mode buffer is one that has been generated to give
a consistent read snapshot for a long-running transaction. The buffer
actually contains this status in its header.
n Current: This column is incremented if a buffer is found in the buffer
cache that is new enough for the current transaction and is in current
mode (and it is not a CR buffer). This applies to buffers that have been
read into the cache as well as buffers that already exist in the cache in
current mode.
n Rows: Rows retrieved by this step.
Further in the output generated from tracing event 10046, please note
the rows column in the execution plan. This indicates the number of rows
that the buffer is carrying around during each of these steps. The highest
number of rows is in
156373 INDEX GOAL: ANALYZED (FAST FULL SCAN) OF ’PK_USRLI’ (UNIQUE)PARTITION: START¼1 STOP¼1
This could be where the actual performance problem lies. The main
question that arises when examining the trace file would be, why are
156,373 rows being retrieved and filtered through at this step when the
actual number of rows returned is only 487?
Such detailed information is not found in a regular EXPLAIN PLAN
created from the AUTOTRACE feature.
552 13.7 Oracle event interface
Level 4
Level 1 tracing of event 10046 provides the basic SQL queries; sometimes
to re-create the issue or to re-execute the query, these basic raw queries
and their EXPLAIN PLAN(s) are not sufficient, especially if the query is
using bind variables. Using bind variables is an excellent practice and
should be in the best practices guide of the organization. For debugging
and query tuning purposes it would be helpful to determine the values
used during the query execution. To determine the bind variables and the
corresponding bind values, event 10046 at level 4 would capture the
information.
Similar to level 1, level 4 can be enabled at the system or session level
using the following statements:
ALTER SYSTEM SET EVENTS ‘10046 TRACE NAME CONTEXT FOREVER, LEVEL 4’;ALTER SESSION SET EVENTS ‘10046 TRACE NAME CONTEXT FOREVER, LEVEL 4’;
Level 8
Many times the query performs poorly due to several reasons other than
the way in which the query is written. For example, slow performance
could be due to the way the table has been stored on disk, poor distribution
of data on the disk, too many tables sharing the same data files, data
heavily scattered, or because the query is performing full table scans.
There are no other reasons for the slow performance; however, the
EXPLAIN PLAN(s) generated by the previous methods do not provide
the actual reasons for the slowness. Under such circumstances, it would
be good to enable event 10046 at level 8 to capture the additional
information.
Similar to level 1 and level 4, level 8 can be enabled at the system or
session levels through the following statements:
ALTER SYSTEM SET EVENTS ‘10046 TRACE NAME CONTEXT FOREVER, LEVEL 8’;ALTER SESSION SET EVENTS ‘10046 TRACE NAME CONTEXT FOREVER, LEVEL 8’;
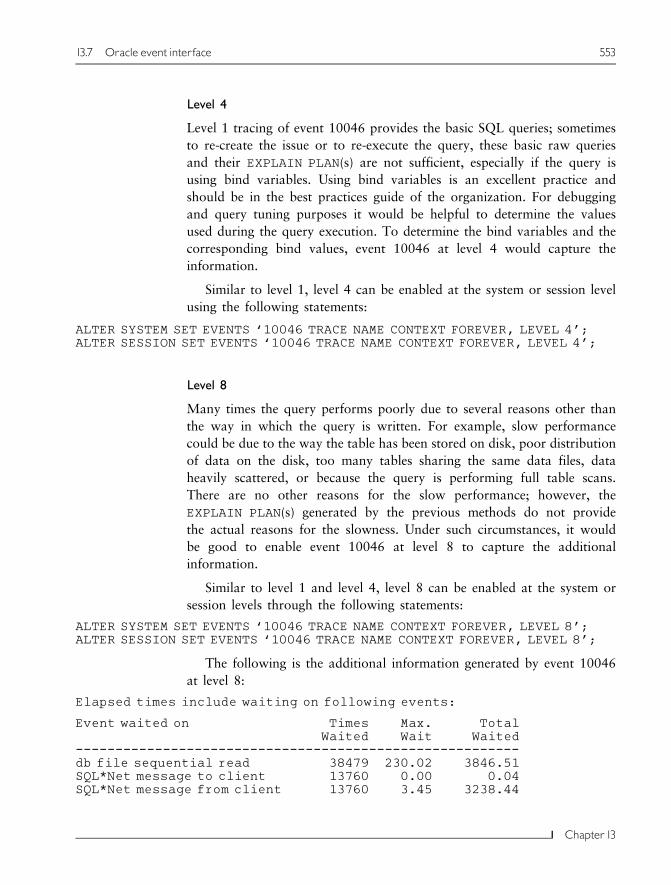
The following is the additional information generated by event 10046
at level 8:
Elapsed times include waiting on following events:
Event waited on TimesWaited
Max.Wait
TotalWaited
--------------------------------------------------------db file sequential read 38479 230.02 3846.51SQL*Net message to client 13760 0.00 0.04SQL*Net message from client 13760 3.45 3238.44
13.7 Oracle event interface 553
Chapter13
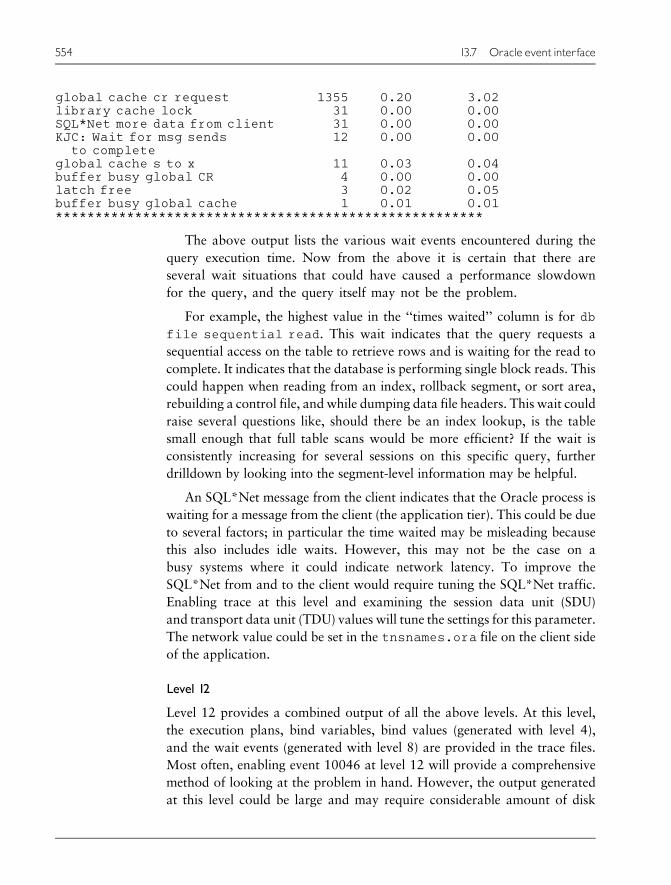
global cache cr request 1355 0.20 3.02library cache lock 31 0.00 0.00SQL*Net more data from client 31 0.00 0.00KJC: Wait for msg sends
to complete12 0.00 0.00
global cache s to x 11 0.03 0.04buffer busy global CR 4 0.00 0.00latch free 3 0.02 0.05buffer busy global cache 1 0.01 0.01******************************************************
The above output lists the various wait events encountered during the
query execution time. Now from the above it is certain that there are
several wait situations that could have caused a performance slowdown
for the query, and the query itself may not be the problem.
For example, the highest value in the ‘‘times waited’’ column is for db
file sequential read. This wait indicates that the query requests a
sequential access on the table to retrieve rows and is waiting for the read to
complete. It indicates that the database is performing single block reads. This
could happen when reading from an index, rollback segment, or sort area,
rebuilding a control file, and while dumping data file headers. This wait could
raise several questions like, should there be an index lookup, is the table
small enough that full table scans would be more efficient? If the wait is
consistently increasing for several sessions on this specific query, further
drilldown by looking into the segment-level information may be helpful.
An SQL*Net message from the client indicates that the Oracle process is
waiting for a message from the client (the application tier). This could be due
to several factors; in particular the time waited may be misleading because
this also includes idle waits. However, this may not be the case on a
busy systems where it could indicate network latency. To improve the
SQL*Net from and to the client would require tuning the SQL*Net traffic.
Enabling trace at this level and examining the session data unit (SDU)
and transport data unit (TDU) values will tune the settings for this parameter.
The network value could be set in the tnsnames.ora file on the client side
of the application.
Level 12
Level 12 provides a combined output of all the above levels. At this level,
the execution plans, bind variables, bind values (generated with level 4),
and the wait events (generated with level 8) are provided in the trace files.
Most often, enabling event 10046 at level 12 will provide a comprehensive
method of looking at the problem in hand. However, the output generated
at this level could be large and may require considerable amount of disk
554 13.7 Oracle event interface

space. Enabling a trace at this level should be done only after ensuring
sufficient space is available.
Similar to the other levels, level 12 can be enabled at the system or
session levels through the following statements:
ALTER SYSTEM SET EVENTS ‘10046 TRACE NAME CONTEXT FOREVER, LEVEL 12’;ALTER SESSION SET EVENTS ‘10046 TRACE NAME CONTEXT FOREVER, LEVEL 12’;
Event 10053
Many times, when the query is being tuned for performance and after
generating the EXPLAIN PLAN, trace files, turning on event 10046,
looking at wait statistics, etc., the following questions arise during the
query tuning or application execution process. Why is the execution plan
being generated in this fashion? Why is the runtime performance different
from interactive performance?
Under these circumstances, if the database has been configured to use
the CBO, event 10053 will capture the actual steps that the CBO has
taken to generate the execution plan.
Enabling event 10053 is similar to enabling any other event, that is, by
using an ALTER SYSTEM or ALTER SESSION statement. However, unlike
event 10046 that was discussed in the previous section, event 10053 can
generate trace information only at two levels, level 1 and level 2:
ALTER SYSTEM SET EVENTS ‘10053 TRACE NAME CONTEXT FOREVER, LEVEL 1’;ALTER SESSION SET EVENTS ‘10053 TRACE NAME CONTEXT FOREVER, LEVEL 2’;
The following is a partial output of the optimizer behavior generated
from event 10053 at level 1:
***************************************OPTIMIZER STATISTICS AND COMPUTATIONS
***************************************GENERAL PLANS
***********************Join order[1]: USER_LOGIN [UL] COMPANY [CMP] USER_PROFILE [UP]
USER_SECURITY [US]Now joining: COMPANY [CMP] *******NL JoinOuter table: cost: 4 cdn: 19 rcz: 18 resp: 4Inner table: COMPANYAccess path: tsc Resc: 11Join: Resc: 213 Resp: 213
Join cardinality: 27075 ¼ outer (19) * inner (1425) * sel (1.0000eþ00)[flag¼0]
Best NL cost: 214 resp: 213Join result: cost: 214 cdn: 27075 rcz: 56
13.7 Oracle event interface 555
Chapter13

Now joining: USER_PROFILE [UP] *******NL JoinOuter table: cost: 214 cdn: 27075 rcz: 56 resp: 213Inner table: USER_PROFILE
Access path: tsc Resc: 11Join: Resc: 298038 Resp: 298038
OPTIMIZER PERCENT INDEX CACHING ¼ 90Access path: index (unique)
Index: PK_USPRLTABLE: USER_PROFILE
RSC_CPU: 0 RSC_IO: 1IX_SEL: 6.4350e-04 TB_SEL: 6.4350e-04
Join: resc: 1567 resp: 1567OPTIMIZER PERCENT INDEX CACHING ¼ 90Access path: index (join index)
Index: USPRL_INDX1TABLE: USER_PROFILE
RSC_CPU: 0 RSC_IO: 2IX_SEL: 0.0000eþ00 TB_SEL: 3.0581e-03
Join: resc: 2921 resp: 2921OPTIMIZER PERCENT INDEX CACHING ¼ 90Access path: index (eq-unique)
Index: PK_USPRLTABLE: USER_PROFILE
RSC_CPU: 0 RSC_IO: 1IX_SEL: 0.0000eþ00 TB_SEL: 0.0000eþ00
Join: resc: 1567 resp: 1567Join cardinality: 19 ¼ outer (27075) * inner (1554) * sel (4.5158e-07)
[flag¼0]Best NL cost: 1567 resp: 1567
SM JoinOuter table:
resc: 213 cdn: 27075 rcz: 56 deg: 1 resp: 213Inner table: USER_PROFILE
resc: 11 cdn: 1554 rcz: 98 deg: 1 resp: 11using join:1 distribution:2 #groups:1SORT resource Sort statisticsSort width: 29 Area size: 712704 Max Area size: 712704
Degree: 1Blocks to Sort: 239 Row size: 72 Rows: 27075Initial runs: 3 Merge passes: 1 IO Cost / pass: 284Total IO sort cost: 262Total CPU sort cost: 0Total Temp space used: 3711000
SORT resource Sort statisticsSort width: 29 Area size: 712704 Max Area size: 712704 Degree: 1Blocks to Sort: 23 Row size: 118 Rows: 1554Initial runs: 1 Merge passes: 1 IO Cost / pass: 28Total IO sort cost: 26Total CPU sort cost: 0Total Temp space used: 0
Merge join Cost: 511 Resp: 511HA Join
556 13.7 Oracle event interface
Outer table:resc: 213 cdn: 27075 rcz: 56 deg: 1 resp: 213
Inner table: USER_PROFILEresc: 11 cdn: 1554 rcz: 98 deg: 1 resp: 11using join:8 distribution:2 #groups:1
Hash join one ptn Resc: 68 Deg: 1 (sides swapped)hash_area: 256 (max¼256) buildfrag: 257 probefrag: 21 ppasses: 2
Hash join Resc: 292 Resp: 292Outer table:resc: 11 cdn: 1554 rcz: 98 deg: 1 resp: 11
Inner table: COMPANYresc: 213 cdn: 27075 rcz: 56 deg: 1 resp: 213using join:8 distribution:2 #groups:1
Hash join one ptn Resc: 8 Deg: 1hash_area: 256 (max¼256) buildfrag: 257 probefrag: 225 ppasses: 2
Hash join Resc: 232 Resp: 232Join result: cost: 233 cdn: 19 rcz: 154Now joining: USER_SECURITY [US] *******NL JoinOuter table: cost: 233 cdn: 19 rcz: 154 resp: 232Inner table: USER_SECURITYAccess path: tsc Resc: 11Join: Resc: 441 Resp: 441
OPTIMIZER PERCENT INDEX CACHING ¼ 90Access path: index (join index)Index: USEC_INDX1
TABLE: USER_SECURITYRSC_CPU: 0 RSC_IO: 1
IX_SEL: 0.0000eþ00 TB_SEL: 6.4893e-04Join: resc: 233 resp: 233
Join cardinality: 19 ¼ outer (19) * inner (1559) * sel (6.4893e-04)[flag¼0]
Best NL cost: 234 resp: 233SM JoinOuter table:resc: 232 cdn: 19 rcz: 154 deg: 1 resp: 232
Inner table: USER_SECURITYresc: 11 cdn: 1559 rcz: 8 deg: 1 resp: 11using join:1 distribution:2 #groups:1SORT resource Sort statistics
Sort width: 29 Area size: 712704 Max Area size: 712704 Degree: 1Blocks to Sort: 1 Row size: 180 Rows: 19Initial runs: 1 Merge passes: 1 IO Cost / pass: 6Total IO sort cost: 4Total CPU sort cost: 0Total Temp space used: 0
SORT resource Sort statisticsSort width: 29 Area size: 712704 Max Area size: 712704 Degree: 1Blocks to Sort: 4 Row size: 19 Rows: 1559Initial runs: 1 Merge passes: 1 IO Cost / pass: 9Total IO sort cost: 6Total CPU sort cost: 0Total Temp space used: 0
13.7 Oracle event interface 557
Chapter13
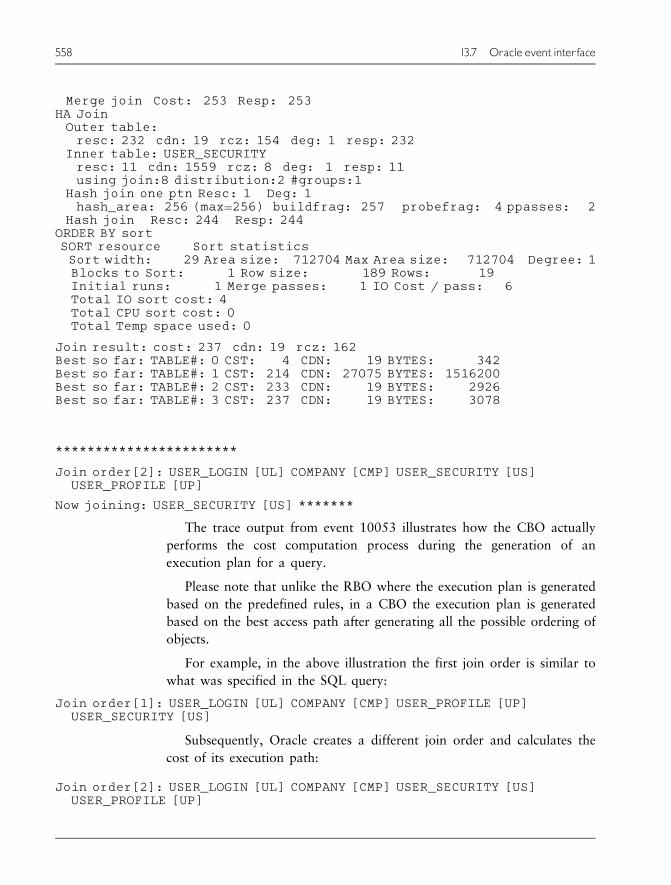
Merge join Cost: 253 Resp: 253HA JoinOuter table:
resc: 232 cdn: 19 rcz: 154 deg: 1 resp: 232Inner table: USER_SECURITY
resc: 11 cdn: 1559 rcz: 8 deg: 1 resp: 11using join:8 distribution:2 #groups:1
Hash join one ptn Resc: 1 Deg: 1hash_area: 256 (max¼256) buildfrag: 257 probefrag: 4 ppasses: 2
Hash join Resc: 244 Resp: 244ORDER BY sortSORT resource Sort statisticsSort width: 29 Area size: 712704 Max Area size: 712704 Degree: 1Blocks to Sort: 1 Row size: 189 Rows: 19Initial runs: 1 Merge passes: 1 IO Cost / pass: 6Total IO sort cost: 4Total CPU sort cost: 0Total Temp space used: 0
Join result: cost: 237 cdn: 19 rcz: 162Best so far: TABLE#: 0 CST: 4 CDN: 19 BYTES: 342Best so far: TABLE#: 1 CST: 214 CDN: 27075 BYTES: 1516200Best so far: TABLE#: 2 CST: 233 CDN: 19 BYTES: 2926Best so far: TABLE#: 3 CST: 237 CDN: 19 BYTES: 3078
***********************
Join order[2]: USER_LOGIN [UL] COMPANY [CMP] USER_SECURITY [US]USER_PROFILE [UP]
Now joining: USER_SECURITY [US] *******
The trace output from event 10053 illustrates how the CBO actually
performs the cost computation process during the generation of an
execution plan for a query.
Please note that unlike the RBO where the execution plan is generated
based on the predefined rules, in a CBO the execution plan is generated
based on the best access path after generating all the possible ordering of
objects.
For example, in the above illustration the first join order is similar to
what was specified in the SQL query:
Join order[1]: USER_LOGIN [UL] COMPANY [CMP] USER_PROFILE [UP]USER_SECURITY [US]
Subsequently, Oracle creates a different join order and calculates the
cost of its execution path:
Join order[2]: USER_LOGIN [UL] COMPANY [CMP] USER_SECURITY [US]USER_PROFILE [UP]
558 13.7 Oracle event interface

For every join operation, Oracle computes the cost of accessing the
rows for a nested loop join (NL join), sort merge join (SM join), and hash
join (HA join) operation.
For example, from the illustration above:
NL JoinOuter table: cost: 4 cdn: 19 rcz: 18 resp: 4Inner table: COMPANYAccess path: tsc Resc: 11Join: Resc: 213 Resp: 213
Join cardinality: 27075 ¼ outer (19) * inner (1425) * sel (1.0000eþ00)[flag¼0]
From these three access methods, Oracle selects the operation that takes
the least cost for execution. This is illustrated below by the ‘‘best so far’’
entry after each join order cost computation.
Best so far: TABLE#: 0 CST: 4 CDN: 19 BYTES: 342Best so far: TABLE#: 1 CST: 214 CDN: 27075 BYTES: 1516200Best so far: TABLE#: 2 CST: 233 CDN: 19 BYTES: 2926Best so far: TABLE#: 3 CST: 237 CDN: 19 BYTES: 3078
For the query used in this illustration, Oracle created 14 different join
order checks. However, if the best cost computed for a specific join order
is not better than the previous, Oracle does not calculate the best cost for
that specific join order.
Note: In complex queries where there are several tables being joined,
Oracle has to compute join orders for all possible table combinations,
which could be time consuming. If queries are not being reused, for example
when literals are used instead of bind variables, Oracle has to compute
these join orders every single time and could create several performance
problems.
Similarly, to avoid several join orders in a complex query with several table
joins, the /*ORDERED*/ hint becomes very helpful. This hint will enforce the
join order and based on the hint Oracle will use the user specified join order
for query execution.
13.8 Oracle’s Wait interface
In the STATSPACK report discussions above, we mentioned the top 5
waits encountered by the database/application during a specific snapshot
13.8 Oracle’sWait interface 559
Chapter13
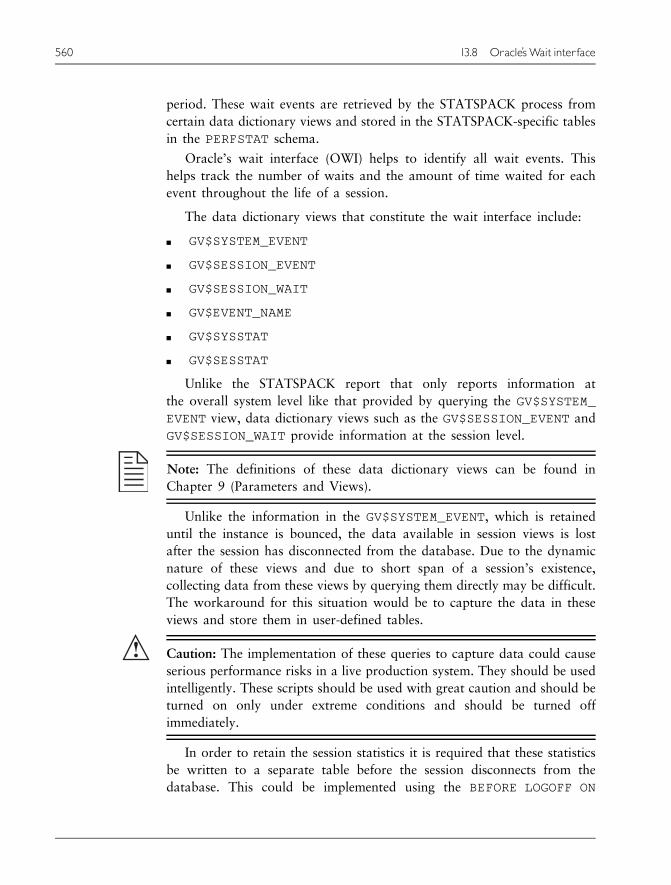
period. These wait events are retrieved by the STATSPACK process from
certain data dictionary views and stored in the STATSPACK-specific tables
in the PERFSTAT schema.
Oracle’s wait interface (OWI) helps to identify all wait events. This
helps track the number of waits and the amount of time waited for each
event throughout the life of a session.
The data dictionary views that constitute the wait interface include:
n GV$SYSTEM_EVENT
n GV$SESSION_EVENT
n GV$SESSION_WAIT
n GV$EVENT_NAME
n GV$SYSSTAT
n GV$SESSTAT
Unlike the STATSPACK report that only reports information at
the overall system level like that provided by querying the GV$SYSTEM_
EVENT view, data dictionary views such as the GV$SESSION_EVENT and
GV$SESSION_WAIT provide information at the session level.
Note: The definitions of these data dictionary views can be found in
Chapter 9 (Parameters and Views).
Unlike the information in the GV$SYSTEM_EVENT, which is retained
until the instance is bounced, the data available in session views is lost
after the session has disconnected from the database. Due to the dynamic
nature of these views and due to short span of a session’s existence,
collecting data from these views by querying them directly may be difficult.
The workaround for this situation would be to capture the data in these
views and store them in user-defined tables.
Caution: The implementation of these queries to capture data could cause
serious performance risks in a live production system. They should be used
intelligently. These scripts should be used with great caution and should be
turned on only under extreme conditions and should be turned off
immediately.
In order to retain the session statistics it is required that these statistics
be written to a separate table before the session disconnects from the
database. This could be implemented using the BEFORE LOGOFF ON
560 13.8 Oracle’sWait interface
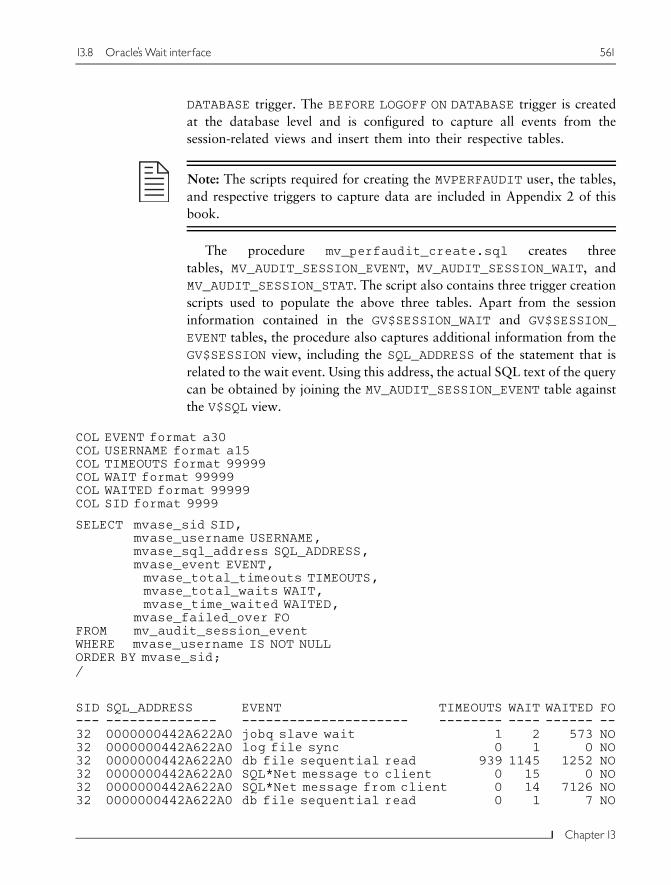
DATABASE trigger. The BEFORE LOGOFF ON DATABASE trigger is created
at the database level and is configured to capture all events from the
session-related views and insert them into their respective tables.
Note: The scripts required for creating the MVPERFAUDIT user, the tables,
and respective triggers to capture data are included in Appendix 2 of this
book.
The procedure mv_perfaudit_create.sql creates three
tables, MV_AUDIT_SESSION_EVENT, MV_AUDIT_SESSION_WAIT, and
MV_AUDIT_SESSION_STAT. The script also contains three trigger creation
scripts used to populate the above three tables. Apart from the session
information contained in the GV$SESSION_WAIT and GV$SESSION_
EVENT tables, the procedure also captures additional information from the
GV$SESSION view, including the SQL_ADDRESS of the statement that is
related to the wait event. Using this address, the actual SQL text of the query
can be obtained by joining the MV_AUDIT_SESSION_EVENT table against
the V$SQL view.
COL EVENT format a30COL USERNAME format a15COL TIMEOUTS format 99999COL WAIT format 99999COL WAITED format 99999COL SID format 9999
SELECT mvase_sid SID,mvase_username USERNAME,mvase_sql_address SQL_ADDRESS,mvase_event EVENT,mvase_total_timeouts TIMEOUTS,mvase_total_waits WAIT,mvase_time_waited WAITED,
mvase_failed_over FOFROM mv_audit_session_eventWHERE mvase_username IS NOT NULLORDER BY mvase_sid;/
SID SQL_ADDRESS EVENT TIMEOUTS WAIT WAITED FO--- -------------- --------------------- -------- ---- ------ --32 0000000442A622A0 jobq slave wait 1 2 573 NO32 0000000442A622A0 log file sync 0 1 0 NO32 0000000442A622A0 db file sequential read 939 1145 1252 NO32 0000000442A622A0 SQL*Net message to client 0 15 0 NO32 0000000442A622A0 SQL*Net message from client 0 14 7126 NO32 0000000442A622A0 db file sequential read 0 1 7 NO
13.8 Oracle’sWait interface 561
Chapter13
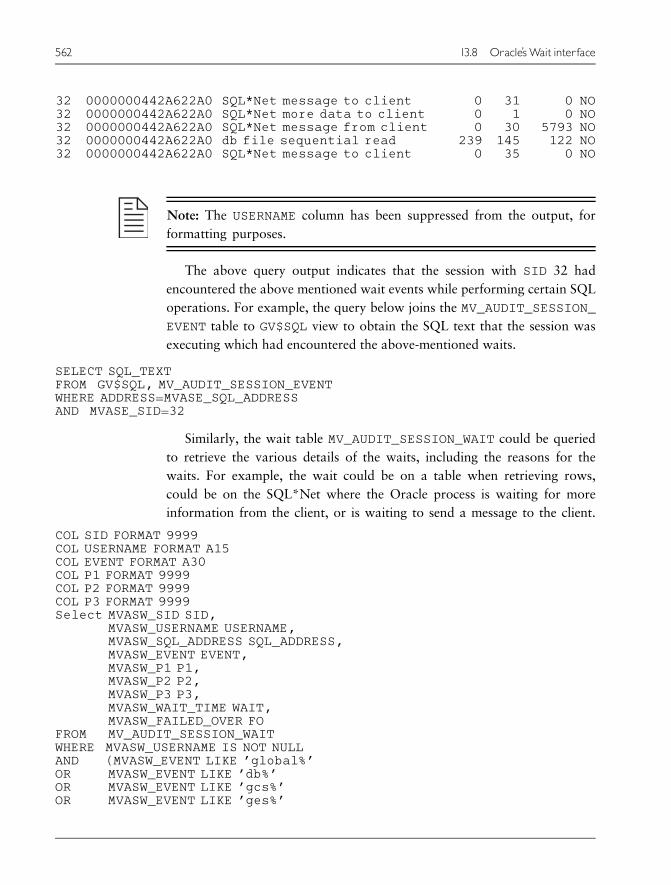
Note: The USERNAME column has been suppressed from the output, for
formatting purposes.
The above query output indicates that the session with SID 32 had
encountered the above mentioned wait events while performing certain SQL
operations. For example, the query below joins the MV_AUDIT_SESSION_
EVENT table to GV$SQL view to obtain the SQL text that the session was
executing which had encountered the above-mentioned waits.
SELECT SQL_TEXTFROM GV$SQL, MV_AUDIT_SESSION_EVENTWHERE ADDRESS¼MVASE_SQL_ADDRESSAND MVASE_SID¼32
Similarly, the wait table MV_AUDIT_SESSION_WAIT could be queried
to retrieve the various details of the waits, including the reasons for the
waits. For example, the wait could be on a table when retrieving rows,
could be on the SQL*Net where the Oracle process is waiting for more
information from the client, or is waiting to send a message to the client.
COL SID FORMAT 9999COL USERNAME FORMAT A15COL EVENT FORMAT A30COL P1 FORMAT 9999COL P2 FORMAT 9999COL P3 FORMAT 9999Select MVASW_SID SID,
MVASW_USERNAME USERNAME,MVASW_SQL_ADDRESS SQL_ADDRESS,MVASW_EVENT EVENT,MVASW_P1 P1,MVASW_P2 P2,MVASW_P3 P3,MVASW_WAIT_TIME WAIT,MVASW_FAILED_OVER FO
FROM MV_AUDIT_SESSION_WAITWHERE MVASW_USERNAME IS NOT NULLAND (MVASW_EVENT LIKE ’global%’OR MVASW_EVENT LIKE ’db%’OR MVASW_EVENT LIKE ’gcs%’OR MVASW_EVENT LIKE ’ges%’
32 0000000442A622A0 SQL*Net message to client 0 31 0 NO32 0000000442A622A0 SQL*Net more data to client 0 1 0 NO32 0000000442A622A0 SQL*Net message from client 0 30 5793 NO32 0000000442A622A0 db file sequential read 239 145 122 NO32 0000000442A622A0 SQL*Net message to client 0 35 0 NO
562 13.8 Oracle’sWait interface
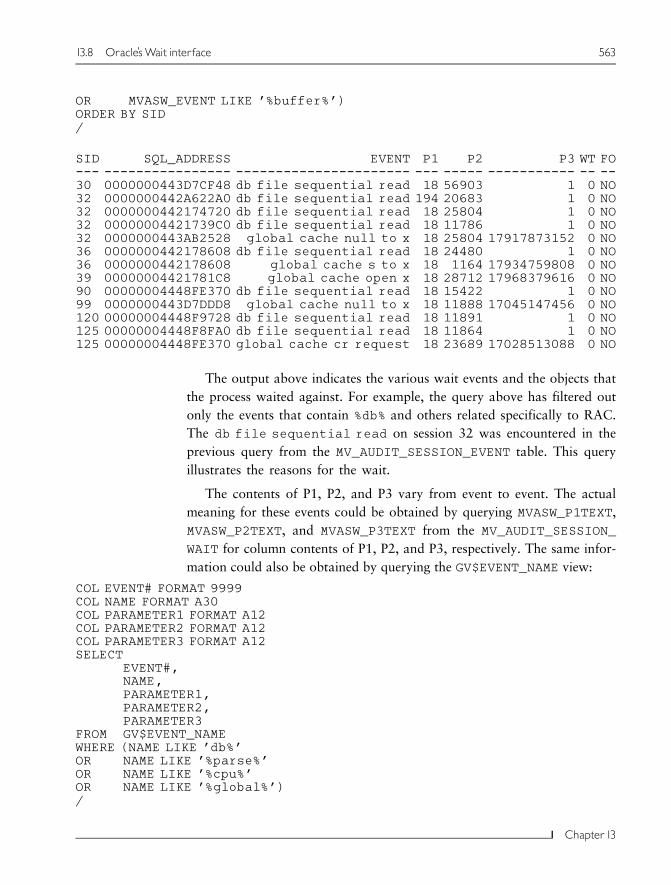
OR MVASW_EVENT LIKE ’%buffer%’)ORDER BY SID/
The output above indicates the various wait events and the objects that
the process waited against. For example, the query above has filtered out
only the events that contain %db% and others related specifically to RAC.
The db file sequential read on session 32 was encountered in the
previous query from the MV_AUDIT_SESSION_EVENT table. This query
illustrates the reasons for the wait.
The contents of P1, P2, and P3 vary from event to event. The actual
meaning for these events could be obtained by querying MVASW_P1TEXT,
MVASW_P2TEXT, and MVASW_P3TEXT from the MV_AUDIT_SESSION_
WAIT for column contents of P1, P2, and P3, respectively. The same infor-
mation could also be obtained by querying the GV$EVENT_NAME view:
COL EVENT# FORMAT 9999COL NAME FORMAT A30COL PARAMETER1 FORMAT A12COL PARAMETER2 FORMAT A12COL PARAMETER3 FORMAT A12SELECT
EVENT#,NAME,PARAMETER1,PARAMETER2,PARAMETER3
FROM GV$EVENT_NAMEWHERE (NAME LIKE ’db%’OR NAME LIKE ’%parse%’OR NAME LIKE ’%cpu%’OR NAME LIKE ’%global%’)/
SID SQL_ADDRESS EVENT P1 P2 P3 WT FO--- ---------------- ---------------------- --- ----- ----------- -- --30 0000000443D7CF48 db file sequential read 18 56903 1 0 NO32 0000000442A622A0 db file sequential read 194 20683 1 0 NO32 0000000442174720 db file sequential read 18 25804 1 0 NO32 00000004421739C0 db file sequential read 18 11786 1 0 NO32 0000000443AB2528 global cache null to x 18 25804 17917873152 0 NO36 0000000442178608 db file sequential read 18 24480 1 0 NO36 0000000442178608 global cache s to x 18 1164 17934759808 0 NO39 00000004421781C8 global cache open x 18 28712 17968379616 0 NO90 00000004448FE370 db file sequential read 18 15422 1 0 NO99 0000000443D7DDD8 global cache null to x 18 11888 17045147456 0 NO120 00000004448F9728 db file sequential read 18 11891 1 0 NO125 00000004448F8FA0 db file sequential read 18 11864 1 0 NO125 00000004448FE370 global cache cr request 18 23689 17028513088 0 NO
13.8 Oracle’sWait interface 563
Chapter13
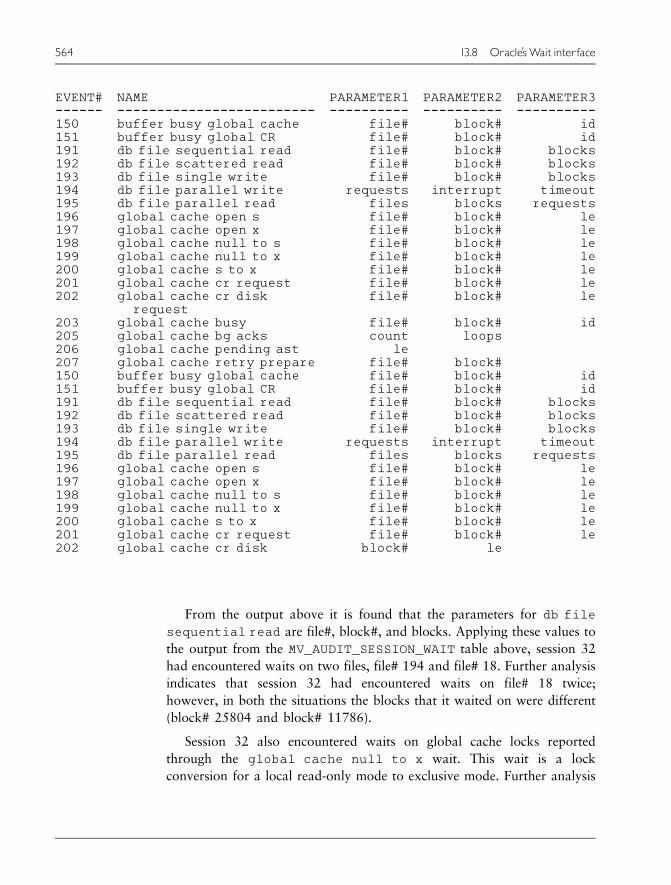
From the output above it is found that the parameters for db file
sequential read are file#, block#, and blocks. Applying these values to
the output from the MV_AUDIT_SESSION_WAIT table above, session 32
had encountered waits on two files, file# 194 and file# 18. Further analysis
indicates that session 32 had encountered waits on file# 18 twice;
however, in both the situations the blocks that it waited on were different
(block# 25804 and block# 11786).
Session 32 also encountered waits on global cache locks reported
through the global cache null to x wait. This wait is a lock
conversion for a local read-only mode to exclusive mode. Further analysis
EVENT# NAME PARAMETER1 PARAMETER2 PARAMETER3------ ------------------------- ---------- ---------- ----------150 buffer busy global cache file# block# id151 buffer busy global CR file# block# id191 db file sequential read file# block# blocks192 db file scattered read file# block# blocks193 db file single write file# block# blocks194 db file parallel write requests interrupt timeout195 db file parallel read files blocks requests196 global cache open s file# block# le197 global cache open x file# block# le198 global cache null to s file# block# le199 global cache null to x file# block# le200 global cache s to x file# block# le201 global cache cr request file# block# le202 global cache cr disk
requestfile# block# le
203 global cache busy file# block# id205 global cache bg acks count loops206 global cache pending ast le207 global cache retry prepare file# block#150 buffer busy global cache file# block# id151 buffer busy global CR file# block# id191 db file sequential read file# block# blocks192 db file scattered read file# block# blocks193 db file single write file# block# blocks194 db file parallel write requests interrupt timeout195 db file parallel read files blocks requests196 global cache open s file# block# le197 global cache open x file# block# le198 global cache null to s file# block# le199 global cache null to x file# block# le200 global cache s to x file# block# le201 global cache cr request file# block# le202 global cache cr disk block# le
564 13.8 Oracle’sWait interface
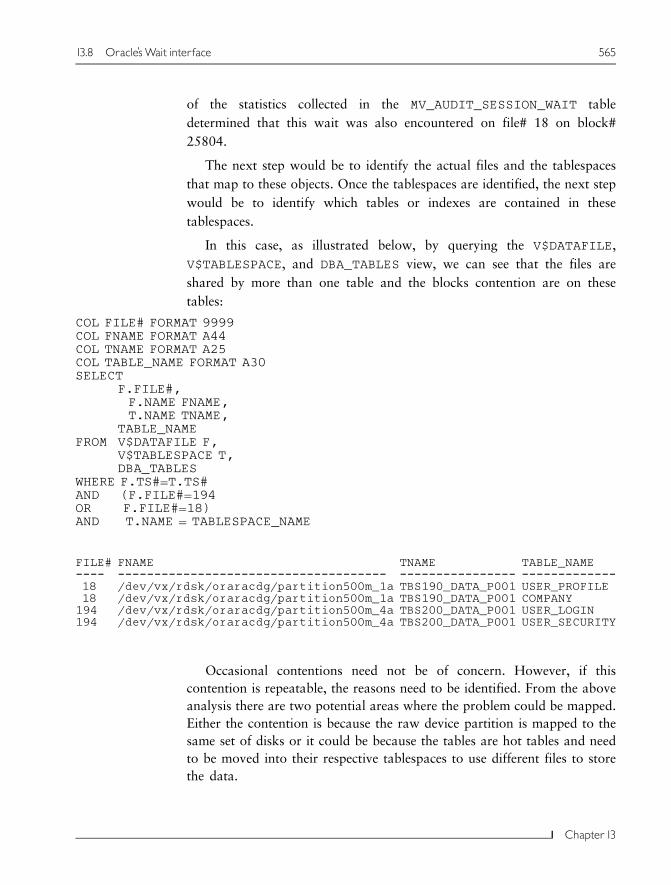
of the statistics collected in the MV_AUDIT_SESSION_WAIT table
determined that this wait was also encountered on file# 18 on block#
25804.
The next step would be to identify the actual files and the tablespaces
that map to these objects. Once the tablespaces are identified, the next step
would be to identify which tables or indexes are contained in these
tablespaces.
In this case, as illustrated below, by querying the V$DATAFILE,
V$TABLESPACE, and DBA_TABLES view, we can see that the files are
shared by more than one table and the blocks contention are on these
tables:
COL FILE# FORMAT 9999COL FNAME FORMAT A44COL TNAME FORMAT A25COL TABLE_NAME FORMAT A30SELECT
F.FILE#,F.NAME FNAME,T.NAME TNAME,
TABLE_NAMEFROM V$DATAFILE F,
V$TABLESPACE T,DBA_TABLES
WHERE F.TS#¼T.TS#AND (F.FILE#¼194OR F.FILE#¼18)AND T.NAME ¼ TABLESPACE_NAME
Occasional contentions need not be of concern. However, if this
contention is repeatable, the reasons need to be identified. From the above
analysis there are two potential areas where the problem could be mapped.
Either the contention is because the raw device partition is mapped to the
same set of disks or it could be because the tables are hot tables and need
to be moved into their respective tablespaces to use different files to store
the data.
FILE# FNAME TNAME TABLE_NAME---- ------------------------------------- ---------------- -------------18 /dev/vx/rdsk/oraracdg/partition500m_1a TBS190_DATA_P001 USER_PROFILE18 /dev/vx/rdsk/oraracdg/partition500m_1a TBS190_DATA_P001 COMPANY
194 /dev/vx/rdsk/oraracdg/partition500m_4a TBS200_DATA_P001 USER_LOGIN194 /dev/vx/rdsk/oraracdg/partition500m_4a TBS200_DATA_P001 USER_SECURITY
13.8 Oracle’sWait interface 565
Chapter13
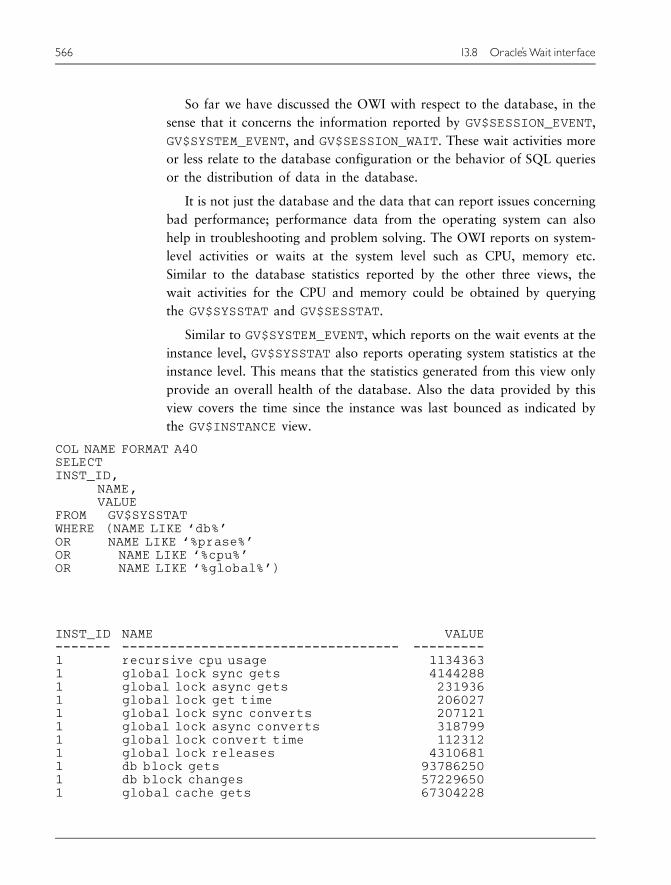
So far we have discussed the OWI with respect to the database, in the
sense that it concerns the information reported by GV$SESSION_EVENT,
GV$SYSTEM_EVENT, and GV$SESSION_WAIT. These wait activities more
or less relate to the database configuration or the behavior of SQL queries
or the distribution of data in the database.
It is not just the database and the data that can report issues concerning
bad performance; performance data from the operating system can also
help in troubleshooting and problem solving. The OWI reports on system-
level activities or waits at the system level such as CPU, memory etc.
Similar to the database statistics reported by the other three views, the
wait activities for the CPU and memory could be obtained by querying
the GV$SYSSTAT and GV$SESSTAT.
Similar to GV$SYSTEM_EVENT, which reports on the wait events at the
instance level, GV$SYSSTAT also reports operating system statistics at the
instance level. This means that the statistics generated from this view only
provide an overall health of the database. Also the data provided by this
view covers the time since the instance was last bounced as indicated by
the GV$INSTANCE view.
COL NAME FORMAT A40SELECTINST_ID,
NAME,VALUE
FROM GV$SYSSTATWHERE (NAME LIKE ‘db%’OR NAME LIKE ‘%prase%’OR NAME LIKE ‘%cpu%’OR NAME LIKE ‘%global%’)
INST_ID NAME VALUE------- ----------------------------------- ---------1 recursive cpu usage 11343631 global lock sync gets 41442881 global lock async gets 2319361 global lock get time 2060271 global lock sync converts 2071211 global lock async converts 3187991 global lock convert time 1123121 global lock releases 43106811 db block gets 937862501 db block changes 572296501 global cache gets 67304228
566 13.8 Oracle’sWait interface
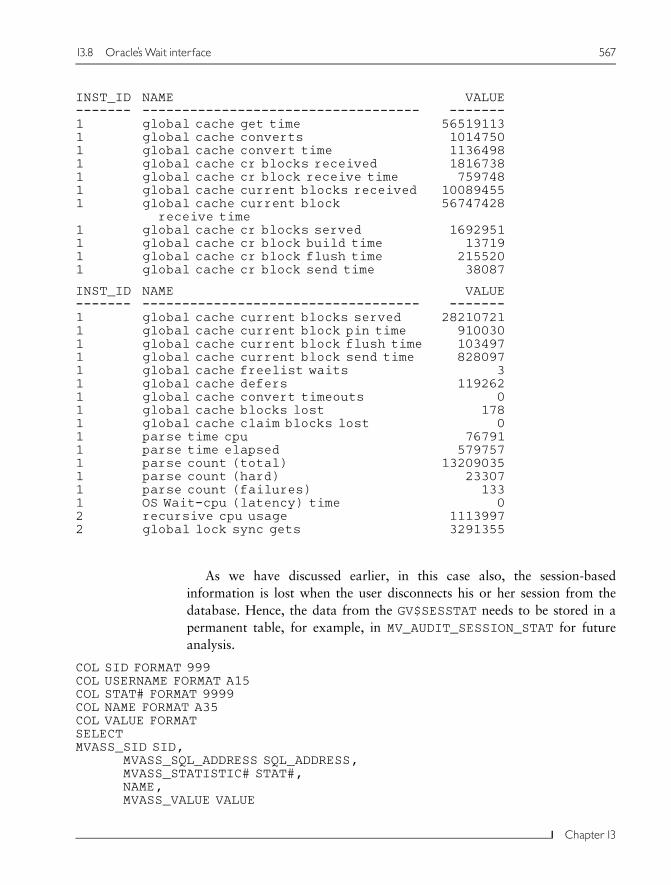
As we have discussed earlier, in this case also, the session-based
information is lost when the user disconnects his or her session from the
database. Hence, the data from the GV$SESSTAT needs to be stored in a
permanent table, for example, in MV_AUDIT_SESSION_STAT for future
analysis.
COL SID FORMAT 999COL USERNAME FORMAT A15COL STAT# FORMAT 9999COL NAME FORMAT A35COL VALUE FORMATSELECTMVASS_SID SID,
MVASS_SQL_ADDRESS SQL_ADDRESS,MVASS_STATISTIC# STAT#,NAME,MVASS_VALUE VALUE
INST_ID NAME VALUE------- ----------------------------------- -------1 global cache get time 565191131 global cache converts 10147501 global cache convert time 11364981 global cache cr blocks received 18167381 global cache cr block receive time 7597481 global cache current blocks received 100894551 global cache current block
receive time56747428
1 global cache cr blocks served 16929511 global cache cr block build time 137191 global cache cr block flush time 2155201 global cache cr block send time 38087
INST_ID NAME VALUE------- ----------------------------------- -------1 global cache current blocks served 282107211 global cache current block pin time 9100301 global cache current block flush time 1034971 global cache current block send time 8280971 global cache freelist waits 31 global cache defers 1192621 global cache convert timeouts 01 global cache blocks lost 1781 global cache claim blocks lost 01 parse time cpu 767911 parse time elapsed 5797571 parse count (total) 132090351 parse count (hard) 233071 parse count (failures) 1331 OS Wait-cpu (latency) time 02 recursive cpu usage 11139972 global lock sync gets 3291355
13.8 Oracle’sWait interface 567
Chapter13

FROM MV_AUDIT_SESSION_STAT,GV$STATNAME
WHERE MVASS_STATISTIC# ¼ STATISTIC#AND MVASS_USERNAME IS NOT NULLAND MVASS_VALUE > 0ORDER BY MVASS_SID/
The above output indicates the session statistics of the system. It
indicates the amount of memory and CPU (not shown in the output)
consumed by the session. Data from this output could be utilized for sizing
the Oracle memory and if there is high CPU usage, consider tuning the
query.
SID SQL_ADDRESS STAT# NAME VALUE---- ---------------- ----- ---------------------- ----------100 000000044668AD30 232 parse count (total) 1100 000000044668AD30 219 PX local messages recv’d 2100 000000044668AD30 218 PX local messages sent 2100 000000044668AD30 1 logons current 1100 000000044668AD30 0 logons cumulative 1100 000000044668AD30 34 global lock releases 1100 000000044668AD30 28 global lock sync gets 2100 000000044668AD30 27 enqueue releases 1100 000000044668AD30 25 enqueue requests 2100 000000044668AD30 21 session pga memory max 4502576100 000000044668AD30 20 session pga memory 4502576
SID SQL_ADDRESS STAT# NAME VALUE---- ---------------- ----- ---------------------- ----------100 000000044668AD30 16 session uga memory max 60968100 000000044668AD30 235 execute count 1100 000000044668AD30 34 global lock releases 1100 000000044668AD30 28 global lock sync gets 2100 000000044668AD30 27 enqueue releases 1100 000000044668AD30 25 enqueue requests 2100 000000044668AD30 21 session pga memory max 4502576100 000000044668AD30 20 session pga memory 4502576100 000000044668AD30 16 session uga memory max 60968100 000000044668AD30 15 session uga memory 60968100 000000044668AD30 14 process last non-idle time 1040613274
SID SQL_ADDRESS STAT# NAME VALUE---- ---------------- ----- ---------------------- ----------100 000000044668AD30 13 session connect time 1040613274100 000000044668AD30 15 session uga memory 60968100 000000044668AD30 14 process last non-idle time 1040613274100 000000044668AD30 13 session connect time 1040613274
568 13.8 Oracle’sWait interface

13.9 Conclusion
In this chapter we looked at the various tools and options for gathering
data that could be utilized for performance tuning the database.
UTLBSTAT/UTLESTAT have played a significant role in performance
tuning of Oracle databases and applications from earlier versions of
Oracle. With Oracle Version 8.1.6 and above, many users have switched
to the STATSPACK utility to generate these performance statistics.
In Oracle Version 9i, OEM has been enhanced considerably to provide
a clustered database view, which helps in performance monitoring of RAC
instances. The installation and configuration of OEM was discussed in
detail.
One of the main aspects of an application performing well is to ensure
that the persistence layer, which comprises SQL statements accessing the
database, performs well. While there are several products available from
various vendors today, Oracle provides several options for tuning SQL
queries. Under this category the EXPLAIN PLAN, SQL_TRACE, event
10046, and event 10053 were discussed with trace outputs.
The OWI was also discussed at length. The wait interface that
comprises GV$SESSION_EVENT, GV$SYSTEM_EVENT, GV$SESSION_
WAIT, GV$SYSSTAT, and GV$SESSTAT was discussed in length. The
discussion also included examples regarding analyzing this data for
improving the performance of the system.
RAC comprises many instances of Oracle with one common database.
While the ultimate goal of the enterprise system is to have the clustered
solution perform well, this cannot happen unless the individual instances
perform well. In the next chapter we will discuss a methodical approach to
tuning a single instance configuration.
13.9 Conclusion 569
Chapter13


