
PG&E’s Emerging Technologies Program ET Project ET13PGE1311
Emerging Technologies (ET) Lidded
Thermostatic Infrared Broiler Field Study
Food Service Technology Demo Kitchen
ET Project Number: ET13PGE1311
Project Manager: Jeff Beresini Charlene Spoor Pacific Gas and Electric Company Prepared By: David Zabrowski Adam Cornelius Denis Livchak Edward Ruan
Fisher-Nickel, Inc. 12949 Alcosta Blvd., Suite 101 San Ramon, CA 94583
Issued: December 15, 2014
Copyright, 2014, Pacific Gas and Electric Company. All rights reserved.

i
PG&E’s Emerging Technologies Program ET Project ET13PGE1311
ACKNOWLEDGEMENTS
Pacific Gas and Electric Company’s Emerging Technologies Program is responsible for this project. It was developed as part of Pacific Gas and Electric Company’s Emerging Technology – Energy Efficient Commercial Food Service Equipment Demo and Showcase program under internal project number 2500960993. Fisher-Nickel, Inc (FNI) conducted this technology evaluation for Pacific Gas and Electric Company (PG&E) with overall guidance and management from Jeff Beresini and Charlene Spoor. For more information on this project, contact [email protected] or [email protected].
Special thanks to the contributors to this report: David Cowen, Mark Finck, Janel Rupp,
LEGAL NOTICE
This report was prepared for PG&E for use by its employees and agents. Neither PG&E nor any of its employees and agents:
(1) makes any written or oral warranty, expressed or implied, including, but not limited to those concerning merchantability or fitness for a particular purpose;
(2) assumes any legal liability or responsibility for the accuracy, completeness, or usefulness of any information, apparatus, product, process, method, or policy contained herein; or
(3) represents that its use would not infringe any privately owned rights, including, but not limited to, patents, trademarks, or copyrights.
DISCLAIMER
In no event will FNI be liable for any special, incidental, consequential, indirect, or similar damages,
including but not limited to lost profits, lost market share, lost savings, lost data, increased cost of
production, or any other damages arising out of the use of the data or the interpretation of the data
presented in this report.
FNI is neutral as to fuel and energy sources. Fisher-Nickel, Inc. does not endorse particular products or
services from any specific manufacturer or service provider. FNI is strongly committed to evaluating the
performance of foodservice equipment using the best available scientific techniques and instrumentation.
FNI test results are made available to the general public through technical research reports and
publications and are protected under U.S. and international copyright laws. Reproduction or distribution of
the whole or any part of the contents of this document without reference to PG&E and FNI is prohibited.
This report was prepared as a result of work sponsored by the California Public Utilities Commission
(CPUC). It does not necessarily represent the views of the CPUC, its employees, or the State of
California. The CPUC, the State of California, its employees, contractors, and subcontractors make no
warranty, express or implied, and assume no legal liability for the information in this report; nor does any
party represent that the use of this information will not infringe upon privately owned rights. This report
has not been approved or disapproved by the CPUC nor has the CPUC passed upon the accuracy or
adequacy of the information in this report.

ii
PG&E’s Emerging Technologies Program ET Project ET13PGE1311
ABBREVIATIONS AND ACRONYMS
ASTM American Society for Testing and Materials
Btu British Thermal Unit
DCKV Demand-Controlled Kitchen Ventilation
ET Emerging Technologies
F Fahrenheit
FNI Fisher-Nickel, Inc.
FSTC Food Service Technology Center
ft Foot
h Hour
HVAC Heating, Ventilating and Air Conditioning
IR Infrared
lb Pound
kW Kilowatt
kWh Kilowatt-hour
PG&E Pacific Gas and Electric Company
PIER Public Interest Energy Research
RD&D Research, Development, and Design
scf Standard Cubic Foot
iii
PG&E’s Emerging Technologies Program ET Project ET13PGE1311
CONTENTS
EXECUTIVE SUMMARY ................................................................................................1
INTRODUCTION .........................................................................................................3
Emerging Technologies Project Background ........................................................ 3
Benefits to California ....................................................................................... 5
Project Assessment Objectives / Goals ............................................................... 5
Methodology ................................................................................................... 6
Technology / Product Evaluation Approach ......................................................... 7
Description of Existing Technologies ......................................................... 7 Description of New Technologies ............................................................ 10
FIELD ANALYSIS, RESULTS, AND RECOMMENDATIONS ....................................................14
Norm’s Place (Danville, CA) ............................................................................ 14
Technical Approach ............................................................................... 14 Baseline Results ................................................................................... 14 Replacements Results ........................................................................... 17 Customer Feedback/Recommendations ................................................... 20
The Growler (Danville, CA) ............................................................................. 20
Technical Approach ............................................................................... 20 Baseline Results ................................................................................... 21 Replacements Results ........................................................................... 24 Customer Feedback/Recommendations ................................................... 29
Sideboard (Danville, CA) ................................................................................ 29
Technical Approach ............................................................................... 29 Baseline Results ................................................................................... 29 Replacement Results ............................................................................. 32 Customer Feedback/Recommendations ................................................... 37
Esin (Danville, CA) ........................................................................................ 37
Technical Approach ............................................................................... 37 Baseline Results ................................................................................... 38 Replacement Results ............................................................................. 40 Customer Feedback/ Recommendations .................................................. 48
LIDDED BROILER SHOWCASE ......................................................................................49
CUSTOMER FEEDBACK SURVEY ..................................................................................50
Purchasing Influences .................................................................................... 50
Site Operating Practices ................................................................................. 50
Lidded Char-broiler Feedback .......................................................................... 50
iv
PG&E’s Emerging Technologies Program ET Project ET13PGE1311
APPENDIX 1: APPLIANCE SPECIFICATIONS ....................................................................1
APPENDIX 2: SURVEY RESULTS .....................................................................................2
Esin Pre-monitoring Survey .............................................................................. 2
Esin Post-monitoring Survey ............................................................................. 4
Growler Pre-monitoring Survey ......................................................................... 7
Growler Post-monitoring Survey ........................................................................ 9
Sideboard Pre-monitoring Survey .................................................................... 12
Sideboard Post-monitoring Survey .................................................................. 14
APPENDIX 3: “CASE STUDIES IN ENERGY-EFFICIENT LIDDED CHAR-BROILERS” SHOWCASE
(10/20/14) .........................................................................................................17
REFERENCES ...........................................................................................................21

v
PG&E’s Emerging Technologies Program ET Project ET13PGE1311
TABLES
Table ES-1. Linear Feet of Broilers, Energy Use, and Potential
Energy Use by IOU ....................................................... 5
Table 1. Lidded Underfired Broiler Lab Testing Results .................... 10
Table 2. Three-foot Underfired Broiler Energy Performance Testing
Results ..................................................................... 12
Table 3. Growler’s Existing Broiler Specifications ............................ 22
Table 4. Sideboard’s Existing Broiler Specifications ......................... 30
Table 5. Esin’s Existing Broiler Specifications ................................. 39
Table 6. Restaurant Name, Location, and Upgraded Broiler .............. 52
FIGURES
Figure 1. Field Monitoring Gas Meter Connected to a Data Logger in
the Lab (Left) and in the Field (Right) ............................. 4
Figure 2. Field Monitoring Gas Meter Connected to a Data Logger in
the Lab (Left) and in the Field (Right) ............................. 7
Figure 3. Underfired Broiler Heater Source ...................................... 8
Figure 4. Temperature Uniformity Plot for Three-foot Wide
Standard Underfired Broiler ........................................... 9
Figure 5. Lidded Underfired Broiler ............................................... 12
Figure 6. Norm's Place Exterior (Left) and Interior Bar and Dining
Area (Right) .............................................................. 14
Figure 7. Existing Broiler at Norm's Place ...................................... 15
Figure 8. Thursday Feb. 28, Typical Energy Profile of Existing
Broiler at Norm’s Place ................................................ 15
Figure 9. Existing Broiler Energy Use and Hours of Operation at
Norm’s Place ............................................................. 16
Figure 10. Replacement Broiler at Norm’s Place ............................. 17
Figure 11. Thursday September 19, Typical Energy Profile of
Replacement Broiler at Norm’s Place ............................. 17
Figure 12. Replacement Broiler Energy Use and Hours of Operation
at Norm's Place .......................................................... 18
Figure 13. Energy Profile Comparison: Existing to Replacement
Broiler at Norm’s Place ................................................ 19
Figure 14. Daily Energy Regression Comparison at Norm’s Place:
Existing to Replacement Broiler .................................... 20
vi
PG&E’s Emerging Technologies Program ET Project ET13PGE1311
Figure 15. Existing Broiler Carried Over from the Previous Owners
to The Growler ........................................................... 21
Figure 16. Existing Broiler Input Knob Settings at The Growler ......... 22
Figure 17. Wednesday May 7, Typical Energy Profile of Existing
Broiler at The Growler ................................................. 23
Figure 18. Existing Broiler Energy Use and Hours of Operation at
The Growler............................................................... 23
Figure 19. Replacement Broiler Installed on Cook Line at The
Growler ..................................................................... 24
Figure 20. Thursday June 19, Typical Energy Profile of Replacement
Broiler at The Growler ................................................. 24
Figure 21. Replacement Thermostatically-Controlled Broiler
Thermostat Setpoint at The Growler ............................. 25
Figure 22. Replacement Broiler Energy Use and Hours of Operation
at The Growler ........................................................... 26
Figure 23. Replacement Thermostatically-Controlled Broiler
Infrared Burners at The Growler ................................... 26
Figure 24. Energy Use Comparison at The Growler: Pre- to Post-
Behavioral Change at The Growler ................................ 27
Figure 25. Energy Profile Comparison at The Growler: Existing to
Replacement Broiler (After Behavioral Changes) ............ 28
Figure 26. Daily Energy Regression Comparison at The Growler:
Existing to Replacement Broiler (After Behavioral
Changes) .................................................................. 28
Figure 27. Existing Broiler at Sideboard ........................................ 30
Figure 28. Wednesday May 7, Typical Energy Profile of Existing
Broiler at Sideboard .................................................... 31
Figure 29. Existing Broiler Energy Use and Hours of Operation at
Sideboard ................................................................. 32
Figure 30. Replacement Lidded, Thermostatically-Controlled Broiler
Installed on Sideboard Cook Line ................................. 32
Figure 31. Lidded Broiler Thermostat at Sideboard Set for 400°F...... 33
Figure 32. Wednesday June 14, Typical Energy Profile of
Replacement Broiler at Sideboard ................................. 33
Figure 33. Replacement Broiler Energy Use and Hours of Operation
at Sideboard .............................................................. 34
Figure 34. Replacement Thermostatically-Controlled Broiler
Thermostat Setpoint at Sideboard ................................ 35
Figure 35. Energy Use Comparison: Pre- to Post-Behavioral Change
at Sideboard .............................................................. 35
Figure 36. Energy Profile Comparison: Existing to Replacement

vii
PG&E’s Emerging Technologies Program ET Project ET13PGE1311
Broiler (After Behavioral Changes) ............................... 36
Figure 37. Daily Energy Regression Comparison: Existing to
Replacement Broiler (After Behavioral Changes) ............ 36
Figure 38. Esin Exterior (Left) and Interior Bar (Right) .................... 37
Figure 39. Existing Broiler at Esin ................................................. 38
Figure 40. Wednesday July 30, Typical Energy Profile of Existing
Broiler at Esin ............................................................ 39
Figure 41. Existing Broiler Energy Use and Hours of Operation at
Esin .......................................................................... 40
Figure 42. Replacement Lidded, Thermostatically-Controlled Broiler
Installed on Cook Line at Esin ..................................... 40
Figure 43. Monday September 1, Typical Energy Profile of
Replacement Broiler at Esin ......................................... 41
Figure 44. Replacement Broiler Energy Use and Hours of Operation
at Esin ...................................................................... 42
Figure 45. Replacement Thermostatically-Controlled Broiler
Infrared Burners at Esin .............................................. 42
Figure 46. Energy Profile Comparison at Esin: Existing to
Replacement Broiler ................................................... 43
Figure 47. Daily Energy Regression Comparison at Esin: Existing to
Replacement Broiler ................................................... 44
Figure 48. DCKV Optical Sensor Inside Esin’s Hood ......................... 45
Figure 49. Esin’s Exhaust Fan Power Consumption .......................... 46
Figure 50. Esin’s DCKV System Settings ........................................ 46
Figure 51. Average Daily Fan Energy Profile at Esin ........................ 47
Figure 52. Lidded Broiler Demonstration at the 10/20/2014
Showcase at FSTC ...................................................... 49
Figure 52. Daily Energy Use Before and After Broiler Replacement ... 53

1
PG&E’s Emerging Technologies Program ET Project ET13PGE1311
EXECUTIVE SUMMARY
The underfired broiler is a common medium- to heavy-duty piece of commercial foodservice
equipment. In establishments where broilers are used to cook meat, seafood and grilled
vegetables, they function as one of the central kitchen appliances. The signature charred
taste, aroma and appearance of food cooked on a broiler cannot be achieved through other
cooking processes.
A commercial underfired broiler is one of the most energy-intensive appliances in the
kitchen. When not being actively used, broilers are typically kept in a ready-to-cook idle
state, so they operate at close to their peak energy input rate regardless of whether or not
they are cooking. As a result, the annual costs of operating an underfired broiler can often
exceed the purchase price of the equipment. Their high operating temperatures place a
tremendous load on kitchen HVAC systems, requiring high exhaust flow rates and
introducing a significant amount of heat into the surrounding kitchen space. Broiler designs
have changed little over the last 30 years; with new technological advances, there are now
new opportunities to change these designs to provide significant energy savings.
PROJECT GOAL
The goal of this study was to determine performance gains and gas energy savings when
using advanced equipment incorporating improved designs and controls. The objectives of
the study were to characterize inefficiencies of standard underfired broiler technologies
through field data collection, to compare the energy use of standard and energy-efficient
lidded thermostatically-controlled broiler technologies under both idle and cooking
conditions in the laboratory, and to examine differences in restaurant broiler energy use
between a standard and lidded broiler at several different field monitoring locations. The
study also sought to determine any additional reductions in energy use as a result of the
behavioral changes of operators, and to identify potential ventilation savings associated with
Demand-Controlled Kitchen Ventilation (DCKV) integration.
PROJECT DESCRIPTION
Four sites were selected for assessment, monitoring, and evaluation, ranging from fine
dining to casual dining. The existing broiler’s daily energy use and hours of operation were
monitored for a minimum of two weeks. After baseline data had been collected and
analyzed, the existing broiler was replaced with broilers of the same size that utilized
thermostatic controls, infrared (IR) burners, and a heat retention lid. Data on the
replacement broilers was collected for a period of at least two weeks and the data compiled
and analyzed. At two of the four restaurants, more detailed instruction and training was
provided to staff and management on the replacement broilers. The effects of these
behavioral changes on broiler operation were then collected for an additional period of at
least two weeks and the findings compiled and analyzed.
PROJECT FINDINGS/RESULTS
Overall, there is great potential for savings with the lidded, infrared, thermostatically-
controlled broiler—especially in restaurants that leave their units idling for long periods.
Replacing the standard broiler with a thermostatically-controlled, lidded, IR broiler resulted
in an average 30% energy savings, or an average of about two and a half therms daily. An
additional 32% energy savings was realized at the two sites where training was

2
PG&E’s Emerging Technologies Program ET Project ET13PGE1311
implemented to foster behavioral changes. By utilizing the lid wherever possible,
appreciable energy savings were achieved at all four restaurant locations. If the lid was not
closed, the lidded broiler operated like a standard, non-thermostatically-controlled broiler
and no any sizable energy savings were realized. Operators noted improved cooking
performance due to the relative temperature uniformity of the lidded broiler’s IR burners.
The study also demonstrated the significance of proper training. As exhibited by the data
taken from one of the sites that implemented broiler best-practices, training to optimize
lidded broiler operations could more than double the savings realized by switching to a more
efficient broiler without significantly impacting normal restaurant operation.
RECOMMENDATIONS
The savings realized by lidded broilers makes it a viable early-replacement candidate. With
cost savings between $750 and $1,000 at the sites studied, owners could realize a four year
or less simple payback period based on the broiler’s current $3,800 purchase price. A rebate
equivalent to the first year of savings could reduce this payback period to under three
years—further enhancing the potential for its increased adoption in the marketplace. For full
market adoption, however, the lidded broiler concept will need to be refined and promoted
more by manufacturers. The price for lidded broilers has significant room to drop once per-
unit manufacturing costs begin to decrease (a result of rising demand and the associated
increases in both economies of scale) and as manufacturer competition increases.
While these studies may have illustrated the benefits of switching to lidded,
thermostatically-controlled IR broilers, they have also highlighted targeted areas for
improvement. The current lidded broiler design causes the smoke plume to shift slightly
forward, which may hamper ventilation. Restaurants with ventilation hoods that barely
capture and contain the plume of a standard broiler under heavy load conditions will most
likely see cooking effluent spillage when cooking heavy loads with the open lidded broiler.
Manufacturers could explore several avenues for potential energy-saving design
enhancements to the lidded broiler—Including automatic pilot ignition systems, split broiler
lids, better lid insulation, and the use of demand-response ventilation systems. A two-stage
gas valve controlled by lid position may be an alternative to the thermostat. With the merits
of this emerging technology now validated, further investigation should be made into
quantifying the benefits of its specific features. For example, studies could be done on
unlidded broilers with IR burners, or on lidded broilers with conventional atmospheric
burners rather than IR burners. Isolating and investigating the different features of the
advanced broiler type used in this study could provide more insight on the contribution of its
individual features towards energy savings. Through this type of investigation, broiler
technology could be further refined for combined energy and cost-effectiveness.
In terms of behavioral changes, investigating new cooking techniques involving closed-lid
cooking should also prove to be valuable. Education and training of kitchen staff on best
operational practices, combined with the aforementioned design changes, would maximize
the potential energy savings of lidded, thermostatically-controlled IR broilers in restaurants.
California foodservice operators stand to significantly benefit from the adoption of this
technology. Reducing the notoriously high gas use of the underfired broiler by enhancing
the design with these new features will improve productivity, lower utility bills, and reduce
broiler energy use and the carbon emissions associated with additional gas consumption.

3
PG&E’s Emerging Technologies Program ET Project ET13PGE1311
INTRODUCTION
EMERGING TECHNOLOGIES PROJECT BACKGROUND PG&E’s ET program was created to fund field placement studies of energy-efficient
equipment in California. The primary objective of the ET program is to promote the
California Energy Wise rebate program by highlighting the performance of rebate-qualified
equipment in real-world operating situations. The FSTC’s role in this program involves
replacing low- or standard-efficiency existing equipment in targeted foodservice
establishments based on a site assessment; design consultation; measuring pre- and post-
replacement energy use and calculating savings; and following up with a demo showcase
event to share the project’s successes and lessons learned.
The project utilized recent findings in a PIER study completed by Fisher-Nickel, Inc. (FNI)
that characterized the inventory, energy load, and energy-efficiency potential of various
primary cooking appliances found in commercial and institutional foodservice sectors in the
state of California. The goal of the PIER study was to identify energy-efficient needs in the
restaurant industry; identify equipment with the highest energy loads; and outline specific
strategies to stimulate Research, Development, and Design (RD&D) improvements in
energy efficiency and productivity to support regulatory and utility-based incentive
programs around this equipment. This ET program augments the PIER study by
demonstrating “proof-of-concept” in live kitchens for implementing these energy reduction
strategies to support current and future utility-based incentives for more efficient
equipment. It will also help increase awareness in the foodservice industry of the real-world
performance of energy-efficient equipment, further driving manufacturer research and
development as demand for this type of equipment continues to grow.
This particular project focused on underfired broiler technology. The conventional underfired
broiler’s design has not changed much in the past 30 years. Broilers have an input rating of
about 15,000 Btu/h per burner and as much as 500-2,500 Btu/h for the standing pilot
alone. The energy-efficiency range for a conventional underfired broiler is 20%-30%,
relatively low in comparison with other commercial kitchen appliances. Standard underfired
broilers also are not thermostatically-controlled, display poor heating uniformity across the
cooking surface, and pose a challenge to ventilation systems due to their intense thermal
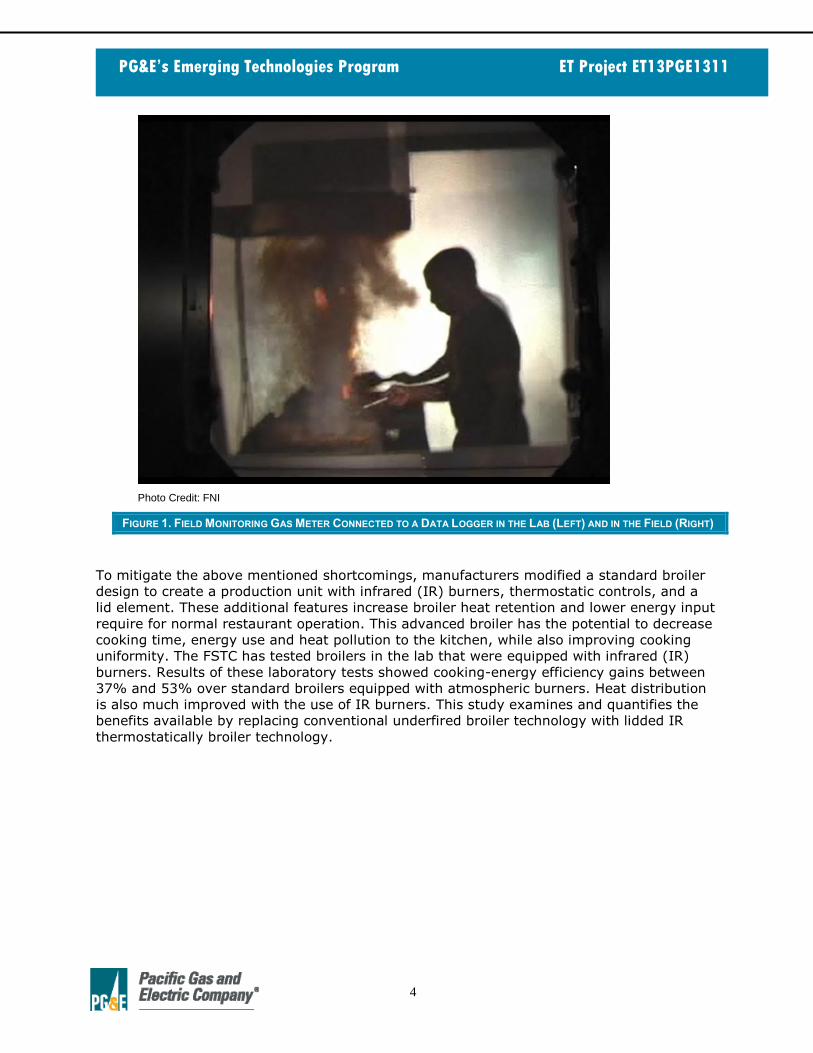
plumes. Figure 1 below provides a Schlieren image of a conventional char-broiler’s thermal
plume under a hood.
4
PG&E’s Emerging Technologies Program ET Project ET13PGE1311
Photo Credit: FNI
FIGURE 1. FIELD MONITORING GAS METER CONNECTED TO A DATA LOGGER IN THE LAB (LEFT) AND IN THE FIELD (RIGHT)
To mitigate the above mentioned shortcomings, manufacturers modified a standard broiler
design to create a production unit with infrared (IR) burners, thermostatic controls, and a
lid element. These additional features increase broiler heat retention and lower energy input
require for normal restaurant operation. This advanced broiler has the potential to decrease
cooking time, energy use and heat pollution to the kitchen, while also improving cooking
uniformity. The FSTC has tested broilers in the lab that were equipped with infrared (IR)
burners. Results of these laboratory tests showed cooking-energy efficiency gains between
37% and 53% over standard broilers equipped with atmospheric burners. Heat distribution
is also much improved with the use of IR burners. This study examines and quantifies the
benefits available by replacing conventional underfired broiler technology with lidded IR
thermostatically broiler technology.
5
PG&E’s Emerging Technologies Program ET Project ET13PGE1311
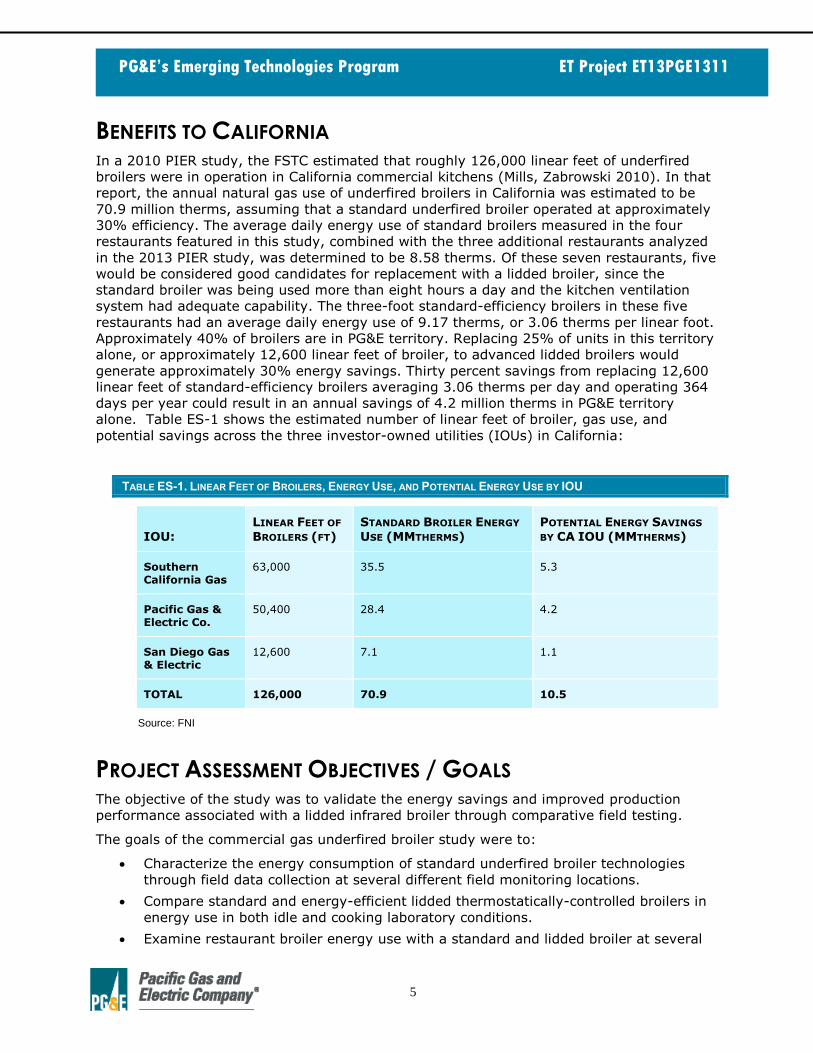
BENEFITS TO CALIFORNIA In a 2010 PIER study, the FSTC estimated that roughly 126,000 linear feet of underfired
broilers were in operation in California commercial kitchens (Mills, Zabrowski 2010). In that
report, the annual natural gas use of underfired broilers in California was estimated to be
70.9 million therms, assuming that a standard underfired broiler operated at approximately
30% efficiency. The average daily energy use of standard broilers measured in the four
restaurants featured in this study, combined with the three additional restaurants analyzed
in the 2013 PIER study, was determined to be 8.58 therms. Of these seven restaurants, five
would be considered good candidates for replacement with a lidded broiler, since the
standard broiler was being used more than eight hours a day and the kitchen ventilation
system had adequate capability. The three-foot standard-efficiency broilers in these five
restaurants had an average daily energy use of 9.17 therms, or 3.06 therms per linear foot.
Approximately 40% of broilers are in PG&E territory. Replacing 25% of units in this territory
alone, or approximately 12,600 linear feet of broiler, to advanced lidded broilers would
generate approximately 30% energy savings. Thirty percent savings from replacing 12,600
linear feet of standard-efficiency broilers averaging 3.06 therms per day and operating 364
days per year could result in an annual savings of 4.2 million therms in PG&E territory
alone. Table ES-1 shows the estimated number of linear feet of broiler, gas use, and
potential savings across the three investor-owned utilities (IOUs) in California:
TABLE ES-1. LINEAR FEET OF BROILERS, ENERGY USE, AND POTENTIAL ENERGY USE BY IOU
IOU: LINEAR FEET OF
BROILERS (FT) STANDARD BROILER ENERGY
USE (MMTHERMS) POTENTIAL ENERGY SAVINGS
BY CA IOU (MMTHERMS)
Southern California Gas
63,000 35.5 5.3
Pacific Gas & Electric Co.
50,400 28.4 4.2
San Diego Gas & Electric
12,600 7.1 1.1
TOTAL 126,000 70.9 10.5
Source: FNI
PROJECT ASSESSMENT OBJECTIVES / GOALS The objective of the study was to validate the energy savings and improved production
performance associated with a lidded infrared broiler through comparative field testing.
The goals of the commercial gas underfired broiler study were to:
Characterize the energy consumption of standard underfired broiler technologies
through field data collection at several different field monitoring locations.
Compare standard and energy-efficient lidded thermostatically-controlled broilers in
energy use in both idle and cooking laboratory conditions.
Examine restaurant broiler energy use with a standard and lidded broiler at several

6
PG&E’s Emerging Technologies Program ET Project ET13PGE1311
different field monitoring locations.
Determine any additional reductions in energy use as a result of behavioral changes
of operators.
Determine potential ventilation savings associated with Demand-Controlled Kitchen
Ventilation (DCKV) integration.
Provide recommendations that will continue to advance underfired broiler efficiency
and transform the market for this appliance category.
METHODOLOGY Four restaurants were selected for standard broiler monitoring. After the existing broiler’s
daily energy use and hours of operation were metered, the broilers were replaced with
lidded thermostatically-controlled broilers of the same size. Energy monitoring was
conducted on the replacement broilers for a minimum of two weeks. Broiler usage patterns
and restaurant operation remained the same with the replacement broiler and the pre-
existing standard broiler.
Once data was analyzed for the initial monitoring period, FSTC staff returned to two of the
four restaurants to promote behavioral changes in support of proper lidded broiled
operation. Broiler training included the following items:
• Reiterating to the cooks and the manager to close the lid when the broiler was empty
(show energy savings vs. potential energy savings).
• Explaining that closing the lid will make the kitchen “cooler”.
• Warning about the potential burn hazards of grabbing the lid handle improperly, and
showing the best points to use the lid handle.
• Showing operators where to locate thermostat on the broiler, and describing to them
how it works; explaining the benefits of reducing the thermostat to a temperature
between 350°F and 450°F
• Demonstrating how to modulate the burner input knobs when cooking with the lid
open.
• Explaining the benefits of turning off sections of the broiler during low production
periods.
• Suggesting that cooking with the lid down would be beneficial but not expected.
Post-behavioral change monitoring then took place for a period of at least two weeks. The
kitchen staff was taught how to use the thermostatic controls, including proper safety and
cooking operation practices. They were instructed to keep the lid closed when not cooking
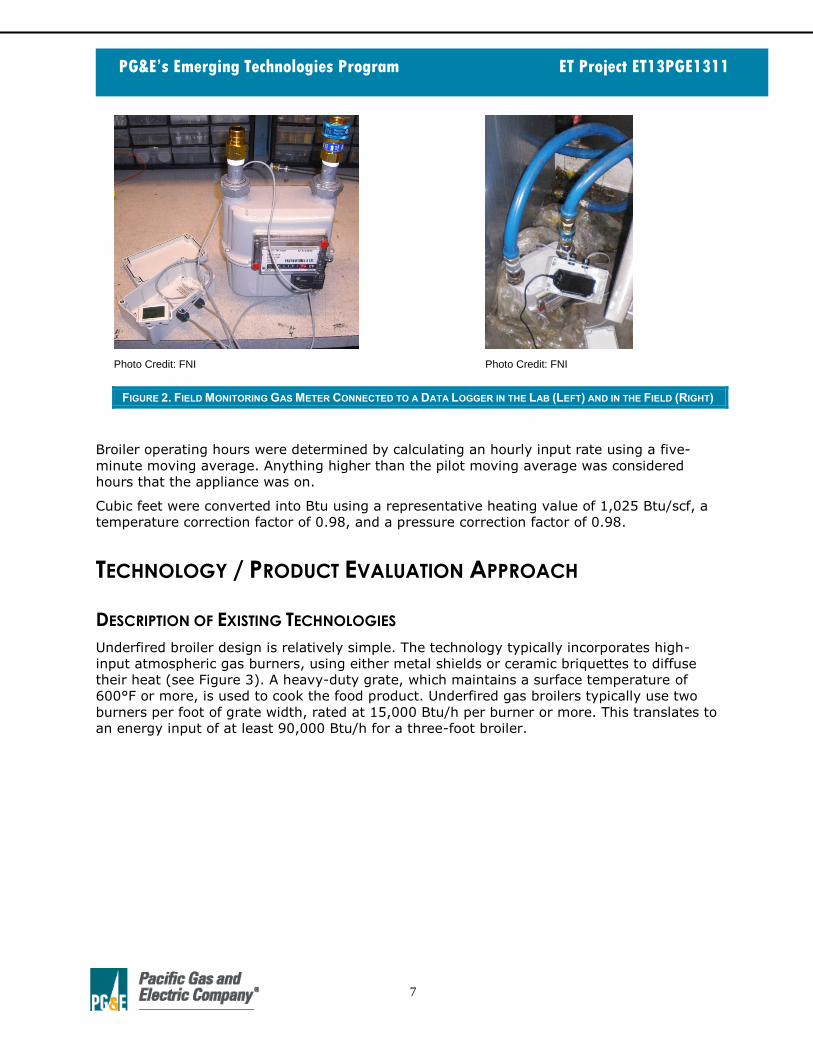
on the broiler, and to cook on the broiler with the lid up. The instrumentation package that
was used for field testing of the underfired broiler included a diaphragm-type positive
displacement gas meter with a one-pulse/ft3 output (Figure 2). A data logger was used to
log at a one-minute interval and process and store cumulative gas consumption from the
meter’s pulse outputs.
7
PG&E’s Emerging Technologies Program ET Project ET13PGE1311
Photo Credit: FNI
Photo Credit: FNI
FIGURE 2. FIELD MONITORING GAS METER CONNECTED TO A DATA LOGGER IN THE LAB (LEFT) AND IN THE FIELD (RIGHT)
Broiler operating hours were determined by calculating an hourly input rate using a five-
minute moving average. Anything higher than the pilot moving average was considered
hours that the appliance was on.
Cubic feet were converted into Btu using a representative heating value of 1,025 Btu/scf, a
temperature correction factor of 0.98, and a pressure correction factor of 0.98.
TECHNOLOGY / PRODUCT EVALUATION APPROACH
DESCRIPTION OF EXISTING TECHNOLOGIES
Underfired broiler design is relatively simple. The technology typically incorporates high-
input atmospheric gas burners, using either metal shields or ceramic briquettes to diffuse
their heat (see Figure 3). A heavy-duty grate, which maintains a surface temperature of
600°F or more, is used to cook the food product. Underfired gas broilers typically use two
burners per foot of grate width, rated at 15,000 Btu/h per burner or more. This translates to
an energy input of at least 90,000 Btu/h for a three-foot broiler.

8
PG&E’s Emerging Technologies Program ET Project ET13PGE1311
Photo Credit: Vulcan-Hart Company
FIGURE 3. UNDERFIRED BROILER HEATER SOURCE
Virtually all commercial broilers employ continuous standing pilots to light the burners.
Standard underfired broilers use one standing pilot for every two burners, or one pilot per
linear foot. A typical three-foot underfired broiler containing three standing pilot lights may
consume between 1,500 and 3,500 Btu/h for a three-foot, three-burner broiler, just from
pilots alone.
Broilers do not yet offer temperature feedback to the operator, often leading to arbitrary
adjustment of the burners and over-firing of the appliance (hotter than necessary operating
temperatures). Any unnecessary increase in broiler temperature translates to increased
appliance energy load, increased HVAC load due to additional heat gain to the surrounding
space, and (in most cases) increased operator discomfort Ventilation Considerations
Underfired broilers present a challenge for kitchen ventilation due to the nature of their
particulate emissions and extreme thermal plumes. Even within a diverse cook line, use of
an underfired broiler will drive the ventilation requirements for acceptable capture and
containment of cooking effluent. An inherent characteristic of underfired broilers is that
even during non-cooking periods, the thermal plume generated can challenge a hood’s
ability to capture and contain the effluent—almost as severely as when the broiler is cooking
food product under fully-loaded conditions. While other types of appliances offer
opportunities to reduce ventilation rates during non-cooking periods, underfired broilers are
not as amenable. The FSTC Commercial Kitchen Ventilation lab has reported that the
minimum capture and containment rates for an underfired broiler are 480 cfm/ft (linear foot

9
PG&E’s Emerging Technologies Program ET Project ET13PGE1311
of the kitchen hood) while cooking, and 360 cfm/ft while idling beneath a five-foot wall
canopy hood.
ENERGY AND TEMPERATURE PERFORMANCE
Understanding the energy performance of standard broilers involves the discussion of
several key topics—including operating and idle energy rates, preheating, and temperature
uniformity. Since almost all broilers are not thermostatically controlled and manufacturers
have established input rates based on peak production (i.e., high broiling temperatures that
minimize cook time), broilers typically consume energy throughout the day at a rate that is
close to their maximum input. Unlike other appliances that consume less energy to maintain
a set temperature once the food load is removed, the end of a broiler cooking event does
not automatically return the broiler to an idle (non-cooking) state. Furthermore, because it
is partially concealed beneath the grid and/or coals, the visibility of a broiler's flame does
not remind the operator to turn the broiler off between loads.
Many standard underfired broilers show a substantial temperature drop towards the front of
the cooking zone. They commonly exhibit a difference of 200°F or more between the hot
spot in the center and the cold spot along the edges of the cooking grate (Figure 4). In
practice, this temperature difference can be used to the operator’s advantage. An
experienced cook will place more delicate items such as chicken or shrimp on the cooler
areas of the broiler, and use the hottest spots for heavier items, such as steaks or chops.
However, this large temperature variation can be a disadvantage for operations that use a
broiler for batch cooking, where larger quantities of uniform food products are being
prepared in a short amount of time.
Photo Credit: California Energy Commission
FIGURE 4. TEMPERATURE UNIFORMITY PLOT FOR THREE-FOOT WIDE STANDARD UNDERFIRED BROILER
Lab testing was conducted on standard broiler technologies, looking at the production
capacity and energy use. Further detail on this testing can be found in the 2013 PIER
Appliance Report.
10
PG&E’s Emerging Technologies Program ET Project ET13PGE1311
DESCRIPTION OF NEW TECHNOLOGIES
LIDDED BROILER DESIGN
FSTC studies performed on conveyor broilers and underfired broilers suggested that the
addition of a lid into the design of an underfired broiler would improve overall appliance
efficiency, while simultaneously improving kitchen ventilation system efficiency, operator
comfort, and satisfaction. There are many appliance performance parameters that would
improve with the use of a lid, including a reduced idle energy rate, faster cook times, and
increased cooking-energy efficiency.
Testing at the FSTC showed that idle rates can be reduced by adding a lid element to an
underfired broiler. The closed lid would also retain radiant heat more effectively in the
cooking zone of the underfired broiler. Similar to the conveyor broiler, which has a semi
enclosed cavity, production capacity would be increased and cook times reduced if cooking
with the lid down. When a lid is added, the underfired broiler would not suffer the same
radiant heat losses that conveyor broilers do because the cavity would be completely
enclosed. It is possible that the improved heat transfer to the food product would make it
feasible to reduce the maximum energy input to the burners (by use of thermostatic
controls) and still achieve the desired cooked product. In this way, a reduction in the
cooking energy rate is expected.
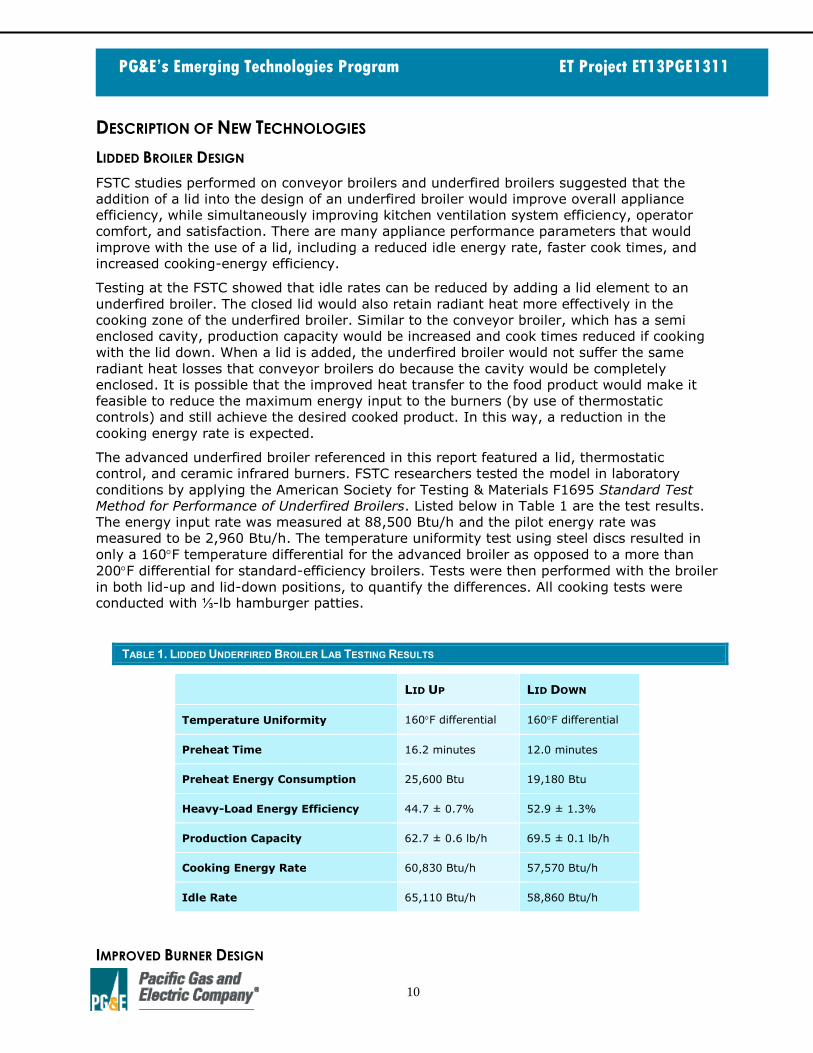
The advanced underfired broiler referenced in this report featured a lid, thermostatic
control, and ceramic infrared burners. FSTC researchers tested the model in laboratory
conditions by applying the American Society for Testing & Materials F1695 Standard Test
Method for Performance of Underfired Broilers. Listed below in Table 1 are the test results.
The energy input rate was measured at 88,500 Btu/h and the pilot energy rate was
measured to be 2,960 Btu/h. The temperature uniformity test using steel discs resulted in
only a 160F temperature differential for the advanced broiler as opposed to a more than
200F differential for standard-efficiency broilers. Tests were then performed with the broiler
in both lid-up and lid-down positions, to quantify the differences. All cooking tests were conducted with ⅓-lb hamburger patties.
TABLE 1. LIDDED UNDERFIRED BROILER LAB TESTING RESULTS
LID UP LID DOWN
Temperature Uniformity 160F differential 160F differential
Preheat Time 16.2 minutes 12.0 minutes
Preheat Energy Consumption 25,600 Btu 19,180 Btu
Heavy-Load Energy Efficiency 44.7 ± 0.7% 52.9 ± 1.3%
Production Capacity 62.7 ± 0.6 lb/h 69.5 ± 0.1 lb/h
Cooking Energy Rate 60,830 Btu/h 57,570 Btu/h
Idle Rate 65,110 Btu/h 58,860 Btu/h
IMPROVED BURNER DESIGN

11
PG&E’s Emerging Technologies Program ET Project ET13PGE1311
Simple improvements in burner design and heat shields (radiants) can also improve
cooking-energy efficiency rates. Infrared (IR) burners are an advanced burner type that has
been successfully applied to commercial underfired broilers. Several manufacturers
currently offer models using infrared burners. FSTC testing of these broilers as documented
in the 2013 PIER report showed a great deal of improvement over standard atmospheric
burners. These models achieved an average cooking-energy efficiency of 43.5%, compared
with a typical cooking-energy efficiency of 30.3% for standard-efficiency models. Another
advantage of IR burners is that heat is distributed much more evenly across the heated
surface.
VENTILATION CONSIDERATIONS
Reducing the cooking energy rate is important to the overall system efficiency—not only in
terms of appliance gas consumption, but also when examining the impact of the appliance
on the kitchen space. Lidded broilers provide energy savings and reduce heat load to the
kitchen when the lid is closed, reducing ventilation needs as a result. This is significant
because traditionally, broilers are among some of the largest heat loads on the cooking line.
Additionally a broiler that operates at a lower average cooking energy rate would likely
radiate less heat to the kitchen space, thereby improving operator comfort and reducing the
broiler’s impact on the commercial kitchen exhaust system. For ventilation energy savings
to be realized, the kitchen would need a Demand Control Kitchen Ventilation (DCKV) system
with a variable frequency drive (VFD) to modulate hood fan speeds between times when the
lid is up and the lid is down. Ventilation energy savings due to the lidded broiler could only
be counted if fan speeds are driven by the appliance, so the broiler must be the highest
temperature appliance on the line and the existing broiler plume must be captured and
contained to realize savings. Advanced DCKV systems should have the optics calibrated to
sense the smoke reduction associated with the lidded broiler. Other smoke generating
appliances, such as griddles, may trigger the optical sensor, which would discount the fan
reduction associated with the lidded broiler smoke plume.
MAINTENANCE CONSIDERATIONS
The thermostatic controls are composed of standard generic parts, allowing for easy
maintenance and repair. These parts can be easily found and purchased at relatively cheap
prices, saving the user time and money on maintenance issues. The controls also feature a
failsafe mechanism which automatically shuts off gas flow, should the thermostat
malfunction.
ADVANCED BROILER
The advanced broiler featured in this report (Figure 5) incorporates some of the advanced
features described, including thermostatic control and ceramic infrared burner design. The
most unique feature of this model is that it incorporates a lid that may be used during idle
periods, and potentially during cooking.

12
PG&E’s Emerging Technologies Program ET Project ET13PGE1311
Photo Credit: FNI
FIGURE 5. LIDDED UNDERFIRED BROILER
Laboratory testing was done following the ASTM F1695 test method for heavy-load cooking
to compare the new broiler technology to standard unlidded, atmospheric broilers. While
most broilers can achieve substantially higher operating temperatures, all the broilers were
adjusted to operate at 600°F for the cooking tests. Cooking was performed without a lid for
the broilers with advanced burners, for more direct comparison. The results are shown in
Table 2, where broilers #1–#6 represent conventional designs and broilers #7 and #8
represent advanced (infrared burner) designs. The advanced designs had an average
cooking-energy efficiency of 43.5% versus standard designs at 30.3%. This demonstrates a
relative 44% efficiency improvement (13.2 percentage points). Further information on the
methodology and data analysis for this study can be found in the 2013 PIER Report.
TABLE 2. THREE-FOOT UNDERFIRED BROILER ENERGY PERFORMANCE TESTING RESULTS
TEST
BROILER
RATED INPUT
(BTU/H)
COOKING ENERGY
RATE (BTU/H)1 HEAVY-LOAD COOKING-ENERGY EFFICIENCY (%)
PRODUCTION
CAPACITY (LB/H)
1 120,000 72,500 32% 57
2 105,000 78,300 31% 58
3 105,000 64,400 28% 46
1Cooking energy rate represents the energy consumption rate required to maintain 600°F in the cooking
zone.

13
PG&E’s Emerging Technologies Program ET Project ET13PGE1311
4 87,000 57,200 34% 48
5 105,000 82,400 29% 58
6 105,000 83,400 28% 56
7 105,000 64,600 41% 66
8 105,000 54,200 46% 63
These cooking-energy efficiencies were determined from cooking discrete (heavy) loads of
hamburger patties. However, the real-world (in-kitchen) efficiency drops dramatically as the
energy consumed by the broiler during periods of non-cooking (idle) is factored into the
denominator of the energy-efficiency equation. For example, a gas-underfired broiler used
to cook 100 pounds of food over an eight-hour period consumed 600,000 Btu of energy as
referenced in the 2013 PIER Appliance Report. Based on average of 300 Btu per pound of
food cooked, the total energy actually delivered to the food product over the eight-hour
period would be approximately 30,000 Btu. This translates to a real-world energy utilization
efficiency of only 5% because the rest of the time is usually spent in idle mode at the same
input rate. It is clear that a tremendous opportunity to improve overall appliance energy
efficiency exists in developing new broiler designs and usage patterns—particularly designs
that would reduce energy consumption during idle times.
Production capacity indicates the maximum amount of food (by weight) that can be cooked
on a broiler in a given amount of time. Since the ASTM test method uses hamburger patties
for the test product, production capacity is the weight, in pounds, of hamburger patties that
can be cooked by the broiler in one hour (lb/h). This number is dependent on the size of the
broiler and the length of the cook time. Table 2 shows the range in production capacities for
three-foot underfired broilers. Comparing the average production capacity of advanced
burner designs in Table 2 (units 7 and 8) with that of conventional burners (units 1-6)
indicates that a 20% improvement in production capacity can be realized with infrared
burners, which translates to faster cook times.
In addition to reducing heat gain to the kitchen space, covering the broiler with a lid will
reduce the rate that energy is consumed by the broiler while still maintaining a hot cooking
grate. Testing at the FSTC has shown that, when calibrated to 600°F, an underfired broiler
will realize a reduction of over 17% in its idle energy consumption rate (from 65,110 Btu/h
to 53,860 Btu/h on average) by simply covering the broiler grate with an improvised lid
during non-cooking periods. The tests further showed a heat gain reduction of 27% (from
6,000 to 4,400 Btu/h on average) when the broiler was covered. An ASHRAE research paper
(Owen 2013) found a conventional un-lidded broiler with a non-infrared burner operating at
an idle input rate of 73,900 Btu/h had a radiant heat gain of 9,000 Btu/h. This resulted in a
51% heat gain reduction when switching from a conventional un-lidded broiler to the IR
broiler idling with the lid closed. Thus, a lidded broiler calibrated to 600°F can maintain that
temperature while using much less energy and radiating less heat to the kitchen. The
reduced idle energy rate could also be used in conjunction with a demand ventilation control
system to reduce the exhaust airflow during non-cooking periods, thereby increasing energy
savings even further.
14
PG&E’s Emerging Technologies Program ET Project ET13PGE1311
FIELD ANALYSIS, RESULTS, AND RECOMMENDATIONS
NORM’S PLACE (DANVILLE, CA)
TECHNICAL APPROACH
SITE DESCRIPTION
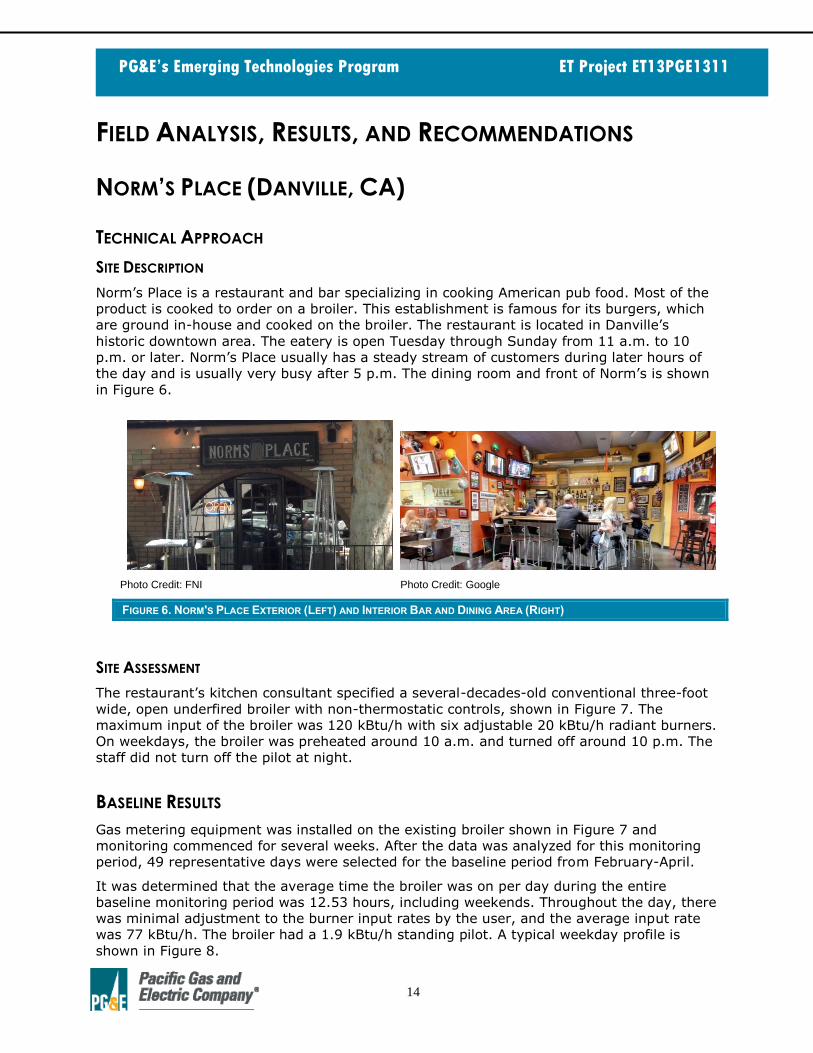
Norm’s Place is a restaurant and bar specializing in cooking American pub food. Most of the
product is cooked to order on a broiler. This establishment is famous for its burgers, which
are ground in-house and cooked on the broiler. The restaurant is located in Danville’s
historic downtown area. The eatery is open Tuesday through Sunday from 11 a.m. to 10
p.m. or later. Norm’s Place usually has a steady stream of customers during later hours of
the day and is usually very busy after 5 p.m. The dining room and front of Norm’s is shown
in Figure 6.
Photo Credit: FNI Photo Credit: Google
FIGURE 6. NORM'S PLACE EXTERIOR (LEFT) AND INTERIOR BAR AND DINING AREA (RIGHT)
SITE ASSESSMENT
The restaurant’s kitchen consultant specified a several-decades-old conventional three-foot
wide, open underfired broiler with non-thermostatic controls, shown in Figure 7. The
maximum input of the broiler was 120 kBtu/h with six adjustable 20 kBtu/h radiant burners.
On weekdays, the broiler was preheated around 10 a.m. and turned off around 10 p.m. The
staff did not turn off the pilot at night.
BASELINE RESULTS
Gas metering equipment was installed on the existing broiler shown in Figure 7 and
monitoring commenced for several weeks. After the data was analyzed for this monitoring
period, 49 representative days were selected for the baseline period from February-April.
It was determined that the average time the broiler was on per day during the entire
baseline monitoring period was 12.53 hours, including weekends. Throughout the day, there
was minimal adjustment to the burner input rates by the user, and the average input rate
was 77 kBtu/h. The broiler had a 1.9 kBtu/h standing pilot. A typical weekday profile is
shown in Figure 8.

15
PG&E’s Emerging Technologies Program ET Project ET13PGE1311
Photo Credit: FNI
FIGURE 7. EXISTING BROILER AT NORM'S PLACE
Source: FNI
FIGURE 8. THURSDAY FEB. 28, TYPICAL ENERGY PROFILE OF EXISTING BROILER AT NORM’S PLACE
The average daily gas consumption of the existing broiler was 9.59 therms per day,
averaged over 49 days of monitoring (excluding holidays and Mondays). The average
0
20
40
60
80
100
120
140
160
180
8 9 10 11 12 13 14 15 16 17 18 19 20 21 22 23 24
Ene
rgy
Inp
ut
Rat
e (
kBtu
/h)
Time of Day (h)

16
PG&E’s Emerging Technologies Program ET Project ET13PGE1311
operating time was 12.53 hours per day. Daily energy use was fairly consistent, ranging
from just under eight to eleven therms depending on the time of the week (Friday and
Saturday being the busiest days in terms of broiler operating hours). Broiler energy use and
operating hours were summarized using the scatter plots in Figure 9 to show day-to-day
operational variation. As can be seen from the graph, this variation was minimal in terms of
the broiler’s daily hours of operation. Variance in energy use as a function of hours of
operation was caused by burner modulation by the broiler operator. The graph also features
a non-zero energy value at zero hours of operation, which accounts for the energy used by
the pilot light that was never turned off. The broiler pilot energy was 2.0 kBtu/h, or 0.5
therms/day. Broiler hours of operation were defined as time where energy use was above
the pilot rate, to eliminate pilot noise.
Source: FNI
FIGURE 9. EXISTING BROILER ENERGY USE AND HOURS OF OPERATION AT NORM’S PLACE
0
1
2
3
4
5
6
7
8
9
10
11
12
0 1 2 3 4 5 6 7 8 9 10 11 12 13 14
Dai
ly G
as E
ne
rgy
Use
(th
erm
)
Daily Hours of Operation (h)
Mondays: Pilot is On, No Cooking
Tuesday - Sunday: Typical Operation

17
PG&E’s Emerging Technologies Program ET Project ET13PGE1311
REPLACEMENTS RESULTS
Photo Credit: FNI
FIGURE 10. REPLACEMENT BROILER AT NORM’S PLACE
The replacement broiler at Norm’s is shown in Figure 10 above. Several weeks of data were
analyzed; 32 days were used for replacement monitoring from September through October.
The average time the replacement lidded broiler was on per day during the entire
monitoring period was 11.86 hours, including weekends. The operator used different
sections of the broiler, turning them on or off based on the production demands. The
average input rate during the monitoring period was 73 kBtu/h. A typical weekday profile is
shown in Figure 11.
Source: FNI
FIGURE 11. THURSDAY SEPTEMBER 19, TYPICAL ENERGY PROFILE OF REPLACEMENT BROILER AT NORM’S PLACE
0
20
40
60
80
100
120
140
160
180
8 9 10 11 12 13 14 15 16 17 18 19 20 21 22 23 24
Ene
rgy
Inp
ut
Rat
e (
kBtu
/h)
Time of Day (h)
18
PG&E’s Emerging Technologies Program ET Project ET13PGE1311
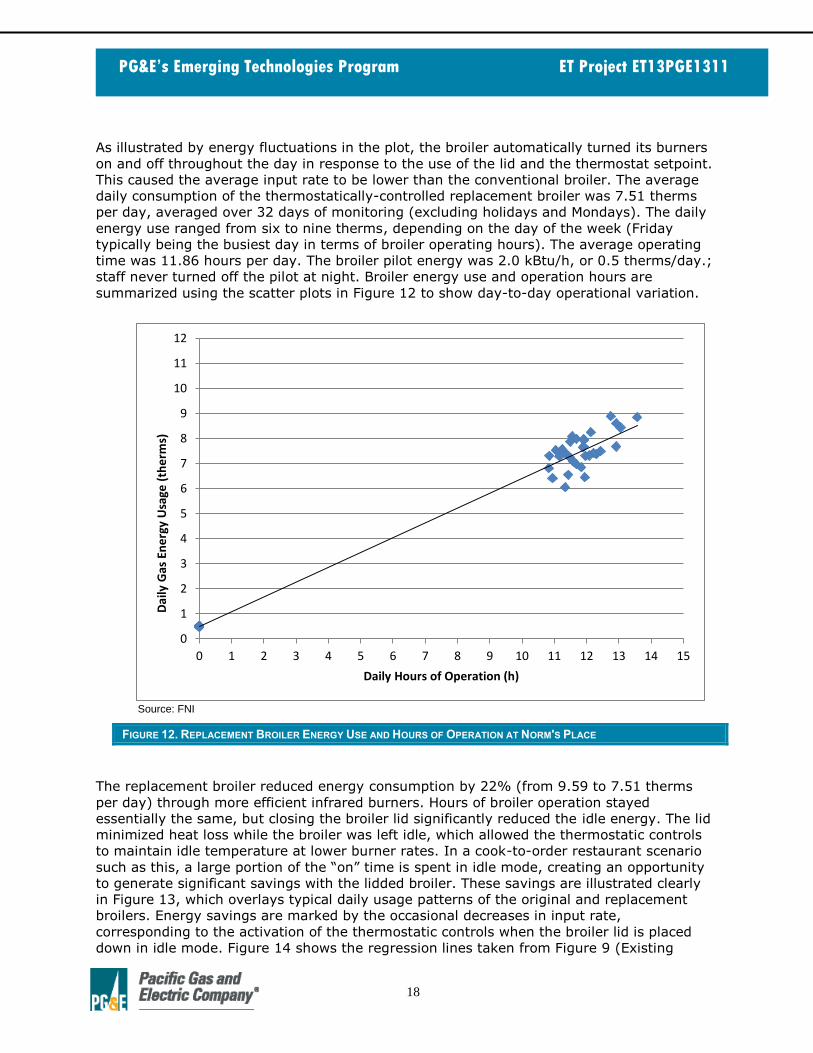
As illustrated by energy fluctuations in the plot, the broiler automatically turned its burners
on and off throughout the day in response to the use of the lid and the thermostat setpoint.
This caused the average input rate to be lower than the conventional broiler. The average
daily consumption of the thermostatically-controlled replacement broiler was 7.51 therms
per day, averaged over 32 days of monitoring (excluding holidays and Mondays). The daily
energy use ranged from six to nine therms, depending on the day of the week (Friday
typically being the busiest day in terms of broiler operating hours). The average operating
time was 11.86 hours per day. The broiler pilot energy was 2.0 kBtu/h, or 0.5 therms/day.;
staff never turned off the pilot at night. Broiler energy use and operation hours are
summarized using the scatter plots in Figure 12 to show day-to-day operational variation.
Source: FNI
FIGURE 12. REPLACEMENT BROILER ENERGY USE AND HOURS OF OPERATION AT NORM'S PLACE
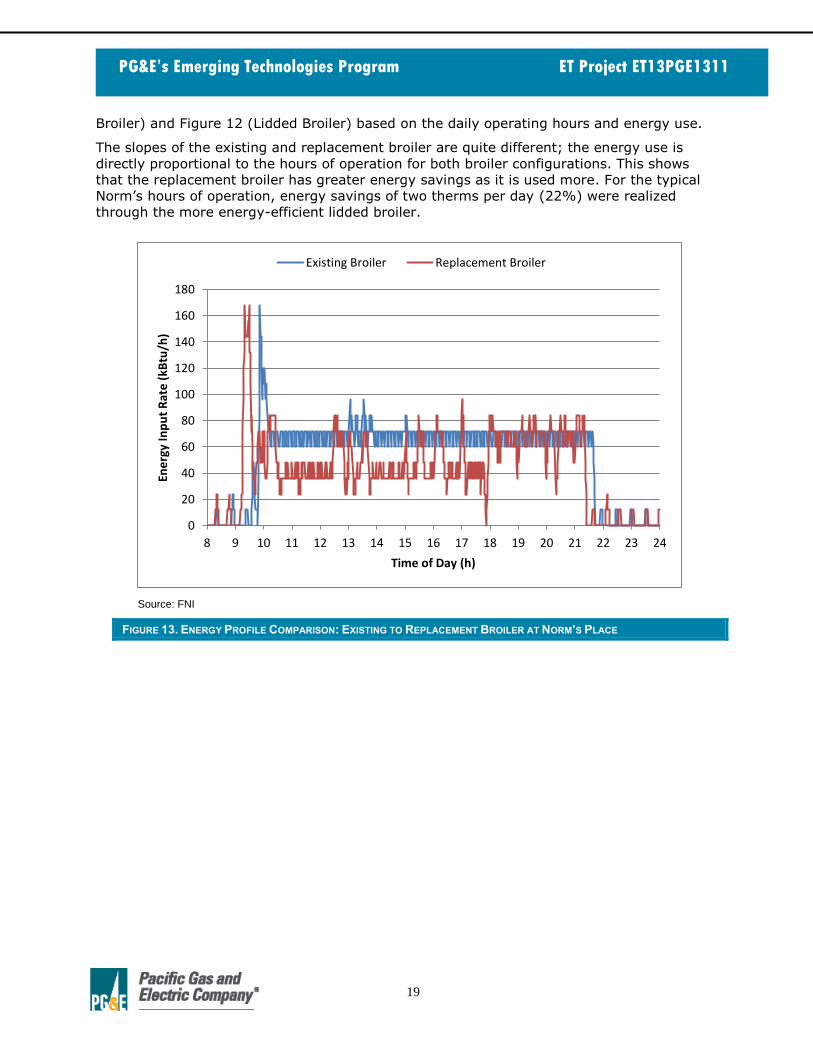
The replacement broiler reduced energy consumption by 22% (from 9.59 to 7.51 therms
per day) through more efficient infrared burners. Hours of broiler operation stayed
essentially the same, but closing the broiler lid significantly reduced the idle energy. The lid
minimized heat loss while the broiler was left idle, which allowed the thermostatic controls
to maintain idle temperature at lower burner rates. In a cook-to-order restaurant scenario
such as this, a large portion of the “on” time is spent in idle mode, creating an opportunity
to generate significant savings with the lidded broiler. These savings are illustrated clearly
in Figure 13, which overlays typical daily usage patterns of the original and replacement
broilers. Energy savings are marked by the occasional decreases in input rate,
corresponding to the activation of the thermostatic controls when the broiler lid is placed
down in idle mode. Figure 14 shows the regression lines taken from Figure 9 (Existing
0
1
2
3
4
5
6
7
8
9
10
11
12
0 1 2 3 4 5 6 7 8 9 10 11 12 13 14 15
Dai
ly G
as E
ne
rgy
Usa
ge (
the
rms)
Daily Hours of Operation (h)
19
PG&E’s Emerging Technologies Program ET Project ET13PGE1311
Broiler) and Figure 12 (Lidded Broiler) based on the daily operating hours and energy use.
The slopes of the existing and replacement broiler are quite different; the energy use is
directly proportional to the hours of operation for both broiler configurations. This shows
that the replacement broiler has greater energy savings as it is used more. For the typical
Norm’s hours of operation, energy savings of two therms per day (22%) were realized
through the more energy-efficient lidded broiler.
Source: FNI
FIGURE 13. ENERGY PROFILE COMPARISON: EXISTING TO REPLACEMENT BROILER AT NORM’S PLACE
0
20
40
60
80
100
120
140
160
180
8 9 10 11 12 13 14 15 16 17 18 19 20 21 22 23 24
Ene
rgy
Inp
ut
Rat
e (
kBtu
/h)
Time of Day (h)
Existing Broiler Replacement Broiler

20
PG&E’s Emerging Technologies Program ET Project ET13PGE1311
Source: FNI
FIGURE 14. DAILY ENERGY REGRESSION COMPARISON AT NORM’S PLACE: EXISTING TO REPLACEMENT BROILER
CUSTOMER FEEDBACK/RECOMMENDATIONS
This project was a successful demonstration of the potential savings from replacing
conventional underfired broilers with a more efficient lidded version. The manager and chefs
at Norm’s were happy with the broiler’s cooking performance and the energy savings the
appliance provided.
THE GROWLER (DANVILLE, CA)
TECHNICAL APPROACH
SITE DESCRIPTION
The Growler is a lively restaurant and bar located in the heart of Danville. The restaurant is
open Tuesday through Sunday from 11 a.m. to 11 p.m., and is known best for their burgers
and wide selection of craft beers. With the focus directed towards their drink selection, The
Growler offers only a limited menu of food options. Much of this food—including burgers,
sausages, chicken, and vegetables—is cooked on the broiler, which is the primary appliance
in the kitchen.
SITE ASSESSMENT
The appliance to be replaced was a conventional three-foot wide, open underfired broiler
with non-thermostatic controls, shown in Figure 15. The maximum input of the broiler was
114 kBtu/h with six adjustable 19 kBtu/h radiant burners. On weekdays, the broiler was
preheated around 11 a.m. and turned off around 9 p.m. The staff did not turn off the pilot
at night.
0
2
4
6
8
10
12
0 1 2 3 4 5 6 7 8 9 10 11 12 13 14
Dai
ly G
as E
ne
rgy
Usa
ge (
the
rms)
Daily Hours of Operation (h)
Existing Broiler Replacement Broiler

21
PG&E’s Emerging Technologies Program ET Project ET13PGE1311
BASELINE RESULTS
The Growler restaurant opened in an existing facility where the cooking equipment was
inherited from the previous owner. The old broiler, with non-thermostatic controls, was
refurbished and installed before the restaurant opening. The maximum input of the broiler
was 114 kBtu/h, with six adjustable 19 kBtu/h radiant burners. The gas metering equipment
was installed on the standard broiler and monitoring commenced for several weeks. After
the data was analyzed for this monitoring period, 27 representative days were selected for
the baseline period from May through June.
Photo Credit: FNI
FIGURE 15. EXISTING BROILER CARRIED OVER FROM THE PREVIOUS OWNERS TO THE GROWLER
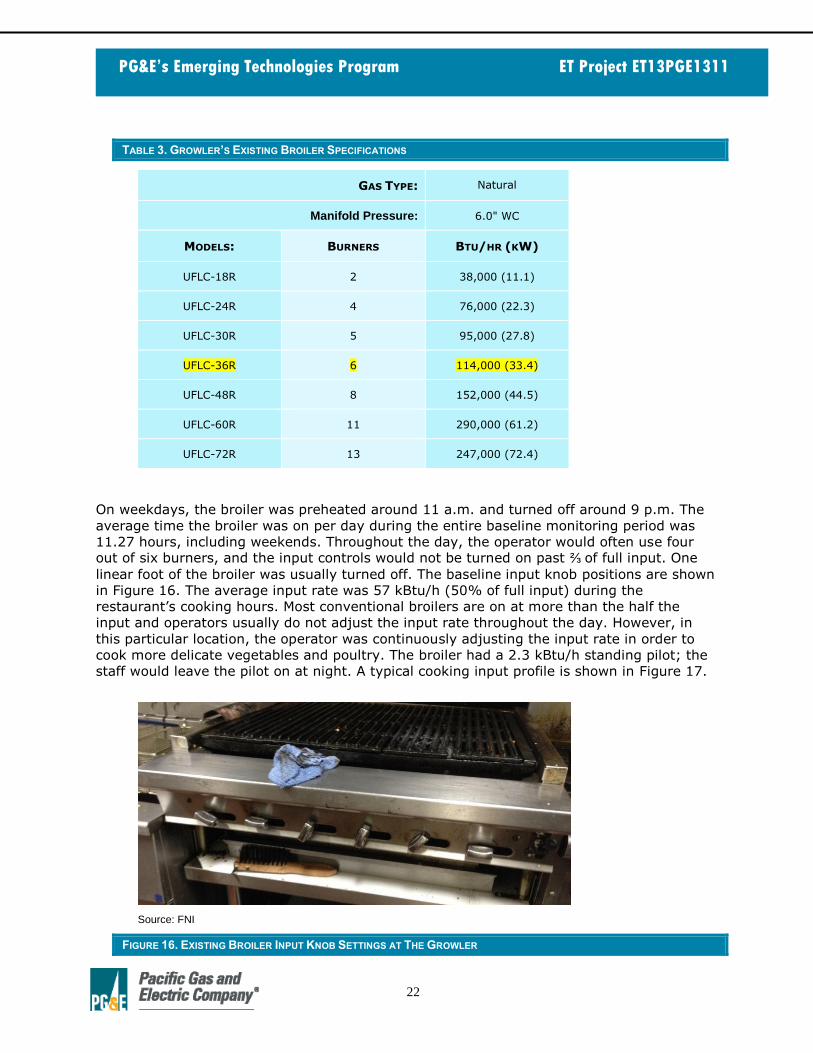
The standard broiler specifications are highlighted in yellow in Table 3 below.
22
PG&E’s Emerging Technologies Program ET Project ET13PGE1311
TABLE 3. GROWLER’S EXISTING BROILER SPECIFICATIONS
GAS TYPE: Natural
Manifold Pressure: 6.0" WC
MODELS: BURNERS BTU/HR (KW)
UFLC-18R 2 38,000 (11.1)
UFLC-24R 4 76,000 (22.3)
UFLC-30R 5 95,000 (27.8)
UFLC-36R 6 114,000 (33.4)
UFLC-48R 8 152,000 (44.5)
UFLC-60R 11 290,000 (61.2)
UFLC-72R 13 247,000 (72.4)
On weekdays, the broiler was preheated around 11 a.m. and turned off around 9 p.m. The
average time the broiler was on per day during the entire baseline monitoring period was
11.27 hours, including weekends. Throughout the day, the operator would often use four out of six burners, and the input controls would not be turned on past ⅔ of full input. One
linear foot of the broiler was usually turned off. The baseline input knob positions are shown
in Figure 16. The average input rate was 57 kBtu/h (50% of full input) during the
restaurant’s cooking hours. Most conventional broilers are on at more than the half the
input and operators usually do not adjust the input rate throughout the day. However, in
this particular location, the operator was continuously adjusting the input rate in order to
cook more delicate vegetables and poultry. The broiler had a 2.3 kBtu/h standing pilot; the
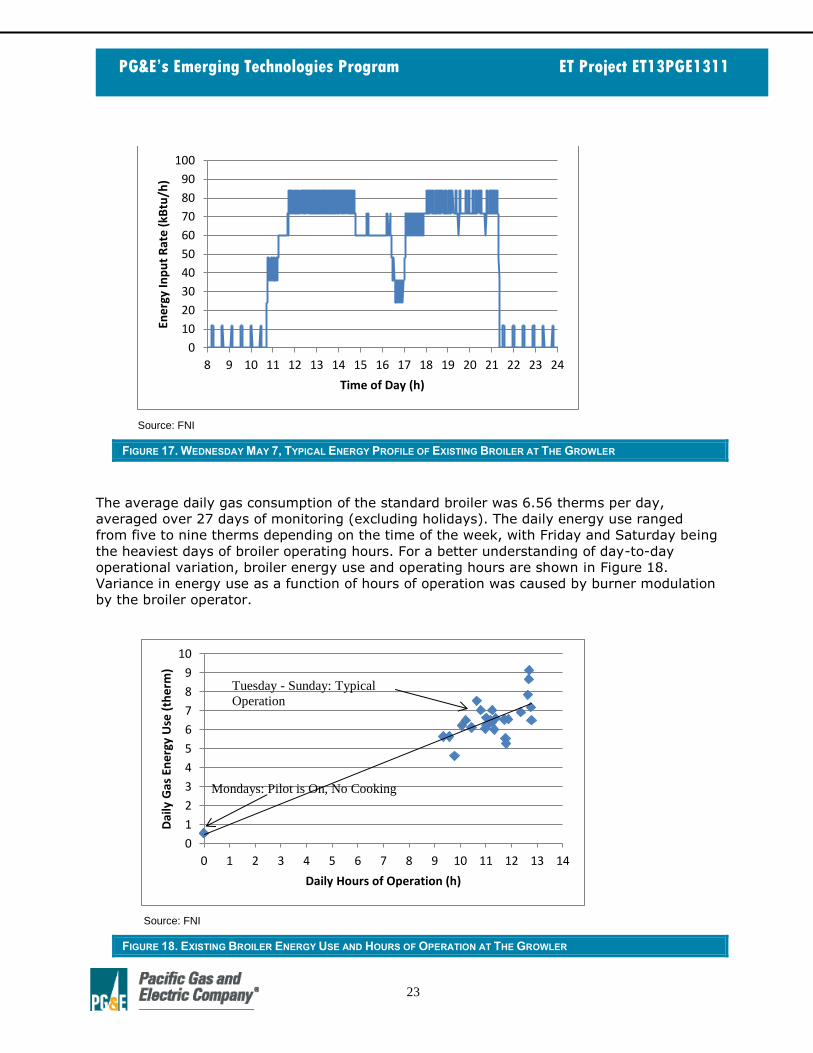
staff would leave the pilot on at night. A typical cooking input profile is shown in Figure 17.
Source: FNI
FIGURE 16. EXISTING BROILER INPUT KNOB SETTINGS AT THE GROWLER
23
PG&E’s Emerging Technologies Program ET Project ET13PGE1311
Source: FNI
FIGURE 17. WEDNESDAY MAY 7, TYPICAL ENERGY PROFILE OF EXISTING BROILER AT THE GROWLER
The average daily gas consumption of the standard broiler was 6.56 therms per day,
averaged over 27 days of monitoring (excluding holidays). The daily energy use ranged
from five to nine therms depending on the time of the week, with Friday and Saturday being
the heaviest days of broiler operating hours. For a better understanding of day-to-day
operational variation, broiler energy use and operating hours are shown in Figure 18.
Variance in energy use as a function of hours of operation was caused by burner modulation
by the broiler operator.
Source: FNI
FIGURE 18. EXISTING BROILER ENERGY USE AND HOURS OF OPERATION AT THE GROWLER
0
10
20
30
40
50
60
70
80
90
100
8 9 10 11 12 13 14 15 16 17 18 19 20 21 22 23 24
Ene
rgy
Inp
ut
Rat
e (
kBtu
/h)
Time of Day (h)
0
1
2
3
4
5
6
7
8
9
10
0 1 2 3 4 5 6 7 8 9 10 11 12 13 14
Dai
ly G
as E
ne
rgy
Use
(th
erm
)
Daily Hours of Operation (h)
Tuesday - Sunday: Typical
Operation
Mondays: Pilot is On, No Cooking
24
PG&E’s Emerging Technologies Program ET Project ET13PGE1311
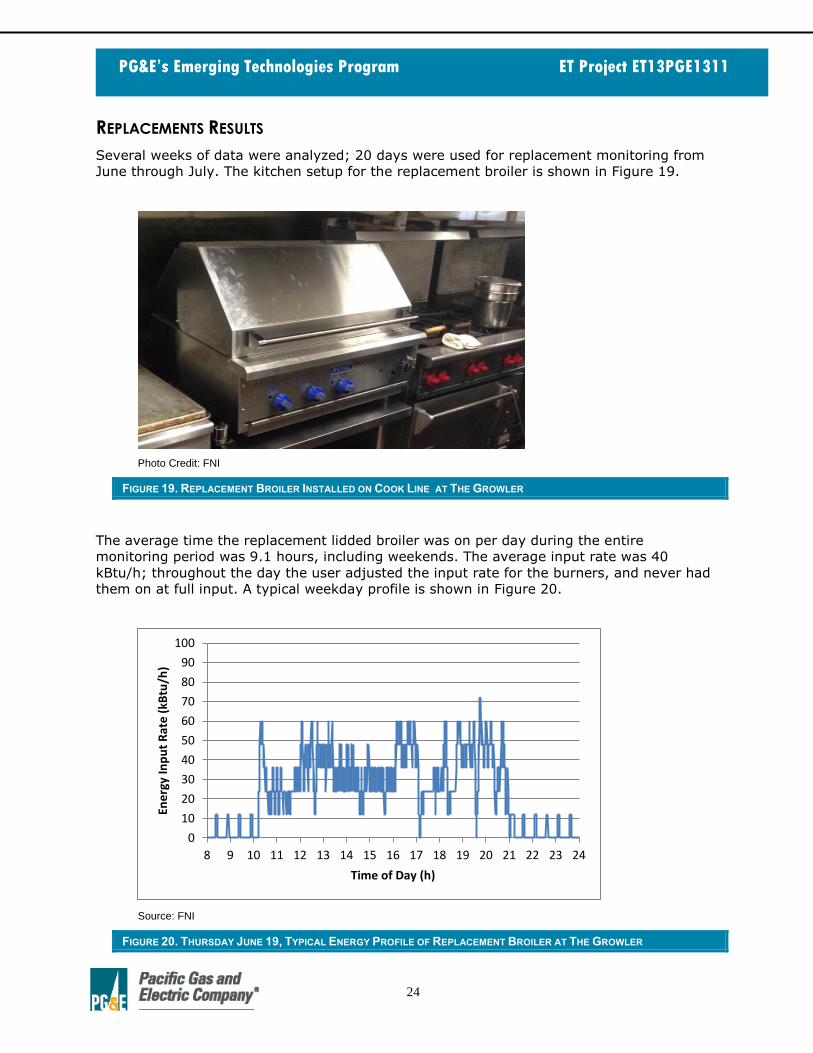
REPLACEMENTS RESULTS
Several weeks of data were analyzed; 20 days were used for replacement monitoring from
June through July. The kitchen setup for the replacement broiler is shown in Figure 19.
Photo Credit: FNI
FIGURE 19. REPLACEMENT BROILER INSTALLED ON COOK LINE AT THE GROWLER
The average time the replacement lidded broiler was on per day during the entire
monitoring period was 9.1 hours, including weekends. The average input rate was 40
kBtu/h; throughout the day the user adjusted the input rate for the burners, and never had
them on at full input. A typical weekday profile is shown in Figure 20.
Source: FNI
FIGURE 20. THURSDAY JUNE 19, TYPICAL ENERGY PROFILE OF REPLACEMENT BROILER AT THE GROWLER
0
10
20
30
40
50
60
70
80
90
100
8 9 10 11 12 13 14 15 16 17 18 19 20 21 22 23 24
Ene
rgy
Inp
ut
Rat
e (
kBtu
/h)
Time of Day (h)

25
PG&E’s Emerging Technologies Program ET Project ET13PGE1311
As illustrated by energy fluctuations in the plot, the broiler automatically turned its burners
on and off throughout the day in response to the use of the lid and the thermostat setpoint
(shown in Figure 21). This caused the average input rate to be lower than the conventional
broiler. The average daily consumption of the thermostatically-controlled replacement
broiler was 3.62 therms per day, averaged over 20 days of monitoring (excluding holidays).
The daily energy use ranged from three to five therms, depending on the day of the week
(Friday and Saturday being the busiest days in terms of broiler operating hours). The broiler
pilot energy was 2.0 kBtu/h, or 0.5 therms/day; staff never turned off the pilot at night.
Broiler energy use and operation hours are summarized using the scatter plots in Figure 22
to show day-to-day operational variation. The restaurant owner was very pleased with the
performance of the new broiler (Figure 23) and said that they would be cooking burgers on
the broiler rather than the griddle. The operator was previously using the broiler for
vegetables and chicken only, so adding the burgers to the cook load was estimated to
increase the production load of the new broiler by 50%.
Photo Credit: FNI
FIGURE 21. REPLACEMENT THERMOSTATICALLY-CONTROLLED BROILER THERMOSTAT SETPOINT AT THE GROWLER

26
PG&E’s Emerging Technologies Program ET Project ET13PGE1311
Source: FNI
FIGURE 22. REPLACEMENT BROILER ENERGY USE AND HOURS OF OPERATION AT THE GROWLER
Photo Credit: FNI
FIGURE 23. REPLACEMENT THERMOSTATICALLY-CONTROLLED BROILER INFRARED BURNERS AT THE GROWLER
When gathering data, it was noticed that often the lid was not closed during idle operation.
The operator had only one of the three burners on, so the energy savings were attributed
more to the higher-efficiency infrared burners and to a low 350°F thermostat setpoint. FSTC
0
1
2
3
4
5
6
7
8
9
10
0 1 2 3 4 5 6 7 8 9 10 11 12 13 14
Dai
ly G
as E
ne
rgy
Use
(th
erm
)
Daily Hours of Operation (h)

27
PG&E’s Emerging Technologies Program ET Project ET13PGE1311
staff highlighted this fact to the cooks and the manager, explaining the added energy-saving
benefits of leaving the lid closed whenever possible, which would result in the burners
cycling less frequently. After this discussion, closing the lid became a more standard policy
at The Growler.
After these behavioral changes were adopted, The Growler saw their replacement broiler
energy reduced from 3.62 therms per day to 3.05 therms per day, averaged over another
39 days of monitoring (excluding holidays). The time the broiler was on was reduced from
9.10 to 7.38 hours per day. The operator had mentioned at the beginning of this study that
they were planning to move towards a batch-cooking approach, where more food would be
cooked simultaneously to reduce the broiler’s on-time. The improved cooking performance
of the replacement broiler due to the IR broilers complemented The Growler’s new batch-
cooking strategy. The graph in Figure 24 below shows that the slopes of the two regression
lines are very similar, meaning that the behavioral changes mostly affected length of time
the broiler was on. This is illustrated by the location of the data point clusters, where the
post-behavioral data points are centered around 7.38 hours and the pre-behavioral data
points are centered around 9.10 hours.
Source: FNI
FIGURE 24. ENERGY USE COMPARISON AT THE GROWLER: PRE- TO POST-BEHAVIORAL CHANGE AT THE GROWLER
The replacement broiler reduced energy by 45% (from 6.56 to 3.62 therms per day)
through a lower thermostat setpoint and more efficient infrared burners. Discussions with
the operators on behavioral changes resulted in closing the lid more often, which resulted in
energy savings of additional 16% (from 3.62 to 3.05 therms per day). Closing the lid
reduced the idle energy, and in a cook-to-order restaurant scenario such as this, a majority
of the “on” time was spent in idle mode. The overlaid comparison graphs in Figure 25 clearly
illustrate the reduced energy use when the lid was used. Figure 26 shows the regression
lines taken from Figure 18 (Existing Broiler) and Figure 24 (Post-Behavioral Replacement
Broiler), based on the daily operating hours and energy use.
0
1
2
3
4
5
6
0 1 2 3 4 5 6 7 8 9 10 11 12 13 14
Dai
ly G
as e
ne
rgy
Usa
ge (
the
rms)
Daily Hours of Operation (h)
Pre Behavioral Replacement Broiler Post Behavioral Replacement Broiler
28
PG&E’s Emerging Technologies Program ET Project ET13PGE1311
Source: FNI
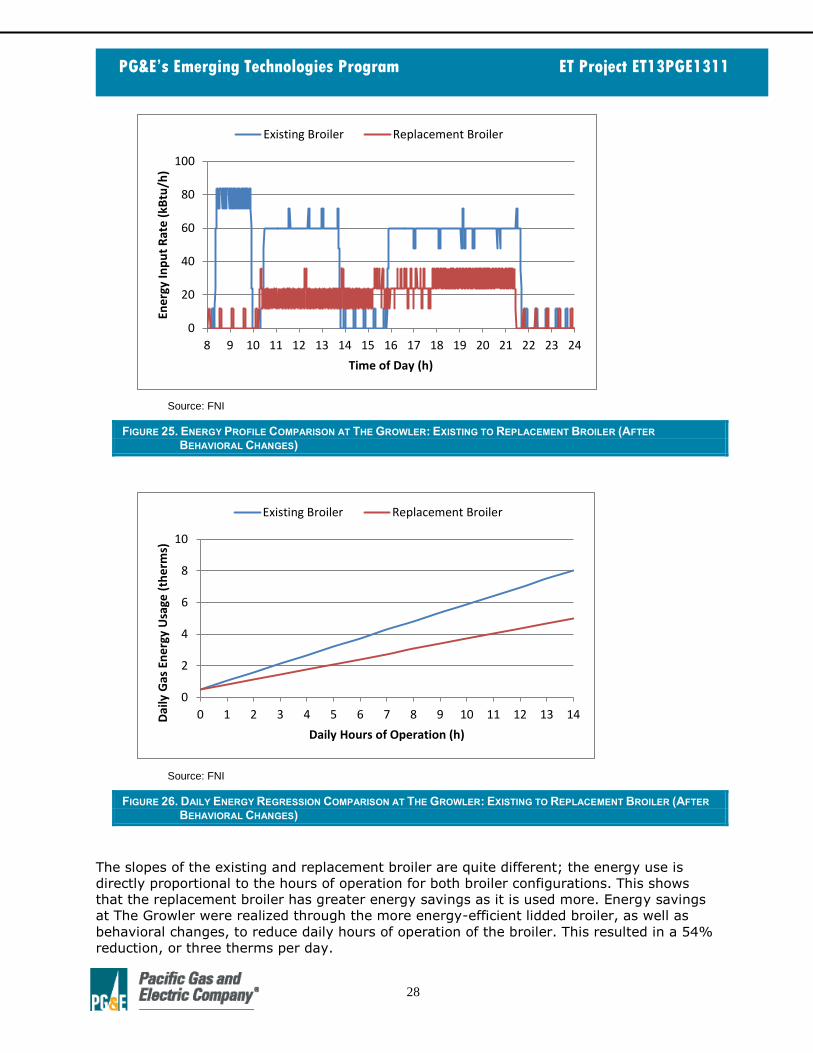
FIGURE 25. ENERGY PROFILE COMPARISON AT THE GROWLER: EXISTING TO REPLACEMENT BROILER (AFTER
BEHAVIORAL CHANGES)
Source: FNI
FIGURE 26. DAILY ENERGY REGRESSION COMPARISON AT THE GROWLER: EXISTING TO REPLACEMENT BROILER (AFTER
BEHAVIORAL CHANGES)
The slopes of the existing and replacement broiler are quite different; the energy use is
directly proportional to the hours of operation for both broiler configurations. This shows
that the replacement broiler has greater energy savings as it is used more. Energy savings
at The Growler were realized through the more energy-efficient lidded broiler, as well as
behavioral changes, to reduce daily hours of operation of the broiler. This resulted in a 54%
reduction, or three therms per day.
0
20
40
60
80
100
8 9 10 11 12 13 14 15 16 17 18 19 20 21 22 23 24
Ene
rgy
Inp
ut
Rat
e (
kBtu
/h)
Time of Day (h)
Existing Broiler Replacement Broiler
0
2
4
6
8
10
0 1 2 3 4 5 6 7 8 9 10 11 12 13 14Dai
ly G
as E
ne
rgy
Usa
ge (
the
rms)
Daily Hours of Operation (h)
Existing Broiler Replacement Broiler

29
PG&E’s Emerging Technologies Program ET Project ET13PGE1311
CUSTOMER FEEDBACK/RECOMMENDATIONS
The restaurant owner and operator were both pleased with the performance of the new
broiler, both in energy use and cooking ability. With this performance upgrade, burger
cooking will now be switched from the griddle to the broiler. The emphasis on behavioral
changes and the resulting energy savings also inspired a more energy-conscious mindset.
The operator mentioned that they were moving towards a batch-cooking approach, where
more food would be cooked simultaneously to reduce the broiler’s on-time.
SIDEBOARD (DANVILLE, CA)
TECHNICAL APPROACH
SITE DESCRIPTION
Sideboard is a New American restaurant and café recently relocated to the heart of Danville.
The restaurant is open Tuesday through Saturday from 8 a.m. to 9 p.m., and is best known
for their breakfast and lunch fare. Sideboard uses their broiler for cooking steaks and
chicken, but one of their most popular options is their burger, which is branded with their
initials. This results in significant broiler use, making it a strong candidate for appliance
replacement.
SITE ASSESSMENT
The appliance to be replaced was a conventional three-foot wide, open underfired broiler
with non-thermostatic controls, shown in Figure 27. The maximum input of the broiler was
90 kBtu/h with six adjustable 15 kBtu/h radiant burners. The broiler was typically preheated
around 7 a.m. and turned off around 9:30 p.m. The staff did not turn off the pilot at night.
BASELINE RESULTS
DATA COLLECTION AND ANALYSIS
Sideboard’s kitchen consultant specified a conventional three-foot wide, open, underfired
broiler with non-thermostatic controls, which was installed before the restaurant opening.
The gas metering equipment was installed on the standard broiler and monitoring
commenced for several months. After several months of data were analyzed, 59 days were
selected for the baseline monitoring from April through June.

30
PG&E’s Emerging Technologies Program ET Project ET13PGE1311
Photo Credit: FNI
FIGURE 27. EXISTING BROILER AT SIDEBOARD
The standard broiler specifications are highlighted in yellow in Table 4 below.
TABLE 4. SIDEBOARD’S EXISTING BROILER SPECIFICATIONS
MODEL NO. WIDTH DEPTH NO. OF BURNERS TOTAL BTU SHIP WEIGHT
RRB-12 12" 6.0”WC 1 15,000 170 lb
RRB-18 18" Btu/hr (kW) 3 45,000 235 lb
RRB-24 24" 38,000 (11.1) 4 60,000 300 lb
RRB-30 30" 76,000 (22.3) 5 75,000 340 lb
RRB-36 36" 95,000 (27.8) 6 90,000 383 lb
RRB-48 48" 114,000 (33.4) 8 120,000 460 lb
RRB-60 60" 152,000 (44.5) 10 150,000 510 lb
RRB-72 72" 290,000 (61.2) 12 180,000 670 lb
The broiler was typically preheated around 7 a.m. and turned off around 9:30 p.m. The
average time the broiler was on per day during the entire baseline monitoring period was
14.31 hours including weekends. Throughout the day the operator would adjust all six
burners and the input controls would be turned on close to ¾ of full input. The average
input rate was 75 kBtu/h (83% of full input) during the restaurant’s cooking hours. In this
particular location the operator did not adjust the input rate, regardless of whether there
was any cooking done on the broiler. The broiler had a 2.0 kBtu/h standing pilot; the staff
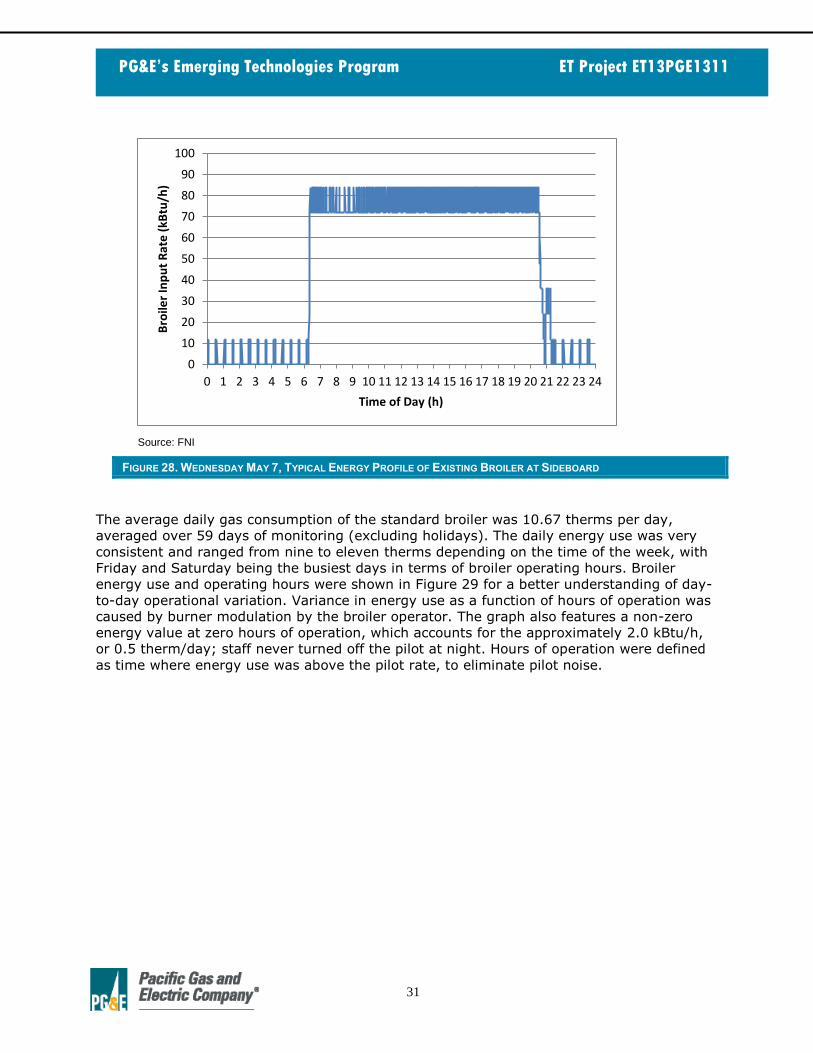
would leave the pilot on at night. A typical cooking input profile is shown in Figure 28.
31
PG&E’s Emerging Technologies Program ET Project ET13PGE1311
Source: FNI
FIGURE 28. WEDNESDAY MAY 7, TYPICAL ENERGY PROFILE OF EXISTING BROILER AT SIDEBOARD
The average daily gas consumption of the standard broiler was 10.67 therms per day,
averaged over 59 days of monitoring (excluding holidays). The daily energy use was very
consistent and ranged from nine to eleven therms depending on the time of the week, with
Friday and Saturday being the busiest days in terms of broiler operating hours. Broiler
energy use and operating hours were shown in Figure 29 for a better understanding of day-
to-day operational variation. Variance in energy use as a function of hours of operation was
caused by burner modulation by the broiler operator. The graph also features a non-zero
energy value at zero hours of operation, which accounts for the approximately 2.0 kBtu/h,
or 0.5 therm/day; staff never turned off the pilot at night. Hours of operation were defined
as time where energy use was above the pilot rate, to eliminate pilot noise.
0
10
20
30
40
50
60
70
80
90
100
0 1 2 3 4 5 6 7 8 9 10 11 12 13 14 15 16 17 18 19 20 21 22 23 24
Bro
iler
Inp
ut
Rat
e (
kBtu
/h)
Time of Day (h)

32
PG&E’s Emerging Technologies Program ET Project ET13PGE1311
Source: FNI
FIGURE 29. EXISTING BROILER ENERGY USE AND HOURS OF OPERATION AT SIDEBOARD
REPLACEMENT RESULTS
The kitchen setup for the new replacement broiler is shown in Figure 30. The thermostat
settings are shown in Figure 31. Several days of data were analyzed; Ten days were used
for replacement monitoring in the month of June. The average time the replacement lidded
broiler was on per day during the entire monitoring period was 14.56 hours, including
weekends. Throughout the day, the user adjusted the input rate for the burners and never
had them on full input. The average input rate was 68 kBtu/h.
Photo Credit: FNI
FIGURE 30. REPLACEMENT LIDDED, THERMOSTATICALLY-CONTROLLED BROILER INSTALLED ON SIDEBOARD COOK LINE
0
1
2
3
4
5
6
7
8
9
10
11
12
13
14
0 1 2 3 4 5 6 7 8 9 10 11 12 13 14 15 16
Dai
ly G
as E
ne
rgy
Usa
ge (
the
rms)
Daily Hours of Operation (h)
Pilot Only Daily Energy
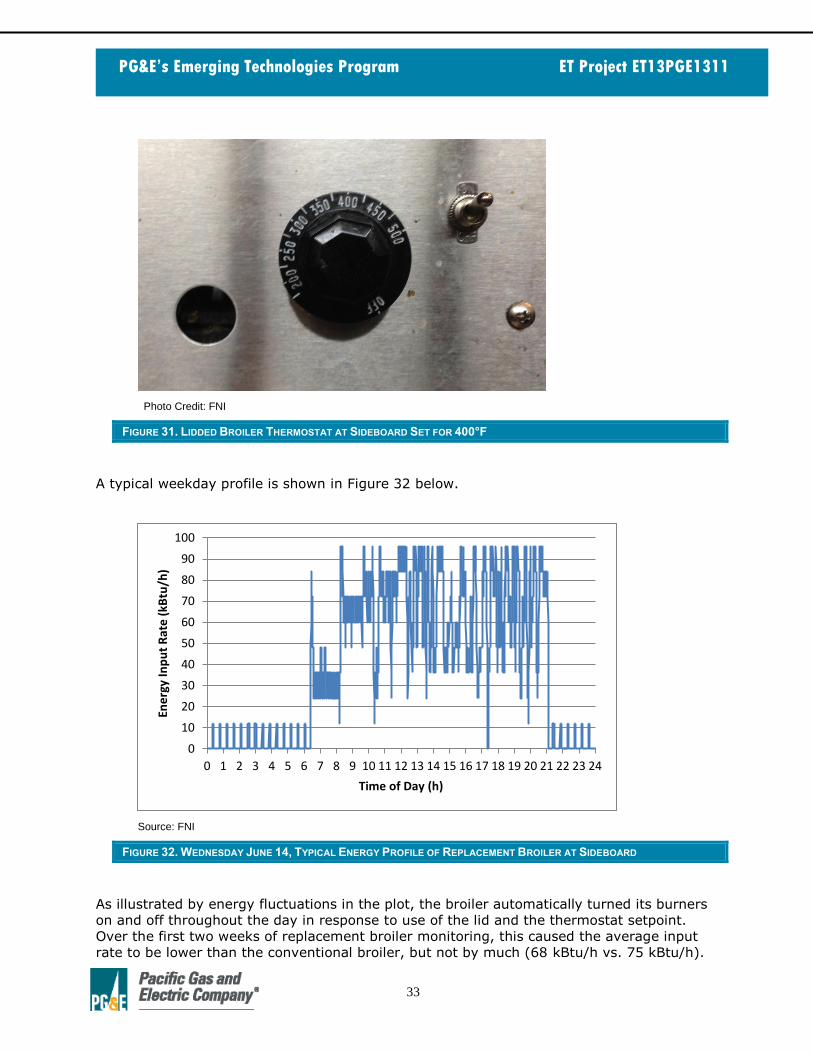
33
PG&E’s Emerging Technologies Program ET Project ET13PGE1311
Photo Credit: FNI
FIGURE 31. LIDDED BROILER THERMOSTAT AT SIDEBOARD SET FOR 400°F
A typical weekday profile is shown in Figure 32 below.
Source: FNI
FIGURE 32. WEDNESDAY JUNE 14, TYPICAL ENERGY PROFILE OF REPLACEMENT BROILER AT SIDEBOARD
As illustrated by energy fluctuations in the plot, the broiler automatically turned its burners
on and off throughout the day in response to use of the lid and the thermostat setpoint.
Over the first two weeks of replacement broiler monitoring, this caused the average input
rate to be lower than the conventional broiler, but not by much (68 kBtu/h vs. 75 kBtu/h).
0
10
20
30
40
50
60
70
80
90
100
0 1 2 3 4 5 6 7 8 9 10 11 12 13 14 15 16 17 18 19 20 21 22 23 24
Ene
rgy
Inp
ut
Rat
e (
kBtu
/h)
Time of Day (h)

34
PG&E’s Emerging Technologies Program ET Project ET13PGE1311
The average daily consumption of the replacement thermostatically-controlled broiler was
9.94 therms per day, averaged over the first ten days of monitoring after installation. The
daily energy use ranged from seven to ten therms, depending on the day of the week
(Friday and Saturday being the busiest days in terms of broiler operating hours). The broiler
pilot energy was 2.0 kBtu/h, or 0.5 therm/day; staff never turned off the pilot at night.
Broiler energy use and operating hours were summarized using the scatter plots in Figure
33 to show day-to-day operational variation. The restaurant owner was very pleased with
the performance of the new broiler. However, he was surprised by the small energy
reduction of 7%.
Source: FNI
FIGURE 33. REPLACEMENT BROILER ENERGY USE AND HOURS OF OPERATION AT SIDEBOARD
When gathering this initial replacement broiler data, it was noticed that often the lid was not
closed during idle operation. The operator had all the burners set for maximum, and the
thermostat was typically set at 400°F or above. This high thermostat setting did not allow
the broiler to cycle when the lid was open. With the operator leaving the lid open and the
input knobs set to maximum, the broiler idled at an input rate similar to when it was used
for cooking. This meant there was still opportunity for additional energy savings. After
having a talk with the cooks and the manager, they were instructed to close the lid more
often, as well as reduce the thermostat setpoint to 350°F (Figure 34).
0123456789
1011121314
0 1 2 3 4 5 6 7 8 9 10 11 12 13 14 15 16
Dai
ly G
as E
ne
rgy
Usa
ge (
the
rms)
Daily Hours of Operation (h)

35
PG&E’s Emerging Technologies Program ET Project ET13PGE1311
Photo Credit: FNI
FIGURE 34. REPLACEMENT THERMOSTATICALLY-CONTROLLED BROILER THERMOSTAT SETPOINT AT SIDEBOARD
Behavioral changes resulted in an energy reduction from 9.94 therms per day to 8.80
therms per day, averaged over another 52 days of monitoring (excluding holidays). The
time the broiler was on was slightly reduced, from 14.56 to 13.83 hours per day. The graph
in Figure 35 below shows that the slopes of the two regression lines are very similar,
meaning that the savings from the behavioral changes were mostly due to cook time
reduction. This can be seen clearly by the orange intersection lines on the graph, which
follow the daily usage hours.
Source: FNI
FIGURE 35. ENERGY USE COMPARISON: PRE- TO POST-BEHAVIORAL CHANGE AT SIDEBOARD
Initially after installation, the replacement broiler reduced energy by 7% (from 10.67 to
9.94 therms per day) through a lower thermostat setpoint and more efficient infrared
burners. After discussing what behavioral changes the operator could make, the lid was
closed more often, resulting in an additional 11% in energy savings (from 9.94 to 8.80
0123456789
1011121314
0 1 2 3 4 5 6 7 8 9 10 11 12 13 14 15 16
Dai
ly G
as E
ne
rgy
Usa
ge (
the
rms)
Daily Hours of Operation (h)
Pre Behavioral Replacement Broiler Post Behavioral Replacement Broiler
Pre Behavioral Energy Use
Post Behavioral Energy Use
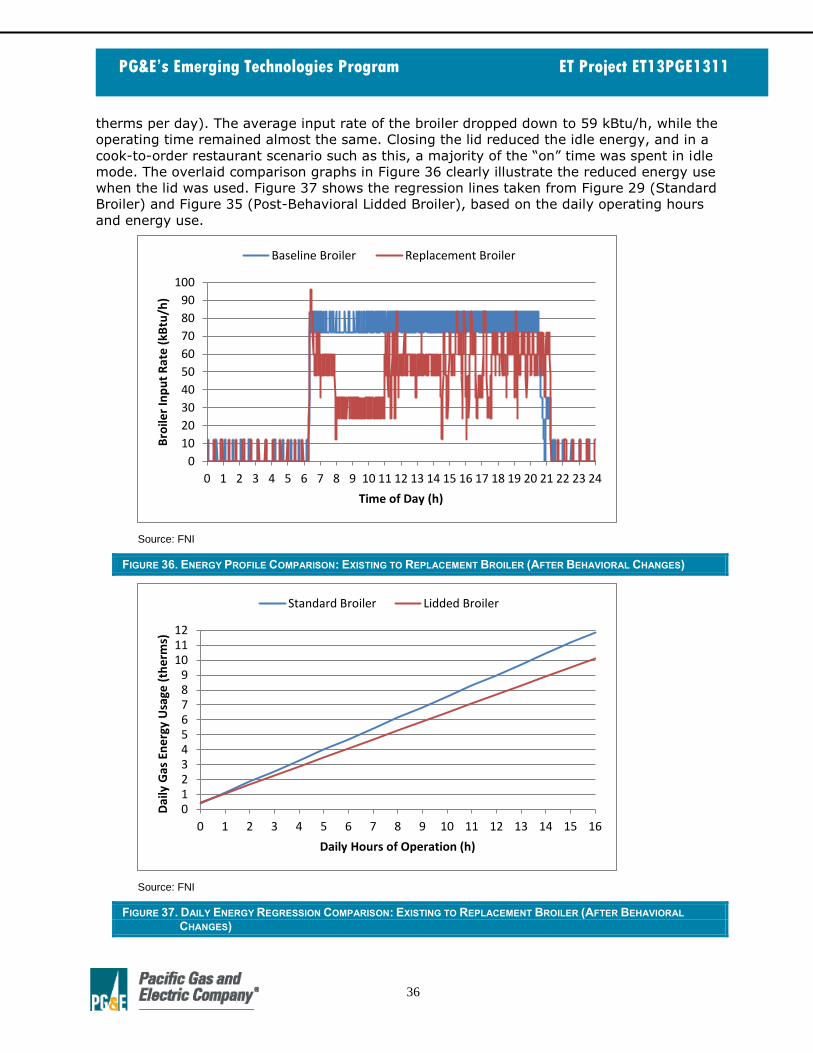
36
PG&E’s Emerging Technologies Program ET Project ET13PGE1311
therms per day). The average input rate of the broiler dropped down to 59 kBtu/h, while the
operating time remained almost the same. Closing the lid reduced the idle energy, and in a
cook-to-order restaurant scenario such as this, a majority of the “on” time was spent in idle
mode. The overlaid comparison graphs in Figure 36 clearly illustrate the reduced energy use
when the lid was used. Figure 37 shows the regression lines taken from Figure 29 (Standard
Broiler) and Figure 35 (Post-Behavioral Lidded Broiler), based on the daily operating hours
and energy use.
Source: FNI
FIGURE 36. ENERGY PROFILE COMPARISON: EXISTING TO REPLACEMENT BROILER (AFTER BEHAVIORAL CHANGES)
Source: FNI
FIGURE 37. DAILY ENERGY REGRESSION COMPARISON: EXISTING TO REPLACEMENT BROILER (AFTER BEHAVIORAL
CHANGES)
0
10
20
30
40
50
60
70
80
90
100
0 1 2 3 4 5 6 7 8 9 10 11 12 13 14 15 16 17 18 19 20 21 22 23 24
Bro
iler
Inp
ut
Rat
e (
kBtu
/h)
Time of Day (h)
Baseline Broiler Replacement Broiler
0123456789
101112
0 1 2 3 4 5 6 7 8 9 10 11 12 13 14 15 16
Dai
ly G
as E
ne
rgy
Usa
ge (
the
rms)
Daily Hours of Operation (h)
Standard Broiler Lidded Broiler

37
PG&E’s Emerging Technologies Program ET Project ET13PGE1311
The slopes of the existing and replacement broiler are quite different; the energy use is
directly proportional to the hours of operation for both broiler configurations. This shows
that the replacement broiler has greater energy savings as it is used more. Energy savings
at Sideboard were realized through the more energy-efficient lidded broiler, as well as
behavioral changes, to reduce daily hours of operation of the broiler. This resulted in an
18% reduction in energy use, or two therms per day. 11% savings can be attributed to the
behavioral changes.
CUSTOMER FEEDBACK/RECOMMENDATIONS
The Sideboard owners and chefs were very pleased with the replacement broiler. Though
the energy savings weren’t initially quite as significant as expected, the cooking
performance and temperature uniformity of the lidded broiler were lauded. Implementing
behavioral changes increased energy savings to a satisfactory level.
This project was a successful demonstration of the potential savings from replacing
conventional underfired broilers with a more efficient lidded version. It also validates the
significance of optimizing behavioral changes in staff broiler operation. Results suggest that
these savings would be most significant at establishments with long operating hours and
extended idle periods.
ESIN (DANVILLE, CA)
TECHNICAL APPROACH
SITE DESCRIPTION
Esin (Figure 38) is a fine-dining restaurant and bar located in downtown Danville,
specializing in American cuisine with Mediterranean twists. The restaurant is open seven
days a week from 11:30 a.m. to either 9 p.m. or 10 p.m., depending on the day. Esin’s
appliances typically spend a large amount of time in idle mode, since kitchen output is
relatively lower volume. Coupled with the restaurant’s long hours of operation, this signaled
a strong opportunity to generate energy savings.
Photo Credit: FNI Photo Credit: Esin
FIGURE 38. ESIN EXTERIOR (LEFT) AND INTERIOR BAR (RIGHT)
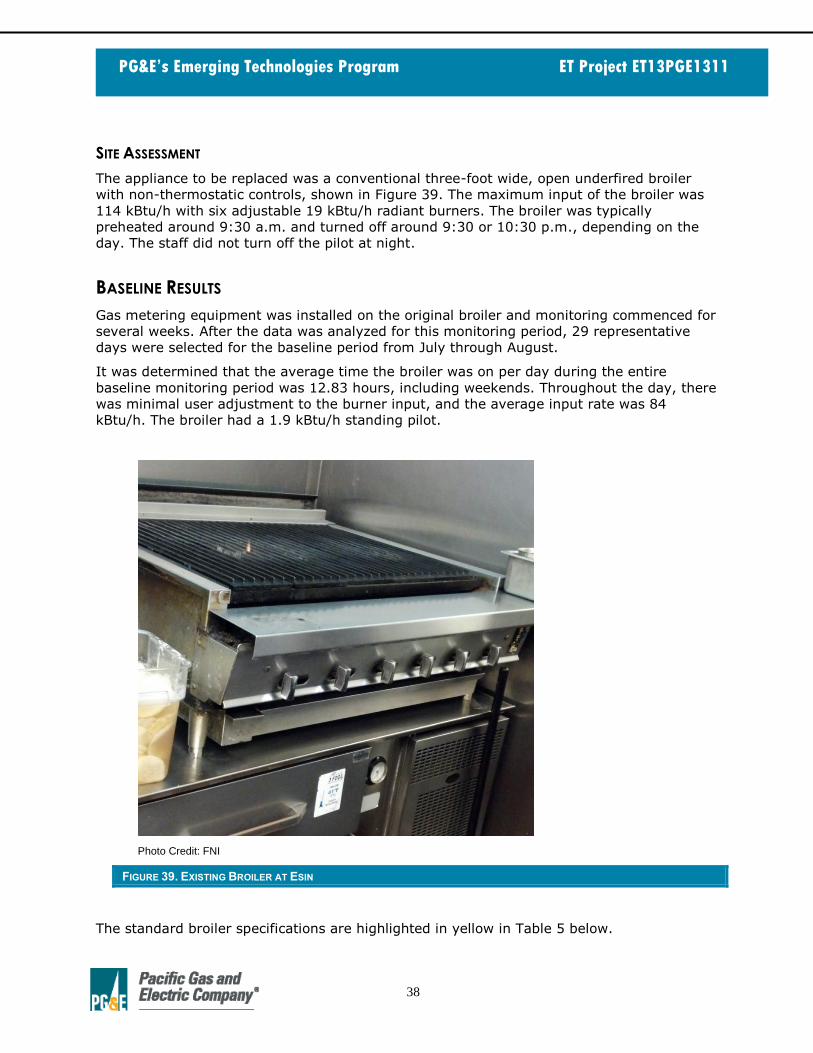
38
PG&E’s Emerging Technologies Program ET Project ET13PGE1311
SITE ASSESSMENT
The appliance to be replaced was a conventional three-foot wide, open underfired broiler
with non-thermostatic controls, shown in Figure 39. The maximum input of the broiler was
114 kBtu/h with six adjustable 19 kBtu/h radiant burners. The broiler was typically
preheated around 9:30 a.m. and turned off around 9:30 or 10:30 p.m., depending on the
day. The staff did not turn off the pilot at night.
BASELINE RESULTS
Gas metering equipment was installed on the original broiler and monitoring commenced for
several weeks. After the data was analyzed for this monitoring period, 29 representative
days were selected for the baseline period from July through August.
It was determined that the average time the broiler was on per day during the entire
baseline monitoring period was 12.83 hours, including weekends. Throughout the day, there
was minimal user adjustment to the burner input, and the average input rate was 84
kBtu/h. The broiler had a 1.9 kBtu/h standing pilot.
Photo Credit: FNI
FIGURE 39. EXISTING BROILER AT ESIN
The standard broiler specifications are highlighted in yellow in Table 5 below.
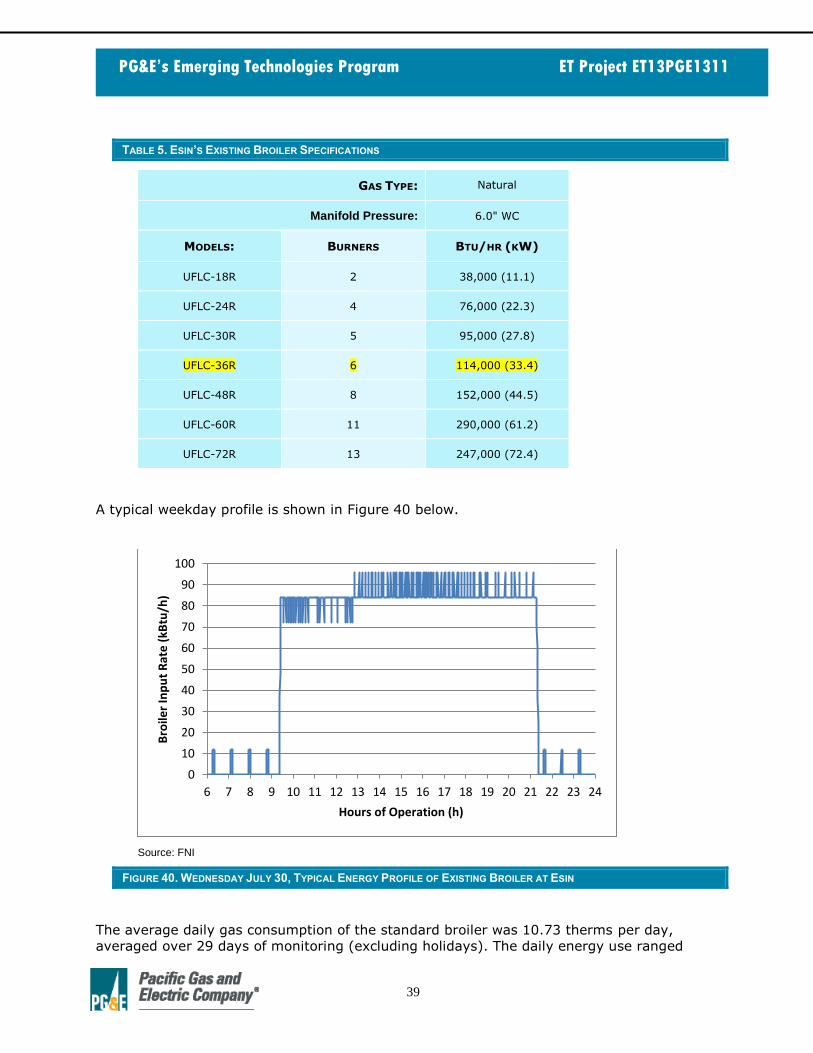
39
PG&E’s Emerging Technologies Program ET Project ET13PGE1311
TABLE 5. ESIN’S EXISTING BROILER SPECIFICATIONS
GAS TYPE: Natural
Manifold Pressure: 6.0" WC
MODELS: BURNERS BTU/HR (KW)
UFLC-18R 2 38,000 (11.1)
UFLC-24R 4 76,000 (22.3)
UFLC-30R 5 95,000 (27.8)
UFLC-36R 6 114,000 (33.4)
UFLC-48R 8 152,000 (44.5)
UFLC-60R 11 290,000 (61.2)
UFLC-72R 13 247,000 (72.4)
A typical weekday profile is shown in Figure 40 below.
Source: FNI
FIGURE 40. WEDNESDAY JULY 30, TYPICAL ENERGY PROFILE OF EXISTING BROILER AT ESIN
The average daily gas consumption of the standard broiler was 10.73 therms per day,
averaged over 29 days of monitoring (excluding holidays). The daily energy use ranged
0
10
20
30
40
50
60
70
80
90
100
6 7 8 9 10 11 12 13 14 15 16 17 18 19 20 21 22 23 24
Bro
iler
Inp
ut
Rat
e (
kBtu
/h)
Hours of Operation (h)
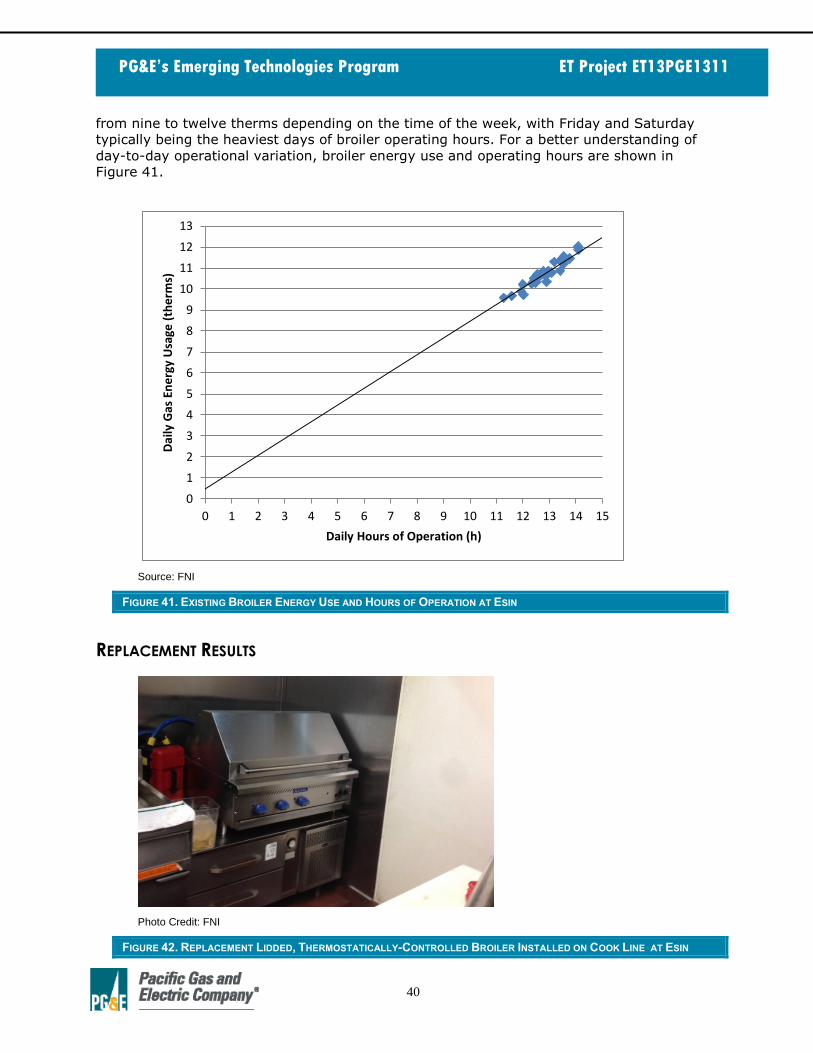
40
PG&E’s Emerging Technologies Program ET Project ET13PGE1311
from nine to twelve therms depending on the time of the week, with Friday and Saturday
typically being the heaviest days of broiler operating hours. For a better understanding of
day-to-day operational variation, broiler energy use and operating hours are shown in
Figure 41.
Source: FNI
FIGURE 41. EXISTING BROILER ENERGY USE AND HOURS OF OPERATION AT ESIN
REPLACEMENT RESULTS
Photo Credit: FNI
FIGURE 42. REPLACEMENT LIDDED, THERMOSTATICALLY-CONTROLLED BROILER INSTALLED ON COOK LINE AT ESIN
0
1
2
3
4
5
6
7
8
9
10
11
12
13
0 1 2 3 4 5 6 7 8 9 10 11 12 13 14 15
Dai
ly G
as E
ne
rgy
Usa
ge (
the
rms)
Daily Hours of Operation (h)

41
PG&E’s Emerging Technologies Program ET Project ET13PGE1311
Several weeks of data were analyzed; 15 days were used for replacement monitoring from
August through September. The kitchen setup for the new replacement broiler is shown in
Figure 42. The average time the replacement lidded broiler was on per day during the entire
monitoring period was 12.49 hours, including weekends. The average input rate was 64
kBtu/h. A typical weekday profile is shown in Figure 43.
Source: FNI
FIGURE 43. MONDAY SEPTEMBER 1, TYPICAL ENERGY PROFILE OF REPLACEMENT BROILER AT ESIN
As illustrated by energy fluctuations in the plot, the broiler automatically turned its burners
on and off throughout the day in response to the use of the lid and the thermostat setpoint.
This caused the average input rate to be lower than the conventional broiler. The average
daily consumption of the thermostatically-controlled replacement broiler was 7.98 therms
per day, averaged over 15 days of monitoring (excluding holidays). The daily energy use
ranged from six to ten therms, depending on the day of the week (Friday and Saturday
being the busiest days in terms of broiler operating hours). The broiler pilot energy was 2.0
kBtu/h, or 0.5 therm/day; staff never turned off the pilot at night. Broiler energy use and
operation hours are summarized using the scatter plots in Figure 44 to show day-to-day
operational variation.
0
10
20
30
40
50
60
70
80
90
100
0 2 4 6 8 10 12 14 16 18 20 22 24
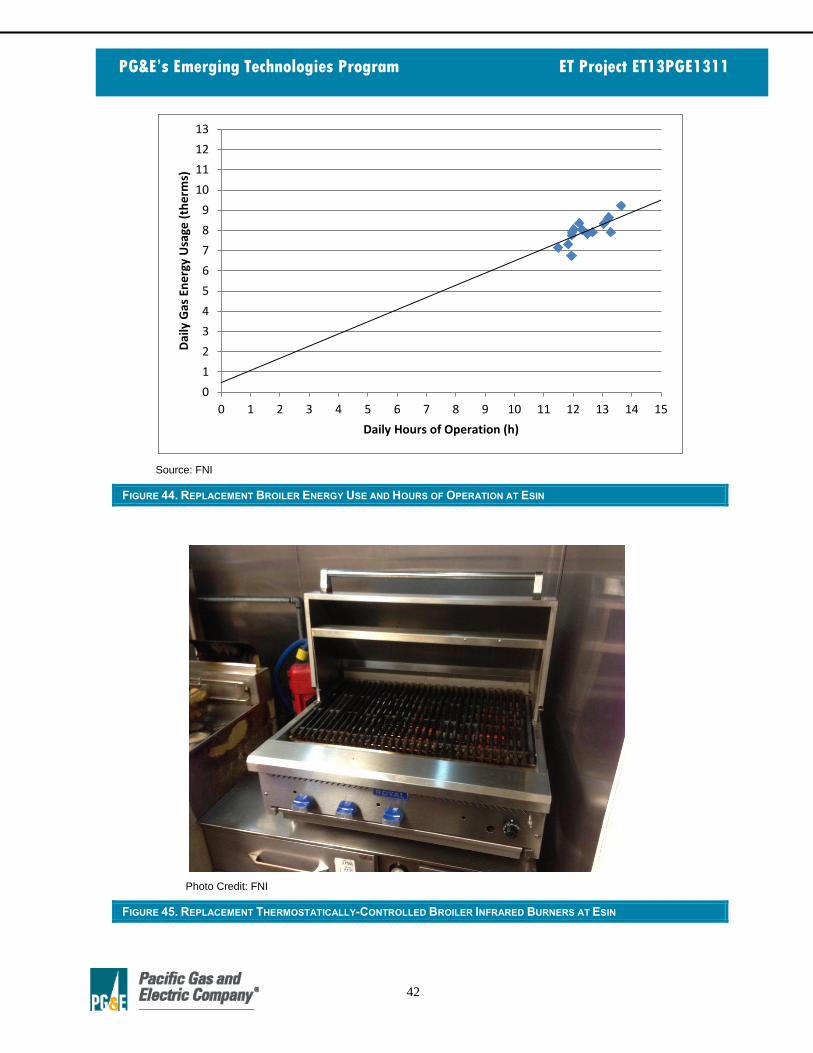
42
PG&E’s Emerging Technologies Program ET Project ET13PGE1311
Source: FNI
FIGURE 44. REPLACEMENT BROILER ENERGY USE AND HOURS OF OPERATION AT ESIN
Photo Credit: FNI
FIGURE 45. REPLACEMENT THERMOSTATICALLY-CONTROLLED BROILER INFRARED BURNERS AT ESIN
0
1
2
3
4
5
6
7
8
9
10
11
12
13
0 1 2 3 4 5 6 7 8 9 10 11 12 13 14 15
Dai
ly G
as E
ne
rgy
Usa
ge (
the
rms)
Daily Hours of Operation (h)
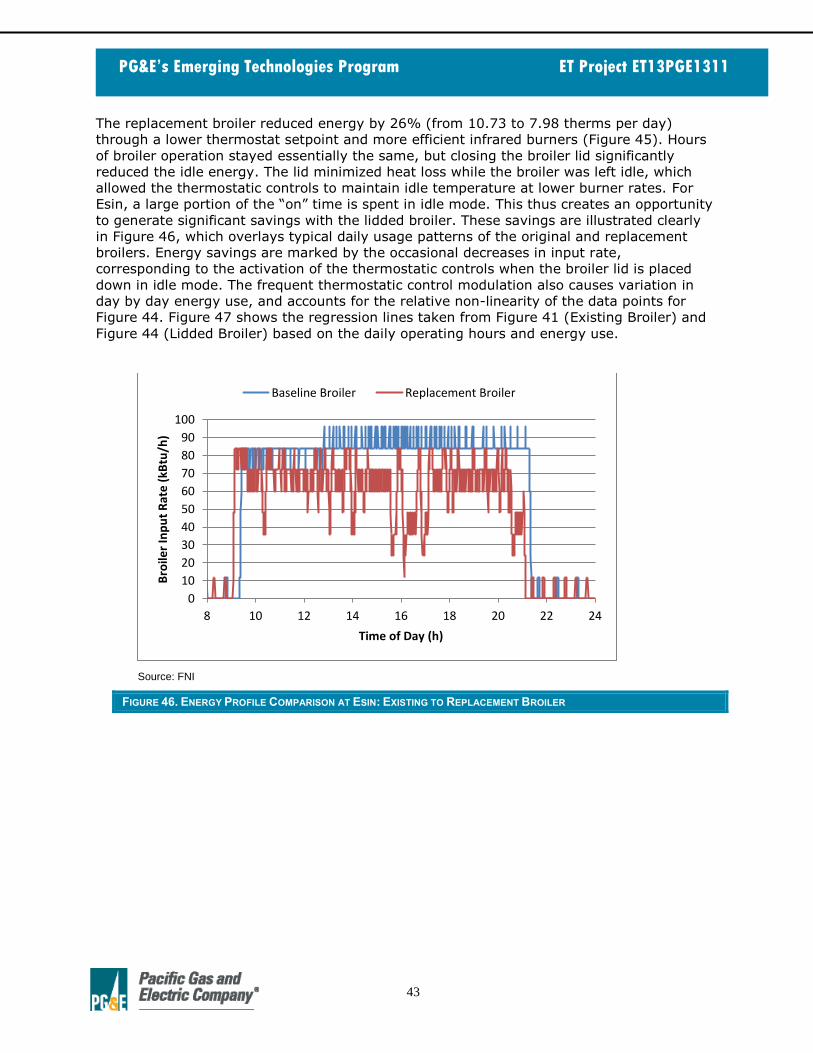
43
PG&E’s Emerging Technologies Program ET Project ET13PGE1311
The replacement broiler reduced energy by 26% (from 10.73 to 7.98 therms per day)
through a lower thermostat setpoint and more efficient infrared burners (Figure 45). Hours
of broiler operation stayed essentially the same, but closing the broiler lid significantly
reduced the idle energy. The lid minimized heat loss while the broiler was left idle, which
allowed the thermostatic controls to maintain idle temperature at lower burner rates. For
Esin, a large portion of the “on” time is spent in idle mode. This thus creates an opportunity
to generate significant savings with the lidded broiler. These savings are illustrated clearly
in Figure 46, which overlays typical daily usage patterns of the original and replacement
broilers. Energy savings are marked by the occasional decreases in input rate,
corresponding to the activation of the thermostatic controls when the broiler lid is placed
down in idle mode. The frequent thermostatic control modulation also causes variation in
day by day energy use, and accounts for the relative non-linearity of the data points for
Figure 44. Figure 47 shows the regression lines taken from Figure 41 (Existing Broiler) and
Figure 44 (Lidded Broiler) based on the daily operating hours and energy use.
Source: FNI
FIGURE 46. ENERGY PROFILE COMPARISON AT ESIN: EXISTING TO REPLACEMENT BROILER
0
10
20
30
40
50
60
70
80
90
100
8 10 12 14 16 18 20 22 24
Bro
iler
Inp
ut
Rat
e (
kBtu
/h)
Time of Day (h)
Baseline Broiler Replacement Broiler

44
PG&E’s Emerging Technologies Program ET Project ET13PGE1311
Source: FNI
FIGURE 47. DAILY ENERGY REGRESSION COMPARISON AT ESIN: EXISTING TO REPLACEMENT BROILER
The slopes of the existing and replacement broiler are quite different; the energy use is
directly proportional to the hours of operation for both broiler configurations. This shows
that the replacement broiler has greater energy savings as it is used more. Replacing the
existing broiler with a more energy-efficient lidded broiler at Esin resulted in a 26%
reduction in broiler energy use, or about three therms per day in Esin’s daily gas
consumption.
VENTILATION OBSERVATIONS
Lidded broilers provide direct energy savings in broiler use, as well as reduced heat load to
the kitchen when the lid is closed. This is significant because traditionally, broilers are
among some of the largest heat loads on the cooking line, and thus are often the biggest
drivers for high exhaust ventilation rates. For their kitchen, Esin had a DCKV system with
temperature sensors in the exhaust duct. This system included optical sensors, which detect
smoke and ramp up the exhaust fan (Figure 48).
0
2
4
6
8
10
12
0 1 2 3 4 5 6 7 8 9 10 11 12 13 14
Dai
ly G
as E
ne
rgy
Usa
ge (
the
rms)
Daily Hours of Operation (h)
Existing Broiler Replacement Broiler
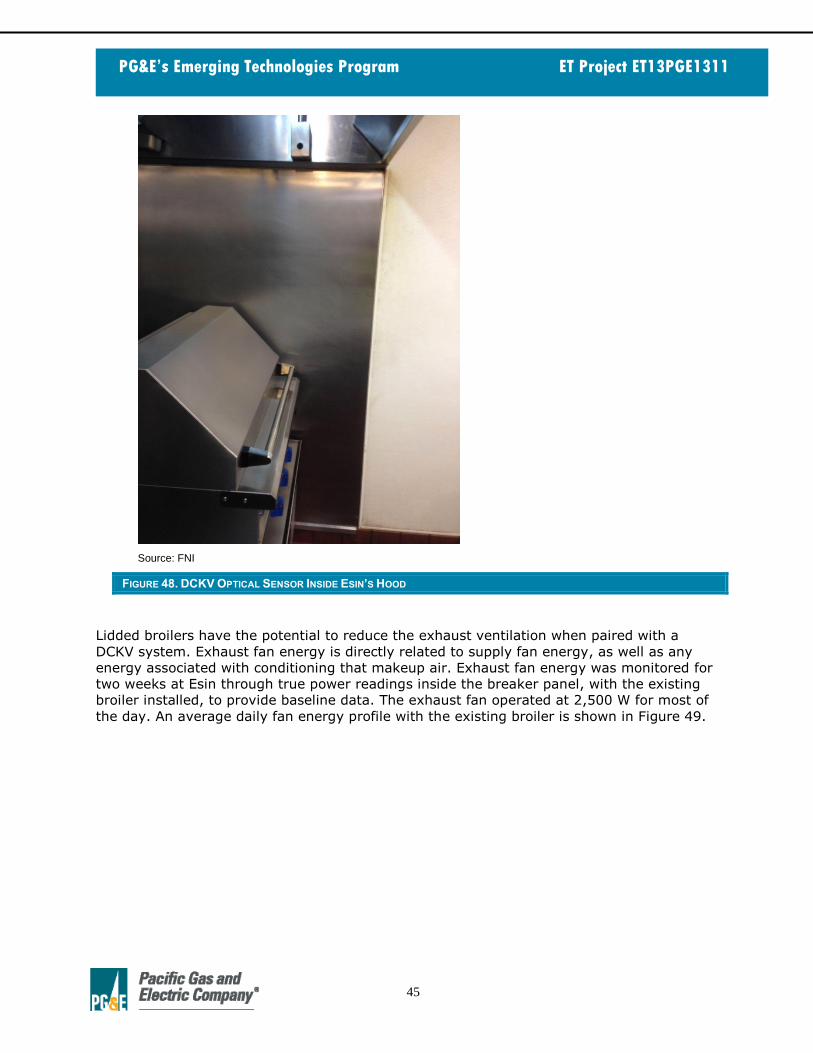
45
PG&E’s Emerging Technologies Program ET Project ET13PGE1311
Source: FNI
FIGURE 48. DCKV OPTICAL SENSOR INSIDE ESIN’S HOOD
Lidded broilers have the potential to reduce the exhaust ventilation when paired with a
DCKV system. Exhaust fan energy is directly related to supply fan energy, as well as any
energy associated with conditioning that makeup air. Exhaust fan energy was monitored for
two weeks at Esin through true power readings inside the breaker panel, with the existing
broiler installed, to provide baseline data. The exhaust fan operated at 2,500 W for most of
the day. An average daily fan energy profile with the existing broiler is shown in Figure 49.

46
PG&E’s Emerging Technologies Program ET Project ET13PGE1311
Source: FNI
FIGURE 49. ESIN’S EXHAUST FAN POWER CONSUMPTION
Analysis of the ventilation data at Esin showed that the DCKV system was not operating
properly; the exhaust fan was operating at a nearly constant rate, without any fan speed
modulation. After further investigation, it was discovered that the DCKV controls were set to
operate at 50% for an exhaust duct temperature of 75°F and at 100% for a temperature of
110°F (Figure 50).
Source: Melink Operation Manual
FIGURE 50. ESIN’S DCKV SYSTEM SETTINGS
0
500
1000
1500
2000
2500
3000
0 1 2 3 4 5 6 7 8 9 10 11 12 13 14 15 16 17 18 19 20 21 22 23 24
Exh
aust
Fan
En
erg
y D
raw
(W
)
Time of Day (h)

47
PG&E’s Emerging Technologies Program ET Project ET13PGE1311
Since Esin had a large hood with three to six burner ranges, a low efficiency fryer and a
broiler, the heat generated by these appliances resulted in duct temperatures that
consistently exceeded 110°F. Given the DCKV settings, this meant that the fan was
constantly operating at 100% speed. Thus, The DCKV system could not generate any
energy savings. Since the open broiler generated the most heat, a lidded replacement would
potentially lower the duct temperature to allow the DCKV system to modulate and realize
exhaust fan energy savings.
Though the chefs at Esin were pleased with the performance and cooking uniformity of the
lidded broiler, the 4-foot-deep ventilation hood failed to capture and contain the smoke
plume. Figure 47 illustrates the relative positioning of the lidded broiler and the ventilation
hood. The geometry of the lidded broiler caused the smoke plume to bend slightly outwards
towards the operator, as opposed to straight up. This difference was enough to impede
proper ventilation, causing smoke buildup in the kitchen during times of high-load broiler
operation. Another contributing factor to the spillover was the low ventilation system’s low
exhaust rate.
This was the first time this problem was encountered in this study. Most of the other three
sites where the lidded broiler was installed had a 4.5-foot-deep kitchen hood, and could
adequately capture and contain the broiler effluent.
Rather than abandoning the more energy-efficient lidded broiler, efforts were first made to
modify the ventilation system. Since the maximum speed of the DCKV system was
insufficient for capturing and containing the lidded broiler’s smoke plume, attempts to
increase the ventilation rate were made by increasing the fan pulley diameter, which
increased the flow rate by 22%. An average daily fan energy profile with the lidded broiler
and increased fan speed is shown in Figure 51.
Source: FNI
FIGURE 51. AVERAGE DAILY FAN ENERGY PROFILE AT ESIN
The increase in fan speed from the pulley adjustment was insufficient to fully solve the
effluent spillover problem, and resulted in increased energy use—mitigating the
0
500
1000
1500
2000
2500
3000
3500
0 1 2 3 4 5 6 7 8 9 10 11 12 13 14 15 16 17 18 19 20 21 22 23 24
Exh
aust
Fan
En
erg
y D
raw
(W
)
Time of Day (h)
48
PG&E’s Emerging Technologies Program ET Project ET13PGE1311
adjustment’s positive effects. Given their ventilation system, the lidded broiler was not
suitable for their kitchen needs, and Esin ultimately decided to reinstall their previous
broiler. Future investigations may be made into new energy efficiency broiler technologies
at this site that do not affect smoke plume.
CUSTOMER FEEDBACK/ RECOMMENDATIONS
The staff at Esin were pleased with the energy savings and cooking performance of the new
broiler. Unfortunately, the ventilation issues caused smoke to build up in the kitchen during
the busy hours of Friday and Saturday. This problem was large enough to offset the benefits
of the lidded broiler, and Esin switched back to their conventional broiler.
The broiler performed as expected, yielding strong cooking results and energy savings.
However, it was incompatible with the current kitchen setup. This project brought to light a
new issue regarding lidded broilers that must be further explored. Future investigations
should be made into new energy efficient broiler technologies that do not affect smoke
plume.
Increasing the exhaust fan ventilation speed through mechanical pulley adjustment
improved the capture of the plume of the lidded broiler. However, this adjustment did not
fully contain the plume while the lid was open with full-load cooking, and the operator
ultimately requested that their pre-existing broiler be returned in place of the lidded broiler.
The operator did not request that the pulley be adjusted back to its original settings for the
old broiler. This suggested that the original broiler may have had plume containment
problems prior to this study.
Properly-designed ventilation systems should be able to capture and contain all of the
effluent at the design airflow. The DCKV system is designed to reduce fan speed during low
load conditions for a properly designed ventilation system. If a ventilation system is
undersized in the first place, DCKV adjustments will not improve plume capture and
containment.
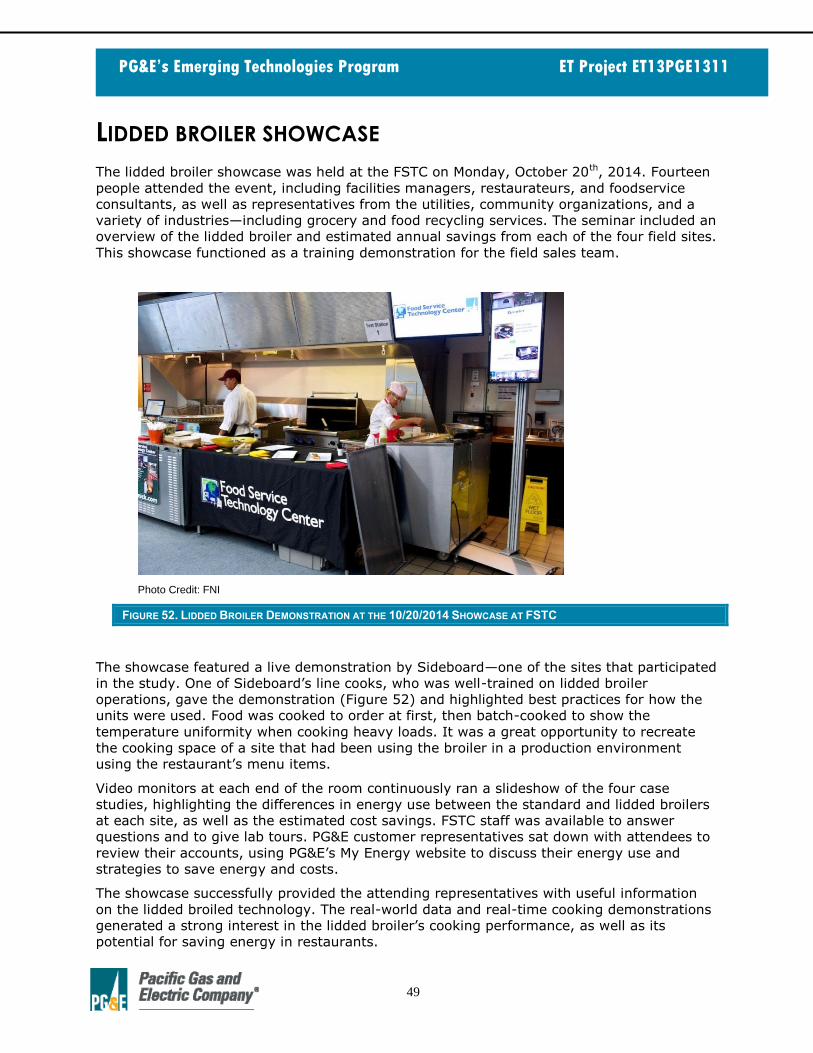
49
PG&E’s Emerging Technologies Program ET Project ET13PGE1311
LIDDED BROILER SHOWCASE
The lidded broiler showcase was held at the FSTC on Monday, October 20th, 2014. Fourteen
people attended the event, including facilities managers, restaurateurs, and foodservice
consultants, as well as representatives from the utilities, community organizations, and a
variety of industries—including grocery and food recycling services. The seminar included an
overview of the lidded broiler and estimated annual savings from each of the four field sites.
This showcase functioned as a training demonstration for the field sales team.
Photo Credit: FNI
FIGURE 52. LIDDED BROILER DEMONSTRATION AT THE 10/20/2014 SHOWCASE AT FSTC
The showcase featured a live demonstration by Sideboard—one of the sites that participated
in the study. One of Sideboard’s line cooks, who was well-trained on lidded broiler
operations, gave the demonstration (Figure 52) and highlighted best practices for how the
units were used. Food was cooked to order at first, then batch-cooked to show the
temperature uniformity when cooking heavy loads. It was a great opportunity to recreate
the cooking space of a site that had been using the broiler in a production environment
using the restaurant’s menu items.
Video monitors at each end of the room continuously ran a slideshow of the four case
studies, highlighting the differences in energy use between the standard and lidded broilers
at each site, as well as the estimated cost savings. FSTC staff was available to answer
questions and to give lab tours. PG&E customer representatives sat down with attendees to
review their accounts, using PG&E’s My Energy website to discuss their energy use and
strategies to save energy and costs.
The showcase successfully provided the attending representatives with useful information
on the lidded broiled technology. The real-world data and real-time cooking demonstrations
generated a strong interest in the lidded broiler’s cooking performance, as well as its
potential for saving energy in restaurants.
50
PG&E’s Emerging Technologies Program ET Project ET13PGE1311
CUSTOMER FEEDBACK SURVEY
Operators at the four sites where a standard broiler was replaced with a lidded char-broiler
with infrared burners and thermostatic controls were administered a set of surveys that
assessed operating patterns, as well as expectations and concerns about lidded broilers
when the operators first participated in the study. A follow-up survey evaluated the level of
satisfaction with the lidded char-broilers once they were replaced, and provided owner
feedback on the level of energy savings needed to provide an incentive for purchase. Three
of the four sites responded to the survey. The survey results can be found in Appendix 2.
PURCHASING INFLUENCES In general, survey respondents conducted their own research when purchasing appliances,
relying on retailers and kitchen designers for additional support. Many, though not all of the
pre-existing equipment was purchased new (one standard broiler was provided by the FSTC
for the purposes of this study). Cost and ease of maintenance were the top-rated factors
influencing their decision to purchase a new char-broiler, followed closely by a unit’s
condition and reputation for durability, energy-efficiency, the terms of the broiler’s
warranty, and the overall strength of the manufacturer’s brand.
SITE OPERATING PRACTICES Owners who participated in the study had a mixed record of operating practices when using
their pre-existing broilers. Some sites ran all burners at full-power. Other sites—particularly
those cooking a variety of food products simultaneously—ran their broiler in mixed mode
(with all burners on full-power on one side, and reduced power—usually 75%—on the
other). Char-broiler service and maintenance at the sites was similarly mixed. Some sites
performed regular internal maintenance to optimize broiler performance, others serviced
their broilers (such as changing out valves) only when the broiler was not functioning
properly.
The most common items cooked on the char-broiler among the survey respondents were
burgers and chicken. Batch cooking on the char-broiler was common among the
respondents, though not universal. At some sites, the broiler was were used solely for either
a-la-carte cooking at some sites; At other sites the broiler was used only used for
generating sear marks (finishing with a different cooking method). At the Growler, for
example, certain menu items would be seared on broiler, and finished in their smoker.
LIDDED CHAR-BROILER FEEDBACK Some of the concerns that respondents initially expressed about replacing their existing
char-broiler included the possibility that the thermostatically-controlled broiler would not
cook at the expected rate (because the burners would shut off at the thermostat setpoint).
Safety—specifically the potential for operator burns when closing the lid—was also an initial
concern, as was the cleaning and maintenance of the hooded area. One respondent
expressed concerns about the durability of the electrical components under the char-
broiler’s high temperatures.
Many of these concerns were addressed over the course of this study. As users saw the
lidded broiler successfully installed and operated in their production environment, and as

51
PG&E’s Emerging Technologies Program ET Project ET13PGE1311
operators were guided by FSTC staff through how to safely operate the broiler to maximize
productivity at their site, many of the concerns were eventually alleviated. One respondent
noted that there was no decline in productivity; that the lidded broiler performed as well as,
if not better than, the pre-existing broiler. However, some of these initial concerns were
also identified later as feedback after the replacement lidded broilers were installed. This
included feedback on longer cook times as well as on broiler cleaning; The additional surface
area of the lid resulted in more cleaning time for operators.. For some respondents, getting
the staff to cook with the lid down was a challenge—particularly for line items. Operators
sometimes forgot that the food was in the broiler when cooking with the lid down, and as a
result tended to overcook food if not properly trained, due to the lidded broiler’s efficiency.
First cost remained a concern at one site—a concern that would influence the decision to
purchase a lidded broiler. But the same site also noted that, while price may be a factor, as
staff continues to be educated on energy-efficiency, that they would be more inclined to
spend more on efficient equipment as a result of the savings.
Despite these concerns, respondents were generally positive on the overall performance of
the lidded broiler. On a scale of one to five, with five being the highest, the post-installation
survey indicated an overall high level of satisfaction with the replacement lidded char-broiler
in meeting operator’s production needs (4.67). Survey respondents also rated the lidded
char-broiler high on its ease of configuration and use (5.00). Owners who saw a significant
difference in their billing data as a result of the lidded char-broiler rated it high (4.00).
However, not all respondents were able to make the assessment; Sideboard removed the
lidded broiler shortly after installation due to the smoke plume spilling over their hood, so
there was not enough time to see any reduction in broiler energy use at that site.
Other specific recommendations from operators on the lidded broiler design included a
redesign of the lid to allow more smoke to exit the rear, a thermostat with two zones for lid-
down cooking when cooking multiple types of food product, and integrating a timer into the
broiler for operators to use when cooking with the lid down in order to avoid overcooking.
For future lidded broiler designs, manufactures are encouraged to consider these design
comments, and issues reported from operators.
Education on lidded broiler cooking techniques was cited as the primary tool to minimize
many barriers to optimizing cooking performance, food quality, and energy use. Sideboard,
for instance, noted that operators rarely or never closed the lid on the char broiler when it
was initially replaced (closing it during cooking only if there were one or two items to load).
After training on broiler use, the same operators began closing the lid almost 50% of the
time during cooking and almost 100% the time during idle. Sites also demonstrated several
best practices as a result of training on its unique features; At The Growler, a common
practice after broiler replacement, training, and extended use was to bring the lidded broiler
up to temperature with the lid open. When the broiler was at the desired temperature (often
above the thermostat setpoint) the food was loaded to get the proper marking, and the lid
then closed to finish at the thermostat setpoint. When asked what expected annual savings
would be needed to justify the purchase of a lidded char-broiler, $1,000 was proposed, or
roughly the first year of average expected annual savings in this study. It was also noted
that the ease of the rebate process was as important as the amount, suggesting that a
more upstream incentive approach may be needed to ensure widespread adoption in this
market.

52
PG&E’s Emerging Technologies Program ET Project ET13PGE1311
CONCLUSIONS AND RECOMMENDATIONS
Using lidded broilers with IR burners and thermostatic controls can dramatically increase
production capacity and cooking-energy efficiency —particularly when cooking with the lid
down. While many traditional restaurant operators will be reluctant to cook with the lid
down, the technique has the potential to increase cooking-energy efficiency by 18%. The
biggest energy savings with a lidded broiler, however, are from reduced idle energy rates
when the lid is down and the thermostat engaged. The site study proved that unless the lid
is closed, the lidded broiler will not result in energy savings because it will operate like a
conventional, non-thermostatically-controlled broiler. Unless the thermostat is set at a very
low temperature, the burners may still cycle during lid-up operation.
There was generally a high level of satisfaction with the broiler; Operators noted improved
cooking performance, thanks to the relative temperature uniformity of the lidded broiler’s
infrared burners. Full field analysis results can be seen below in Table 6. By utilizing the lid,
appreciable energy savings were achieved at all four restaurant locations—a 30% decrease
in energy use on average. Figure 52 illustrates the daily energy use at each site before and
after replacement. An average of about two and a half therms was saved per site. The
results for the Growler in particular, which reduced the energy use of its broiler by 54%,
demonstrate the promise of this new technology. For the two sites where behavioral change
training was implemented, an additional 14% energy savings was realized.
TABLE 6. RESTAURANT NAME, LOCATION, AND UPGRADED BROILER
RESTAURANT EXISTING
BROILER
AVERAGE
DAILY
ENERGY
USE
(THERMS)
CHANGES IN AVERAGE DAILY
ENERGY USE WITH
REPLACEMENT BROILER
(THERMS)
ENDING
AVERAGE
DAILY ENERGY
CONSUMPTION
(THERMS)
ANNUAL
OPERATING
COST
SAVINGS*
(%)
CHANGE DUE
TO
REPLACEMENT
ONLY (%)
ADDITIONAL
CHANGE DUE
TO TRAINING
(%)
Norm’s Place 9.59 -2.08 (22%) N/A 7.51 $757 (22%)
The Growler 6.56 -2.94 (45%) -0.57 (16%) 3.05 $1,278 (54%)
Sideboard 10.67 -0.73 (7%) -1.14 (11%) 8.80 $681 (18%)
Esin 10.73 -2.75 (26%) N/A 7.98 $1,001 (26%)
*Calculation for annual savings based on $1.00 per therm
Source: FNI

53
PG&E’s Emerging Technologies Program ET Project ET13PGE1311
Source: FNI
FIGURE 53. DAILY ENERGY USE BEFORE AND AFTER BROILER REPLACEMENT
While these studies may have illustrated the clear benefits of switching to lidded,
thermostatically-controlled broilers, they have also highlighted target areas for
improvement. One clear example of this is the effluent spillover that occurred at Esin. Given
the current lidded broiler design, the smoke plume was shifted forward, hampering the
ventilation of its effluent at that site. In the case of Esin, this shift was significant enough to
allow the effluent to escape and fill the kitchen during particularly high volume cooking.
Though this plume alteration was relatively minor, this rendered the broiler unfit for use,
given the current infrastructure of the restaurant’s ventilation. Thus, while lidded broiler
technology can generate significant energy savings, proper ventilation hood sizing and other
similar kitchen conditions must be considered to make the most of this emerging
technology.
As evidenced by the results at Sideboard, it is also clear that education and training of
kitchen staff on the optimal operation of lidded, thermostatically-controlled broilers is
essential to achieve a maximum energy savings. All kitchen staff involved in operating the
broiler should be educated in the optimal thermostat setting and burner knob modulation for
the restaurant’s needs. This means talking directly with all broiler operators, rather than
just the manager. Using data while explaining the potential savings associated with these
energy-saving practices was also particularly effective in spurring adoption.
In the case of Sideboard, behavioral changes resulting from training on the lidded broiler
more than doubled energy savings at the restaurant. Further monitoring that would include
operator practices when using lidded, thermostatically-controlled underfired broilers may
prove that the technology could generate even greater savings than is quantified in this
study. Based on the results found at Sideboard and The Growler, restaurants have the
potential to reduce broiler energy use by an additional 30% through behavior modification.
This means that restaurants can average about 40% energy savings by both switching to a
lidded broiler and making behavioral modifications. Best-practices on lidded broiler
operations could be adopted by manufacturers both in their literature, and by educating
their distributors and representatives in order to enable them to guide end-users at the
0
2
4
6
8
10
12
Norm's Place The Growler Sideboard Esin
Dai
ly H
ou
rs o
f O
pe
rati
on
Restaurant
Pre-Replacement
Post-Replacement

54
PG&E’s Emerging Technologies Program ET Project ET13PGE1311
point-of sale on how best to use their lidded broiler.
The energy savings from lidded broilers are already significant enough to warrant serious
consideration, but further improvements are always possible. Other potential energy-saving
enhancements that have yet to be explored would be automatic pilot ignition systems, split
broiler lids, better lid insulation, and the use of demand response ventilation systems. A
two-stage gas valve, controlled by lid position, may be an alternative to the thermostat and
could also be researched. Additionally, an altered lid design for improved effluent capture
and containment could help solve ventilation difficulties. In terms of behavioral changes,
implementation of closed-lid cooking should also prove to be valuable. Combined with
education and training of kitchen staff on other aspects of the optimal operation of lidded,
thermostatically-controlled broilers, these changes should contribute to even greater
potential energy savings.
Overall, there is great potential savings with the lidded broiler, especially in restaurants that
leave their units idling for long periods. For widespread market adoption, the lidded broiler
concept will need to be refined and promoted by the manufacturers. Once the industry and
the end-users become aware of the large potential savings of the lidded broiler, more
manufacturers will begin adopting and improving the technology. Further market adoption
will also spur cost reductions, thanks to increased sales volume to offset the initial R&D
costs already invested into the technology. In the current market, the cost of steel is the
primary driver of broiler price. Given that lidded broilers use only an estimated 20%-30%
more steel than conventional broilers, it is clear that the current lidded broiler price (almost
three times that of the conventional broiler) has significant room for reduction. However, to
drive early adoption sales and ultimately drop the price point down to where it should be,
initial market stimulation is needed.
The savings realized by lidded broilers makes it a viable early-replacement candidate. With
cost savings between $750 and $1,000 at the sites studied, operators could realize a four
year or less simple payback period based on the broiler’s current $3,800 purchase price. A
rebate equivalent to the first year of savings could reduce this payback period to under
three years—further enhancing the potential for its increased adoption in the marketplace.
With the merits of this maturing new technology now validated, further investigation should
be made into quantifying the benefits of specific features. For example, studies could be
done on unlidded broilers with IR burners or lidded broilers with atmospheric burners and
radiant plates. By isolating the different features of the advanced broiler investigated in this
study, insight could be gained on the contribution of each individual feature towards energy
savings. Through this type of investigation, lidded broiler technology could be further
refined, for combined energy and cost effectiveness.

A-1
PG&E’s Emerging Technologies Program ET Project ET13PGE1311
APPENDIX 1: APPLIANCE SPECIFICATIONS
Royal RIBT-36

A-2
PG&E’s Emerging Technologies Program ET Project ET13PGE1311
APPENDIX 2: SURVEY RESULTS
ESIN PRE-MONITORING SURVEY

A-3
PG&E’s Emerging Technologies Program ET Project ET13PGE1311
APPENDIX 2: SURVEY RESULTS (CONTINUED)
Esin Pre-monitoring Survey, Page 2

A-4
PG&E’s Emerging Technologies Program ET Project ET13PGE1311
APPENDIX 2: SURVEY RESULTS (CONTINUED)
ESIN POST-MONITORING SURVEY

A-5
PG&E’s Emerging Technologies Program ET Project ET13PGE1311
APPENDIX 2: SURVEY RESULTS (CONTINUED)
Esin Post-monitoring Survey, Page 2
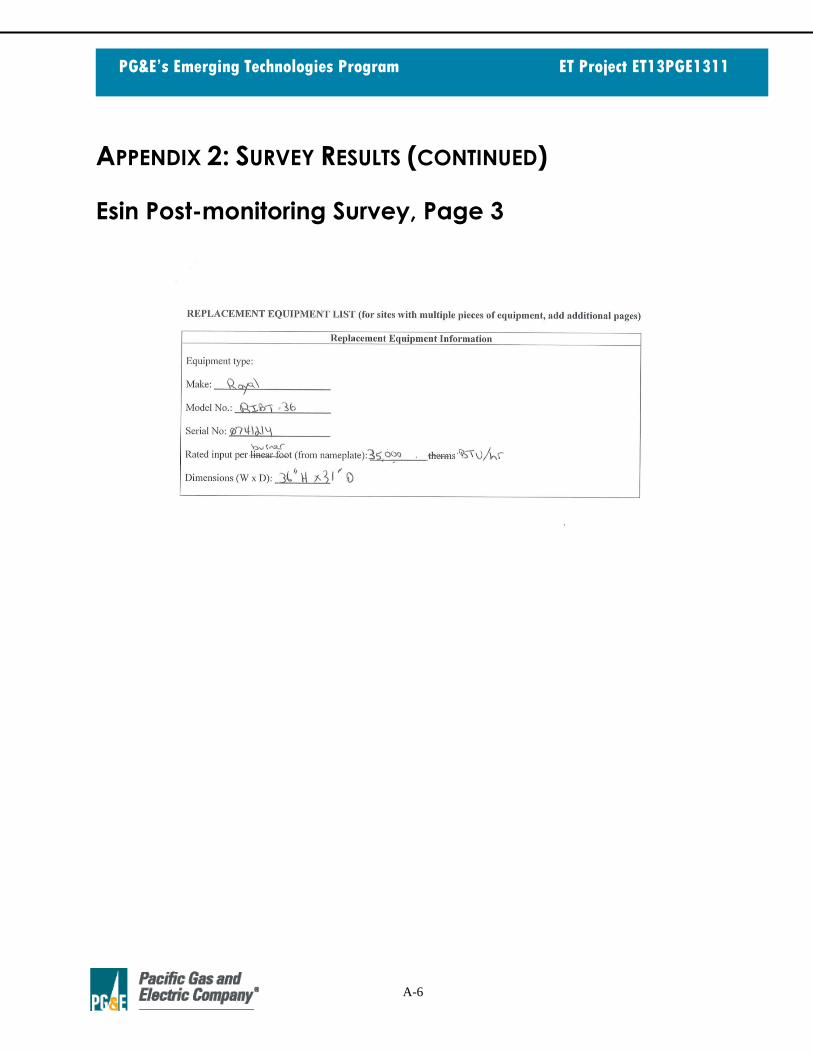
A-6
PG&E’s Emerging Technologies Program ET Project ET13PGE1311
APPENDIX 2: SURVEY RESULTS (CONTINUED)
Esin Post-monitoring Survey, Page 3

A-7
PG&E’s Emerging Technologies Program ET Project ET13PGE1311
APPENDIX 2: SURVEY RESULTS (CONTINUED)
GROWLER PRE-MONITORING SURVEY

A-8
PG&E’s Emerging Technologies Program ET Project ET13PGE1311
APPENDIX 2: SURVEY RESULTS (CONTINUED)
Growler Pre-monitoring Survey, Page 2
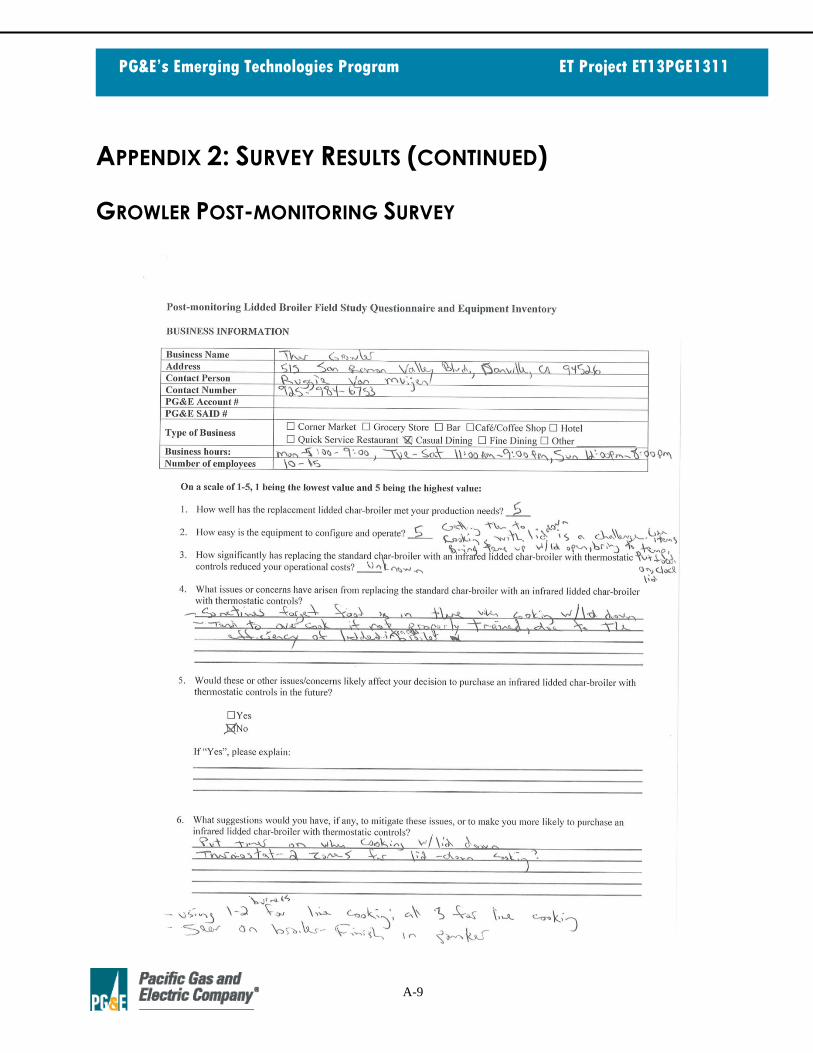
A-9
PG&E’s Emerging Technologies Program ET Project ET13PGE1311
APPENDIX 2: SURVEY RESULTS (CONTINUED)
GROWLER POST-MONITORING SURVEY

A-10
PG&E’s Emerging Technologies Program ET Project ET13PGE1311
APPENDIX 2: SURVEY RESULTS (CONTINUED)
Growler Post-monitoring Survey, Page 2
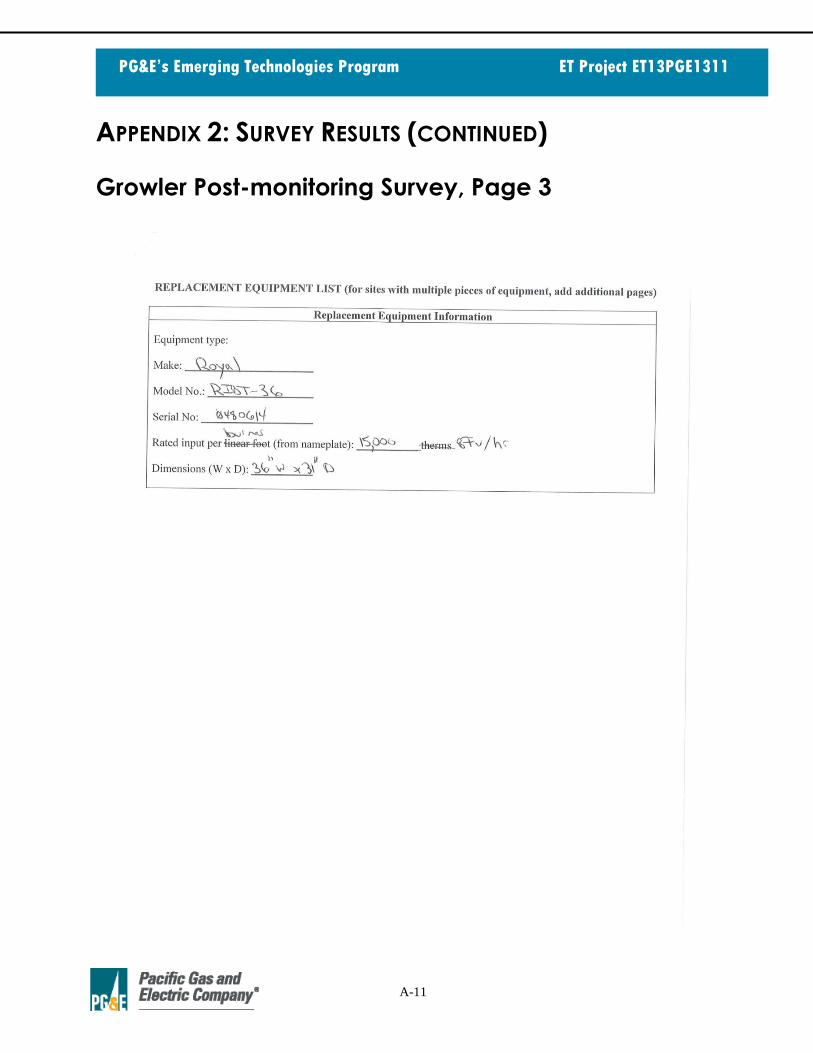
A-11
PG&E’s Emerging Technologies Program ET Project ET13PGE1311
APPENDIX 2: SURVEY RESULTS (CONTINUED)
Growler Post-monitoring Survey, Page 3

A-12
PG&E’s Emerging Technologies Program ET Project ET13PGE1311
APPENDIX 2: SURVEY RESULTS (CONTINUED)
SIDEBOARD PRE-MONITORING SURVEY
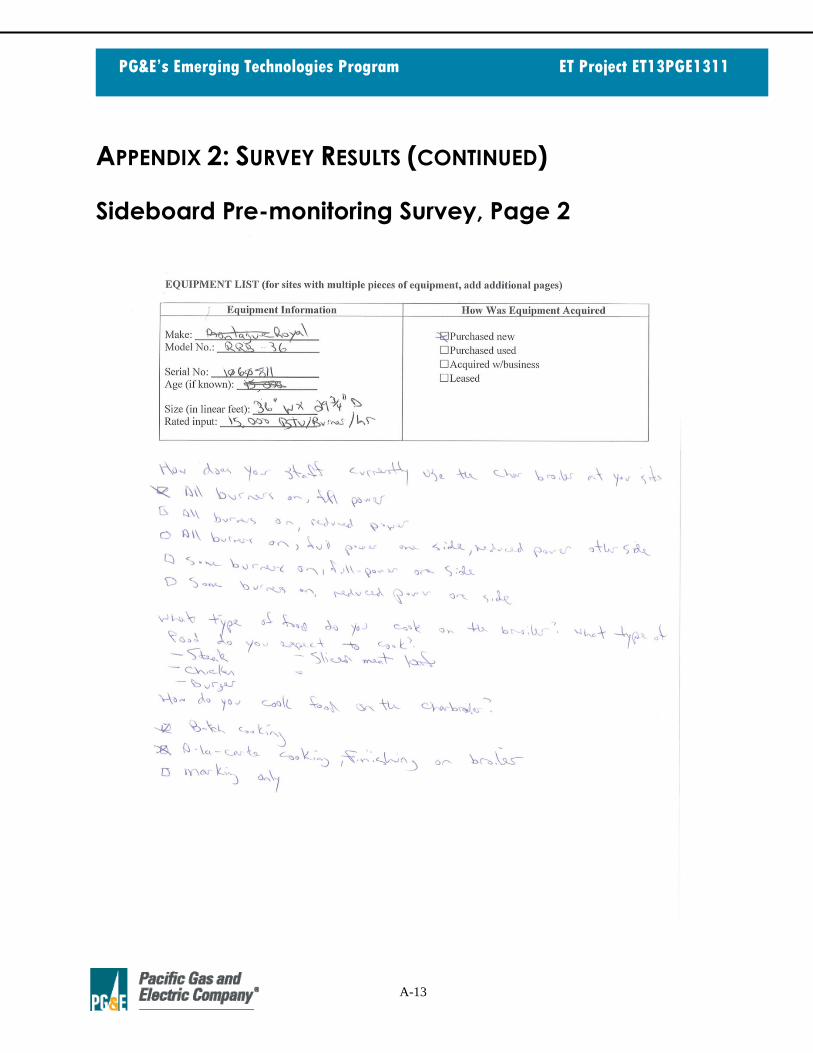
A-13
PG&E’s Emerging Technologies Program ET Project ET13PGE1311
APPENDIX 2: SURVEY RESULTS (CONTINUED)
Sideboard Pre-monitoring Survey, Page 2

A-14
PG&E’s Emerging Technologies Program ET Project ET13PGE1311
APPENDIX 2: SURVEY RESULTS (CONTINUED)
SIDEBOARD POST-MONITORING SURVEY
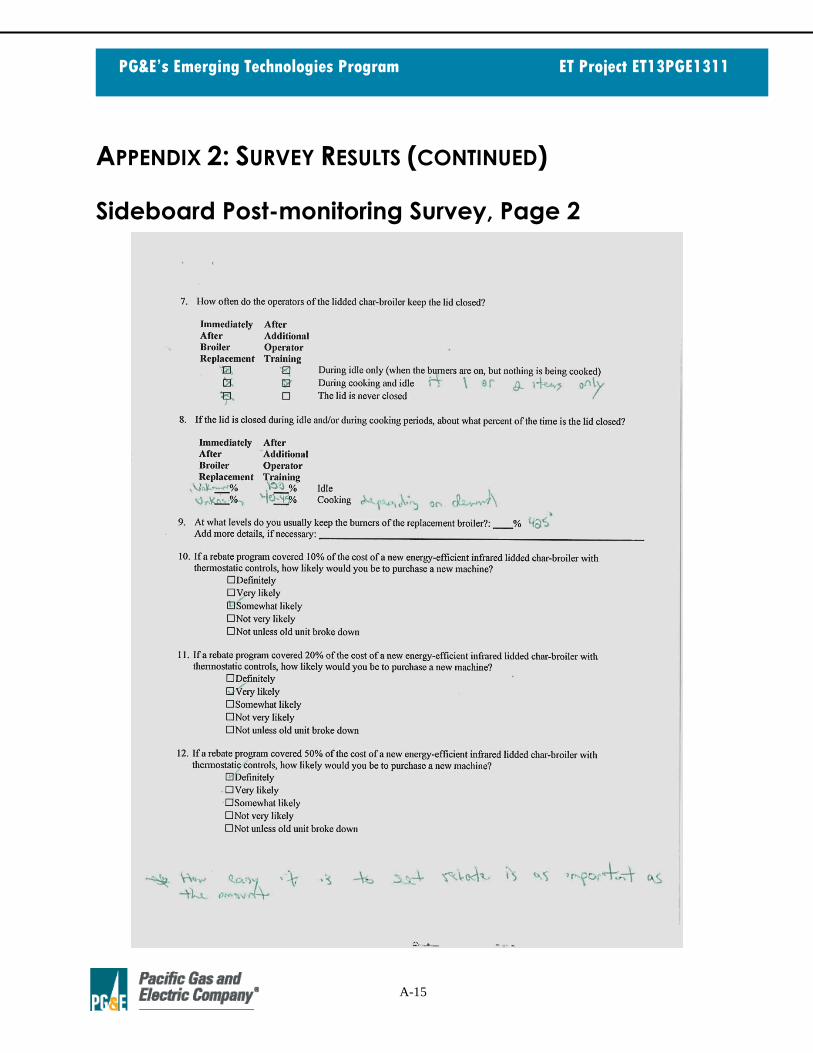
A-15
PG&E’s Emerging Technologies Program ET Project ET13PGE1311
APPENDIX 2: SURVEY RESULTS (CONTINUED)
Sideboard Post-monitoring Survey, Page 2

A-16
PG&E’s Emerging Technologies Program ET Project ET13PGE1311
APPENDIX 2: SURVEY RESULTS (CONTINUED)
Sideboard Post-monitoring Survey, Page 3

A-17
PG&E’s Emerging Technologies Program ET Project ET13PGE1311
APPENDIX 3: “CASE STUDIES IN ENERGY-EFFICIENT LIDDED
CHAR-BROILERS” SHOWCASE (10/20/14)

A-18
PG&E’s Emerging Technologies Program ET Project ET13PGE1311
APPENDIX 3: “CASE STUDIES IN ENERGY-EFFICIENT LIDDED
CHAR-BROILERS” SHOWCASE (10/20/14)—CONTINUED

A-19
PG&E’s Emerging Technologies Program ET Project ET13PGE1311
APPENDIX 3: “CASE STUDIES IN ENERGY-EFFICIENT LIDDED
CHAR-BROILERS” SHOWCASE (10/20/14)—CONTINUED

A-20
PG&E’s Emerging Technologies Program ET Project ET13PGE1311
APPENDIX 3: “CASE STUDIES IN ENERGY-EFFICIENT LIDDED
CHAR-BROILERS” SHOWCASE (10/20/14)—CONTINUED

A-21
PG&E’s Emerging Technologies Program ET Project ET13PGE1311
REFERENCES
Johnson, Frank. Fisher, Don. Brand, Larry. Heustis, Eddie (July 2013). Advanced
Foodservice Appliances for California Restaurants. Commission Contract No. #500-2014-
021.
Owen, Mark (2013). ASHRAE Handbook of Fundamentals. Atlanta, GA:ASHRAE.
Zabrowski, David. Mills, Lauren (April 2010), Characterizing the Energy Efficiency Potential
of Gas-Fired Commercial Foodservice Equipment. Commission Contract No. #500-06-028.


