Phosphate Rock in Wyoming
Jacob D. Carnes
Report of Investigations No. 68 • 2015
WYOMING STATE GEOLOGICAL SURVEYThomas A. Drean, Director and State Geologist
Director and State Geologist Thomas A. Drean
Editing by:Sarah R. Garlick
Phosphate Rock in Wyoming
Design and layout by:James R. Rodgers
Wyoming State Geological Survey (WSGS) Report of Investigations No. 68, 2015
The WSGS encourages fair use of its material. We request that credit be expressly given to the “Wyoming State Geological Survey” when citing information from this publication. Please contact the WSGS at 307-766-2286, ext. 224, or by email at [email protected], if you have any questions about citing materials, preparing acknowledgments, or extensive use of this material. We appreciate your cooperation.
Any use of trade, product, or firm names in this publication is for descriptive purposes only and does not imply endorsement or approval by the State of Wyoming or the WSGS. Individuals with disabilities who require an alternate form of this publication should contact the WSGS. TTY relay operator 800-877-9975.
For additional information about the WSGS or to order publications and maps, log on to http://www.wsgs.wyo.gov, call 307-766-2286, ext. 224, or email [email protected].
Suggested citation: Carnes, J.D., 2015, Phosphate rock in Wyoming: Wyoming State Geological Survey Report of Investigations No. 68, 34 p.
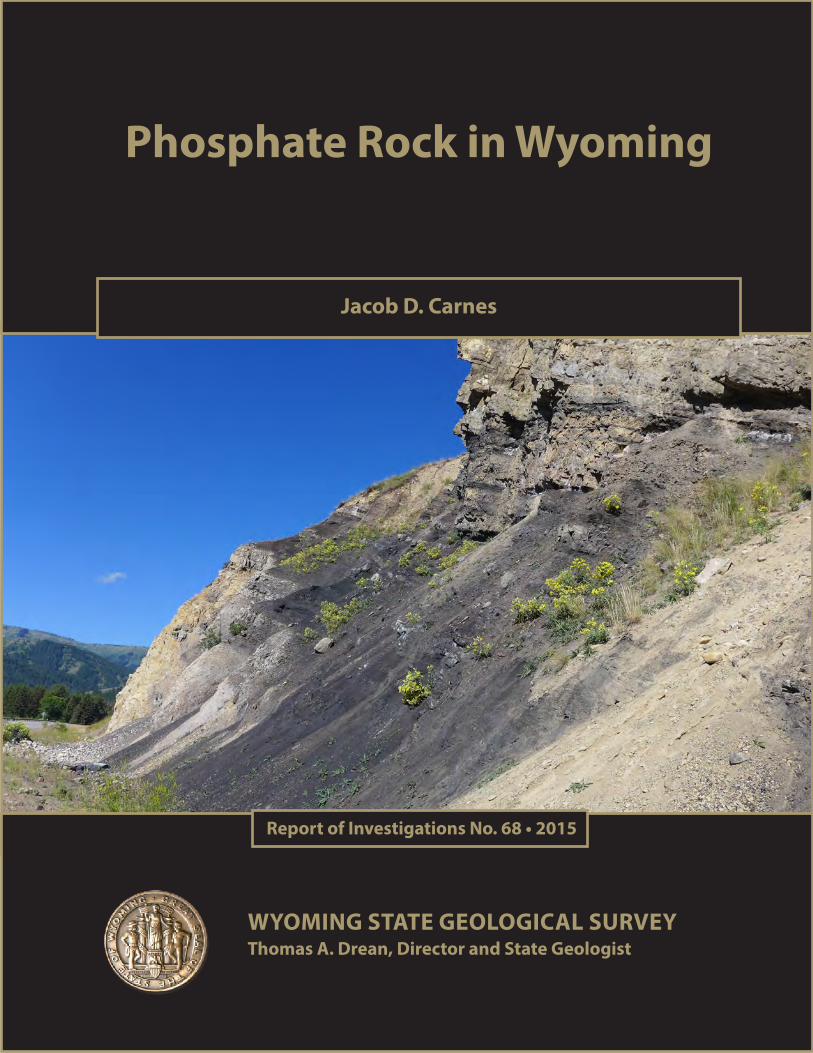
Cover photo: Outcrop of the Meade Peak Member of the Phosphoria Formation along U.S. Hwy 26, approximately 3 miles southwest of Hoback Junction, in Teton County, Wyo. Photo by Jacob Carnes, 2015.
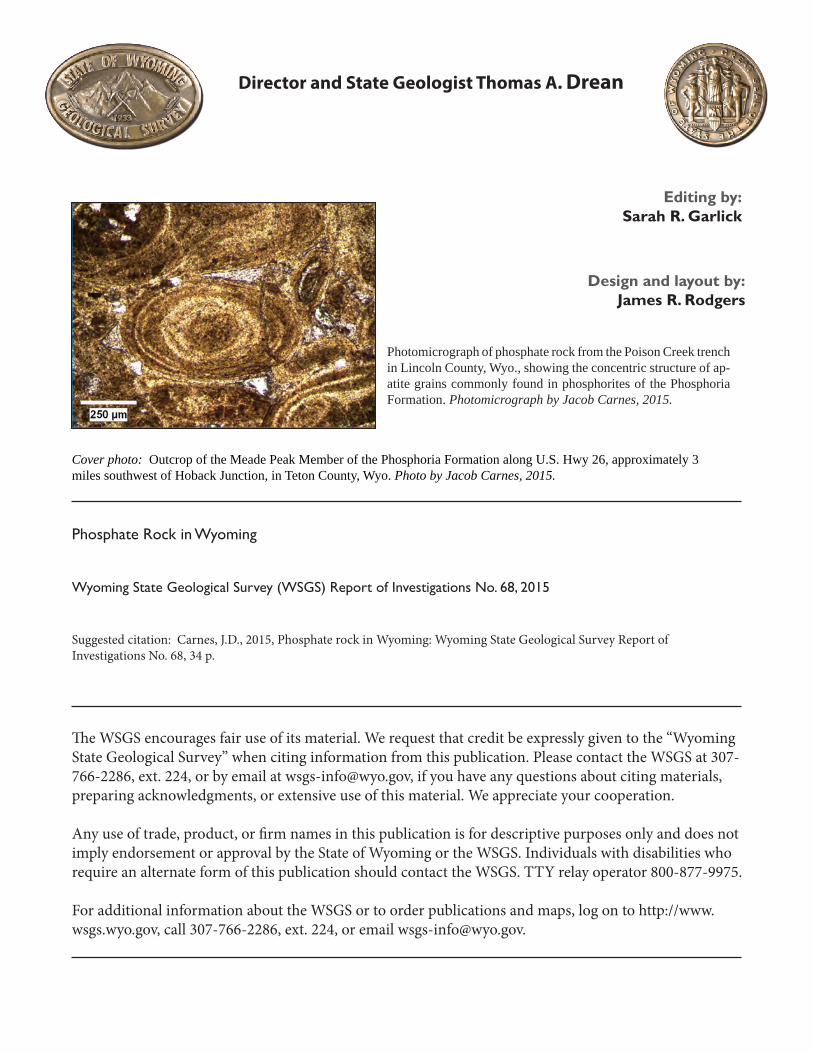
Photomicrograph of phosphate rock from the Poison Creek trench in Lincoln County, Wyo., showing the concentric structure of ap-atite grains commonly found in phosphorites of the Phosphoria Formation. Photomicrograph by Jacob Carnes, 2015.
i
Jacob D. Carnes
Wyoming State Geological SurveyReport of Investigations No. 682015
Phosphate Rock in Wyoming
Wyoming State Geological Survey, Laramie, Wyoming 82071

ii
iii
Table of ContentsAbstract . . . . . . . . . . . . . . . . . . . . . . . . . . . . . . . . . . . . . . . . . . . . . . . . . . . . . . . . . . . . . . . . . . 1
Introduction . . . . . . . . . . . . . . . . . . . . . . . . . . . . . . . . . . . . . . . . . . . . . . . . . . . . . . . . . . . . . . 1
A Note About Units . . . . . . . . . . . . . . . . . . . . . . . . . . . . . . . . . . . . . . . . . . . . . . . . . . . . . . . 4
Overview . . . . . . . . . . . . . . . . . . . . . . . . . . . . . . . . . . . . . . . . . . . . . . . . . . . . . . . . . . . . . . . . . 4
Phosphate Deposit Types . . . . . . . . . . . . . . . . . . . . . . . . . . . . . . . . . . . . . . . . . . . . . . . . . . . . . 4
Phosphate Consumption and Supply . . . . . . . . . . . . . . . . . . . . . . . . . . . . . . . . . . . . . . . . . . . . 8
Marine Phosphorites . . . . . . . . . . . . . . . . . . . . . . . . . . . . . . . . . . . . . . . . . . . . . . . . . . . . . . . .10
Phosphogenesis . . . . . . . . . . . . . . . . . . . . . . . . . . . . . . . . . . . . . . . . . . . . . . . . . . . . . . . . . .10
The Phosphoria Formation . . . . . . . . . . . . . . . . . . . . . . . . . . . . . . . . . . . . . . . . . . . . . . . . . .10
Stratigraphy of the Phosphoria Formation . . . . . . . . . . . . . . . . . . . . . . . . . . . . . . . . . . . . . .10
Past Production from the Phosphoria Formation in Wyoming . . . . . . . . . . . . . . . . . . . . . . .12Cokeville Mine. . . . . . . . . . . . . . . . . . . . . . . . . . . . . . . . . . . . . . . . . . . . . . . . . . . . . . . . . 12York Canyon Mine . . . . . . . . . . . . . . . . . . . . . . . . . . . . . . . . . . . . . . . . . . . . . . . . . . . . . 14South Mountain Mine – Commissary Ridge. . . . . . . . . . . . . . . . . . . . . . . . . . . . . . . . 14Leefe Mine . . . . . . . . . . . . . . . . . . . . . . . . . . . . . . . . . . . . . . . . . . . . . . . . . . . . . . . . . . . . 14
Other Significant Occurrences within the Phosphoria Formation . . . . . . . . . . . . . . . . . . . .15A Note About Sampling . . . . . . . . . . . . . . . . . . . . . . . . . . . . . . . . . . . . . . . . . . . . . . . . . 15Wind River Mountains and Wind River Basin . . . . . . . . . . . . . . . . . . . . . . . . . . . . . . 15Overthrust Belt: Sublette Range . . . . . . . . . . . . . . . . . . . . . . . . . . . . . . . . . . . . . . . . . . 19Overthrust Belt: Tunp Range. . . . . . . . . . . . . . . . . . . . . . . . . . . . . . . . . . . . . . . . . . . . . 20Overthrust Belt: Commissary Ridge. . . . . . . . . . . . . . . . . . . . . . . . . . . . . . . . . . . . . . . 22Overthrust Belt: Salt River, Wyoming, and Snake River Ranges . . . . . . . . . . . . . . . 25Teton Range . . . . . . . . . . . . . . . . . . . . . . . . . . . . . . . . . . . . . . . . . . . . . . . . . . . . . . . . . . . 27Gros Ventre Range and Jackson Hole. . . . . . . . . . . . . . . . . . . . . . . . . . . . . . . . . . . . . . 29
Igneous Apatite . . . . . . . . . . . . . . . . . . . . . . . . . . . . . . . . . . . . . . . . . . . . . . . . . . . . . . . . . . . .29
Paleo-Hot Springs . . . . . . . . . . . . . . . . . . . . . . . . . . . . . . . . . . . . . . . . . . . . . . . . . . . . . . . . . .29
Conclusions . . . . . . . . . . . . . . . . . . . . . . . . . . . . . . . . . . . . . . . . . . . . . . . . . . . . . . . . . . . . . . 30
Suggestions for Future Investigations . . . . . . . . . . . . . . . . . . . . . . . . . . . . . . . . . . . . . . . . . . . 30
References . . . . . . . . . . . . . . . . . . . . . . . . . . . . . . . . . . . . . . . . . . . . . . . . . . . . . . . . . . . . . . . .31
iv
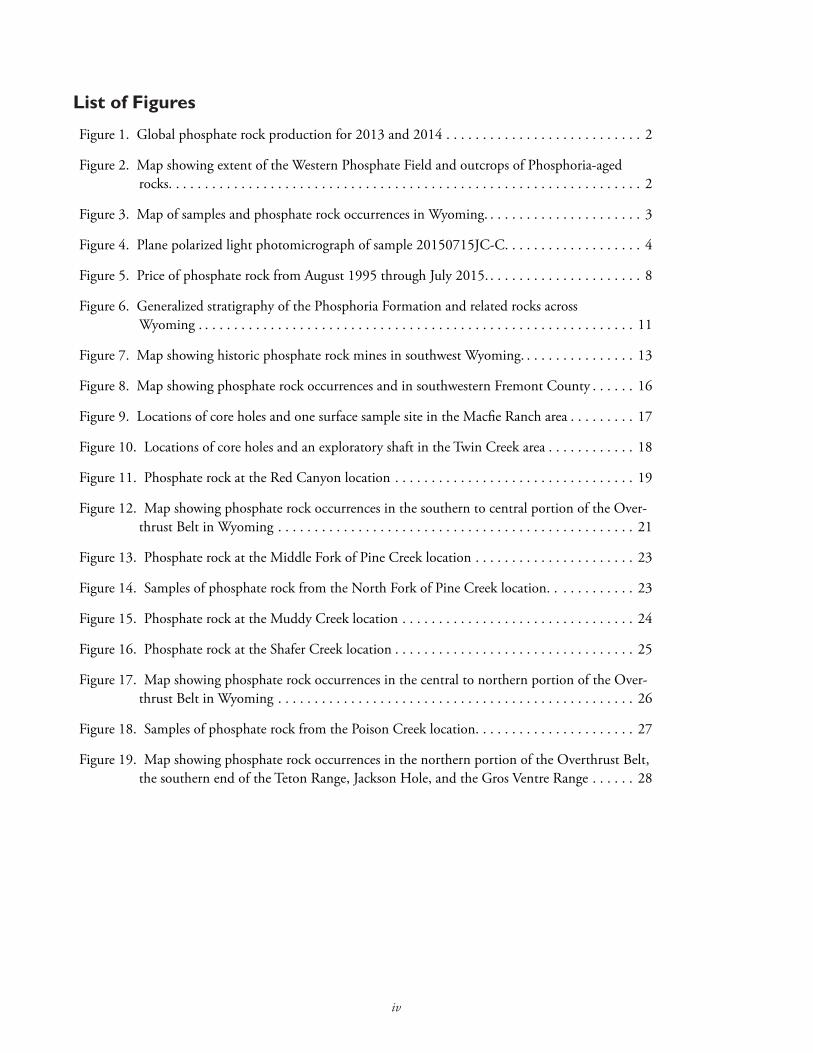
List of Figures
Figure 1 . Global phosphate rock production for 2013 and 2014 . . . . . . . . . . . . . . . . . . . . . . . . . . . 2
Figure 2 . Map showing extent of the Western Phosphate Field and outcrops of Phosphoria-aged rocks . . . . . . . . . . . . . . . . . . . . . . . . . . . . . . . . . . . . . . . . . . . . . . . . . . . . . . . . . . . . . . . . . 2
Figure 3 . Map of samples and phosphate rock occurrences in Wyoming . . . . . . . . . . . . . . . . . . . . . . 3
Figure 4 . Plane polarized light photomicrograph of sample 20150715JC-C . . . . . . . . . . . . . . . . . . . 4
Figure 5 . Price of phosphate rock from August 1995 through July 2015 . . . . . . . . . . . . . . . . . . . . . . 8
Figure 6 . Generalized stratigraphy of the Phosphoria Formation and related rocks across Wyoming . . . . . . . . . . . . . . . . . . . . . . . . . . . . . . . . . . . . . . . . . . . . . . . . . . . . . . . . . . . . 11
Figure 7 . Map showing historic phosphate rock mines in southwest Wyoming . . . . . . . . . . . . . . . . 13
Figure 8 . Map showing phosphate rock occurrences and in southwestern Fremont County . . . . . . 16
Figure 9 . Locations of core holes and one surface sample site in the Macfie Ranch area . . . . . . . . . 17
Figure 10 . Locations of core holes and an exploratory shaft in the Twin Creek area . . . . . . . . . . . . 18
Figure 11 . Phosphate rock at the Red Canyon location . . . . . . . . . . . . . . . . . . . . . . . . . . . . . . . . . 19
Figure 12 . Map showing phosphate rock occurrences in the southern to central portion of the Over-thrust Belt in Wyoming . . . . . . . . . . . . . . . . . . . . . . . . . . . . . . . . . . . . . . . . . . . . . . . . . 21
Figure 13 . Phosphate rock at the Middle Fork of Pine Creek location . . . . . . . . . . . . . . . . . . . . . . 23
Figure 14 . Samples of phosphate rock from the North Fork of Pine Creek location . . . . . . . . . . . . 23
Figure 15 . Phosphate rock at the Muddy Creek location . . . . . . . . . . . . . . . . . . . . . . . . . . . . . . . . 24
Figure 16 . Phosphate rock at the Shafer Creek location . . . . . . . . . . . . . . . . . . . . . . . . . . . . . . . . . 25
Figure 17 . Map showing phosphate rock occurrences in the central to northern portion of the Over-thrust Belt in Wyoming . . . . . . . . . . . . . . . . . . . . . . . . . . . . . . . . . . . . . . . . . . . . . . . . . 26
Figure 18 . Samples of phosphate rock from the Poison Creek location . . . . . . . . . . . . . . . . . . . . . . 27
Figure 19 . Map showing phosphate rock occurrences in the northern portion of the Overthrust Belt, the southern end of the Teton Range, Jackson Hole, and the Gros Ventre Range . . . . . . 28

v
List of TablesTable 1 . List of samples collected for this report . . . . . . . . . . . . . . . . . . . . . . . . . . . . . . . . . . . . . . . . . 5
Table 2 . Major element geochemistry of samples collected for this investigation . . . . . . . . . . . . . . . . 6
Table 3 . Trace element geochemistry of samples collected for this investigation . . . . . . . . . . . . . . . . . 7
Table 4 . Global phosphate rock reserves . . . . . . . . . . . . . . . . . . . . . . . . . . . . . . . . . . . . . . . . . . . . . . . 9
Table 5 . Phosphate content and stratigraphic data of phosphate rock beds in the Lander area . . . . . 19
Table 6 . Phosphate content and stratigraphic data of phosphate rock beds in the Sublette Range . . . 20
Table 7 . Phosphate content and stratigraphic data of phosphate rock beds in the Tunp Range . . . . . 22
Table 8 . Phosphate content and stratigraphic data of phosphate rock beds on Commissary Ridge . . 24
Table 9 . Phosphate content and stratigraphic data of phosphate rock beds in northern half of the Wyoming Overthrust Belt . . . . . . . . . . . . . . . . . . . . . . . . . . . . . . . . . . . . . . . . . . . . . . . 25
Table 10 . Phosphate content and stratigraphic data of phosphate rock beds in the Teton Range . . . 29
Table 11 . Phosphate content and stratigraphic data of phosphate rock beds in the Jackson Hole area and the Gros Ventre Range . . . . . . . . . . . . . . . . . . . . . . . . . . . . . . . . . . . . . . . . . . . . . . . 30
1
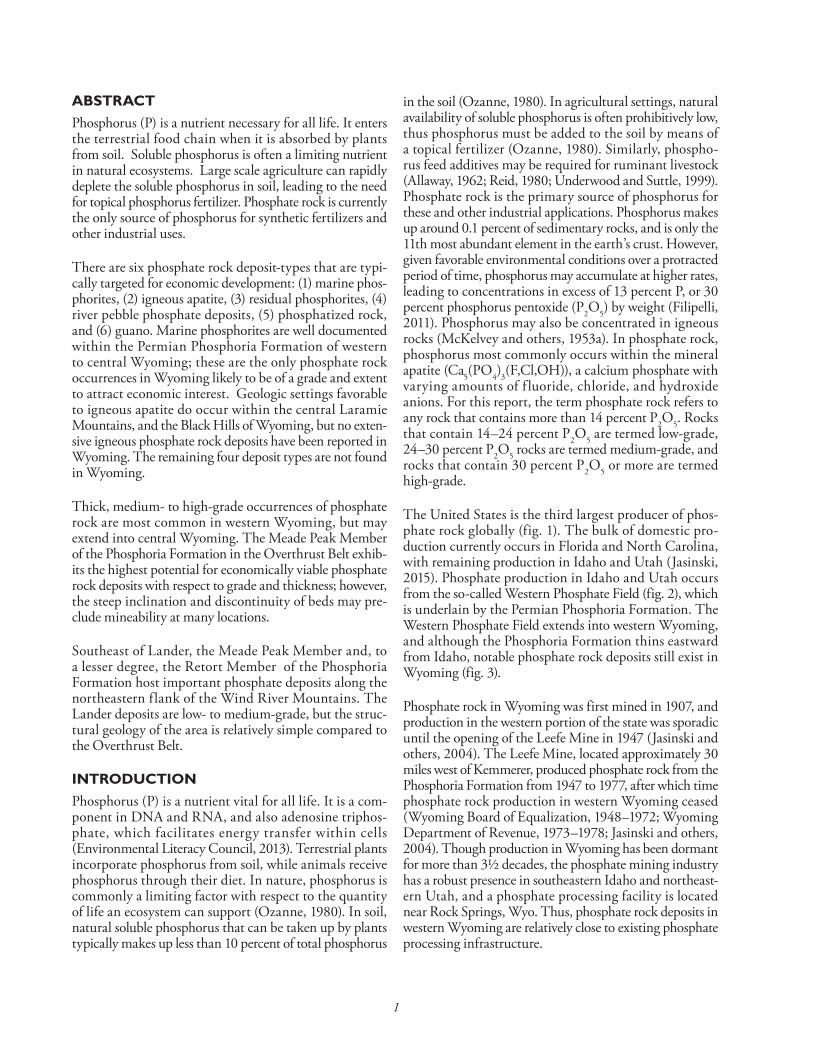
ABSTRACTPhosphorus (P) is a nutrient necessary for all life . It enters the terrestrial food chain when it is absorbed by plants from soil . Soluble phosphorus is often a limiting nutrient in natural ecosystems . Large scale agriculture can rapidly deplete the soluble phosphorus in soil, leading to the need for topical phosphorus fertilizer . Phosphate rock is currently the only source of phosphorus for synthetic fertilizers and other industrial uses .
There are six phosphate rock deposit-types that are typi-cally targeted for economic development: (1) marine phos-phorites, (2) igneous apatite, (3) residual phosphorites, (4) river pebble phosphate deposits, (5) phosphatized rock, and (6) guano . Marine phosphorites are well documented within the Permian Phosphoria Formation of western to central Wyoming; these are the only phosphate rock occurrences in Wyoming likely to be of a grade and extent to attract economic interest . Geologic settings favorable to igneous apatite do occur within the central Laramie Mountains, and the Black Hills of Wyoming, but no exten-sive igneous phosphate rock deposits have been reported in Wyoming . The remaining four deposit types are not found in Wyoming .
Thick, medium- to high-grade occurrences of phosphate rock are most common in western Wyoming, but may extend into central Wyoming . The Meade Peak Member of the Phosphoria Formation in the Overthrust Belt exhib-its the highest potential for economically viable phosphate rock deposits with respect to grade and thickness; however, the steep inclination and discontinuity of beds may pre-clude mineability at many locations .
Southeast of Lander, the Meade Peak Member and, to a lesser degree, the Retort Member of the Phosphoria Formation host important phosphate deposits along the northeastern flank of the Wind River Mountains . The Lander deposits are low- to medium-grade, but the struc-tural geology of the area is relatively simple compared to the Overthrust Belt .
INTRODUCTIONPhosphorus (P) is a nutrient vital for all life . It is a com-ponent in DNA and RNA, and also adenosine triphos-phate, which facilitates energy transfer within cells (Environmental Literacy Council, 2013) . Terrestrial plants incorporate phosphorus from soil, while animals receive phosphorus through their diet . In nature, phosphorus is commonly a limiting factor with respect to the quantity of life an ecosystem can support (Ozanne, 1980) . In soil, natural soluble phosphorus that can be taken up by plants typically makes up less than 10 percent of total phosphorus
in the soil (Ozanne, 1980) . In agricultural settings, natural availability of soluble phosphorus is often prohibitively low, thus phosphorus must be added to the soil by means of a topical fertilizer (Ozanne, 1980) . Similarly, phospho-rus feed additives may be required for ruminant livestock (Allaway, 1962; Reid, 1980; Underwood and Suttle, 1999) . Phosphate rock is the primary source of phosphorus for these and other industrial applications . Phosphorus makes up around 0 .1 percent of sedimentary rocks, and is only the 11th most abundant element in the earth’s crust . However, given favorable environmental conditions over a protracted period of time, phosphorus may accumulate at higher rates, leading to concentrations in excess of 13 percent P, or 30 percent phosphorus pentoxide (P2O5) by weight (Filipelli, 2011) . Phosphorus may also be concentrated in igneous rocks (McKelvey and others, 1953a) . In phosphate rock, phosphorus most commonly occurs within the mineral apatite (Ca5(PO4)3(F,Cl,OH)), a calcium phosphate with varying amounts of f luoride, chloride, and hydroxide anions . For this report, the term phosphate rock refers to any rock that contains more than 14 percent P2O5 . Rocks that contain 14–24 percent P2O5 are termed low-grade, 24–30 percent P2O5 rocks are termed medium-grade, and rocks that contain 30 percent P2O5 or more are termed high-grade .
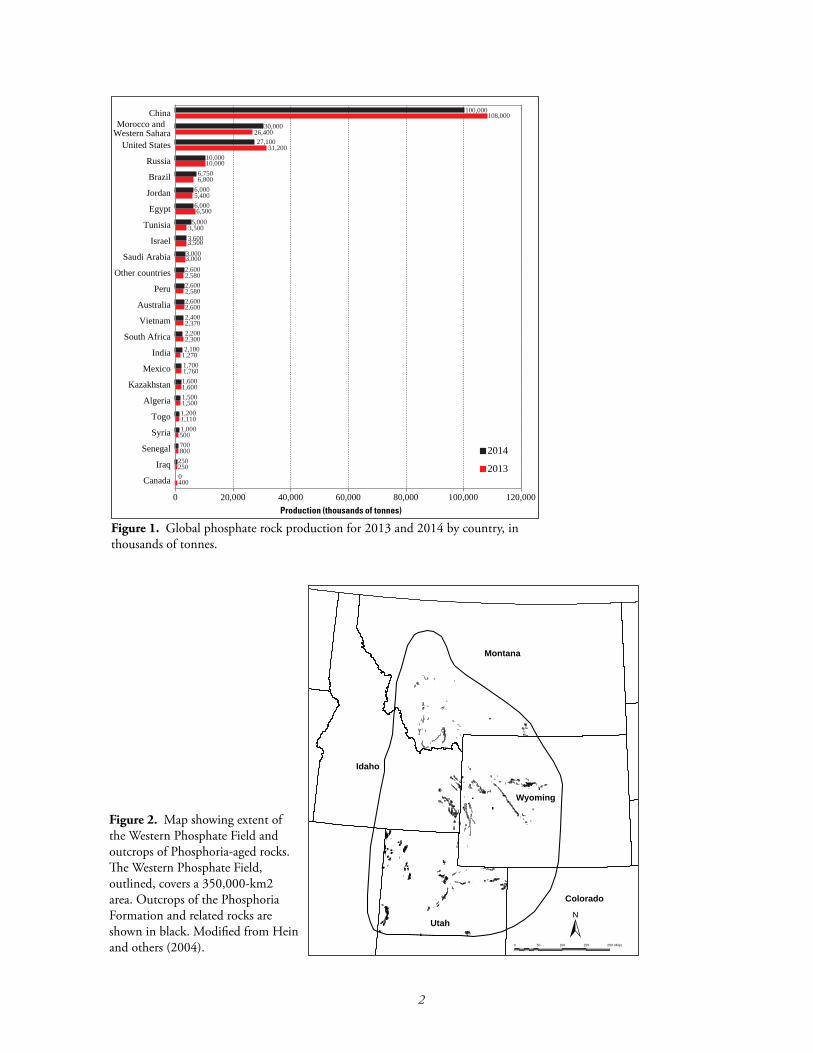
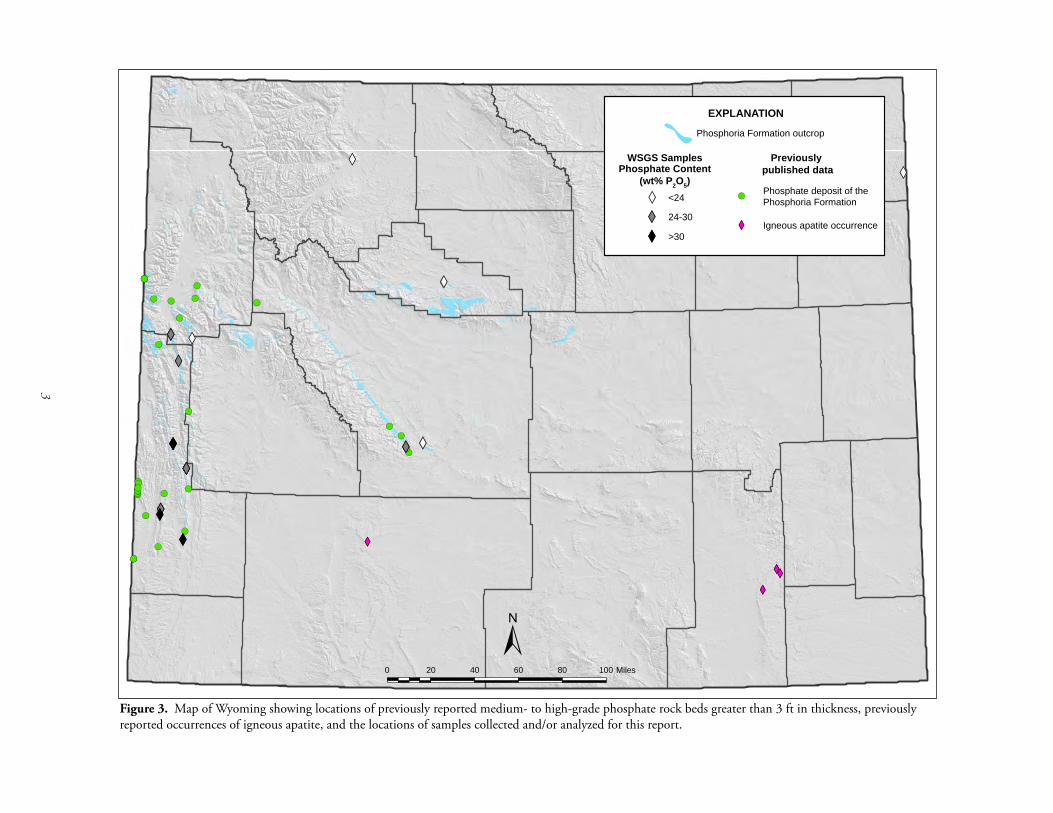
The United States is the third largest producer of phos-phate rock globally (fig . 1) . The bulk of domestic pro-duction currently occurs in Florida and North Carolina, with remaining production in Idaho and Utah (Jasinski, 2015) . Phosphate production in Idaho and Utah occurs from the so-called Western Phosphate Field (fig . 2), which is underlain by the Permian Phosphoria Formation . The Western Phosphate Field extends into western Wyoming, and although the Phosphoria Formation thins eastward from Idaho, notable phosphate rock deposits still exist in Wyoming (fig . 3) .
Phosphate rock in Wyoming was first mined in 1907, and production in the western portion of the state was sporadic until the opening of the Leefe Mine in 1947 (Jasinski and others, 2004) . The Leefe Mine, located approximately 30 miles west of Kemmerer, produced phosphate rock from the Phosphoria Formation from 1947 to 1977, after which time phosphate rock production in western Wyoming ceased (Wyoming Board of Equalization, 1948–1972; Wyoming Department of Revenue, 1973–1978; Jasinski and others, 2004) . Though production in Wyoming has been dormant for more than 3½ decades, the phosphate mining industry has a robust presence in southeastern Idaho and northeast-ern Utah, and a phosphate processing facility is located near Rock Springs, Wyo . Thus, phosphate rock deposits in western Wyoming are relatively close to existing phosphate processing infrastructure .
2
0 20,000 40,000 60,000 80,000 100,000 120,000
Canada
Iraq
Senegal
Syria
Togo
Algeria
Kazakhstan
Mexico
India
South Africa
Vietnam
Australia
Peru
Other countries
Saudi Arabia
Israel
Tunisia
Egypt
Jordan
Brazil
Russia
United States
Morocco and Western Sahara
China
Production (thousands of tonnes)
2014
2013
108,000100,000
30,00026,40027,100
31,200
10,00010,000
6,0005,400
6,7506,000
6,0006,500
3,5005,000
3,6003,500
3,0003,000
2,6002,580
2,6002,580
2,6002,600
2,4002,370
2,2002,300
2,1001,270
1,7001,760
1,6001,600
1,5001,500
1,2001,110
1,000500
700800
2502500400
0 50 100 150 200 Miles
±
Montana
Wyoming
Colorado
Utah
Idaho
Figure 1. Global phosphate rock production for 2013 and 2014 by country, in thousands of tonnes .
Figure 2. Map showing extent of the Western Phosphate Field and outcrops of Phosphoria-aged rocks . The Western Phosphate Field, outlined, covers a 350,000-km2 area . Outcrops of the Phosphoria Formation and related rocks are shown in black . Modified from Hein and others (2004) .
3
XW
XW
XWXW
!(!(
!(
!(
!(!(!(!(
!(
!(!(
!(
!(!(
!(
!(
!(
!(
!(
!(!(
!(
!(
!(
!(
!(!(
!(!(!(
!(
XWXWXWXW
XWXW
XW
XWXWXWXW
XW
XWXWXW
XW
XWXWXW
XW
XW
XWXW
EXPLANATION
Phosphoria Formation outcrop
Previously published data
XW Igneous apatite occurrence
<24
24-30
>30
WSGS SamplesPhosphate Content
(wt% P2O5)
0 20 40 60 80 100 Miles
±
Phosphate deposit of the Phosphoria Formation!(XW
XW
XW
Figure 3. Map of Wyoming showing locations of previously reported medium- to high-grade phosphate rock beds greater than 3 ft in thickness, previously reported occurrences of igneous apatite, and the locations of samples collected and/or analyzed for this report .
4
A Note About UnitsUnits of measure for previously published data cited below are given in the same form as the original report without conversion from non-metric to metric, or vice versa . For simplicity and uniformity, measures of thickness and dis-tance obtained during fieldwork for this report are given in the non-metric units of feet (ft) or miles (mi) . Units of weight related to mined phosphate rock and estimates of reserves and resources are reported in literature as either non-metric tons or metric tonnes . One ton is equal to 2000 pounds (lb), or approximately 0 .907 tonnes . A tonne is equal to 1000 kilograms (kg), or approximately 1 .102 tons . In general, historical production figures are reported in tons, while modern estimates of reserves and resources are reported in tonnes .
OVERVIEWThis report aims to highlight the phosphate resources of Wyoming based on both a summary of previously collected data and the presentation of new data . The information included in this report will provide members of industry with a starting point for initiating new phosphate explora-tion and resource evaluation in Wyoming . Decision makers at state and community levels may also find this informa-tion useful in identifying potential areas of economic devel-opment .
To determine mining feasibility of a phosphate deposit, additional factors besides grade and bed thickness must be considered, including the extent of the deposit, steepness of dip, thickness of overburden, and accessibility . Complete identification of deposits that fully fit feasibility criteria is beyond the scope and intentions of this report; rather the aim of this report is to provide new and available informa-tion as a starting point for interested parties .
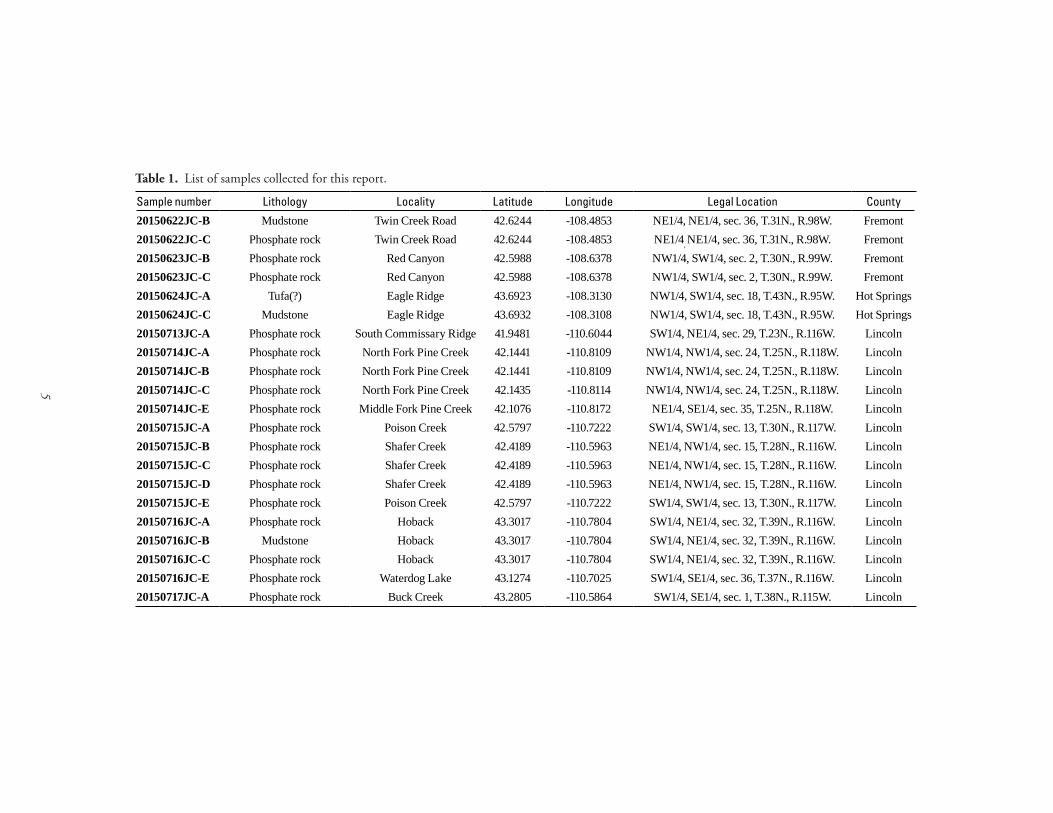
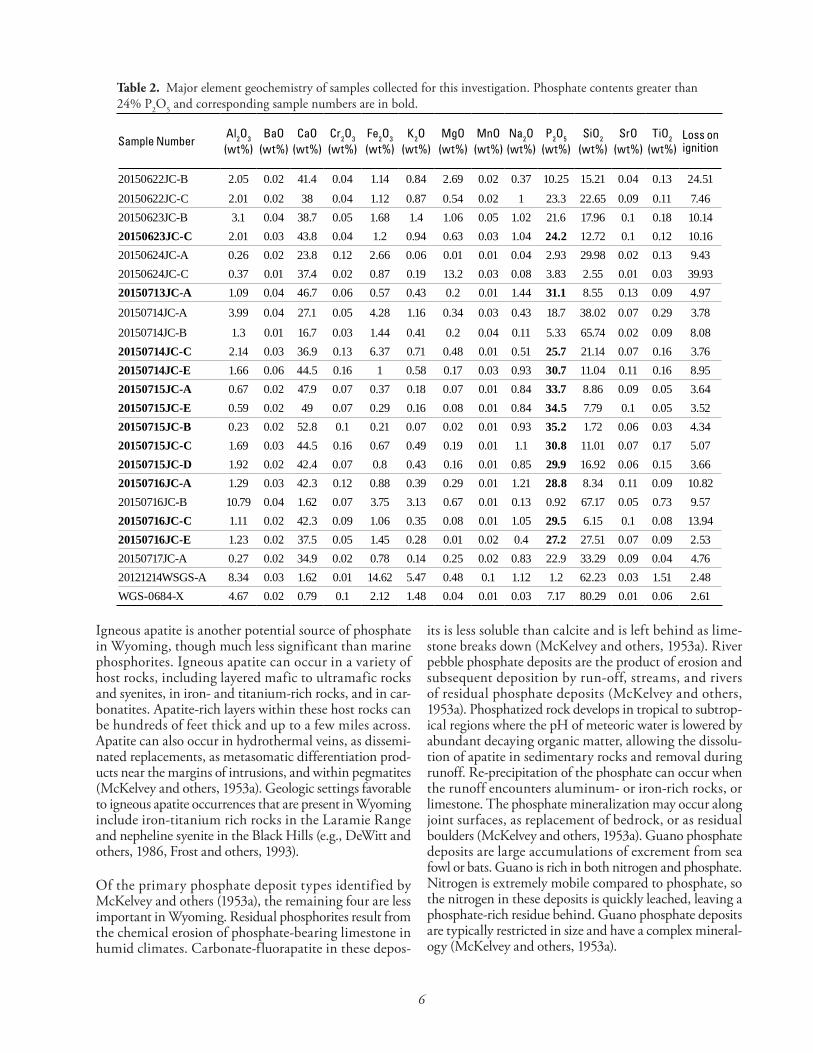
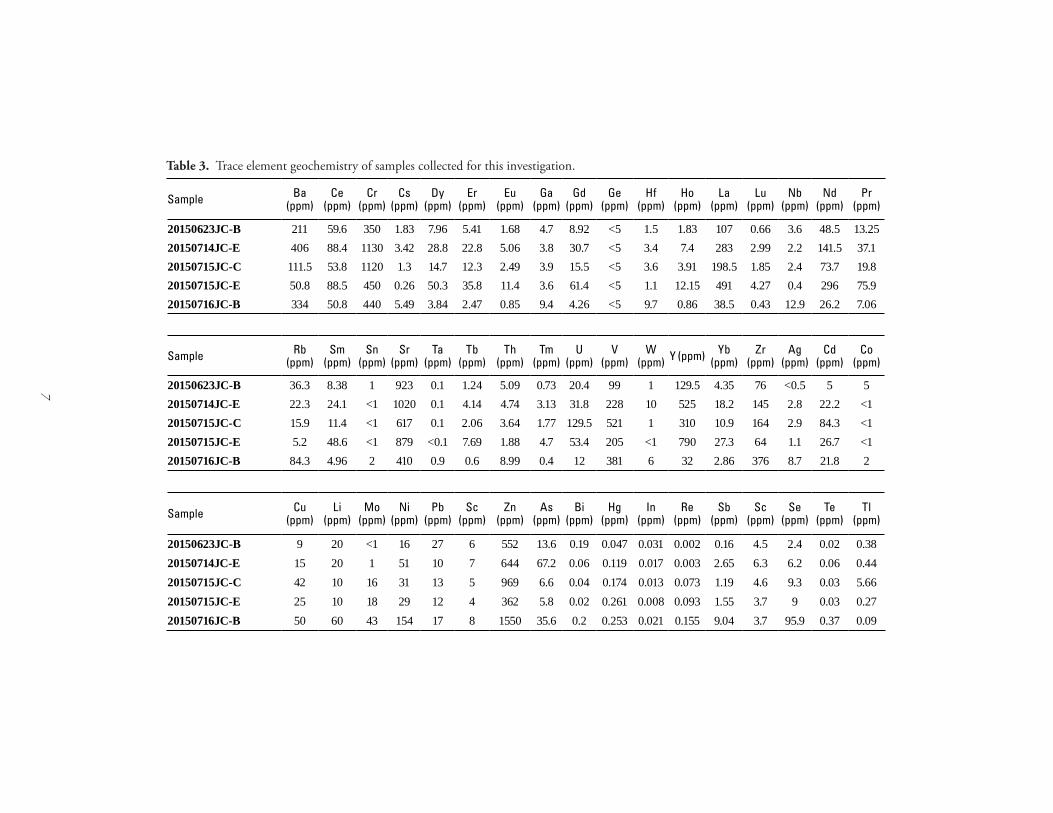
This report presents new data on 21 samples from several known, suspected, and potential phosphate deposits in Wyoming collected during field work for this report (table 1) . Sampling of all known or potential phosphate deposits in the state was not possible given the time frame of this project . Sample sites for this report fit one of two objectives: (1) to fill in gaps between historical sampling locations, and (2) to confirm previously published values . Samples were analyzed by powder X-ray diffraction (XRD) to identify phosphate minerals, major element whole rock geochem-istry to determine phosphate content, and trace element geochemistry for indications of other potential economic elements or metals (table 2, table 3) .
PHOSPHATE DEPOSIT TYPESAccording to McKelvey and others (1953a), there are six primary phosphate deposit types: (1) marine phosphorites,
(2) igneous apatite, (3) residual phosphorites, (4) river pebble phosphate deposits, (5) phosphatized rock, and (6) guano . Minor phosphate sources include ancient bone piles, glauconitic sedimentary deposits, and slag produced from phosphatic iron ore (Hertzog, 1935), as well as phosphatic lacustrine deposits (Love, 1964) . Phosphate minerals can also be found associated with paleo-hot spring deposits, but such occurrences are generally low grade and limited in extent .
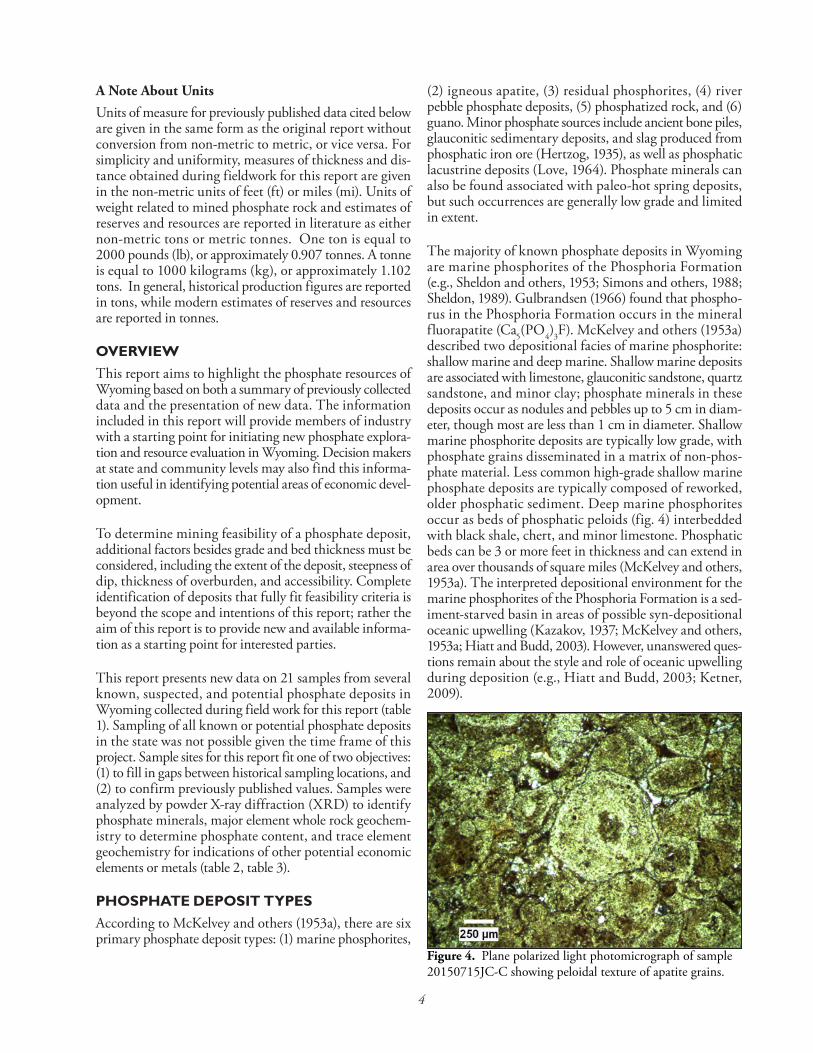
The majority of known phosphate deposits in Wyoming are marine phosphorites of the Phosphoria Formation (e .g ., Sheldon and others, 1953; Simons and others, 1988; Sheldon, 1989) . Gulbrandsen (1966) found that phospho-rus in the Phosphoria Formation occurs in the mineral fluorapatite (Ca5(PO4)3F) . McKelvey and others (1953a) described two depositional facies of marine phosphorite: shallow marine and deep marine . Shallow marine deposits are associated with limestone, glauconitic sandstone, quartz sandstone, and minor clay; phosphate minerals in these deposits occur as nodules and pebbles up to 5 cm in diam-eter, though most are less than 1 cm in diameter . Shallow marine phosphorite deposits are typically low grade, with phosphate grains disseminated in a matrix of non-phos-phate material . Less common high-grade shallow marine phosphate deposits are typically composed of reworked, older phosphatic sediment . Deep marine phosphorites occur as beds of phosphatic peloids (fig . 4) interbedded with black shale, chert, and minor limestone . Phosphatic beds can be 3 or more feet in thickness and can extend in area over thousands of square miles (McKelvey and others, 1953a) . The interpreted depositional environment for the marine phosphorites of the Phosphoria Formation is a sed-iment-starved basin in areas of possible syn-depositional oceanic upwelling (Kazakov, 1937; McKelvey and others, 1953a; Hiatt and Budd, 2003) . However, unanswered ques-tions remain about the style and role of oceanic upwelling during deposition (e .g ., Hiatt and Budd, 2003; Ketner, 2009) .
Figure 4. Plane polarized light photomicrograph of sample 20150715JC-C showing peloidal texture of apatite grains .
5
Sample number Lithology Locality Latitude Longitude Legal Location County
20150622JC-B Mudstone Twin Creek Road 42.6244 -108.4853 NE1/4, NE1/4, sec. 36, T.31N., R.98W. Fremont
20150622JC-C Phosphate rock Twin Creek Road 42.6244 -108.4853 NE1/4, NE1/4, sec. 36, T.31N., R.98W. Fremont
20150623JC-B Phosphate rock Red Canyon 42.5988 -108.6378 NW1/4, SW1/4, sec. 2, T.30N., R.99W. Fremont
20150623JC-C Phosphate rock Red Canyon 42.5988 -108.6378 NW1/4, SW1/4, sec. 2, T.30N., R.99W. Fremont
20150624JC-A Tufa(?) Eagle Ridge 43.6923 -108.3130 NW1/4, SW1/4, sec. 18, T.43N., R.95W. Hot Springs
20150624JC-C Mudstone Eagle Ridge 43.6932 -108.3108 NW1/4, SW1/4, sec. 18, T.43N., R.95W. Hot Springs
20150713JC-A Phosphate rock South Commissary Ridge 41.9481 -110.6044 SW1/4, NE1/4, sec. 29, T.23N., R.116W. Lincoln
20150714JC-A Phosphate rock North Fork Pine Creek 42.1441 -110.8109 NW1/4, NW1/4, sec. 24, T.25N., R.118W. Lincoln
20150714JC-B Phosphate rock North Fork Pine Creek 42.1441 -110.8109 NW1/4, NW1/4, sec. 24, T.25N., R.118W. Lincoln
20150714JC-C Phosphate rock North Fork Pine Creek 42.1435 -110.8114 NW1/4, NW1/4, sec. 24, T.25N., R.118W. Lincoln
20150714JC-E Phosphate rock Middle Fork Pine Creek 42.1076 -110.8172 NE1/4, SE1/4, sec. 35, T.25N., R.118W. Lincoln
20150715JC-A Phosphate rock Poison Creek 42.5797 -110.7222 SW1/4, SW1/4, sec. 13, T.30N., R.117W. Lincoln
20150715JC-B Phosphate rock Shafer Creek 42.4189 -110.5963 NE1/4, NW1/4, sec. 15, T.28N., R.116W. Lincoln
20150715JC-C Phosphate rock Shafer Creek 42.4189 -110.5963 NE1/4, NW1/4, sec. 15, T.28N., R.116W. Lincoln
20150715JC-D Phosphate rock Shafer Creek 42.4189 -110.5963 NE1/4, NW1/4, sec. 15, T.28N., R.116W. Lincoln
20150715JC-E Phosphate rock Poison Creek 42.5797 -110.7222 SW1/4, SW1/4, sec. 13, T.30N., R.117W. Lincoln
20150716JC-A Phosphate rock Hoback 43.3017 -110.7804 SW1/4, NE1/4, sec. 32, T.39N., R.116W. Lincoln
20150716JC-B Mudstone Hoback 43.3017 -110.7804 SW1/4, NE1/4, sec. 32, T.39N., R.116W. Lincoln
20150716JC-C Phosphate rock Hoback 43.3017 -110.7804 SW1/4, NE1/4, sec. 32, T.39N., R.116W. Lincoln
20150716JC-E Phosphate rock Waterdog Lake 43.1274 -110.7025 SW1/4, SE1/4, sec. 36, T.37N., R.116W. Lincoln
20150717JC-A Phosphate rock Buck Creek 43.2805 -110.5864 SW1/4, SE1/4, sec. 1, T.38N., R.115W. Lincoln
Table 1. List of samples collected for this report .
6
Sample NumberAl2O3
(wt%)BaO
(wt%)CaO
(wt%)Cr2O3
(wt%)Fe2O3
(wt%)K2O
(wt%)MgO
(wt%)MnO
(wt%)Na2O (wt%)
P2O5
(wt%)SiO2
(wt%)SrO
(wt%)TiO2
(wt%)Loss on ignition
20150622JC-B 2.05 0.02 41.4 0.04 1.14 0.84 2.69 0.02 0.37 10.25 15.21 0.04 0.13 24.51
20150622JC-C 2.01 0.02 38 0.04 1.12 0.87 0.54 0.02 1 23.3 22.65 0.09 0.11 7.46
20150623JC-B 3.1 0.04 38.7 0.05 1.68 1.4 1.06 0.05 1.02 21.6 17.96 0.1 0.18 10.14
20150623JC-C 2.01 0.03 43.8 0.04 1.2 0.94 0.63 0.03 1.04 24.2 12.72 0.1 0.12 10.16
20150624JC-A 0.26 0.02 23.8 0.12 2.66 0.06 0.01 0.01 0.04 2.93 29.98 0.02 0.13 9.43
20150624JC-C 0.37 0.01 37.4 0.02 0.87 0.19 13.2 0.03 0.08 3.83 2.55 0.01 0.03 39.93
20150713JC-A 1.09 0.04 46.7 0.06 0.57 0.43 0.2 0.01 1.44 31.1 8.55 0.13 0.09 4.97
20150714JC-A 3.99 0.04 27.1 0.05 4.28 1.16 0.34 0.03 0.43 18.7 38.02 0.07 0.29 3.78
20150714JC-B 1.3 0.01 16.7 0.03 1.44 0.41 0.2 0.04 0.11 5.33 65.74 0.02 0.09 8.08
20150714JC-C 2.14 0.03 36.9 0.13 6.37 0.71 0.48 0.01 0.51 25.7 21.14 0.07 0.16 3.76
20150714JC-E 1.66 0.06 44.5 0.16 1 0.58 0.17 0.03 0.93 30.7 11.04 0.11 0.16 8.95
20150715JC-A 0.67 0.02 47.9 0.07 0.37 0.18 0.07 0.01 0.84 33.7 8.86 0.09 0.05 3.64
20150715JC-E 0.59 0.02 49 0.07 0.29 0.16 0.08 0.01 0.84 34.5 7.79 0.1 0.05 3.52
20150715JC-B 0.23 0.02 52.8 0.1 0.21 0.07 0.02 0.01 0.93 35.2 1.72 0.06 0.03 4.34
20150715JC-C 1.69 0.03 44.5 0.16 0.67 0.49 0.19 0.01 1.1 30.8 11.01 0.07 0.17 5.07
20150715JC-D 1.92 0.02 42.4 0.07 0.8 0.43 0.16 0.01 0.85 29.9 16.92 0.06 0.15 3.66
20150716JC-A 1.29 0.03 42.3 0.12 0.88 0.39 0.29 0.01 1.21 28.8 8.34 0.11 0.09 10.82
20150716JC-B 10.79 0.04 1.62 0.07 3.75 3.13 0.67 0.01 0.13 0.92 67.17 0.05 0.73 9.57
20150716JC-C 1.11 0.02 42.3 0.09 1.06 0.35 0.08 0.01 1.05 29.5 6.15 0.1 0.08 13.94
20150716JC-E 1.23 0.02 37.5 0.05 1.45 0.28 0.01 0.02 0.4 27.2 27.51 0.07 0.09 2.53
20150717JC-A 0.27 0.02 34.9 0.02 0.78 0.14 0.25 0.02 0.83 22.9 33.29 0.09 0.04 4.76
20121214WSGS-A 8.34 0.03 1.62 0.01 14.62 5.47 0.48 0.1 1.12 1.2 62.23 0.03 1.51 2.48
WGS-0684-X 4.67 0.02 0.79 0.1 2.12 1.48 0.04 0.01 0.03 7.17 80.29 0.01 0.06 2.61
Table 2. Major element geochemistry of samples collected for this investigation . Phosphate contents greater than 24% P2O5 and corresponding sample numbers are in bold .
Igneous apatite is another potential source of phosphate in Wyoming, though much less significant than marine phosphorites . Igneous apatite can occur in a variety of host rocks, including layered mafic to ultramafic rocks and syenites, in iron- and titanium-rich rocks, and in car-bonatites . Apatite-rich layers within these host rocks can be hundreds of feet thick and up to a few miles across . Apatite can also occur in hydrothermal veins, as dissemi-nated replacements, as metasomatic differentiation prod-ucts near the margins of intrusions, and within pegmatites (McKelvey and others, 1953a) . Geologic settings favorable to igneous apatite occurrences that are present in Wyoming include iron-titanium rich rocks in the Laramie Range and nepheline syenite in the Black Hills (e .g ., DeWitt and others, 1986, Frost and others, 1993) .
Of the primary phosphate deposit types identified by McKelvey and others (1953a), the remaining four are less important in Wyoming . Residual phosphorites result from the chemical erosion of phosphate-bearing limestone in humid climates . Carbonate-fluorapatite in these depos-
its is less soluble than calcite and is left behind as lime-stone breaks down (McKelvey and others, 1953a) . River pebble phosphate deposits are the product of erosion and subsequent deposition by run-off, streams, and rivers of residual phosphate deposits (McKelvey and others, 1953a) . Phosphatized rock develops in tropical to subtrop-ical regions where the pH of meteoric water is lowered by abundant decaying organic matter, allowing the dissolu-tion of apatite in sedimentary rocks and removal during runoff . Re-precipitation of the phosphate can occur when the runoff encounters aluminum- or iron-rich rocks, or limestone . The phosphate mineralization may occur along joint surfaces, as replacement of bedrock, or as residual boulders (McKelvey and others, 1953a) . Guano phosphate deposits are large accumulations of excrement from sea fowl or bats . Guano is rich in both nitrogen and phosphate . Nitrogen is extremely mobile compared to phosphate, so the nitrogen in these deposits is quickly leached, leaving a phosphate-rich residue behind . Guano phosphate deposits are typically restricted in size and have a complex mineral-ogy (McKelvey and others, 1953a) .
7
Sample Ba (ppm)
Ce (ppm)
Cr (ppm)
Cs (ppm)
Dy (ppm)
Er (ppm)
Eu (ppm)
Ga (ppm)
Gd (ppm)
Ge (ppm)
Hf (ppm)
Ho (ppm)
La (ppm)
Lu (ppm)
Nb (ppm)
Nd (ppm)
Pr (ppm)
20150623JC-B 211 59.6 350 1.83 7.96 5.41 1.68 4.7 8.92 <5 1.5 1.83 107 0.66 3.6 48.5 13.25
20150714JC-E 406 88.4 1130 3.42 28.8 22.8 5.06 3.8 30.7 <5 3.4 7.4 283 2.99 2.2 141.5 37.1
20150715JC-C 111.5 53.8 1120 1.3 14.7 12.3 2.49 3.9 15.5 <5 3.6 3.91 198.5 1.85 2.4 73.7 19.8
20150715JC-E 50.8 88.5 450 0.26 50.3 35.8 11.4 3.6 61.4 <5 1.1 12.15 491 4.27 0.4 296 75.9
20150716JC-B 334 50.8 440 5.49 3.84 2.47 0.85 9.4 4.26 <5 9.7 0.86 38.5 0.43 12.9 26.2 7.06
Sample Rb (ppm)
Sm (ppm)
Sn (ppm)
Sr (ppm)
Ta (ppm)
Tb (ppm)
Th (ppm)
Tm (ppm)
U (ppm)
V (ppm)
W (ppm) Y (ppm) Yb
(ppm)Zr
(ppm)Ag
(ppm)Cd
(ppm)Co
(ppm)
20150623JC-B 36.3 8.38 1 923 0.1 1.24 5.09 0.73 20.4 99 1 129.5 4.35 76 <0.5 5 5
20150714JC-E 22.3 24.1 <1 1020 0.1 4.14 4.74 3.13 31.8 228 10 525 18.2 145 2.8 22.2 <1
20150715JC-C 15.9 11.4 <1 617 0.1 2.06 3.64 1.77 129.5 521 1 310 10.9 164 2.9 84.3 <1
20150715JC-E 5.2 48.6 <1 879 <0.1 7.69 1.88 4.7 53.4 205 <1 790 27.3 64 1.1 26.7 <1
20150716JC-B 84.3 4.96 2 410 0.9 0.6 8.99 0.4 12 381 6 32 2.86 376 8.7 21.8 2
Sample Cu (ppm)
Li (ppm)
Mo (ppm)
Ni (ppm)
Pb (ppm)
Sc (ppm)
Zn (ppm)
As (ppm)
Bi (ppm)
Hg (ppm)
In (ppm)
Re (ppm)
Sb (ppm)
Sc (ppm)
Se (ppm)
Te (ppm)
Tl (ppm)
20150623JC-B 9 20 <1 16 27 6 552 13.6 0.19 0.047 0.031 0.002 0.16 4.5 2.4 0.02 0.38
20150714JC-E 15 20 1 51 10 7 644 67.2 0.06 0.119 0.017 0.003 2.65 6.3 6.2 0.06 0.44
20150715JC-C 42 10 16 31 13 5 969 6.6 0.04 0.174 0.013 0.073 1.19 4.6 9.3 0.03 5.66
20150715JC-E 25 10 18 29 12 4 362 5.8 0.02 0.261 0.008 0.093 1.55 3.7 9 0.03 0.27
20150716JC-B 50 60 43 154 17 8 1550 35.6 0.2 0.253 0.021 0.155 9.04 3.7 95.9 0.37 0.09
Table 3. Trace element geochemistry of samples collected for this investigation .
8
PHOSPHATE CONSUMPTION AND SUPPLYMore than 95 percent of domestically produced phosphate rock is used in the production of fertilizer . Phosphorus is also essential in the manufacture and production of various products, including food additives, pesticides, matches, flame retardants, and plasticizers (Threlfall, 1951; Greenwood and Earnshaw, 1997) . As food production is the dominant application of phosphate rock, both as fertil-izer and as additives to livestock feed, population growth will drive increases in phosphate rock demand . The United Nations (UN) predicts a 40 percent rise in global popula-tion by 2100 (United Nations, 2004) . Increased fertilizer application to boost crop yields will be a potential factor in meeting food production needs with rising population (e .g ., FAO, 2008) . However, due to diminishing returns, increased crop yields will not be proportional to increases in fertilizer application (Tilman and others, 2002) .
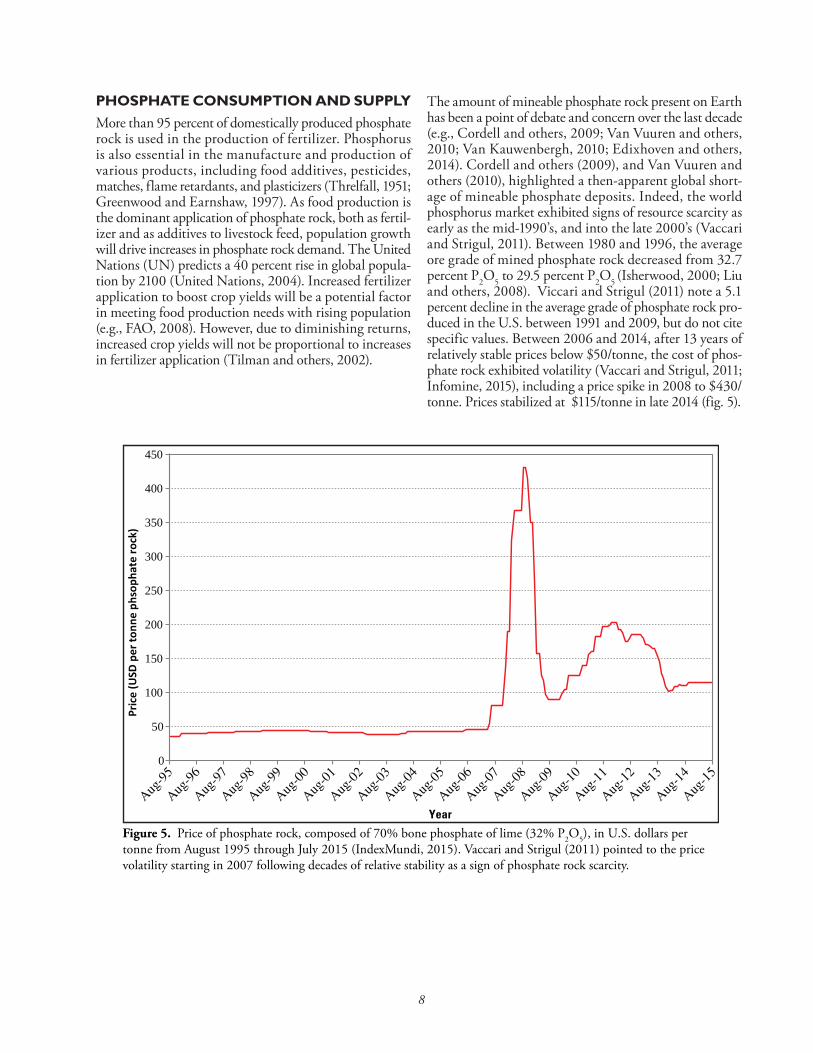
The amount of mineable phosphate rock present on Earth has been a point of debate and concern over the last decade (e .g ., Cordell and others, 2009; Van Vuuren and others, 2010; Van Kauwenbergh, 2010; Edixhoven and others, 2014) . Cordell and others (2009), and Van Vuuren and others (2010), highlighted a then-apparent global short-age of mineable phosphate deposits . Indeed, the world phosphorus market exhibited signs of resource scarcity as early as the mid-1990’s, and into the late 2000’s (Vaccari and Strigul, 2011) . Between 1980 and 1996, the average ore grade of mined phosphate rock decreased from 32 .7 percent P2O5 to 29 .5 percent P2O5 (Isherwood, 2000; Liu and others, 2008) . Viccari and Strigul (2011) note a 5 .1 percent decline in the average grade of phosphate rock pro-duced in the U .S . between 1991 and 2009, but do not cite specific values . Between 2006 and 2014, after 13 years of relatively stable prices below $50/tonne, the cost of phos-phate rock exhibited volatility (Vaccari and Strigul, 2011; Infomine, 2015), including a price spike in 2008 to $430/tonne . Prices stabilized at $115/tonne in late 2014 (fig . 5) .
0
50
100
150
200
250
300
350
400
450
Pric
e (U
SD p
er to
nne
phso
phat
e ro
ck)
Year
Figure 5. Price of phosphate rock, composed of 70% bone phosphate of lime (32% P2O5), in U .S . dollars per tonne from August 1995 through July 2015 (IndexMundi, 2015) . Vaccari and Strigul (2011) pointed to the price volatility starting in 2007 following decades of relative stability as a sign of phosphate rock scarcity .
9
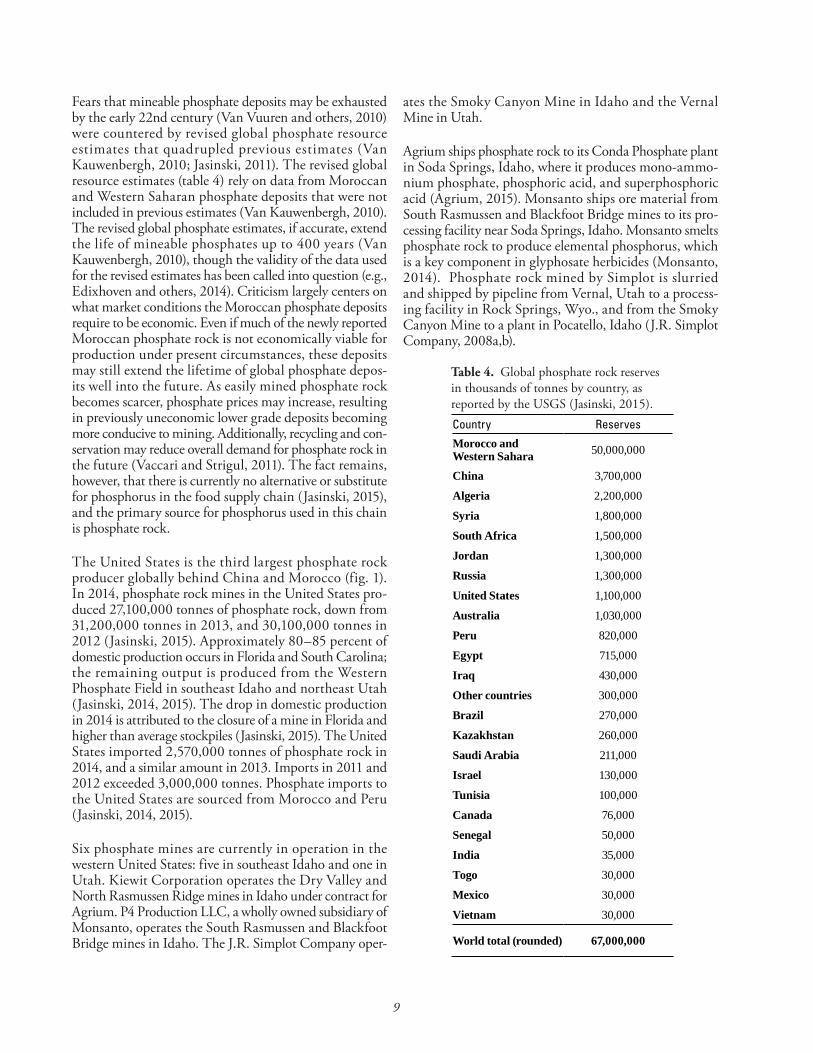
Fears that mineable phosphate deposits may be exhausted by the early 22nd century (Van Vuuren and others, 2010) were countered by revised global phosphate resource estimates that quadrupled previous estimates (Van Kauwenbergh, 2010; Jasinski, 2011) . The revised global resource estimates (table 4) rely on data from Moroccan and Western Saharan phosphate deposits that were not included in previous estimates (Van Kauwenbergh, 2010) . The revised global phosphate estimates, if accurate, extend the life of mineable phosphates up to 400 years (Van Kauwenbergh, 2010), though the validity of the data used for the revised estimates has been called into question (e .g ., Edixhoven and others, 2014) . Criticism largely centers on what market conditions the Moroccan phosphate deposits require to be economic . Even if much of the newly reported Moroccan phosphate rock is not economically viable for production under present circumstances, these deposits may still extend the lifetime of global phosphate depos-its well into the future . As easily mined phosphate rock becomes scarcer, phosphate prices may increase, resulting in previously uneconomic lower grade deposits becoming more conducive to mining . Additionally, recycling and con-servation may reduce overall demand for phosphate rock in the future (Vaccari and Strigul, 2011) . The fact remains, however, that there is currently no alternative or substitute for phosphorus in the food supply chain (Jasinski, 2015), and the primary source for phosphorus used in this chain is phosphate rock .
The United States is the third largest phosphate rock producer globally behind China and Morocco (fig . 1) . In 2014, phosphate rock mines in the United States pro-duced 27,100,000 tonnes of phosphate rock, down from 31,200,000 tonnes in 2013, and 30,100,000 tonnes in 2012 (Jasinski, 2015) . Approximately 80–85 percent of domestic production occurs in Florida and South Carolina; the remaining output is produced from the Western Phosphate Field in southeast Idaho and northeast Utah (Jasinski, 2014, 2015) . The drop in domestic production in 2014 is attributed to the closure of a mine in Florida and higher than average stockpiles (Jasinski, 2015) . The United States imported 2,570,000 tonnes of phosphate rock in 2014, and a similar amount in 2013 . Imports in 2011 and 2012 exceeded 3,000,000 tonnes . Phosphate imports to the United States are sourced from Morocco and Peru (Jasinski, 2014, 2015) .
Six phosphate mines are currently in operation in the western United States: five in southeast Idaho and one in Utah . Kiewit Corporation operates the Dry Valley and North Rasmussen Ridge mines in Idaho under contract for Agrium . P4 Production LLC, a wholly owned subsidiary of Monsanto, operates the South Rasmussen and Blackfoot Bridge mines in Idaho . The J .R . Simplot Company oper-
ates the Smoky Canyon Mine in Idaho and the Vernal Mine in Utah .
Agrium ships phosphate rock to its Conda Phosphate plant in Soda Springs, Idaho, where it produces mono-ammo-nium phosphate, phosphoric acid, and superphosphoric acid (Agrium, 2015) . Monsanto ships ore material from South Rasmussen and Blackfoot Bridge mines to its pro-cessing facility near Soda Springs, Idaho . Monsanto smelts phosphate rock to produce elemental phosphorus, which is a key component in glyphosate herbicides (Monsanto, 2014) . Phosphate rock mined by Simplot is slurried and shipped by pipeline from Vernal, Utah to a process-ing facility in Rock Springs, Wyo ., and from the Smoky Canyon Mine to a plant in Pocatello, Idaho (J .R . Simplot Company, 2008a,b) .
Country Reserves
Morocco and Western Sahara 50,000,000
China 3,700,000
Algeria 2,200,000
Syria 1,800,000
South Africa 1,500,000
Jordan 1,300,000
Russia 1,300,000
United States 1,100,000
Australia 1,030,000
Peru 820,000
Egypt 715,000
Iraq 430,000
Other countries 300,000
Brazil 270,000
Kazakhstan 260,000
Saudi Arabia 211,000
Israel 130,000
Tunisia 100,000
Canada 76,000
Senegal 50,000
India 35,000
Togo 30,000
Mexico 30,000
Vietnam 30,000
World total (rounded) 67,000,000
Table 4. Global phosphate rock reserves in thousands of tonnes by country, as reported by the USGS (Jasinski, 2015) .
10
MARINE PHOSPHORITES
Phosphogenesis Marine phosphate deposits originate during conditions of rapid biomass production in the water column . High biological activity contributes to the formation of marine phosphorites in two ways: (1) the large amount of organic material serves as a source for abundant phosphorite; and (2) the anoxic to euxinic marine environments produced by high biological activity promote phosphate deposit pres-ervation (e .g ., Hiatt and Budd, 2003) . Therefore, concen-trations of phosphate minerals in the marine sedimentary record result from relatively uncommon environmental conditions that allow high biological production, periodic winnowing, and rapid burial without significant detrital input (Filippelli, 2011) .
In Wyoming, the Phosphoria Formation was, in part, deposited at the bottom of the Phosphoria Sea, an epicon-tinental sea that inundated much of the present-day western United States during the Permian Period, approximately 269–265 Ma (Wardlaw and others, 1995; Wardlaw, 1999) . A potential contemporary analog for Phosphoria deposition is occurring off the coast of Peru, where marine phosphate deposition has been linked to large phytoplankton blooms driven by coastal upwelling of cold, nutrient-rich bottom waters (Filippelli, 2011) . Kazakov (1937, 1938) first recog-nized upwelling as an important oceanographic process, and McKelvey and others (1953a) applied Kazakov’s models to the Phosphoria Formation to explain high con-centrations of phosphate minerals and organic carbon . More recent publications, though, call into question the role of upwelling cold bottom water in the formation of phosphate rock in the Phosphoria . Hiatt and Budd (2003) argued that upwelling water was sourced from the middle of the water column, not the bottom . Ketner (2009) cor-related Phosphoria Formation from Utah and Idaho across Nevada to argue that the Phosphoria Basin was shallow with a relatively flat floor over an extensive area, which would prohibit upwelling in the part of the Phosphoria Sea that is now Idaho and western Wyoming .
The Phosphoria FormationDeposition of the Phosphoria Formation and related Park City Formation occurred within the Phosphoria Basin, off the northwest margin of Pangea, during the first part of the Late Permian, approximately 269–265 Ma (Wardlaw and others, 1995; Wardlaw, 1999) . The Milk River Uplift of western Montana bounded the Phosphoria Basin to the north, and the Confusion Shelf and uplifts of the Ancestral Rocky Mountains in Colorado and Utah bounded the basin to the south (Maughan, 1984) . The evaporative
Goose Egg Basin bounded the Phosphoria Basin to the east (Maughan, 1984; Perkins, 2003; Hein, 2004) .
The source of phosphorus in the Phosphoria Formation was organic matter (Moyle and Piper, 2004) . Environmental factors likely drove the rapid accumulation of this organic matter to produce phosphate rock . The paleogeography of the Phosphoria Basin was such that the combination of surface currents flowing along the continental margin and mid-latitude westerly winds may have promoted upwelling of nutrient-rich waters, driving biological productivity and resulting in the accumulation of organic material on the sea floor (McKelvey and others, 1953a; Hiatt and Budd, 2003) . Ketner (2009) provides interesting evidence against the occurrence of oceanic upwelling during Phosphoria deposition, but he fails to identify other environmental factors that may have been responsible for elevated biolog-ical productivity .
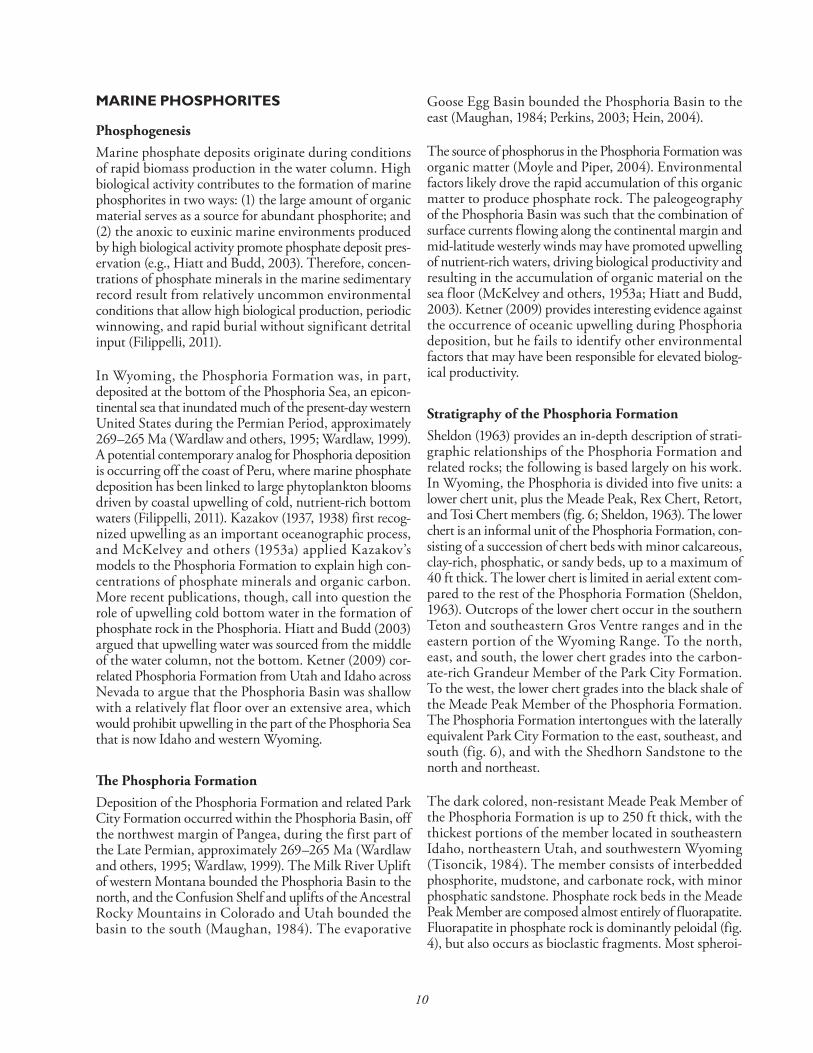
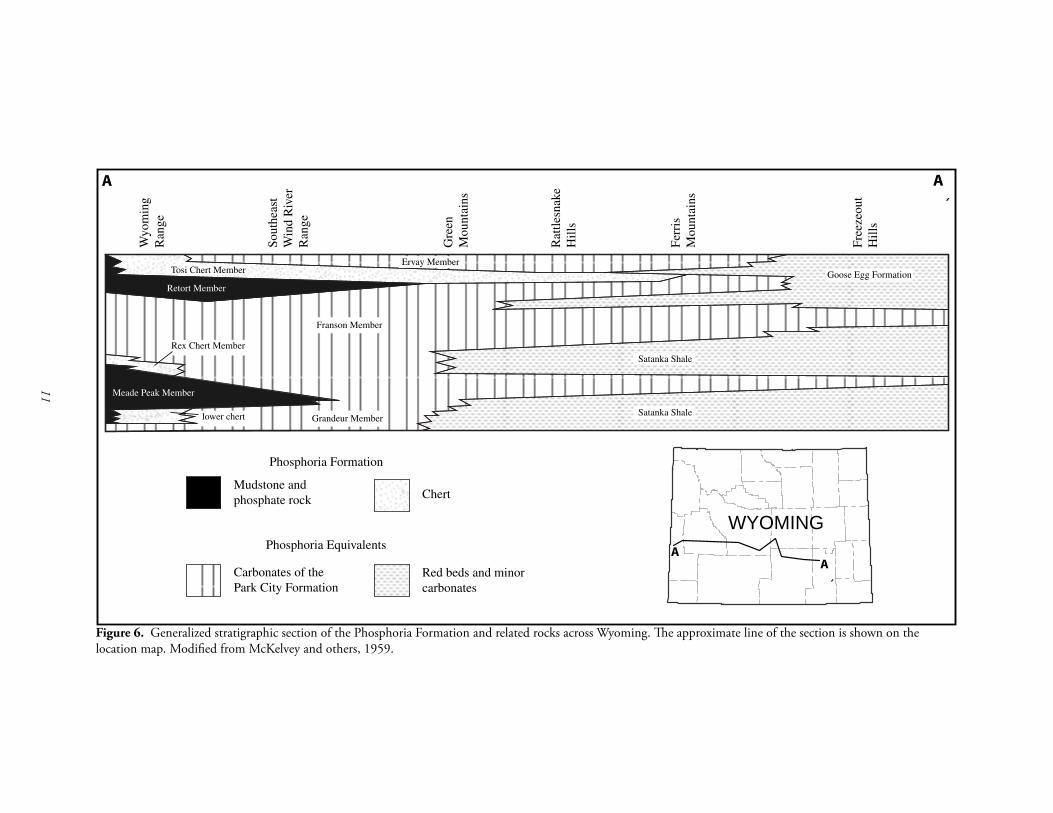
Stratigraphy of the Phosphoria FormationSheldon (1963) provides an in-depth description of strati-graphic relationships of the Phosphoria Formation and related rocks; the following is based largely on his work . In Wyoming, the Phosphoria is divided into five units: a lower chert unit, plus the Meade Peak, Rex Chert, Retort, and Tosi Chert members (fig . 6; Sheldon, 1963) . The lower chert is an informal unit of the Phosphoria Formation, con-sisting of a succession of chert beds with minor calcareous, clay-rich, phosphatic, or sandy beds, up to a maximum of 40 ft thick . The lower chert is limited in aerial extent com-pared to the rest of the Phosphoria Formation (Sheldon, 1963) . Outcrops of the lower chert occur in the southern Teton and southeastern Gros Ventre ranges and in the eastern portion of the Wyoming Range . To the north, east, and south, the lower chert grades into the carbon-ate-rich Grandeur Member of the Park City Formation . To the west, the lower chert grades into the black shale of the Meade Peak Member of the Phosphoria Formation . The Phosphoria Formation intertongues with the laterally equivalent Park City Formation to the east, southeast, and south (fig . 6), and with the Shedhorn Sandstone to the north and northeast .
The dark colored, non-resistant Meade Peak Member of the Phosphoria Formation is up to 250 ft thick, with the thickest portions of the member located in southeastern Idaho, northeastern Utah, and southwestern Wyoming (Tisoncik, 1984) . The member consists of interbedded phosphorite, mudstone, and carbonate rock, with minor phosphatic sandstone . Phosphate rock beds in the Meade Peak Member are composed almost entirely of fluorapatite . Fluorapatite in phosphate rock is dominantly peloidal (fig . 4), but also occurs as bioclastic fragments . Most spheroi-
11 Meade Peak Member
Retort Member
Rex Chert Member
lower chert Grandeur Member
Franson Member
Ervay Member
Satanka Shale
Satanka Shale
Goose Egg Formation
Wyo
min
g R
ange
Sout
heas
tW
ind
Riv
erR
ange
Gre
enM
ount
ains
Rat
tlesn
ake
Hill
s
Ferr
isM
ount
ains
Free
zeou
tH
ills
Tosi Chert Member
Red beds and minor carbonates
Carbonates of thePark City Formation
Phosphoria Equivalents
Mudstone and phosphate rock Chert
Phosphoria Formation
A A `
WYOMINGA
`A
Figure 6. Generalized stratigraphic section of the Phosphoria Formation and related rocks across Wyoming . The approximate line of the section is shown on the location map . Modified from McKelvey and others, 1959 .
12
dal apatite grains range 0 .06–4 mm in diameter, but some grains are up to 2 cm across . The Meade Peak Member thins to the north and the east . Much of the thinning into central Wyoming is due to the Meade Peak beds grading into the lower chert and Rex Chert members . In western Wyoming, however, individual beds are persistent, espe-cially along strike, and thinning here is accounted for by the thinning of individual beds, rather than beds pinch-ing out, or grading into separate facies . From western Wyoming into the central part of the state, the Meade Peak Member generally becomes sandier, and carbonate rock and mudstone become less abundant . The highest grade phosphate rock in the Meade Peak Member is commonly located in the upper half of the unit, where the barren rocks grade upward into peloidal phosphate rocks, which in turn, in places, grade into bioclastic phosphorite at the top of the member .
The Rex Chert Member of the Phosphoria Formation consists of chert beds between the Meade Peak and Retort members . The Rex Chert Member intertongues with the Shedhorn Sandstone and the Park City Formation . In southeastern Idaho, these intertonguing units divide the Rex Chert into three parts . The greatest thickness of the Rex Chert exceeds 110 ft in the Caribou Range of south-eastern Idaho; the thickness of the member decreases to the north, east, and southeast as it grades into other rock types . The Rex Chert is predominantly pure chert, with inter-bedded sandy, dolomitic, calcareous, argillaceous, or phos-phatic chert . Apatite grains in the Rex Chert are typically less than 1 mm in diameter; bioclastic fragments account for most of the apatite, though peloidal apatite does occur . The Rex Chert Member is thin-bedded to massive . Except for bedding planes, sedimentary structures are commonly absent, though in places, laminations, nodules, and tubular concretions are present .
The Retort Member of the Phosphoria Formation is a dark, non-resistant, phosphatic, mudstone unit that is widespread throughout the Phosphoria Formation in Wyoming . The Retort Member consists of interbedded, dark gray-to-black mudstone and shale, phosphate rock, and minor carbon-ate rock . Phosphate rock in the Retort is black to dark gray, thin-bedded, medium-hard argillaceous peloidal rock . Fluorapatite grains can be up to 4 mm in diameter . The Retort Member reaches its maximum thickness of approximately 60 ft in the eastern Gros Ventre Range and in the central to southern Wind River Range . The Retort Member thins to a few feet in thickness in Yellowstone National Park, the northern Wind River Range, and the Owl Creek Mountains . To the south-southwest, in the Wyoming and Snake River ranges, the Retort Member thins to 10–20 ft in thickness . Phosphate rock is most prev-alent along the western extent of the Retort Member in the
Wyoming and Hoback ranges, as well as in the Big Hole Range in Idaho . However, Retort Member phosphorites are present as far east as the Owl Creek Mountains, and Conant Creek Anticline in central Wyoming .
The Tosi Chert Member is the uppermost unit of the Phosphoria Formation . The Tosi Chert is lithologically similar to the Rex Chert, and consists of pure chert inter-bedded with argillaceous, sandy, dolomitic, calcareous, or phosphatic chert . In the northern Teton Range, the Tosi Chert reaches it maximum thickness of 75 ft .
The Park City Formation and Shedhorn Sandstone divide the Phosphoria Formation across much of its extent in Wyoming (Sheldon, 1963) . Much academic work has focused on developing sequence stratigraphic models of sedimentation in the Phosphoria Basin during the Permian (e .g ., Hein and others, 2004) . General agreement exists that the Meade Peak and Retort members, at least in part, represent transgressions of the Phosphoria Sea . For more detailed information regarding the sequence stratigraphy of the Phosphoria and Park City formations, see Hein and others (2004) .
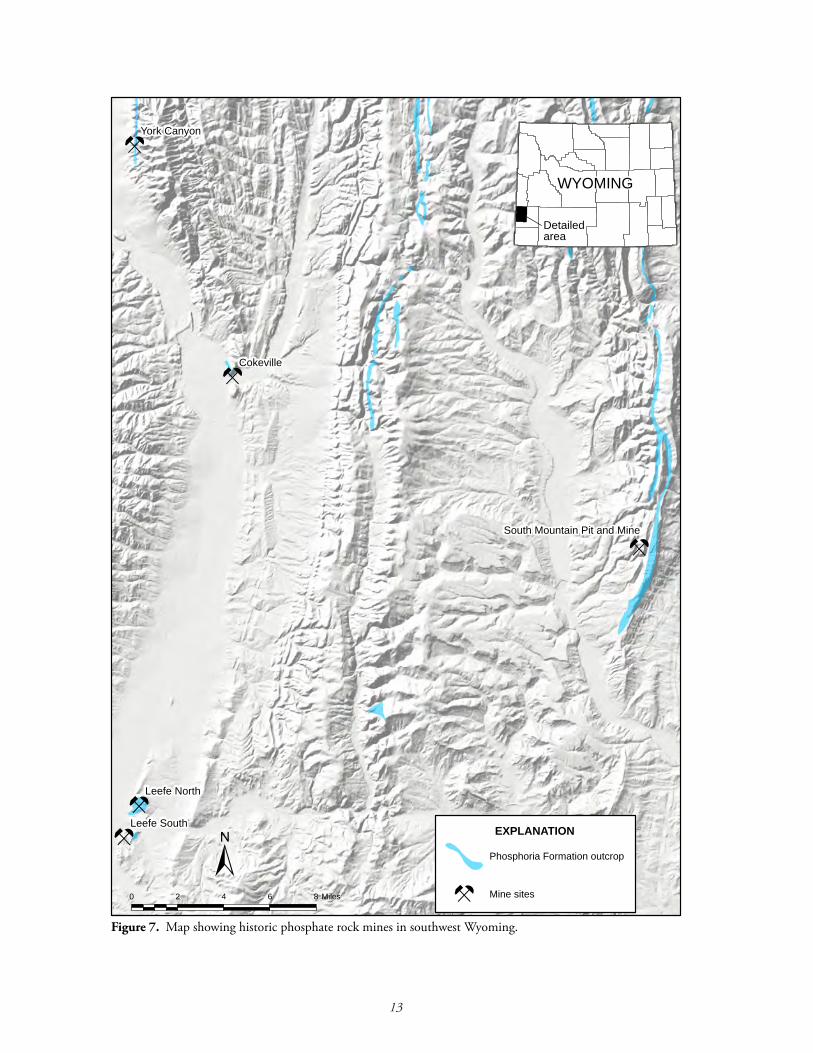
Past Production from the Phosphoria Formation in WyomingWhile current production from the Western Phosphate Field is restricted to Idaho and Utah, past production also occurred in Montana and Wyoming (Jasinski and others, 2004) . Phosphate rock in the Western Phosphate Field was first discovered in 1889 in Cache County, Utah; mining activities began there in 1904 (Jasinski and others, 2004) . In Wyoming, phosphate mining occurred at four facilities: the Cokeville underground mine, the York Canyon under-ground mine, the South Mountain surface and under-ground mine, and the Leefe mine, which consisted of two open pits (fig . 7; Jasinski and others, 2004) . These mines each targeted phosphate rock in the Phosphoria Formation within the Overthrust Belt in Lincoln County, Wyo .
Cokeville MineProduction of phosphate rock in Wyoming first occurred in 1907 at the Cokeville underground mine, located just east of Cokeville, Wyo . The Union Phosphate Company/Cokeville Phosphate Company operated the mine intermit-tently until 1931 (Coffman and Service, 1967) . Production information from the Cokeville Mine is not available prior to 1919 . From 1925 through 1931, the mine produced over 29,200 tons of phosphate rock (Wyoming Board of Equalization, 1926–1932) .
13
Cokeville
Leefe South
Leefe North
York Canyon
South Mountain Pit and Mine
WYOMING
Detailed area
0 2 4 6 8 Miles
±EXPLANATION
Phosphoria Formation outcrop
Mine sitesFigure 7. Map showing historic phosphate rock mines in southwest Wyoming .
14
The Cokeville deposit is on the east limb of a faulted north-plunging anticline where bedding orientation is 330°, 60° E . (Sheldon and others, 1953) . Sheldon and others (1953) noted a 4 .7 ft thick succession of phosphate rock and phosphatic mudstone in the Meade Peak Member that averaged 30 .2 percent P2O5 .
York Canyon MineThe York Canyon underground mine northwest of Cokeville operated from 1913 to 1917 . The U .S . Phosphate Company mined and pulverized phosphate rock here for direct application to soil . The company guaranteed the crushed rock contained more than 32 percent P2O5 (Coffman and Service, 1967) . Production figures from the York Canyon Mine are not available . Bedding at the York Canyon mine is nearly vertical and strikes north-northeast; the host bed at York Canyon was 4 ft thick, and averaged 34 .4 percent P2O5 (Mansfield, 1927) .
South Mountain Mine – Commissary RidgeNear Kemmerer, Phosphate Mines, Inc . operated the open pit and underground South Mountain Mine on Commissary Ridge . In the vicinity of the South Mountain Mine, the Phosphoria Formation overlies the Cretaceous Hilliard Shales along the Absaroka Thrust Fault (Cochran, 1950) . At the crest of the Commissary Ridge, bedding orientation is 195°, 45° NW . The target bed at the South Mountain Mine was 4 .5 ft thick, and typically contained more than 21 percent P2O5 . The open pit at the top of the ridge was established first and mining within the pit pro-ceeded until stripping costs became too expensive . An adit was dug into the hill approximately 300 vertical feet below the ridge; the adit intersected the target bed at a distance of 800 ft . Underground, strike and dip of the target bed was 192–200°, 12–20° NW . (Cochran, 1950) . Sheldon and others (1954) present a measured section of the Phosphoria Formation from within the open pit and underground mine in 1952 . This was completed after mine operations ceased . The most phosphate-rich bed they encountered contained 27 .3 percent P2O5, but was only 0 .5 ft thick; also present were a 1 .8-ft-thick bed at the top of the Phosphoria Formation with 22 .6 percent P2O5, a 1 .9-ft-thick bed 17 ft above the base of the Phosphoria with 21 .5 percent P2O5, and a 2 .7-ft-thick bed with 20 .7 percent P2O5 at the base of the formation (Sheldon and others, 1954) .
The mine operated intermittently from 1947 to 1951 . By 1950, 8,000 tons of phosphate rock had been mined from the South Mountain Mine (Cochran, 1950); however, annual production data from the Wyoming Board of Equalization or the State Inspector of Mines are not available . Phosphate Mines, Inc . sold the phosphate rock
produced from the South Mountain Mine for direct soil application (Coffman and Service, 1967) .
Leefe MineThe Leefe open-pit mine operated continuously from 1947 to 1977 (Jasinski and others, 2004) . The mine included two open pits (Dover, 1995) and yielded more than 4,725,000 tons of phosphate rock (Wyoming Board of Equalization, 1948–1978) . The northern pit was located in the SW¼SE¼ sec . 3, and NE¼ sec . 10, T . 21 N ., R . 120 W . The southern pit was locatedin the NE¼ and NE¼NW ¼ sec . 15, T . 21 N ., R . 120 W . (McKelvey, 1953b; Dover, 1995) . The San Francisco Chemical Company developed the mine, and sold it to Stauffer Chemical Company in 1968 (Harris and Hausel, 1984) . Construction of phos-phate processing facilities began in 1956, and by 1965, the plant at the Leefe site was capable of producing up to 500,000 lb of concentrate and calcined rock per year (Coffman and Service, 1967) .
Most of the Phosphoria Formation in the vicinity of the Leefe Mine has been removed, though small remnant out-crops are still present (Dover, 1995) . Prior to removal, the Phosphoria Formation at the Leefe Mine occurred along a north-northwest-trending syncline cut by east–west-trend-ing faults . The minor outcrops of the Phosphoria that are still present occur along the flanks of the syncline .
Mining at the Leefe open pit targeted four phosphatic beds in the Meade Peak Member of the Phosphoria Formation (King, 1949, 1967) . King (1949) labeled the phosphatic beds A through D, from highest to lowest, and described the beds in detail . The A bed is light colored, oolitic, and massive phosphate rock that averages 5 .5 ft thick and ranges from 33 .5 to 34 .7 percent P2O5 . Black phosphatic shale of the B bed directly underlies the A bed . The B bed is 5 ft thick with an average phosphate content of 28 .0 percent P2O5 . The C bed is a 6 .3-ft-thick black shale with 25 percent P2O5, separated from the B bed by 2 .0 ft of sandy mudstone . The D bed is lithologically similar to the A bed and contains 33 .5 percent P2O5, though it is less than 2 ft thick . The D bed is separated from the C bed by 2 .0 ft of sandy mudstone, and is underlain by siltstone . Prior to construction of the processing facilities, only the A bed was suitable for mining, as its ore could be shipped without additional processing to increase the phosphate concentration (King, 1967) . McKelvey and others (1953b) provide detailed geologic descriptions from both pits at the Leefe mine . They found that in the south pit, the average phosphate content of the A and B beds, combined, was 32 .0 percent P2O5 over 9 .2 ft, while at the north pit, the A and B beds averaged 31 .9 percent P2O5 over 7 .0 ft combined thickness .
15
During the establishment of the Leefe Mine, the San Francisco Chemical Company recognized the potential value of the phosphatic beds below the A bed, and ensured future minability by disposing of overburden and waste rock outside of the phosphate deposit area (King, 1967) . Phosphate ore from the Leefe Mine was used to produce phosphoric acid at facilities in Idaho and British Columbia, Canada (Coffman and Service, 1967; Jasinski and others, 2004) . Phosphate rock processed at the Leefe site came from the Leefe Mine itself, as well as mines in Utah and Idaho . The Leefe Mine was the last active phosphate mine in Wyoming, and shut down due to the depletion of phos-phate rock resources at the site . After mining operations ceased, phosphate processing continued at the Leefe plant using raw material mined from the Phosphoria Formation in Idaho and Utah into the 1980’s (Harris and Hausel, 1984) .
Other Significant Occurrences within the Phosphoria Formation
A Note About SamplingSamples collected and analyzed during this investigation are grab samples (i .e ., small, unmeasured samples), and only represent one small piece of evidence for or against the occurrence of a mineral concentration or deposit . The elemental concentrations associated with a grab sample may or may not extend into the outcrop from which the sample was collected . Results reported here are those of a survey, rather than thorough evaluations of individual deposits .
Powder X-ray diffraction (XRD) analysis allowed for the identification of which, if any, phosphate minerals are present in the samples collected for this report . Twenty-three samples yielded diffractogram patterns that matched phosphate minerals . Twenty of these samples were analyzed for whole-rock geochemistry, along with one sample of barren mudstone, and two samples previously collected by the Wyoming State Geological Survey . ALS Chemex of Reno, Nev . completed all of the geochemical analyses for this project . They used x-ray fluorescence analysis to deter-mine the whole-rock major element composition, as oxides, of each of the 23 samples analyzed . They determined trace element geochemistry for five samples by inductively coupled plasma mass spectrometry for metals, and com-bustion for carbon and sulfur . Results of the geochemical analyses are shown in tables 2 and 3 . Individual results and associated sample sites are discussed below .
Wind River Mountains and Wind River BasinThe Phosphoria Formation crops out in a northwest-trend-ing belt of rock along the northeastern foothills of the Wind
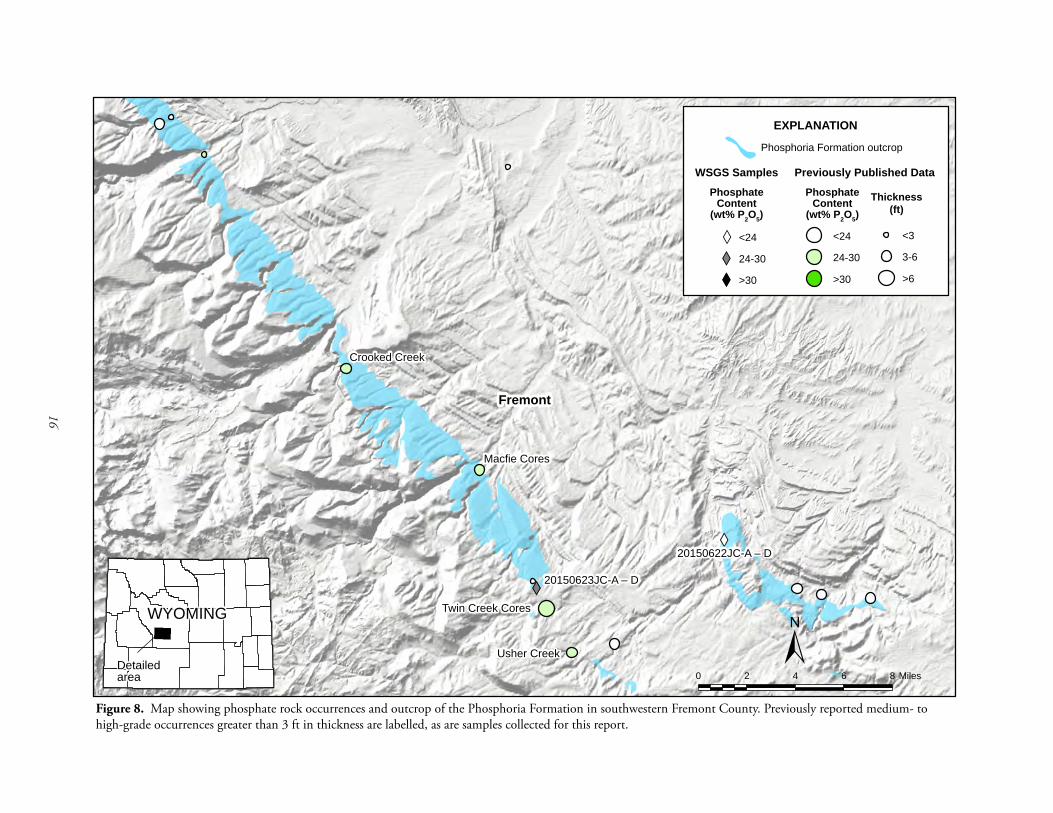
River Mountains (Love and Christiansen, 1985) . While the Phosphoria outcrop spans nearly the entire length of the Wind River Mountains, the highest phosphate values reported in the literature from the Phosphoria here are located to the south and west of Lander (e .g ., King and Schumacher, 1949; Sheldon and others, 1953) . King (1947) provides a detailed description of the physical stratigraphy in the Lander area, with an emphasis on the phosphate rock in the Phosphoria Formation . The total thickness of the Phosphoria Formation in the Lander area is 280–290 ft . The Phosphoria here consists of interbedded mixed argil-laceous carbonates, clastic sedimentary rocks, chert, and phosphate rock (King, 1947) . Two notable phosphate rock beds are present in the Lander area, a lower bed within the Meade Peak Member, approximately 40–55 ft above the base of the Phosphoria, and an upper bed in the Retort Shale Member, approximately 60–75 ft below the top of the formation (Condit, 1924; King, 1947) . The phosphate rock bed in the Meade Peake Member is less persistent than that in the Retort Shale phosphate rock bed, but hosts higher phosphate concentrations . The highest published value for the upper phosphate bed is 22 .6 percent P2O5 in sec . 25, T . 32 N ., R . 100 W ., where the bed is 5 ft thick (Condit, 1924) . Field investigations for this publication identified a 6-ft-thick bed of low- to medium-grade phosphate rock . A representative sample of the lower half of this bed yielded 24 .2 percent P2O5, and one of the upper half yielded 21 .6 percent P2O5 .
The lower phosphate bed exhibits 27 .9 percent P2O5 at two locations: Tweed (Usher) Creek, sec 24, T . 30 N ., R . 99 W ., and Crooked Creek, sec . 21, T . 32 N ., R . 100 W (Condit, 1924) . At Tweed Creek, Condit reported that the lower phosphate rock bed is 4 ft thick, and at Crooked Creek, the lower phosphate bed is more than 3 ft thick .
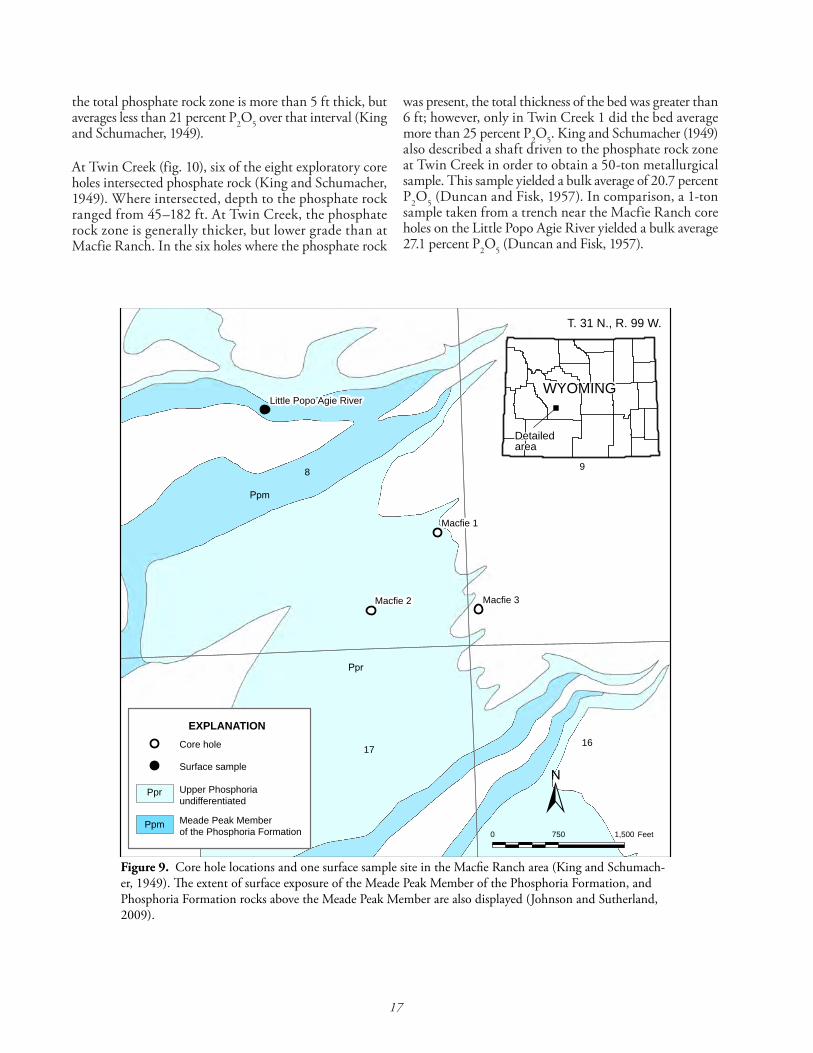
The U .S . Bureau of Mines drilled three exploratory core holes on Macfie Ranch in sections 8 and 9, T . 31 N ., R . 99 W ., and eight core holes 6 .5 miles to the southeast near Twin Creek (fig . 8; table 5; King and Schumacher, 1949) . The Phosphoria Formation is exposed in a gully cut by the Little Popo Agie River, approximately 1000 ft north of the first drill hole, Macfie 1 . Bedding in this area strikes 330°, and dips 8° NE . The core holes ranged in depth from 273 to 321 ft . The first hole, Macfie 1, was drilled past the base of the phosphate rock zone in the Meade Peak Member, while Macfie 2 and 3 finished at the base of the phosphate rock zone . Macfie 1 and 3 were drilled approximately 1000 ft apart along strike, and Macfie 2 was drilled about 1000 ft up dip from the mid-point between Macfie 1 and 3 (fig . 9) . The core holes intersected phosphate rock at a depth between 261 and 271 ft . In each of the Macfie core holes, the phosphate rock zone exhibited greater than 25 percent P2O5 over an interval of three or more feet . In Macfie 3,
16
Twin Creek Cores
Usher Creek
Crooked Creek
Macfie Cores
XWXW
XWXW20150623JC-A – D
20150622JC-A – D
Fremont
WYOMING
Detailed area
EXPLANATION
Phosphoria Formation outcrop
WSGS Samples
PhosphateContent
(wt% P2O5)
Previously Published Data
Thickness(ft)
<3
3-6
>6
PhosphateContent
(wt% P2O5)
<24
24-30
>30
0 2 4 6 8 Miles±
<24XW24-30XW>30XW
Figure 8. Map showing phosphate rock occurrences and outcrop of the Phosphoria Formation in southwestern Fremont County . Previously reported medium- to high-grade occurrences greater than 3 ft in thickness are labelled, as are samples collected for this report .
17
the total phosphate rock zone is more than 5 ft thick, but averages less than 21 percent P2O5 over that interval (King and Schumacher, 1949) .
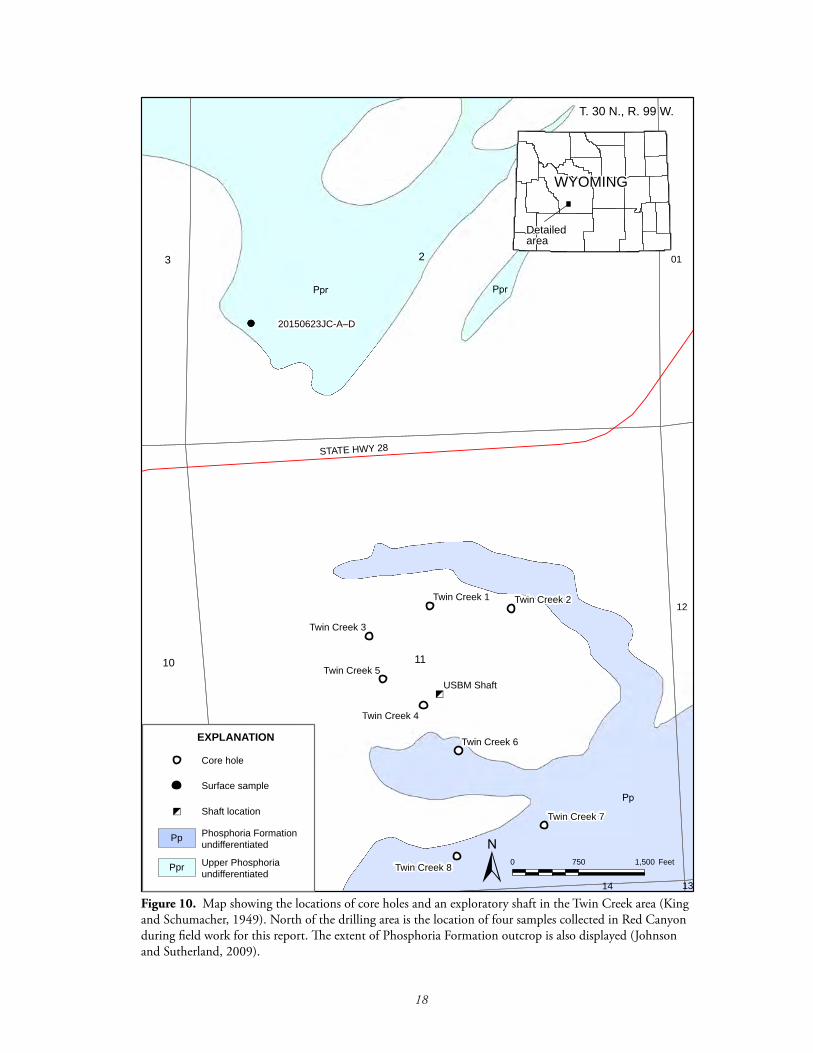
At Twin Creek (fig . 10), six of the eight exploratory core holes intersected phosphate rock (King and Schumacher, 1949) . Where intersected, depth to the phosphate rock ranged from 45–182 ft . At Twin Creek, the phosphate rock zone is generally thicker, but lower grade than at Macfie Ranch . In the six holes where the phosphate rock
was present, the total thickness of the bed was greater than 6 ft; however, only in Twin Creek 1 did the bed average more than 25 percent P2O5 . King and Schumacher (1949) also described a shaft driven to the phosphate rock zone at Twin Creek in order to obtain a 50-ton metallurgical sample . This sample yielded a bulk average of 20 .7 percent P2O5 (Duncan and Fisk, 1957) . In comparison, a 1-ton sample taken from a trench near the Macfie Ranch core holes on the Little Popo Agie River yielded a bulk average 27 .1 percent P2O5 (Duncan and Fisk, 1957) .
Figure 9. Core hole locations and one surface sample site in the Macfie Ranch area (King and Schumach-er, 1949) . The extent of surface exposure of the Meade Peak Member of the Phosphoria Formation, and Phosphoria Formation rocks above the Meade Peak Member are also displayed (Johnson and Sutherland, 2009) .
!
! !
Macfie 3Macfie 2
Macfie 1
Little Popo Agie River
Ppr
Ppm
8 9
1716
0 750 1,500 Feet
±
T. 31 N., R. 99 W.
EXPLANATION
Upper Phosphoria undifferentiated
Meade Peak Member of the Phosphoria Formation
Ppr
Ppm
Core hole
Surface sample
!
WYOMING
Detailed area
18
Figure 10. Map showing the locations of core holes and an exploratory shaft in the Twin Creek area (King and Schumacher, 1949) . North of the drilling area is the location of four samples collected in Red Canyon during field work for this report . The extent of Phosphoria Formation outcrop is also displayed (Johnson and Sutherland, 2009) .
!
!
!
!
!
!
!
!
»
!!!!
USBM Shaft
Twin Creek 8
Twin Creek 7
Twin Creek 6
Twin Creek 5
Twin Creek 4
Twin Creek 2
Twin Creek 3
Twin Creek 1
20150623JC-A–D
Pp
Ppr
Pp
Ppr
11
2
10
3 01
12
14 13
STATE HWY 28
0 750 1,500 Feet±
EXPLANATION
Upper Phosphoria undifferentiated
Ppr
Phosphoria Formationundifferentiated
Pp
T. 30 N., R. 99 W.
WYOMING
Detailed area
Core hole
Surface sample
» Shaft location
!
19
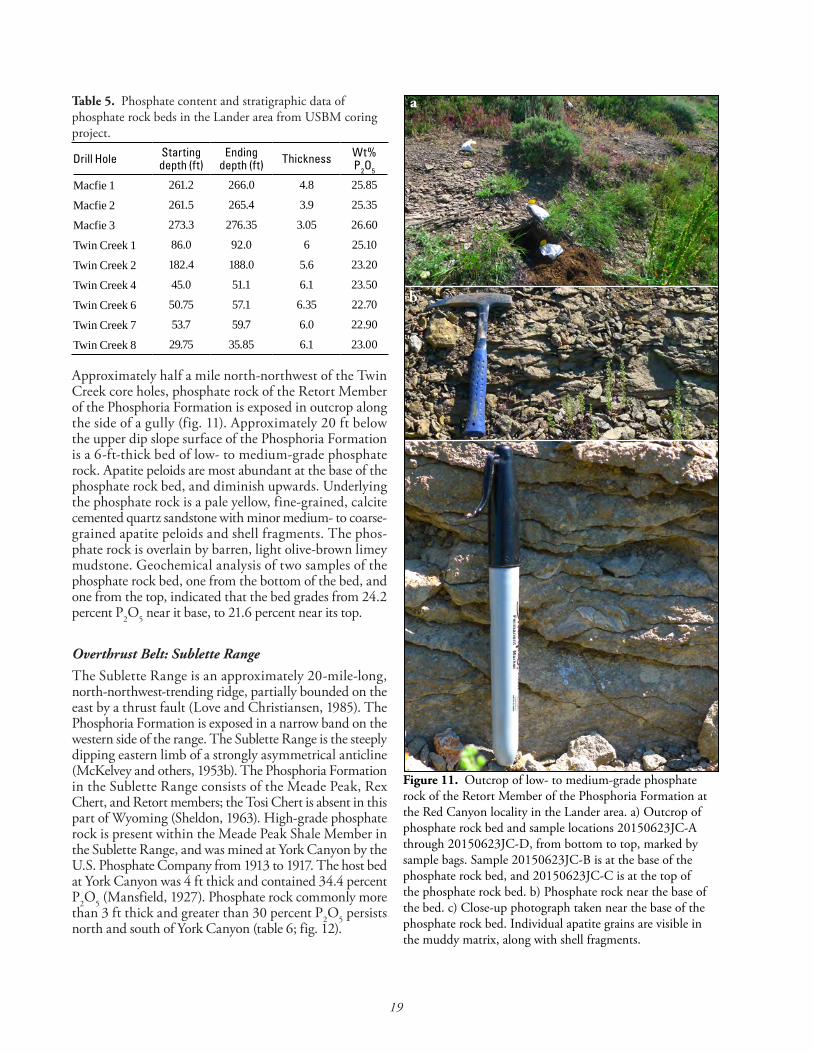
Approximately half a mile north-northwest of the Twin Creek core holes, phosphate rock of the Retort Member of the Phosphoria Formation is exposed in outcrop along the side of a gully (fig . 11) . Approximately 20 ft below the upper dip slope surface of the Phosphoria Formation is a 6-ft-thick bed of low- to medium-grade phosphate rock . Apatite peloids are most abundant at the base of the phosphate rock bed, and diminish upwards . Underlying the phosphate rock is a pale yellow, fine-grained, calcite cemented quartz sandstone with minor medium- to coarse-grained apatite peloids and shell fragments . The phos-phate rock is overlain by barren, light olive-brown limey mudstone . Geochemical analysis of two samples of the phosphate rock bed, one from the bottom of the bed, and one from the top, indicated that the bed grades from 24 .2 percent P2O5 near it base, to 21 .6 percent near its top .
Overthrust Belt: Sublette RangeThe Sublette Range is an approximately 20-mile-long, north-northwest-trending ridge, partially bounded on the east by a thrust fault (Love and Christiansen, 1985) . The Phosphoria Formation is exposed in a narrow band on the western side of the range . The Sublette Range is the steeply dipping eastern limb of a strongly asymmetrical anticline (McKelvey and others, 1953b) . The Phosphoria Formation in the Sublette Range consists of the Meade Peak, Rex Chert, and Retort members; the Tosi Chert is absent in this part of Wyoming (Sheldon, 1963) . High-grade phosphate rock is present within the Meade Peak Shale Member in the Sublette Range, and was mined at York Canyon by the U .S . Phosphate Company from 1913 to 1917 . The host bed at York Canyon was 4 ft thick and contained 34 .4 percent P2O5 (Mansfield, 1927) . Phosphate rock commonly more than 3 ft thick and greater than 30 percent P2O5 persists north and south of York Canyon (table 6; fig . 12) .
Drill Hole Starting depth (ft)
Ending depth (ft) Thickness Wt%
P2O5
Macfie 1 261.2 266.0 4.8 25.85
Macfie 2 261.5 265.4 3.9 25.35
Macfie 3 273.3 276.35 3.05 26.60
Twin Creek 1 86.0 92.0 6 25.10
Twin Creek 2 182.4 188.0 5.6 23.20
Twin Creek 4 45.0 51.1 6.1 23.50
Twin Creek 6 50.75 57.1 6.35 22.70
Twin Creek 7 53.7 59.7 6.0 22.90
Twin Creek 8 29.75 35.85 6.1 23.00
Table 5. Phosphate content and stratigraphic data of phosphate rock beds in the Lander area from USBM coring project .
Figure 11. Outcrop of low- to medium-grade phosphate rock of the Retort Member of the Phosphoria Formation at the Red Canyon locality in the Lander area . a) Outcrop of phosphate rock bed and sample locations 20150623JC-A through 20150623JC-D, from bottom to top, marked by sample bags . Sample 20150623JC-B is at the base of the phosphate rock bed, and 20150623JC-C is at the top of the phosphate rock bed . b) Phosphate rock near the base of the bed . c) Close-up photograph taken near the base of the phosphate rock bed . Individual apatite grains are visible in the muddy matrix, along with shell fragments .
a
b
c
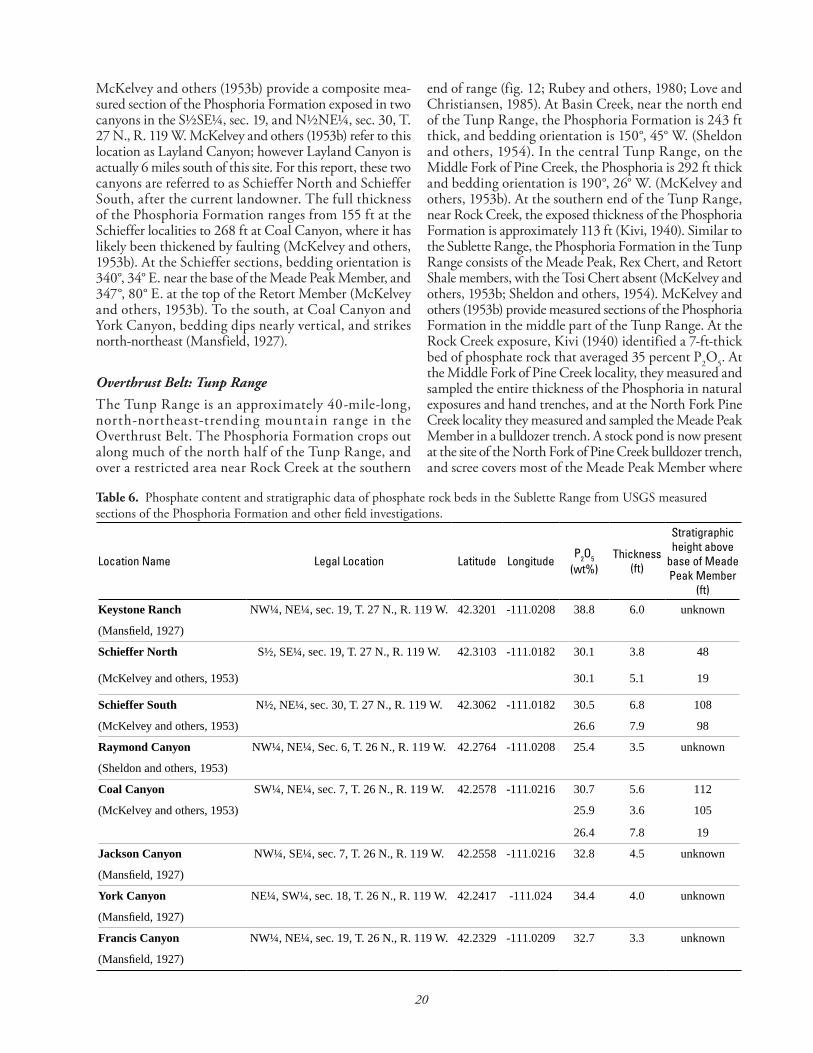
20
McKelvey and others (1953b) provide a composite mea-sured section of the Phosphoria Formation exposed in two canyons in the S½SE¼, sec . 19, and N½NE¼, sec . 30, T . 27 N ., R . 119 W . McKelvey and others (1953b) refer to this location as Layland Canyon; however Layland Canyon is actually 6 miles south of this site . For this report, these two canyons are referred to as Schieffer North and Schieffer South, after the current landowner . The full thickness of the Phosphoria Formation ranges from 155 ft at the Schieffer localities to 268 ft at Coal Canyon, where it has likely been thickened by faulting (McKelvey and others, 1953b) . At the Schieffer sections, bedding orientation is 340°, 34° E . near the base of the Meade Peak Member, and 347°, 80° E . at the top of the Retort Member (McKelvey and others, 1953b) . To the south, at Coal Canyon and York Canyon, bedding dips nearly vertical, and strikes north-northeast (Mansfield, 1927) .
Overthrust Belt: Tunp RangeThe Tunp Range is an approximately 40-mile-long, north-northeast-trending mountain range in the Overthrust Belt . The Phosphoria Formation crops out along much of the north half of the Tunp Range, and over a restricted area near Rock Creek at the southern
end of range (fig . 12; Rubey and others, 1980; Love and Christiansen, 1985) . At Basin Creek, near the north end of the Tunp Range, the Phosphoria Formation is 243 ft thick, and bedding orientation is 150°, 45° W . (Sheldon and others, 1954) . In the central Tunp Range, on the Middle Fork of Pine Creek, the Phosphoria is 292 ft thick and bedding orientation is 190°, 26° W . (McKelvey and others, 1953b) . At the southern end of the Tunp Range, near Rock Creek, the exposed thickness of the Phosphoria Formation is approximately 113 ft (Kivi, 1940) . Similar to the Sublette Range, the Phosphoria Formation in the Tunp Range consists of the Meade Peak, Rex Chert, and Retort Shale members, with the Tosi Chert absent (McKelvey and others, 1953b; Sheldon and others, 1954) . McKelvey and others (1953b) provide measured sections of the Phosphoria Formation in the middle part of the Tunp Range . At the Rock Creek exposure, Kivi (1940) identified a 7-ft-thick bed of phosphate rock that averaged 35 percent P2O5 . At the Middle Fork of Pine Creek locality, they measured and sampled the entire thickness of the Phosphoria in natural exposures and hand trenches, and at the North Fork Pine Creek locality they measured and sampled the Meade Peak Member in a bulldozer trench . A stock pond is now present at the site of the North Fork of Pine Creek bulldozer trench, and scree covers most of the Meade Peak Member where
Location Name Legal Location Latitude LongitudeP2O5
(wt%)Thickness
(ft)
Stratigraphic height above
base of Meade Peak Member
(ft)
Keystone Ranch NW¼, NE¼, sec. 19, T. 27 N., R. 119 W. 42.3201 -111.0208 38.8 6.0 unknown
(Mansfield, 1927)
Schieffer North S½, SE¼, sec. 19, T. 27 N., R. 119 W. 42.3103 -111.0182 30.1 3.8 48
(McKelvey and others, 1953) 30.1 5.1 19
Schieffer South N½, NE¼, sec. 30, T. 27 N., R. 119 W. 42.3062 -111.0182 30.5 6.8 108
(McKelvey and others, 1953) 26.6 7.9 98
Raymond Canyon NW¼, NE¼, Sec. 6, T. 26 N., R. 119 W. 42.2764 -111.0208 25.4 3.5 unknown
(Sheldon and others, 1953)
Coal Canyon SW¼, NE¼, sec. 7, T. 26 N., R. 119 W. 42.2578 -111.0216 30.7 5.6 112
(McKelvey and others, 1953) 25.9 3.6 105
26.4 7.8 19
Jackson Canyon NW¼, SE¼, sec. 7, T. 26 N., R. 119 W. 42.2558 -111.0216 32.8 4.5 unknown
(Mansfield, 1927)
York Canyon NE¼, SW¼, sec. 18, T. 26 N., R. 119 W. 42.2417 -111.024 34.4 4.0 unknown
(Mansfield, 1927)
Francis Canyon NW¼, NE¼, sec. 19, T. 26 N., R. 119 W. 42.2329 -111.0209 32.7 3.3 unknown
(Mansfield, 1927)
Table 6. Phosphate content and stratigraphic data of phosphate rock beds in the Sublette Range from USGS measured sections of the Phosphoria Formation and other field investigations .
21
0 2 4 6 Miles±
Rock Creek
Leefe South
Leefe North
Schieffer
Cokeville
Wheat Creek
Basin CreekCoal Canyon
York Canyon
Raymond Canyon
Jackson Canyon
Francis Canyon
Fontenelle Creek
North Fork of Pine Creek
Middle Fork of Pine Creek
XW
XWXWXW
XW20150714JC-E
20150714JC-A – D
20150713JC-A
Subl
ette
Ran
ge
Tunp
Ran
ge
Com
mis
sary
Rid
ge
WYOMING
Detailed area
WSGS Samples Previously Published DataPhosphate Content
(wt% P2O5)
<24
24-30
>30
Phosphate Content(wt% P2O5)
<24
24-30
>30
Thickness(ft)
<3
3-6
>6
EXPLANATION
Phosphoria Formation outcrop
XW
XW
XW
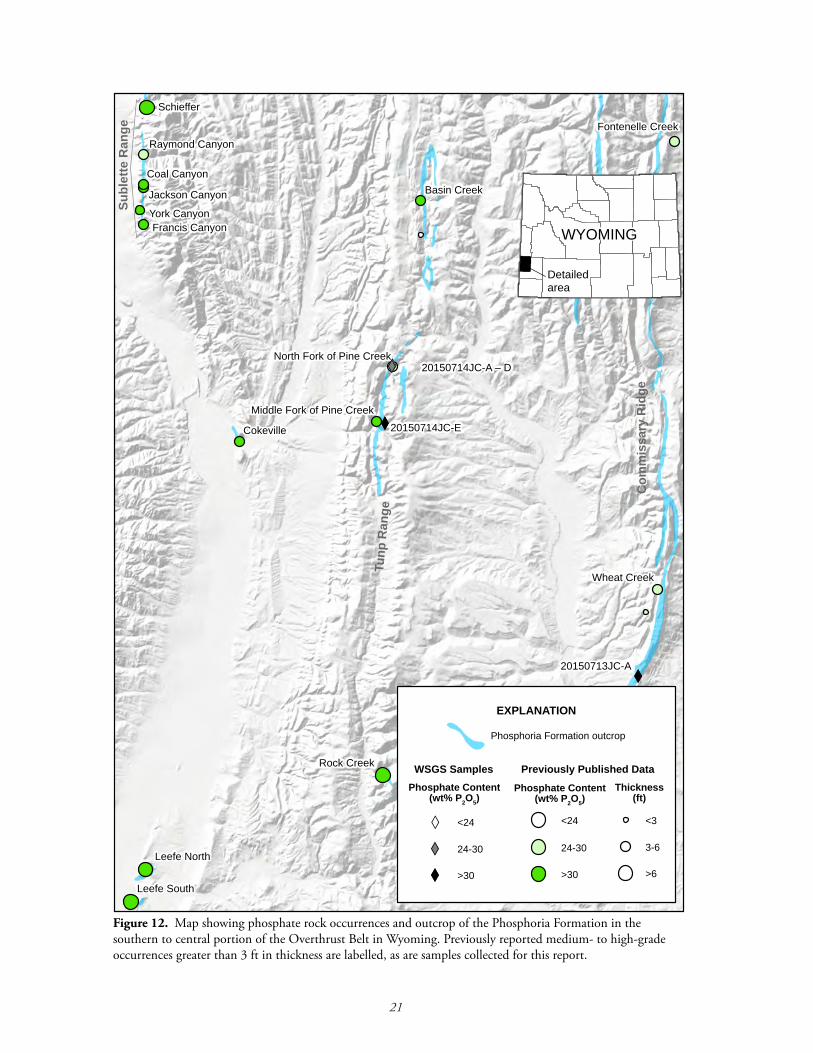
Figure 12. Map showing phosphate rock occurrences and outcrop of the Phosphoria Formation in the southern to central portion of the Overthrust Belt in Wyoming . Previously reported medium- to high-grade occurrences greater than 3 ft in thickness are labelled, as are samples collected for this report .
22
it would otherwise be exposed in this area . Two phosphate rock beds greater than 3 ft thick occur in the upper third of the Meade Peak Member (McKelvey and others, 1953b); at both locations the uppermost phosphate rock bed contains more than 30 percent P2O5 . A medium-grade phosphate rock bed occurs in the lower portion of the Meade Peak Member at the North Fork of Pine Creek locality (table 7) . McKelvey and others (1953b) reported minor phosphate rock within the Retort Member at the Middle Fork of Pine Creek, and thin, low-grade phosphate rock was observed at the top of the Retort Shale at North Fork of Pine Creek during field investigations for this report . A sample of phosphate rock collected from float over the Meade Peak Member contained more than 25 percent P2O5, in agree-ment with McKelvey and others’ (1953b) data .
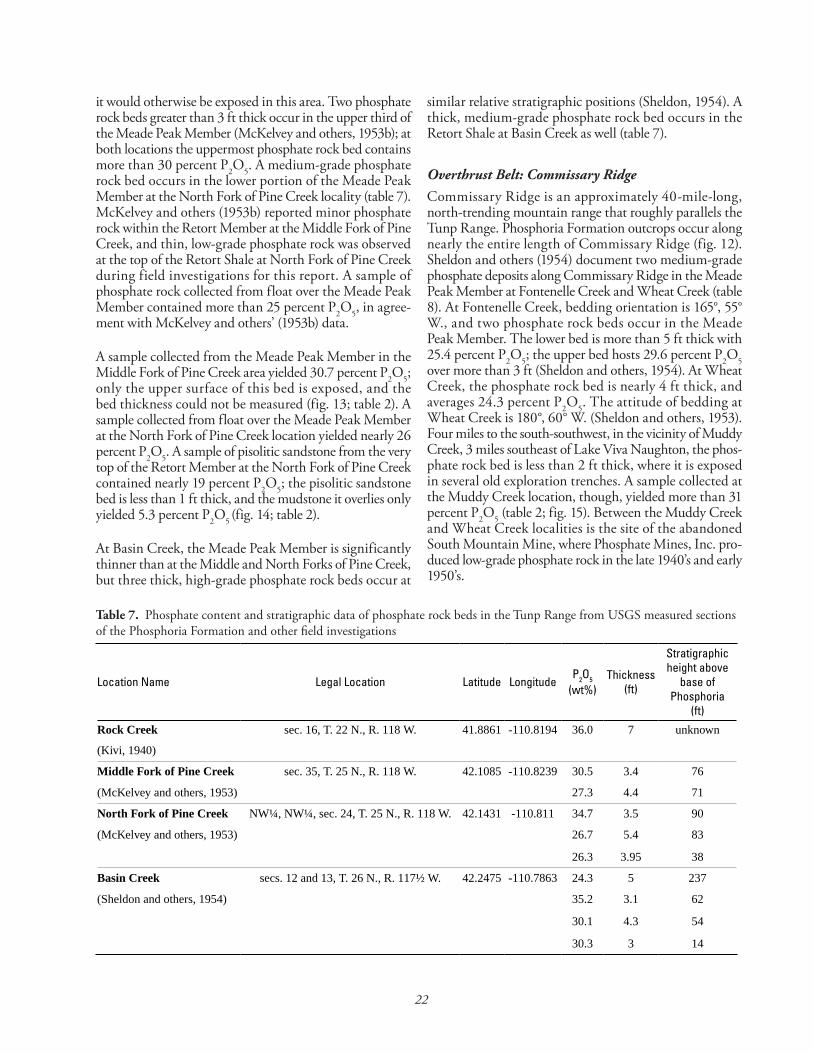
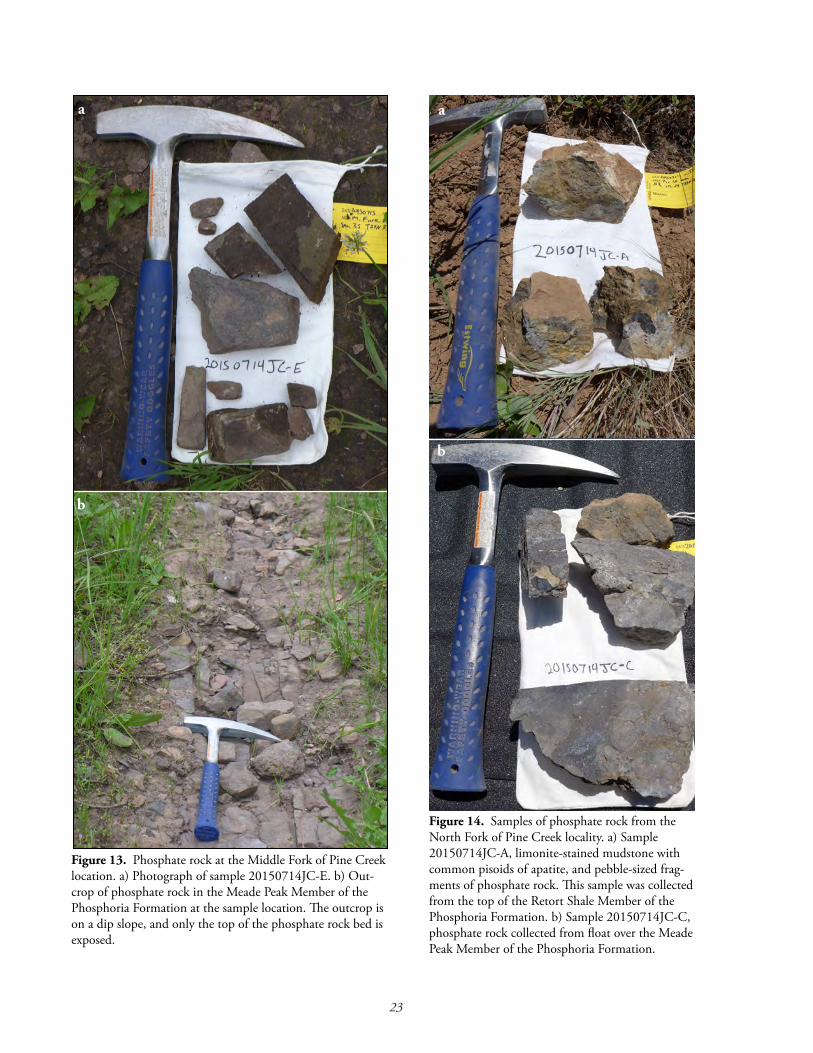
A sample collected from the Meade Peak Member in the Middle Fork of Pine Creek area yielded 30 .7 percent P2O5; only the upper surface of this bed is exposed, and the bed thickness could not be measured (fig . 13; table 2) . A sample collected from float over the Meade Peak Member at the North Fork of Pine Creek location yielded nearly 26 percent P2O5 . A sample of pisolitic sandstone from the very top of the Retort Member at the North Fork of Pine Creek contained nearly 19 percent P2O5; the pisolitic sandstone bed is less than 1 ft thick, and the mudstone it overlies only yielded 5 .3 percent P2O5 (fig . 14; table 2) .
At Basin Creek, the Meade Peak Member is significantly thinner than at the Middle and North Forks of Pine Creek, but three thick, high-grade phosphate rock beds occur at
similar relative stratigraphic positions (Sheldon, 1954) . A thick, medium-grade phosphate rock bed occurs in the Retort Shale at Basin Creek as well (table 7) .
Overthrust Belt: Commissary RidgeCommissary Ridge is an approximately 40-mile-long, north-trending mountain range that roughly parallels the Tunp Range . Phosphoria Formation outcrops occur along nearly the entire length of Commissary Ridge (fig . 12) . Sheldon and others (1954) document two medium-grade phosphate deposits along Commissary Ridge in the Meade Peak Member at Fontenelle Creek and Wheat Creek (table 8) . At Fontenelle Creek, bedding orientation is 165°, 55° W ., and two phosphate rock beds occur in the Meade Peak Member . The lower bed is more than 5 ft thick with 25 .4 percent P2O5; the upper bed hosts 29 .6 percent P2O5 over more than 3 ft (Sheldon and others, 1954) . At Wheat Creek, the phosphate rock bed is nearly 4 ft thick, and averages 24 .3 percent P2O5 . The attitude of bedding at Wheat Creek is 180°, 60° W . (Sheldon and others, 1953) . Four miles to the south-southwest, in the vicinity of Muddy Creek, 3 miles southeast of Lake Viva Naughton, the phos-phate rock bed is less than 2 ft thick, where it is exposed in several old exploration trenches . A sample collected at the Muddy Creek location, though, yielded more than 31 percent P2O5 (table 2; fig . 15) . Between the Muddy Creek and Wheat Creek localities is the site of the abandoned South Mountain Mine, where Phosphate Mines, Inc . pro-duced low-grade phosphate rock in the late 1940’s and early 1950’s .
Location Name Legal Location Latitude LongitudeP2O5
(wt%)Thickness
(ft)
Stratigraphic height above
base of Phosphoria
(ft)
Rock Creek sec. 16, T. 22 N., R. 118 W. 41.8861 -110.8194 36.0 7 unknown
(Kivi, 1940)
Middle Fork of Pine Creek sec. 35, T. 25 N., R. 118 W. 42.1085 -110.8239 30.5 3.4 76
(McKelvey and others, 1953) 27.3 4.4 71
North Fork of Pine Creek NW¼, NW¼, sec. 24, T. 25 N., R. 118 W. 42.1431 -110.811 34.7 3.5 90
(McKelvey and others, 1953) 26.7 5.4 83
26.3 3.95 38
Basin Creek secs. 12 and 13, T. 26 N., R. 117½ W. 42.2475 -110.7863 24.3 5 237
(Sheldon and others, 1954) 35.2 3.1 62
30.1 4.3 54
30.3 3 14
Table 7. Phosphate content and stratigraphic data of phosphate rock beds in the Tunp Range from USGS measured sections of the Phosphoria Formation and other field investigations
23
Figure 13. Phosphate rock at the Middle Fork of Pine Creek location . a) Photograph of sample 20150714JC-E . b) Out-crop of phosphate rock in the Meade Peak Member of the Phosphoria Formation at the sample location . The outcrop is on a dip slope, and only the top of the phosphate rock bed is exposed .
a
b
Figure 14. Samples of phosphate rock from the North Fork of Pine Creek locality . a) Sample 20150714JC-A, limonite-stained mudstone with common pisoids of apatite, and pebble-sized frag-ments of phosphate rock . This sample was collected from the top of the Retort Shale Member of the Phosphoria Formation . b) Sample 20150714JC-C, phosphate rock collected from float over the Meade Peak Member of the Phosphoria Formation .
a
b
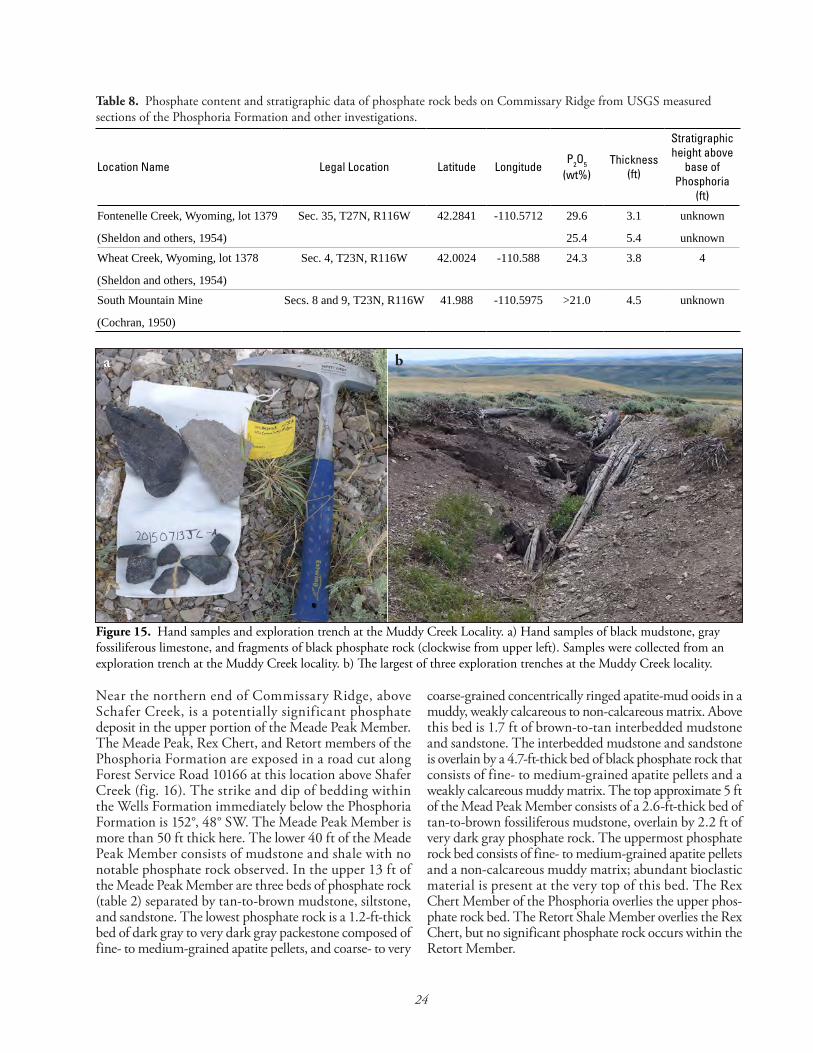
24
Near the northern end of Commissary Ridge, above Schafer Creek, is a potentially significant phosphate deposit in the upper portion of the Meade Peak Member . The Meade Peak, Rex Chert, and Retort members of the Phosphoria Formation are exposed in a road cut along Forest Service Road 10166 at this location above Shafer Creek (fig . 16) . The strike and dip of bedding within the Wells Formation immediately below the Phosphoria Formation is 152°, 48° SW . The Meade Peak Member is more than 50 ft thick here . The lower 40 ft of the Meade Peak Member consists of mudstone and shale with no notable phosphate rock observed . In the upper 13 ft of the Meade Peak Member are three beds of phosphate rock (table 2) separated by tan-to-brown mudstone, siltstone, and sandstone . The lowest phosphate rock is a 1 .2-ft-thick bed of dark gray to very dark gray packestone composed of fine- to medium-grained apatite pellets, and coarse- to very
coarse-grained concentrically ringed apatite-mud ooids in a muddy, weakly calcareous to non-calcareous matrix . Above this bed is 1 .7 ft of brown-to-tan interbedded mudstone and sandstone . The interbedded mudstone and sandstone is overlain by a 4 .7-ft-thick bed of black phosphate rock that consists of fine- to medium-grained apatite pellets and a weakly calcareous muddy matrix . The top approximate 5 ft of the Mead Peak Member consists of a 2 .6-ft-thick bed of tan-to-brown fossiliferous mudstone, overlain by 2 .2 ft of very dark gray phosphate rock . The uppermost phosphate rock bed consists of fine- to medium-grained apatite pellets and a non-calcareous muddy matrix; abundant bioclastic material is present at the very top of this bed . The Rex Chert Member of the Phosphoria overlies the upper phos-phate rock bed . The Retort Shale Member overlies the Rex Chert, but no significant phosphate rock occurs within the Retort Member .
Location Name Legal Location Latitude LongitudeP2O5
(wt%)Thickness
(ft)
Stratigraphic height above
base of Phosphoria
(ft)
Fontenelle Creek, Wyoming, lot 1379 Sec. 35, T27N, R116W 42.2841 -110.5712 29.6 3.1 unknown
(Sheldon and others, 1954) 25.4 5.4 unknown
Wheat Creek, Wyoming, lot 1378 Sec. 4, T23N, R116W 42.0024 -110.588 24.3 3.8 4
(Sheldon and others, 1954)
South Mountain Mine Secs. 8 and 9, T23N, R116W 41.988 -110.5975 >21.0 4.5 unknown
(Cochran, 1950)
Table 8. Phosphate content and stratigraphic data of phosphate rock beds on Commissary Ridge from USGS measured sections of the Phosphoria Formation and other investigations .
Figure 15. Hand samples and exploration trench at the Muddy Creek Locality . a) Hand samples of black mudstone, gray fossiliferous limestone, and fragments of black phosphate rock (clockwise from upper left) . Samples were collected from an exploration trench at the Muddy Creek locality . b) The largest of three exploration trenches at the Muddy Creek locality .
a b
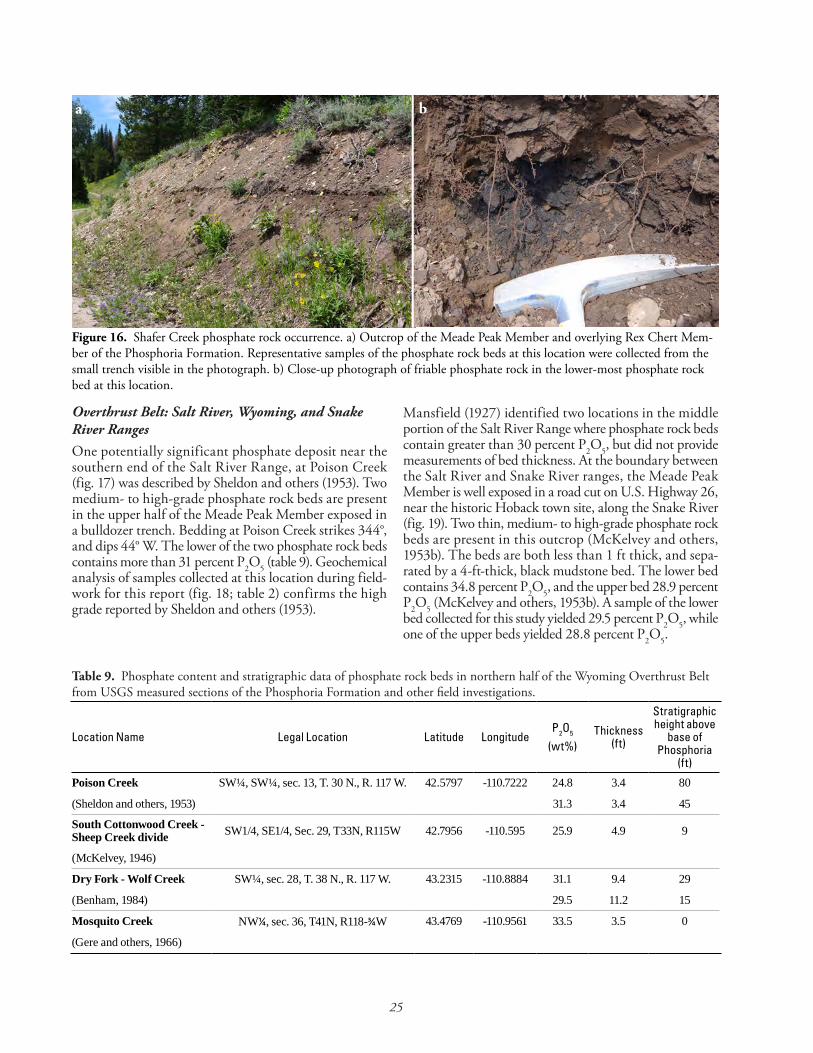
25
Overthrust Belt: Salt River, Wyoming, and Snake River RangesOne potentially significant phosphate deposit near the southern end of the Salt River Range, at Poison Creek (fig . 17) was described by Sheldon and others (1953) . Two medium- to high-grade phosphate rock beds are present in the upper half of the Meade Peak Member exposed in a bulldozer trench . Bedding at Poison Creek strikes 344°, and dips 44° W . The lower of the two phosphate rock beds contains more than 31 percent P2O5 (table 9) . Geochemical analysis of samples collected at this location during field-work for this report (fig . 18; table 2) confirms the high grade reported by Sheldon and others (1953) .
Mansfield (1927) identified two locations in the middle portion of the Salt River Range where phosphate rock beds contain greater than 30 percent P2O5, but did not provide measurements of bed thickness . At the boundary between the Salt River and Snake River ranges, the Meade Peak Member is well exposed in a road cut on U .S . Highway 26, near the historic Hoback town site, along the Snake River (fig . 19) . Two thin, medium- to high-grade phosphate rock beds are present in this outcrop (McKelvey and others, 1953b) . The beds are both less than 1 ft thick, and sepa-rated by a 4-ft-thick, black mudstone bed . The lower bed contains 34 .8 percent P2O5, and the upper bed 28 .9 percent P2O5 (McKelvey and others, 1953b) . A sample of the lower bed collected for this study yielded 29 .5 percent P2O5, while one of the upper beds yielded 28 .8 percent P2O5 .
Figure 16. Shafer Creek phosphate rock occurrence . a) Outcrop of the Meade Peak Member and overlying Rex Chert Mem-ber of the Phosphoria Formation . Representative samples of the phosphate rock beds at this location were collected from the small trench visible in the photograph . b) Close-up photograph of friable phosphate rock in the lower-most phosphate rock bed at this location .
a b
Location Name Legal Location Latitude LongitudeP2O5
(wt%)Thickness
(ft)
Stratigraphic height above
base of Phosphoria
(ft)
Poison Creek SW¼, SW¼, sec. 13, T. 30 N., R. 117 W. 42.5797 -110.7222 24.8 3.4 80
(Sheldon and others, 1953) 31.3 3.4 45
South Cottonwood Creek - Sheep Creek divide SW1/4, SE1/4, Sec. 29, T33N, R115W 42.7956 -110.595 25.9 4.9 9
(McKelvey, 1946)
Dry Fork - Wolf Creek SW¼, sec. 28, T. 38 N., R. 117 W. 43.2315 -110.8884 31.1 9.4 29
(Benham, 1984) 29.5 11.2 15
Mosquito Creek NW¼, sec. 36, T41N, R118-¾W 43.4769 -110.9561 33.5 3.5 0
(Gere and others, 1966)
Table 9. Phosphate content and stratigraphic data of phosphate rock beds in northern half of the Wyoming Overthrust Belt from USGS measured sections of the Phosphoria Formation and other field investigations .
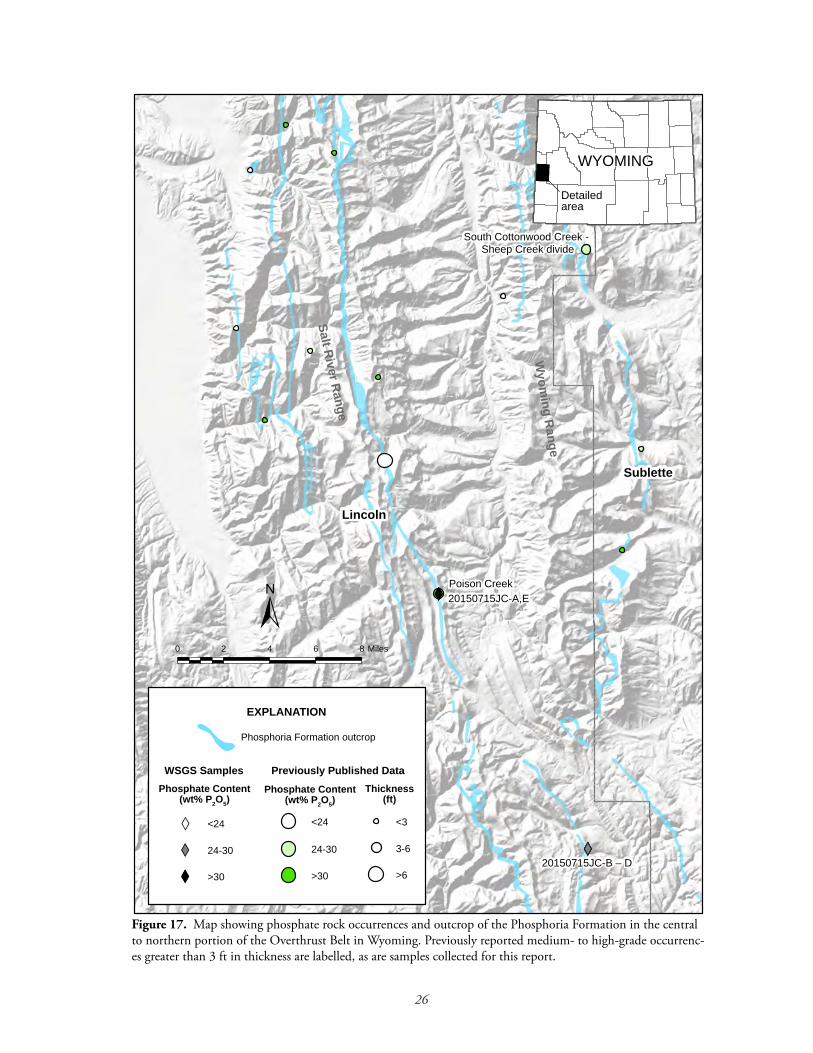
26
Poison Creek
South Cottonwood Creek - Sheep Creek divide
XW
XWXWXW
XW 20150715JC-A,E
20150715JC-B – D
Lincoln
Sublette
WYOMING
Detailed area
0 2 4 6 8 Miles
±
WSGS Samples Previously Published DataPhosphate Content
(wt% P2O5)
<24
24-30
>30
Phosphate Content(wt% P2O5)
<24
24-30
>30
Thickness(ft)
<3
3-6
>6
EXPLANATION
Phosphoria Formation outcrop
Salt River R
ange
Wyom
ing Range
XW
XW
XW
Figure 17. Map showing phosphate rock occurrences and outcrop of the Phosphoria Formation in the central to northern portion of the Overthrust Belt in Wyoming . Previously reported medium- to high-grade occurrenc-es greater than 3 ft in thickness are labelled, as are samples collected for this report .
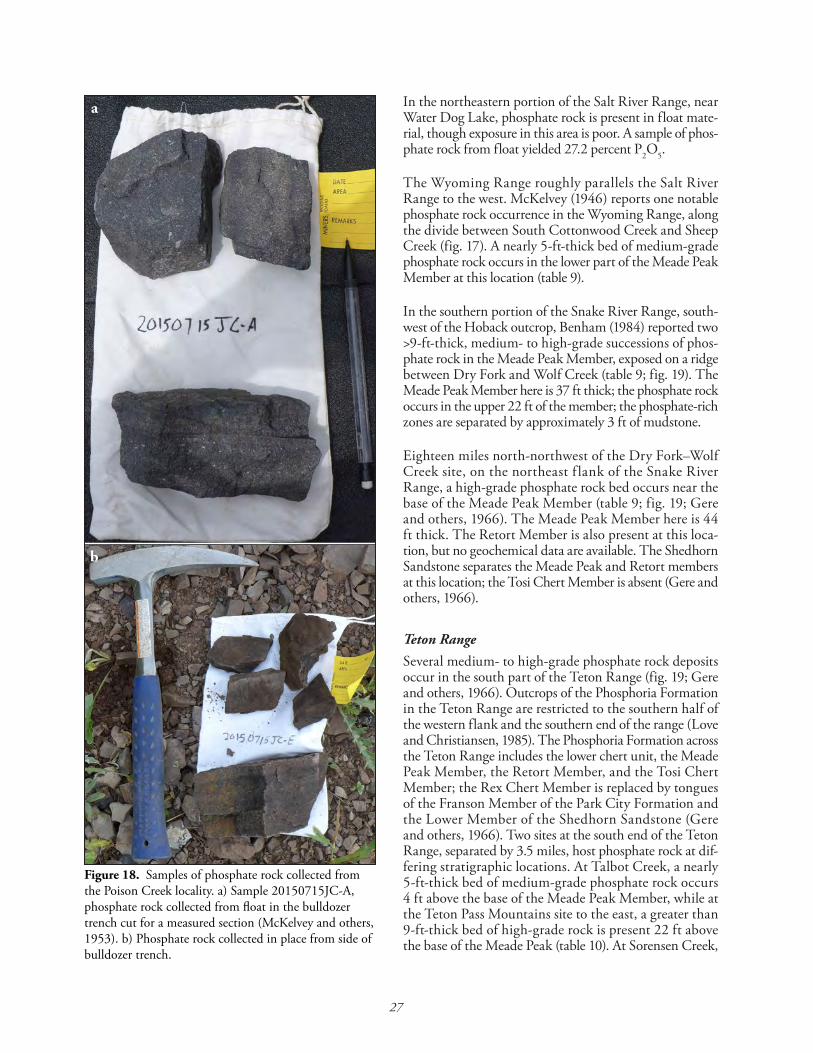
27
In the northeastern portion of the Salt River Range, near Water Dog Lake, phosphate rock is present in float mate-rial, though exposure in this area is poor . A sample of phos-phate rock from float yielded 27 .2 percent P2O5 .
The Wyoming Range roughly parallels the Salt River Range to the west . McKelvey (1946) reports one notable phosphate rock occurrence in the Wyoming Range, along the divide between South Cottonwood Creek and Sheep Creek (fig . 17) . A nearly 5-ft-thick bed of medium-grade phosphate rock occurs in the lower part of the Meade Peak Member at this location (table 9) .
In the southern portion of the Snake River Range, south-west of the Hoback outcrop, Benham (1984) reported two >9-ft-thick, medium- to high-grade successions of phos-phate rock in the Meade Peak Member, exposed on a ridge between Dry Fork and Wolf Creek (table 9; fig . 19) . The Meade Peak Member here is 37 ft thick; the phosphate rock occurs in the upper 22 ft of the member; the phosphate-rich zones are separated by approximately 3 ft of mudstone .
Eighteen miles north-northwest of the Dry Fork–Wolf Creek site, on the northeast f lank of the Snake River Range, a high-grade phosphate rock bed occurs near the base of the Meade Peak Member (table 9; fig . 19; Gere and others, 1966) . The Meade Peak Member here is 44 ft thick . The Retort Member is also present at this loca-tion, but no geochemical data are available . The Shedhorn Sandstone separates the Meade Peak and Retort members at this location; the Tosi Chert Member is absent (Gere and others, 1966) .
Teton RangeSeveral medium- to high-grade phosphate rock deposits occur in the south part of the Teton Range (fig . 19; Gere and others, 1966) . Outcrops of the Phosphoria Formation in the Teton Range are restricted to the southern half of the western flank and the southern end of the range (Love and Christiansen, 1985) . The Phosphoria Formation across the Teton Range includes the lower chert unit, the Meade Peak Member, the Retort Member, and the Tosi Chert Member; the Rex Chert Member is replaced by tongues of the Franson Member of the Park City Formation and the Lower Member of the Shedhorn Sandstone (Gere and others, 1966) . Two sites at the south end of the Teton Range, separated by 3 .5 miles, host phosphate rock at dif-fering stratigraphic locations . At Talbot Creek, a nearly 5-ft-thick bed of medium-grade phosphate rock occurs 4 ft above the base of the Meade Peak Member, while at the Teton Pass Mountains site to the east, a greater than 9-ft-thick bed of high-grade rock is present 22 ft above the base of the Meade Peak (table 10) . At Sorensen Creek,
Figure 18. Samples of phosphate rock collected from the Poison Creek locality . a) Sample 20150715JC-A, phosphate rock collected from float in the bulldozer trench cut for a measured section (McKelvey and others, 1953) . b) Phosphate rock collected in place from side of bulldozer trench .
a
b
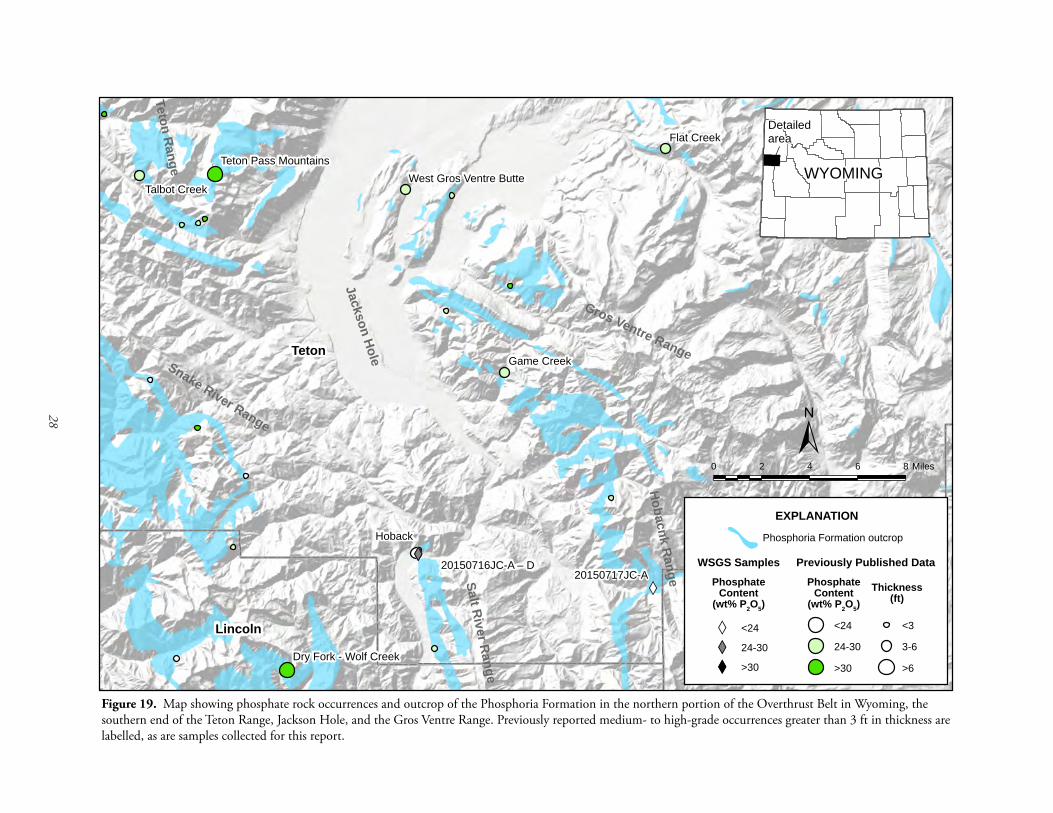
28
Teton Pass Mountains
Dry Fork - Wolf Creek
Hoback
Game Creek
Flat Creek
Talbot CreekWest Gros Ventre Butte
XWXWXW
XW20150717JC-A
20150716JC-A – D
Teton
Lincoln Sublette
WYOMING
Detailed area
0 2 4 6 8 Miles±
EXPLANATION
Phosphoria Formation outcrop
WSGS Samples
PhosphateContent
(wt% P2O5)
Previously Published Data
Thickness(ft)
<3
3-6
>6
PhosphateContent
(wt% P2O5)
<24
24-30
>30
Salt River R
ange
Snake River Range
Teton Range
Jackson Hole
Gros Ventre Range
Hobacnk R
ange
<24XW24-30XW>30XW
Figure 19. Map showing phosphate rock occurrences and outcrop of the Phosphoria Formation in the northern portion of the Overthrust Belt in Wyoming, the southern end of the Teton Range, Jackson Hole, and the Gros Ventre Range . Previously reported medium- to high-grade occurrences greater than 3 ft in thickness are labelled, as are samples collected for this report .
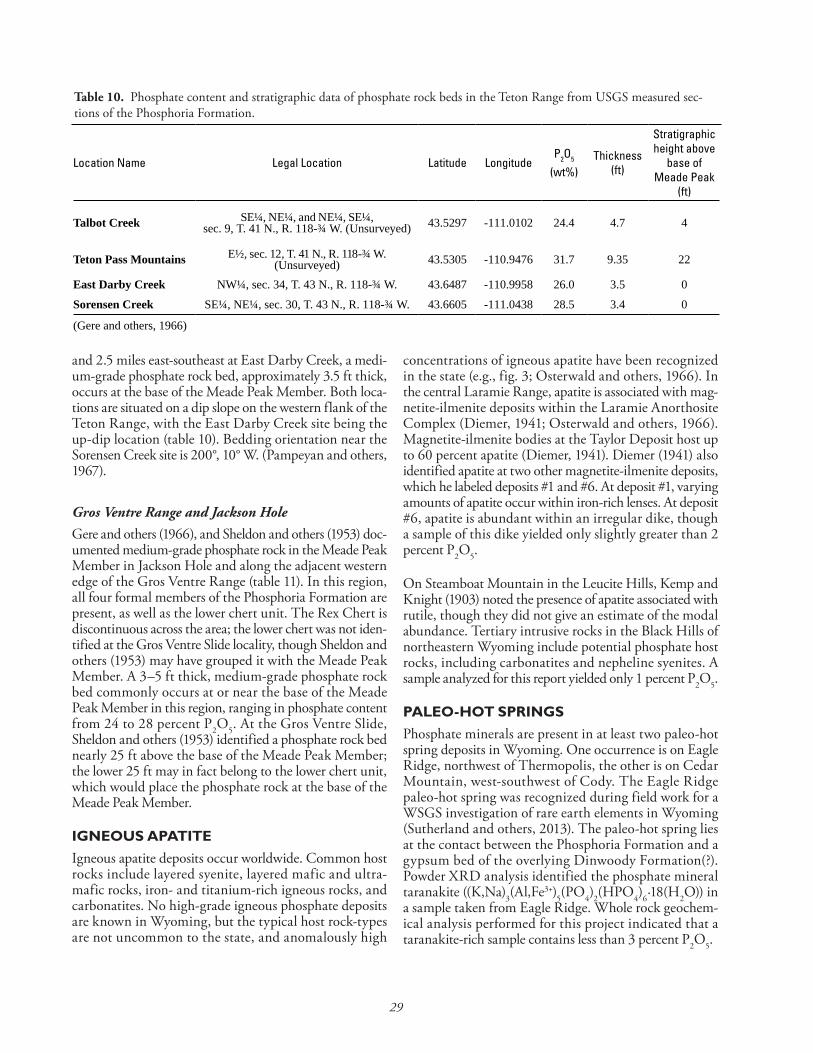
29
and 2 .5 miles east-southeast at East Darby Creek, a medi-um-grade phosphate rock bed, approximately 3 .5 ft thick, occurs at the base of the Meade Peak Member . Both loca-tions are situated on a dip slope on the western flank of the Teton Range, with the East Darby Creek site being the up-dip location (table 10) . Bedding orientation near the Sorensen Creek site is 200°, 10° W . (Pampeyan and others, 1967) .
Gros Ventre Range and Jackson HoleGere and others (1966), and Sheldon and others (1953) doc-umented medium-grade phosphate rock in the Meade Peak Member in Jackson Hole and along the adjacent western edge of the Gros Ventre Range (table 11) . In this region, all four formal members of the Phosphoria Formation are present, as well as the lower chert unit . The Rex Chert is discontinuous across the area; the lower chert was not iden-tified at the Gros Ventre Slide locality, though Sheldon and others (1953) may have grouped it with the Meade Peak Member . A 3–5 ft thick, medium-grade phosphate rock bed commonly occurs at or near the base of the Meade Peak Member in this region, ranging in phosphate content from 24 to 28 percent P2O5 . At the Gros Ventre Slide, Sheldon and others (1953) identified a phosphate rock bed nearly 25 ft above the base of the Meade Peak Member; the lower 25 ft may in fact belong to the lower chert unit, which would place the phosphate rock at the base of the Meade Peak Member .
IGNEOUS APATITEIgneous apatite deposits occur worldwide . Common host rocks include layered syenite, layered mafic and ultra-mafic rocks, iron- and titanium-rich igneous rocks, and carbonatites . No high-grade igneous phosphate deposits are known in Wyoming, but the typical host rock-types are not uncommon to the state, and anomalously high
concentrations of igneous apatite have been recognized in the state (e .g ., fig . 3; Osterwald and others, 1966) . In the central Laramie Range, apatite is associated with mag-netite-ilmenite deposits within the Laramie Anorthosite Complex (Diemer, 1941; Osterwald and others, 1966) . Magnetite-ilmenite bodies at the Taylor Deposit host up to 60 percent apatite (Diemer, 1941) . Diemer (1941) also identified apatite at two other magnetite-ilmenite deposits, which he labeled deposits #1 and #6 . At deposit #1, varying amounts of apatite occur within iron-rich lenses . At deposit #6, apatite is abundant within an irregular dike, though a sample of this dike yielded only slightly greater than 2 percent P2O5 .
On Steamboat Mountain in the Leucite Hills, Kemp and Knight (1903) noted the presence of apatite associated with rutile, though they did not give an estimate of the modal abundance . Tertiary intrusive rocks in the Black Hills of northeastern Wyoming include potential phosphate host rocks, including carbonatites and nepheline syenites . A sample analyzed for this report yielded only 1 percent P2O5 .
PALEO-HOT SPRINGSPhosphate minerals are present in at least two paleo-hot spring deposits in Wyoming . One occurrence is on Eagle Ridge, northwest of Thermopolis, the other is on Cedar Mountain, west-southwest of Cody . The Eagle Ridge paleo-hot spring was recognized during field work for a WSGS investigation of rare earth elements in Wyoming (Sutherland and others, 2013) . The paleo-hot spring lies at the contact between the Phosphoria Formation and a gypsum bed of the overlying Dinwoody Formation(?) . Powder XRD analysis identified the phosphate mineral taranakite ((K,Na)3(Al,Fe3+)5(PO4)2(HPO4)6·18(H2O)) in a sample taken from Eagle Ridge . Whole rock geochem-ical analysis performed for this project indicated that a taranakite-rich sample contains less than 3 percent P2O5 .
Location Name Legal Location Latitude LongitudeP2O5
(wt%)Thickness
(ft)
Stratigraphic height above
base of Meade Peak
(ft)
Talbot Creek SE¼, NE¼, and NE¼, SE¼, sec. 9, T. 41 N., R. 118-¾ W. (Unsurveyed) 43.5297 -111.0102 24.4 4.7 4
Teton Pass Mountains E½, sec. 12, T. 41 N., R. 118-¾ W. (Unsurveyed) 43.5305 -110.9476 31.7 9.35 22
East Darby Creek NW¼, sec. 34, T. 43 N., R. 118-¾ W. 43.6487 -110.9958 26.0 3.5 0
Sorensen Creek SE¼, NE¼, sec. 30, T. 43 N., R. 118-¾ W. 43.6605 -111.0438 28.5 3.4 0
(Gere and others, 1966)
Table 10. Phosphate content and stratigraphic data of phosphate rock beds in the Teton Range from USGS measured sec-tions of the Phosphoria Formation .
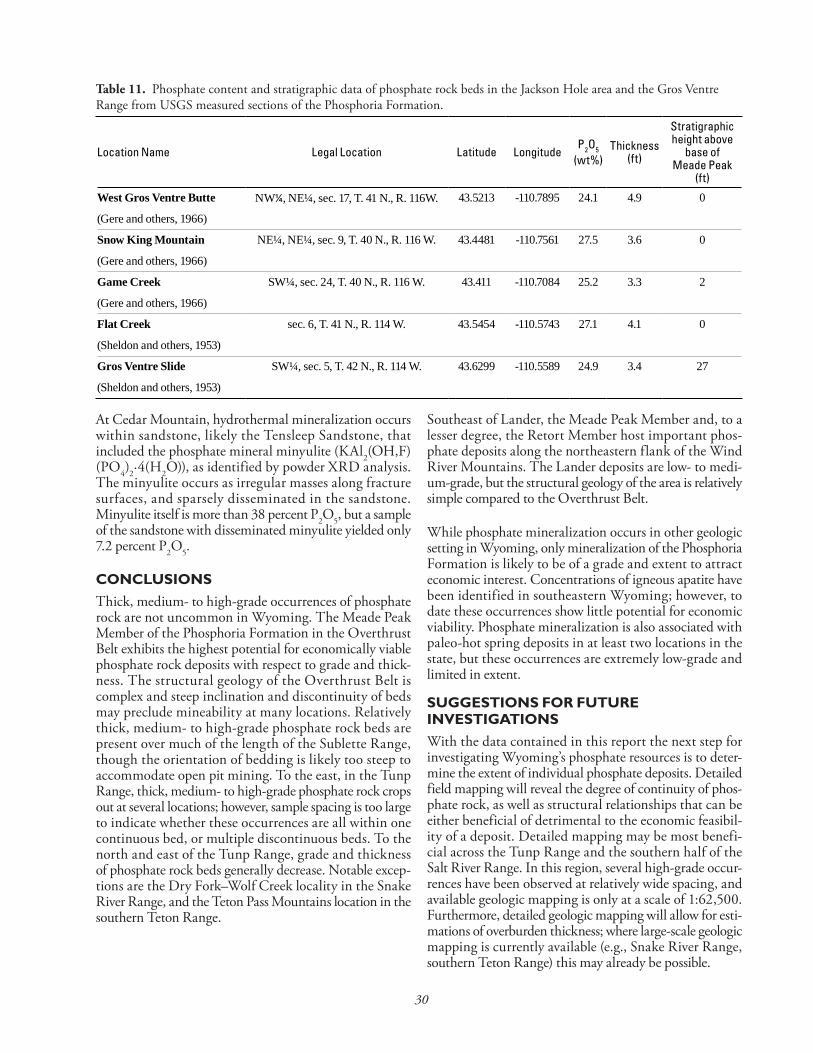
30
At Cedar Mountain, hydrothermal mineralization occurs within sandstone, likely the Tensleep Sandstone, that included the phosphate mineral minyulite (KAl2(OH,F)(PO4)2·4(H2O)), as identified by powder XRD analysis . The minyulite occurs as irregular masses along fracture surfaces, and sparsely disseminated in the sandstone . Minyulite itself is more than 38 percent P2O5, but a sample of the sandstone with disseminated minyulite yielded only 7 .2 percent P2O5 .
CONCLUSIONSThick, medium- to high-grade occurrences of phosphate rock are not uncommon in Wyoming . The Meade Peak Member of the Phosphoria Formation in the Overthrust Belt exhibits the highest potential for economically viable phosphate rock deposits with respect to grade and thick-ness . The structural geology of the Overthrust Belt is complex and steep inclination and discontinuity of beds may preclude mineability at many locations . Relatively thick, medium- to high-grade phosphate rock beds are present over much of the length of the Sublette Range, though the orientation of bedding is likely too steep to accommodate open pit mining . To the east, in the Tunp Range, thick, medium- to high-grade phosphate rock crops out at several locations; however, sample spacing is too large to indicate whether these occurrences are all within one continuous bed, or multiple discontinuous beds . To the north and east of the Tunp Range, grade and thickness of phosphate rock beds generally decrease . Notable excep-tions are the Dry Fork–Wolf Creek locality in the Snake River Range, and the Teton Pass Mountains location in the southern Teton Range .
Southeast of Lander, the Meade Peak Member and, to a lesser degree, the Retort Member host important phos-phate deposits along the northeastern flank of the Wind River Mountains . The Lander deposits are low- to medi-um-grade, but the structural geology of the area is relatively simple compared to the Overthrust Belt .
While phosphate mineralization occurs in other geologic setting in Wyoming, only mineralization of the Phosphoria Formation is likely to be of a grade and extent to attract economic interest . Concentrations of igneous apatite have been identified in southeastern Wyoming; however, to date these occurrences show little potential for economic viability . Phosphate mineralization is also associated with paleo-hot spring deposits in at least two locations in the state, but these occurrences are extremely low-grade and limited in extent .
SUGGESTIONS FOR FUTUREINVESTIGATIONSWith the data contained in this report the next step for investigating Wyoming’s phosphate resources is to deter-mine the extent of individual phosphate deposits . Detailed field mapping will reveal the degree of continuity of phos-phate rock, as well as structural relationships that can be either beneficial of detrimental to the economic feasibil-ity of a deposit . Detailed mapping may be most benefi-cial across the Tunp Range and the southern half of the Salt River Range . In this region, several high-grade occur-rences have been observed at relatively wide spacing, and available geologic mapping is only at a scale of 1:62,500 . Furthermore, detailed geologic mapping will allow for esti-mations of overburden thickness; where large-scale geologic mapping is currently available (e .g ., Snake River Range, southern Teton Range) this may already be possible .
Location Name Legal Location Latitude LongitudeP2O5
(wt%)Thickness
(ft)
Stratigraphic height above
base of Meade Peak
(ft)
West Gros Ventre Butte NW¼, NE¼, sec. 17, T. 41 N., R. 116W. 43.5213 -110.7895 24.1 4.9 0
(Gere and others, 1966)
Snow King Mountain NE¼, NE¼, sec. 9, T. 40 N., R. 116 W. 43.4481 -110.7561 27.5 3.6 0
(Gere and others, 1966)
Game Creek SW¼, sec. 24, T. 40 N., R. 116 W. 43.411 -110.7084 25.2 3.3 2
(Gere and others, 1966)
Flat Creek sec. 6, T. 41 N., R. 114 W. 43.5454 -110.5743 27.1 4.1 0
(Sheldon and others, 1953)
Gros Ventre Slide SW¼, sec. 5, T. 42 N., R. 114 W. 43.6299 -110.5589 24.9 3.4 27
(Sheldon and others, 1953)
Table 11. Phosphate content and stratigraphic data of phosphate rock beds in the Jackson Hole area and the Gros Ventre Range from USGS measured sections of the Phosphoria Formation .
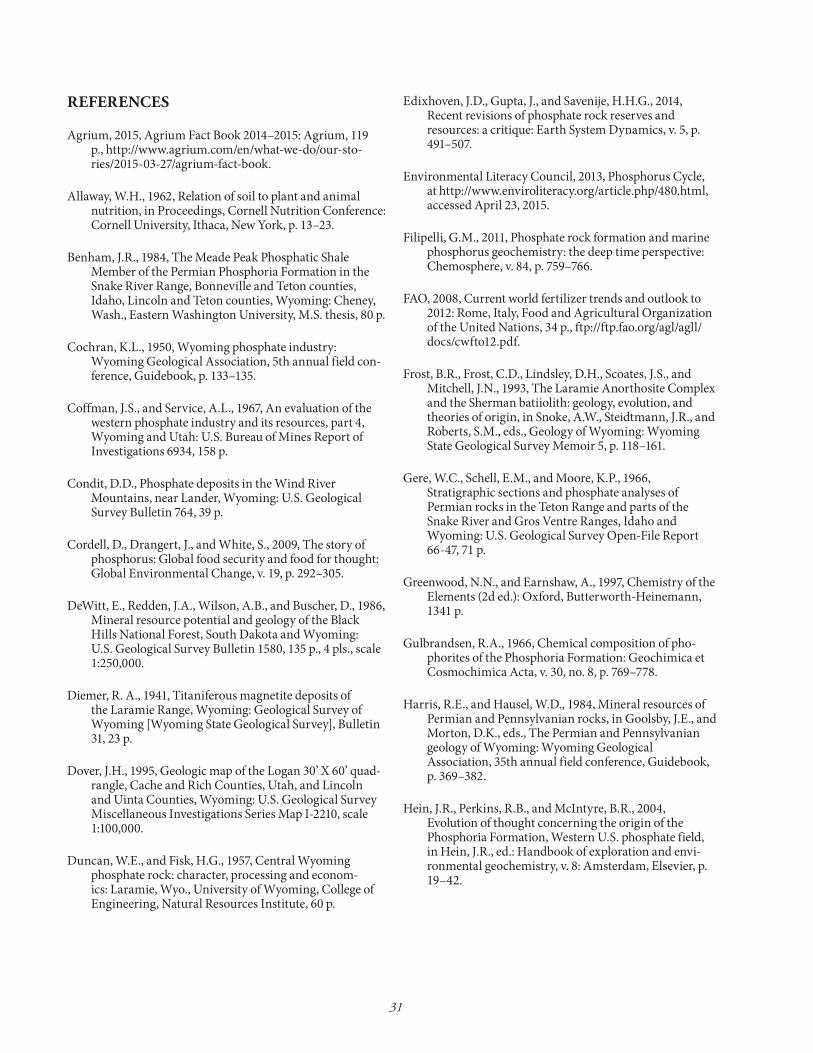
31
REFERENCES
Agrium, 2015, Agrium Fact Book 2014–2015: Agrium, 119 p., http://www.agrium.com/en/what-we-do/our-sto-ries/2015-03-27/agrium-fact-book.
Allaway, W.H., 1962, Relation of soil to plant and animal nutrition, in Proceedings, Cornell Nutrition Conference: Cornell University, Ithaca, New York, p. 13–23.
Benham, J.R., 1984, The Meade Peak Phosphatic Shale Member of the Permian Phosphoria Formation in the Snake River Range, Bonneville and Teton counties, Idaho, Lincoln and Teton counties, Wyoming: Cheney, Wash., Eastern Washington University, M.S. thesis, 80 p.
Cochran, K.L., 1950, Wyoming phosphate industry: Wyoming Geological Association, 5th annual field con-ference, Guidebook, p. 133–135.
Coffman, J.S., and Service, A.L., 1967, An evaluation of the western phosphate industry and its resources, part 4, Wyoming and Utah: U.S. Bureau of Mines Report of Investigations 6934, 158 p.
Condit, D.D., Phosphate deposits in the Wind River Mountains, near Lander, Wyoming: U.S. Geological Survey Bulletin 764, 39 p.
Cordell, D., Drangert, J., and White, S., 2009, The story of phosphorus: Global food security and food for thought: Global Environmental Change, v. 19, p. 292–305.
DeWitt, E., Redden, J.A., Wilson, A.B., and Buscher, D., 1986, Mineral resource potential and geology of the Black Hills National Forest, South Dakota and Wyoming: U.S. Geological Survey Bulletin 1580, 135 p., 4 pls., scale 1:250,000.
Diemer, R. A., 1941, Titaniferous magnetite deposits of the Laramie Range, Wyoming: Geological Survey of Wyoming [Wyoming State Geological Survey], Bulletin 31, 23 p.
Dover, J.H., 1995, Geologic map of the Logan 30’ X 60’ quad-rangle, Cache and Rich Counties, Utah, and Lincoln and Uinta Counties, Wyoming: U.S. Geological Survey Miscellaneous Investigations Series Map I-2210, scale 1:100,000.
Duncan, W.E., and Fisk, H.G., 1957, Central Wyoming phosphate rock: character, processing and econom-ics: Laramie, Wyo., University of Wyoming, College of Engineering, Natural Resources Institute, 60 p.
Edixhoven, J.D., Gupta, J., and Savenije, H.H.G., 2014, Recent revisions of phosphate rock reserves and resources: a critique: Earth System Dynamics, v. 5, p. 491–507.
Environmental Literacy Council, 2013, Phosphorus Cycle, at http://www.enviroliteracy.org/article.php/480.html, accessed April 23, 2015.
Filipelli, G.M., 2011, Phosphate rock formation and marine phosphorus geochemistry: the deep time perspective: Chemosphere, v. 84, p. 759–766.
FAO, 2008, Current world fertilizer trends and outlook to 2012: Rome, Italy, Food and Agricultural Organization of the United Nations, 34 p., ftp://ftp.fao.org/agl/agll/docs/cwfto12.pdf.
Frost, B.R., Frost, C.D., Lindsley, D.H., Scoates, J.S., and Mitchell, J.N., 1993, The Laramie Anorthosite Complex and the Sherman batiiolith: geology, evolution, and theories of origin, in Snoke, A.W., Steidtmann, J.R., and Roberts, S.M., eds., Geology of Wyoming: Wyoming State Geological Survey Memoir 5, p. 118–161.
Gere, W.C., Schell, E.M., and Moore, K.P., 1966, Stratigraphic sections and phosphate analyses of Permian rocks in the Teton Range and parts of the Snake River and Gros Ventre Ranges, Idaho and Wyoming: U.S. Geological Survey Open-File Report 66-47, 71 p.
Greenwood, N.N., and Earnshaw, A., 1997, Chemistry of the Elements (2d ed.): Oxford, Butterworth-Heinemann, 1341 p.
Gulbrandsen, R.A., 1966, Chemical composition of pho-phorites of the Phosphoria Formation: Geochimica et Cosmochimica Acta, v. 30, no. 8, p. 769–778.
Harris, R.E., and Hausel, W.D., 1984, Mineral resources of Permian and Pennsylvanian rocks, in Goolsby, J.E., and Morton, D.K., eds., The Permian and Pennsylvanian geology of Wyoming: Wyoming Geological Association, 35th annual field conference, Guidebook, p. 369–382.
Hein, J.R., Perkins, R.B., and McIntyre, B.R., 2004, Evolution of thought concerning the origin of the Phosphoria Formation, Western U.S. phosphate field, in Hein, J.R., ed.: Handbook of exploration and envi-ronmental geochemistry, v. 8: Amsterdam, Elsevier, p. 19–42.
32
Hertzog, E.S., 1935, A study of the occurrence and amena-bility to leaching of the phosphorus compounds in some red iron ores of Alabama: U.S. Bureau of Mines Reports of Investigations 3294, 9 p.
Hiatt, E.E., and Budd, D.A., 2003, Extreme paleoceano-graphic conditions in Paleozoic oceanic upwelling system: organic productivity and widespread phos-phogenesis in the Permian Phosphoria Sea: Geological Society of America Special Paper 370, 20 p.
IndexMundi, 2015, Rock Phosphate Monthly Price - US dollars per metric ton, at http://www.index-mundi.com/commodities/?commodity=rock-phos-phate&months=240, accessed September 9, 2015.
Infomine, 2015, Historical phosphate rock prices and price chart, at http://www.infomine.com/investment/met-al-prices/phosphate-rock/all/, accessed March 11, 2015.
Isherwood, K.F., 2000, Mineral fertilizer use and the environment: Paris, International Fertilizer Industry Association, 51 p.
Jasinski, S.M., 2015, Phosphate rock, in Mineral commodity summaries 2015: U.S. Geological Survey, p. 118–119.
Jasinski, S.M., 2014, Phosphate rock, in Mineral commodity summaries 2014: U.S. Geological Survey, p. 118–119.
Jasinski, S.M., 2011, Phosphate rock, in Mineral commodity summaries 2011: U.S. Geological Survey, p. 118–119.
Jasinski, S.M., Lee, W.H., and Causey, J.D., 2004, The history of the Western Phosphate Field, in Hein, J.R., ed., Life cycle of the Phosphoria Formation: Handbook of Exploration and Environmental Geochemistry, v. 8: Amsterdam, Elsevier, p. 45–61.
Johnson, J.F., and Sutherland, W.M., 2009, Geologic map of the Lander 30’ x 60’ Quadrangle: Wyoming State Geological Survey Map Series 87, scale 1:100,000.
J.R. Simplot Company, 2008a, Simplot Phosphates, LLC, 2 p., www.simplot.com/pdf/us_operations/Phosphates.pdf.
J.R. Simplot Company, 2008b, Smoky Canyon mine, Afton, Wyoming, 2 p., www.simplot.com/pdf/us_operations/SmokyCanyon.pdf.
Kazakov, A.V., 1937, The phosphorite facies and the genesis of phosphorites, in Geological investigations of agri-cultural ores: Transactions of the Science Institute of Fertilizers and Insecto-Fungicides 142 (publication for the 17th session of the International Geological Congress, Leningrad), p. 95–113.
Kazakov, A.V., 1938, The phosphorite facies and the genesis of natural phosphorites: Sovetskaya Geologiya, 8, p. 33–47.
Kemp, J.F., and Knight, W.C., 1903, The Leucite Hills of Wyoming: Geological Society of America Bulletin, v. 14, p. 305–336.
Ketner, K.B., 2009, Mid-Permian Phosphoria Sea in Nevada and the upwelling model: United States Geological Survey Professional Paper 1764, 21 p.
King, D.L., 1949, Surface strip phosphate mining at Leefe, Wyoming, and Montpelier, Idaho, in Norris, E.M., ed., Symposium on western phosphate mining: Mining Transactions, v. 184, p. 284–287.
King, D.L., 1967, San Francisco Chemical Co. Crawford Mountain – Leefe area, Utah and Wyoming, in Hale, L.E., ed., Anatomy of the Western Phosphate Field: a guide to the geologic occurrence, exploration methods, mining engineering, and recovery technology: Intermountain Association of Geologists 15th Annual Field Conference, p. 203–209.
King, R.H., 1947, Phosphate deposits near Lander, Wyoming: Wyoming State Geological Survey [Geological Survey of Wyoming] Bulletin 39, 84 p.
King, W.H., and Schumacher, J.I, 1949, Investigation of the Lander phosphate rock deposits, Fremont County, Wyo.: U.S. Bureau of Mines Report of Investigations 4437, 12 p.
Kivi, W.J., 1940, The stratigraphy of the Phosphoria Formation of western Wyoming, with notes on the occurrence of phosphate: Laramie, Wyo., University of Wyoming, M.A. thesis, 59 p.
Liu, Y., Villalba, R., Ayers, R.U., and Schroder, H., 2008, Global phosphorus flows and environmental impacts from a consumption perspective: Journal of Industrial Ecology, v. 12, no. 2, p. 229–247.
Love, J.D., 1964, Uraniferous phosphatic lake beds of Eocene age in intermontane basins of Wyoming and Utah: U.S. Geological Survey Professional Paper 474-E, 66 p.
Love, J.D., and Christiansen, A.C., 1985, Geologic map of Wyoming: U.S. Geological Survey (Wyoming State Geological Survey release 2014), 3 pls, scale 1:500,000.
Mansfield, G.R., 1927, Geography, geology, and mineral resources of part of southeastern Idaho: U.S. Geological Survey Professional Paper 152, 453 p.

33
Maughan, E.K., 1984, Geological setting and some geo-chemistry of petroleum source rocks in the Permian Phosphoria Formation, in Woodward, J., Meissner, F.F., and Clayton, J.L., eds., Hydrocarbon source rocks of the Greater Rocky Mountain region: Denver, Colo., Rocky Mountain Association of Geologists, p. 281–294.
McKelvey, V.E., 1946, Preliminary report on stratigraphy of the phosphatic shale member of the Phosphoria formation in Western Wyoming, southeastern Idaho, and northern Utah: U.S. Geological Survey Open-File Report 47-2, 162 p.
McKelvey, V.E., Williams, J. S., Sheldon, R. P., Cressman, E. R., Cheney, T. M., and Swanson, R. W., 1959, The Phosphoria, Park City, and Shedhorn Formations in Western Phosphate Field: U.S. Geological Survey Professional Paper 313-A, 47 p.
McKelvey, V.E., Cathcart, J.B., Altschuler, Z.S., Swanson, R.W., Lutz, K., 1953a, Domestic phosphate deposits: U.S. Geological Survey Open-File Report 53-165, 49 p.
McKelvey, V.E., Smith, L.E., Hoppin, R.A., and Armstrong, F.C., 1953b, Stratigraphic sections of the Phosphoria Formation in Wyoming, 1947-48: U.S. Geologic Survey Circular 210, 35 p.
Monsanto, 2014, 2014 annual report, 100 p., http://www.monsanto.com/investors/Documents/Annual%20Report/2014/2014_Monsanto_AnnualReport.pdf.
Moyle, P.R., and Piper, D.Z., 2004, Western phosphate field—depositional and economic deposit models, in Hein, J.R., ed.: Handbook of exploration and environ-mental geochemistry, v. 8: Amsterdam, Elsevier, p. 575–593.
Ozanne, P.G., 1980, Phosphate nutrition of plants – a general treatise, in Khasawneh, F.E., Sample, E.C., and Kamprath, E. J. eds., The Role of Phosphorus in Agriculture: Madison, Wis., American Society of Agronomy, Crop Science Society of America, Soil Science Society of America, p. 559–590.
Osterwald, F.W., Osterwald, D.B., Long, L.S., Jr., and Wilson, W.H., (revised by Wilson), 1966, Mineral resources of Wyoming: Geological Survey of Wyoming [Wyoming State Geological Survey] Bulletin 50, 287 p.
Pampeyan, E.H., Schroeder, M.L., Schell, E.M., and Cressman, E.R., 1967, Geologic map of the Driggs quadrangle, Bonneville and Teton Counties, Idaho, and Teton County, Wyoming: U.S. Geological Survey Mineral Investigations Field Studies Map MF-300, scale 1:31,680.
Perkins, Robert B., McIntyre, B., Hein, J.R., Piper, D.Z., 2003, Geochemistry of Permian rocks from the margins of the Phosphoria Basin: Lakeridge core, western Wyoming: U.S. Geological Survey Open-File Report 03-21, 65 p.
Reid, R.L., 1980, Relationship between phosphorus nutrition of plants and the phosphorus nutrition of animals and man, in Khasawneh, F.E., Sample, E.C., and Kamprath, E. J. eds., The Role of Phosphorus in Agriculture: Madison, Wis., American Society of Agronomy, Crop Science Society of America, Soil Science Society of America, p. 847–886.
Rubey, W.W., Oriel, S.S., and Tracey, J.I., 1980, Geologic map and structure sections of the Cokeville 30-minute quadrangle, Lincoln and Sublette Counties, Wyoming: U.S. Geological Survey Miscellaneous Investigations Series Map I-1129, scale 1:62,500.
Sheldon, R.P., 1989, Phosphorite deposits of the Phosphoria Formation, western United States, in Notholt, A.J.G., Sheldon, R.P., and Davidson, D.F., eds., Phosphate Deposits of the World, v. 2: Cambridge, Cambridge University Press, p. 53–61.
Sheldon, R.P., 1963, Physical stratigraphy and mineral resources of Permian rocks in western Wyoming: U.S. Geological Survey Professional Paper 313-B, p. 49–273.
Sheldon, R.P., Cressman, E.R., Carson, L.D., and Smart, R.A., 1954, Stratigraphic sections of the Phosphoria Formation in Wyoming, 1952: U.S. Geological Survey Circular 325, 24 p.
Sheldon, R.P., Waring, R.G., Warner, M.A., and Smart, R.A., 1953, Stratigraphic sections of the Phosphoria Formation in Wyoming, 1949–50: U.S. Geological Survey Trace Elements Investigations 363, 52 p.
Simons, F.S., Love, J.D., Keefer, W.R., Harwood, D.S., Kulik, D.M, and Bieniewski, C.L., 1988, Mineral resources of the Gros Ventre Wilderness Study Area, Teton and Sublette counties, Wyoming: U.S. Geological Survey Bulletin 1591, 65 p.
Sutherland, W.M., Gregory, R.W., Carnes, J.D., and Worman, B.W., 2013, Rare earth elements in Wyoming: Wyoming State Geological Survey Report of Investigations 65, 82 p.
Threlfall, R.E., 1951, The story of 100 years of phosphorus making: 1851–1951: Oldbury, England, Albright & Wilson, 400 p.
34
Tilman, D., Cassman, K.G., Matson, P.A., Naylor, R., Polasky, S., 2002, Agricultural sustainability and inten-sive production practices: Nature, v. 418, p. 671–677.
Tisoncik, D.D., 1984, Regional lithostratigraphy of the Phosphoria Formation in the Overthrust Belt of Wyoming, Utah, and Idaho, in Woodward, J., Meissner, F.F., Clayton, J.L., eds., Hydrocarbon source rocks of the Greater Rocky Mountain Region: Denver, Colo., Rocky Mountain Association of Geologists, p. 295–320.
Underwood, E.J., and Suttle, E.J., 1999, The mineral nutri-tion of livestock, 3d edition: Wallingford, UK, CAB International, 614 p.
United Nations Department of Economic and Social Affairs, 2004, World population to 2300: United Nations Publications, v. 236, 240 p.
Van Kauwenbergh, S.J., 2010, World Phosphate Rock Reserves and Resources: Muscle Shoals, Ala., International Fertilizer Development Center (IFDC), 48 p.
Van Vuuren, D.P., Bouwman, A.F., and Beusen, A.H.W., 2010, Phosphorus demand for the 1970–2100 period: A scenario analysis of resource depletion: Global Environmental Change, v. 20, p. 428–439.
Viccari, D.A., and Strigul, N., 2011, Extrapolating phos-phorus production to estimate resource reserves: Chemosphere, v. 84, p. 792–797.
Wardlaw, B.R., 1999, Notes from the SPS chair: Permofiles, no. 35, p. 1–4.
Wardlaw, B.R., Snyder, W.S., Spinosa, C., and Gallegos, D.M., 1995, Permian of the western United States, in Scholle, P.A., Peryt, T.M., and Ulmer-Scholler, D.S. eds., The Permian of northern Pangea 2: Sedimentary basins and economic resources: Berlin, Germany, Springer-Verlag, p. 23–40.
Wyoming Department of Revenue, 1973–1978, Annual report: Cheyenne, Wyoming.
Wyoming State Board of Equalization, 1926–1972, Biennial report: Cheyenne, Wyoming.
Interpreting the past , providing for the future


![polk.wateratlas.usf.edu · Phosphorus by SW-846 9056 [REF) (S) List Phosphorus 130 mg/Kg Ortho Phosphate, SW-846 9056 [REF] (S) List Ortho Phosphate Total Nitrogen List Total Nitrogen](https://cdn.vdocuments.net/doc/165x107/5f16a72204c3330bc5713c64/polk-phosphorus-by-sw-846-9056-ref-s-list-phosphorus-130-mgkg-ortho-phosphate.jpg)