
Pinellas County
Coastal Management Program
Andy Squires
Coastal Resources [email protected]
Department of Public Works
Division of
Environmental Management

Topics
• Why Nourish Our Beaches
• County Managed Beaches
• Nourishment History
• Ongoing/Upcoming Projects
• Funding

Why Nourish Our Beaches

Most Important Reason!
1. Storm Protection
– Saves Lives
– Upland
Infrastructure
– Property

STORM PROTECTION!
Clearwater, September 1985
Clearwater, June 2011

STORM PROTECTION!
Indian Rocks Beach
September 1985
Indian Rocks Beach
June 2011

STORM PROTECTION!
North Redington
Beach
September 1985
North Redington
Beach
Post Fill 1999

1993
2006
Same View
Morgan Street
Belleair Beach

Economic Benefits!
2. Pinellas County Tourism (Data Research Services,
Inc. . Analysis for 2009)
– 74.2% of Visitors Come for the Beaches
– $2.8 Billion - Total Economic Impact
– Over 35,800 - Jobs Supported
– $88.4 Million - State & Local Taxes Paid

Another Reason to
Nourish Our Beaches…
3. Environmental
Benefits
- Habitat• Marine Turtles
• Shorebirds

County
Managed
Beaches
• Honeymoon Island
• Sand Key
• Treasure Island
– Sunshine Beach
– Sunset Beach
• Long Key
– Upham Beach
– Pass-A-Grille Beach
• Mullet Key (Ft. DeSoto Park)
Old Tampa Bay
LONG KEY
SAND
KEY
TREASURE ISLAND
FT DESOTO
HONEYMOON
ISLAND
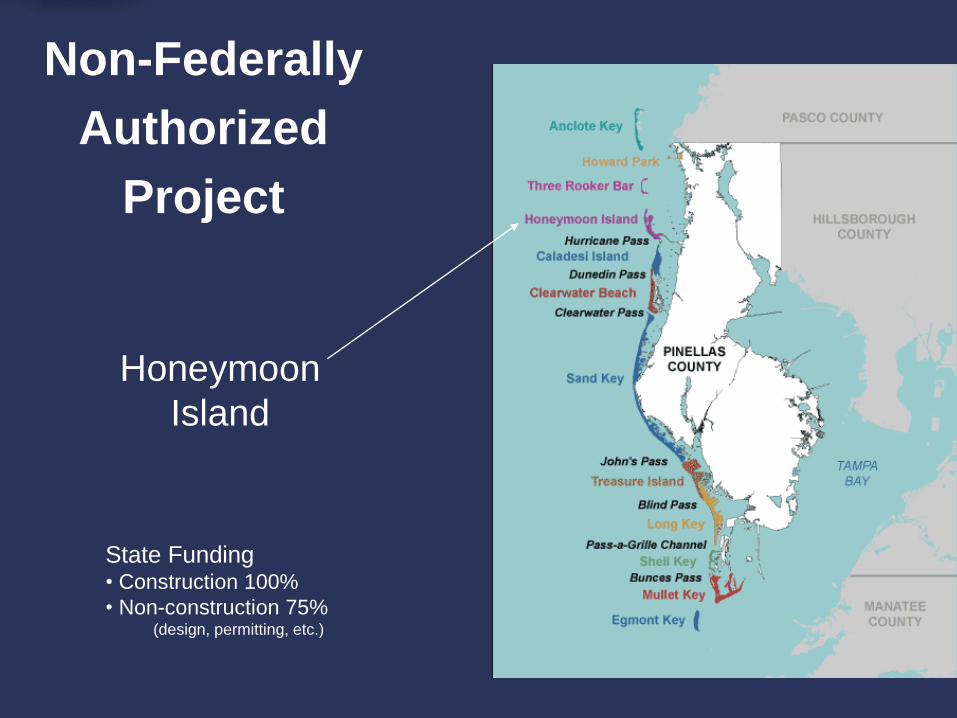
Non-Federally
Authorized
Project
Honeymoon
Island
State Funding • Construction 100%
• Non-construction 75%(design, permitting, etc.)

GULF OF
MEXICO
HONEYM
OON
ISLAND
PHOTO DATE: 2010
PHOTO PROPERTY
OF PINELLAS
COUNTY
HURRICANE
PASS
N0 150
300
Honeymoon Island
Nourishment History • 1921 Hurricane Created Hurricane Pass
• 1969 Beach Fill, 1.3 million yds3
4000’ of shoreline, used offshore Borrow Area
with limestone gravel and rock
• 1989-1990 Nourishment, 230,000 yds3
From Hurricane Pass Maintenance Dredging
• 2000 Nourishment, 12,500 yds3
Sand from Hurricane Pass Maintenance
Dredging
• 2007 Nourishment, 140,000 yds3
Sand from Hurricane Pass Ebb Shoal
• 2015 Nourishment, 162,890 yds3
Sand from Hurricane Pass Ebb Shoal

Honeymoon Island Phase I & II
BEACH FILL TEMPLATE
REQUIRES APPROXIMATELY
(100,000 CY)
T-GROIN 4
T-GROIN 3
T-GROIN 2
EXISTING T-GROIN 1
CONSTRUCTED UNDER
DEP PERMIT 0249602-001-
JC
PHOTO DATE: 2010
PHOTO PROPERTY OF
PINELLAS COUNTY
HONEYMOON
ISLAND
HURRICANE PASS
HONEYMOON ISLAND BEACH RESTORATION PROJECT – PHASES I & IIP
HA
SE
II
PH
AS
E
I
EASEMENT-BORROW
AREA (PROPOSED)
PHASE II
BORROW
AREA
GULF
OF
MEXIC
O
N0 150 300
Current Nourishment Interval = 3 Years

Federally
Authorized
Projects
Sand Key
Treasure Island
Long Key
Funding
60% Federal
20% State
20% County

Federally Authorized
Sand Key Projects
1988-2012
1988300,000 yds3, $2.6 M
19901,300,000 yds3, $14.5 M
1992850,000yds3, $11.7 M
1998-992,612,166, $24 M
20061,700,000 yds3, $45 M
20121.25 yds3, $31.5 M

2012
Sand Key
Nourishment
$31.5 million1.25 million cubic yards
Sand Sources
(Not Shown on Map)
1. Egmont Shoals (N of Egmont Key)
2. Area “L” (11+ mi W of Sand Key)
Belleair Shore
No Fill

Sand Key Nourishments
Prior to Federal Authorization
• 1969: Indian Rocks Beach, 5,500 feet of shoreline
- Federal Disaster Assistance ($856,000;
143,000 cubic yards)
• 1973: Indian Rocks Beach, post Hurricane Agnes
- Federal Disaster Assistance ($1,667,600)
• 1974: Beach Disposal from Clearwater Pass
Dredging
- USACE (126,000 cubic yards)
• 1977: Beach Disposal from Clearwater Pass
Dredging
- USACE (186,000 cubic yards)
• 1982-83: Northern Sand Key, Beach Disposal
- Clearwater’s Program, Inlet Improvement for
Bridge Stability (600,000 cubic yards)
• 1985: Redington Shores from Dredging John’s Pass
- USACE/Pinellas County (60,000 cubic yards)

2012
Sand Key
Nourishment
First Sand
Placement
Dan’s Island
May 15, 2012
Belleair Shore
No Fill
Dan’s Island
May 16, 2012
Dan’s Island
May 16, 2012
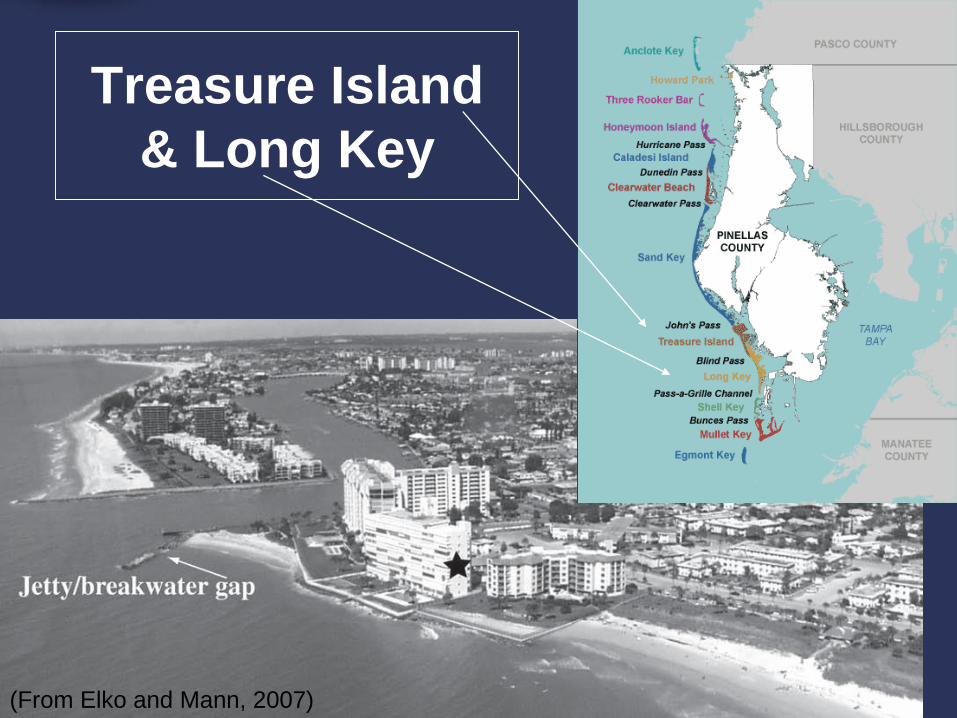
Treasure Island
& Long Key
(From Elko and Mann, 2007)

Treasure Island
Nourishment History Date / Volume (yds3) / Sand Source / Length
• 1969 / 790,000 / Offshore borrow area / 0.8 mi
• 1971 / 75,000 / O’Brien’s Lagoon / 0.2 mi
• 1972 / 155,000 / Blind Pass / 0.2 mi
• 1976 / 380,000 / Offshore borrow area / 1.4 mi
• 1978 / 50,000 / Blind Pass / Southern Treasure Island
• 1981 / 70,000 / John’s Pass / 0.6 mi
• 1983 / 220,000 / Blind Pass / 0.8 mi
• 1986 / 550,000 / Blind Pass & Pass-a-Grille Channel / 2.4 mi
• 1991 / 56,000 / John’s Pass / 0.4 mi
• 1996 / 51,300 / Egmont Shoal / 0.4 mi
• 2000 / 350,000 / John’s Pass / 1.6 mi
• 2004 / 225,000 / Pass-a-Grille Channel / 1 mi
• 2006 / 110,000 / Egmont Shoal / 1.6 mi
• 2010 / 225,000 / John’s Pass / 1.6 mi
• 2014 / 300,516 / East Egmont Shoal / 1.6 mi

Upham Beach
Nourishment History
Date / Volume (yds3) / Sand Source / Length
1980 / 254,000 / Blind Pass / 0.4 mi
1986 / 98,000 / Pass-a-Grille Channel / 0.4 mi
1991 / 230,000 / Blind Pass / 0.4 mi
1996 / 253,000 / Egmont Channel Shoal / 0.4 mi
2000 / 281,000 / Blind Pass / 0.4 mi
2004 / 408,000 / Pass-a-Grille Channel / 0.7 mi
2006 / 90,000 / Egmont Channel Shoal / 0.4 mi
2010 / 160,000 / Blind Pass / 0.4 mi
2014 / 160,545 / East Egmont Shoal

2014
Treasure
Island
&
Long Key
Nourishment
~$16-17 million
520,000 cubic yards
Pass-A-Grille
Nourishment Planned
Cost Share:60%/20%/20%
(Fed/State/County)
Sand SourceEgmont Shoals
Belleair Shore
No Fill

Sunshine Beach
9-1-10
9-1-10
8-11-10
4-1-10

9-1-10 10-1-10
Sunset Beach

Upham Beach Stabilization Project
2005-06 T-Groins Installed
2006 Beach Nourished
2006-08 T-Groins Tested
2008+ T-Groins Damaged
2011 Major T-Groin Repair
September 15, 2010

Long Key / Upham Beach
August 2008October 2002

Upham Beach
Stabilization
Project
• 2014 Nourished ~2000’ of Shoreline, 156,748 yds3
• 2016 Install 4 Permanent Rock Structures
– T-Groin Construction Estimate = $8 million
• Funding 50% State / 50% County

Pass-A-Grille Beach• One-mile Long Public Beach
• Highly Erosive 1940s-50s
• Groins & Seawall Installed by 1960s
• County Management Began in 1980s
• Accreted Beach Stabilized with Sea Oats in late 1980s
• Nourishment History– 1986: (post Elena) : 73,000 yds3, Pass-A-Grille Channel
– 1991: 100,000 yds3, Blind Pass
– 2004: (post storms): 95,000 yds3, Pass-A-Grille Channe
– 2014: 140,053, East Egmont Shoal
2006
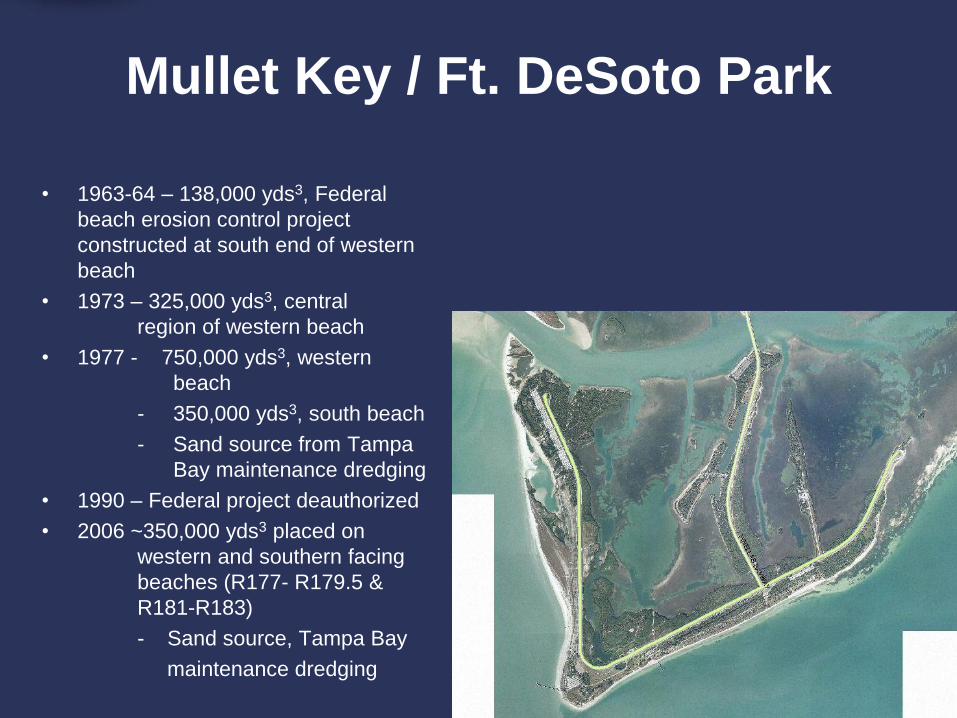
Mullet Key / Ft. DeSoto Park
• 1963-64 – 138,000 yds3, Federal
beach erosion control project
constructed at south end of western
beach
• 1973 – 325,000 yds3, central
region of western beach
• 1977 - 750,000 yds3, western
beach
- 350,000 yds3, south beach
- Sand source from Tampa
Bay maintenance dredging
• 1990 – Federal project deauthorized
• 2006 ~350,000 yds3 placed on
western and southern facing
beaches (R177- R179.5 &
R181-R183)
- Sand source, Tampa Bay
maintenance dredging

Mullet Key / Ft. DeSoto Park
2006-07 Project

Mullet Key / Ft. DeSoto Park
2006-2007 Nourishment
Before After

Coastal Management Program Funding
from
Tourist Development (Bed) Tax
One-half of Third Penny
~ $2.5-3.0 million
Annual Revenue

Summary
• Beaches Managed/Nourished – For storm protection, tourism, environment
– Honeymoon, Sand Key, Treasure Island, & St. Pete Beach, frequently nourished
(every 3-6 years)
• 2 with structural improvement projects (Honeymoon, Upham)
– Pass-A-Grille Beach nourished every 5-13 years
– Mullet Key nourished 4 times, latest in 2006-07
• Cost Sharing– State 20-100% of total costs
– Federal participation ~60% of Total Costs
• Tourist Development Tax Fund Projections– Annual revenue projections for beaches > $2.5m after FY 2012+

QUESTIONS
Andy Squires, Coastal Manager 727- 464 - 4633
e-mail: [email protected]
Web Link to Updates:www.pinellascounty.org/environment/coastalMngmt/default.htm


