
Pipelines & Flow Assurance

Jamie Littler
Technical Disciplines and Assurance Manager
Shell UK
Flow Assurance Wax Study on the Ravn Field
Production System
Wood Group Kenny: Hooman Haghighi, Jamie Littler, Fujiang Zhu,
Temitope Solanke
Wintershall: Leif H. Blidegn, Amir Mofidi
4 - www.woodgroup.com
Agenda
• Introduction to the Risks of Wax Deposition
• Fluid Tuning
• Ravn Field Overview
• Results of In-field and Export Lines
• Conclusions and Recommendations

Wax deposition risksWax is long-chain simple hydrocarbons.
• Long Chain n-paraffin
• Branched chain paraffin
• Cyclo-paraffin (Naphthene)
Wax deposition can cause:• Reduction in flow area
• Change in wall friction
• Blockage of the pipeline
These pictures are from public domain.
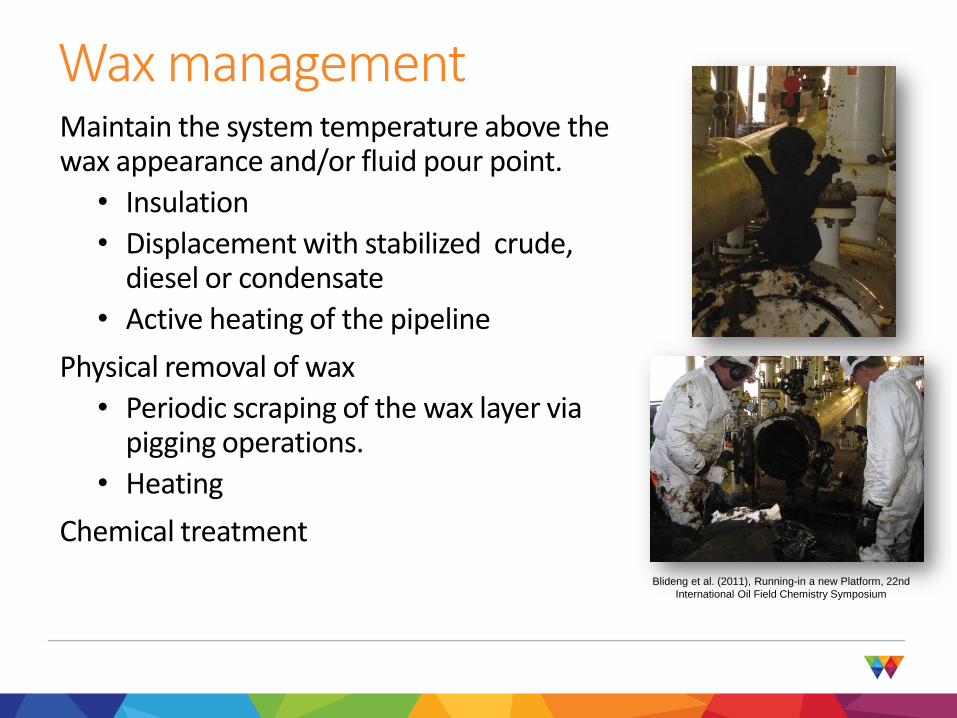
Wax managementMaintain the system temperature above the wax appearance and/or fluid pour point.
• Insulation
• Displacement with stabilized crude, diesel or condensate
• Active heating of the pipeline
Physical removal of wax
• Periodic scraping of the wax layer via pigging operations.
• Heating
Chemical treatment
Blideng et al. (2011), Running-in a new Platform, 22nd
International Oil Field Chemistry Symposium
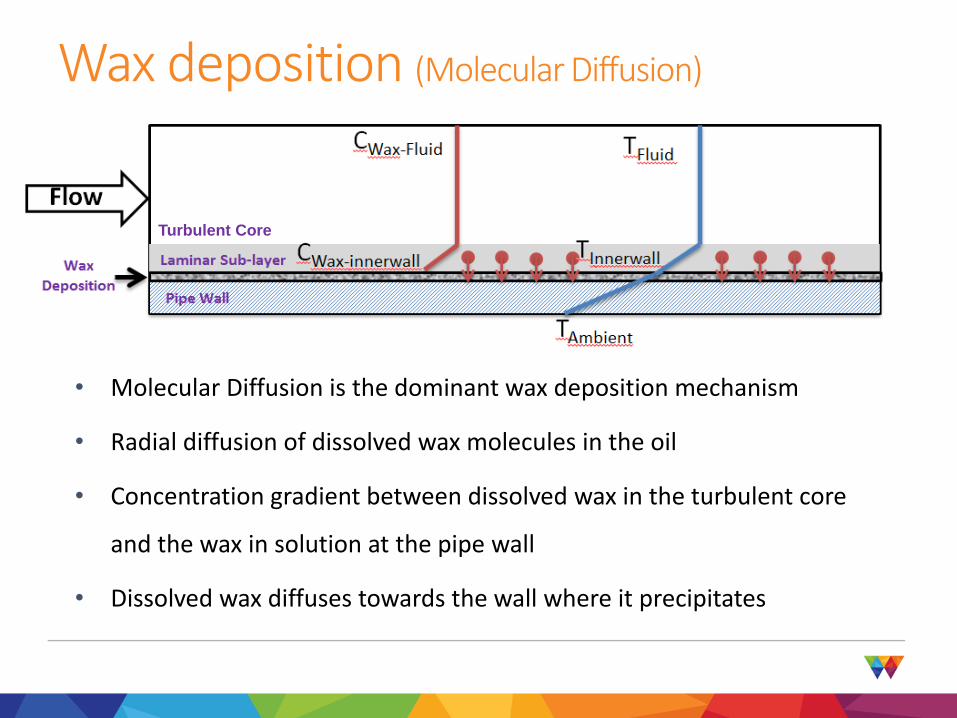
Wax deposition (Molecular Diffusion)
• Molecular Diffusion is the dominant wax deposition mechanism
• Radial diffusion of dissolved wax molecules in the oil
• Concentration gradient between dissolved wax in the turbulent core
and the wax in solution at the pipe wall
• Dissolved wax diffuses towards the wall where it precipitates
Turbulent Core
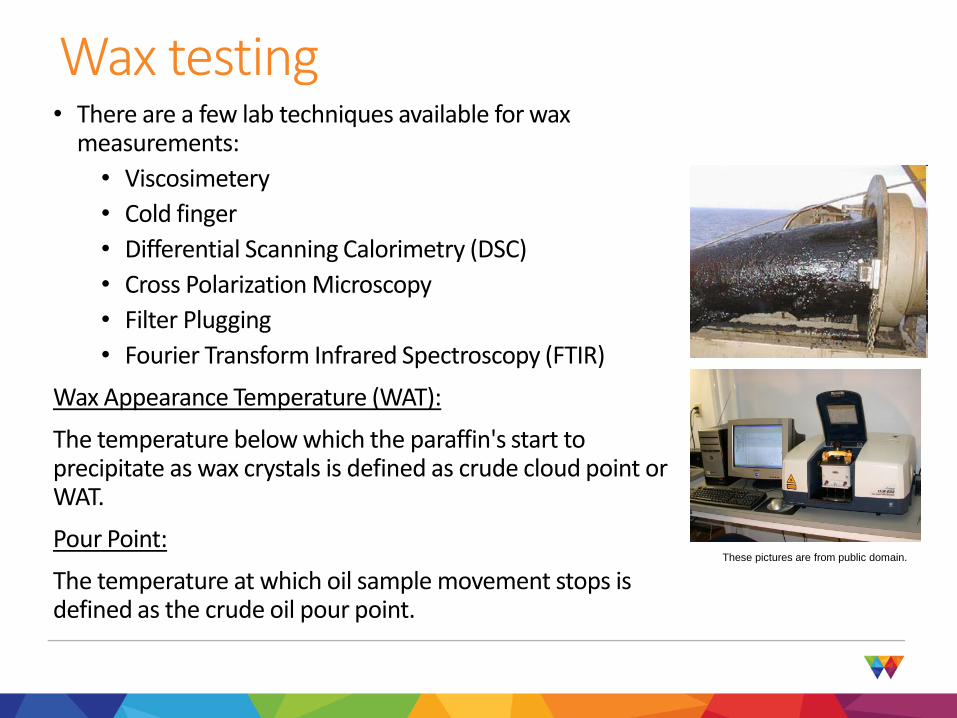
• There are a few lab techniques available for wax measurements:
• Viscosimetery
• Cold finger
• Differential Scanning Calorimetry (DSC)
• Cross Polarization Microscopy
• Filter Plugging
• Fourier Transform Infrared Spectroscopy (FTIR)
Wax Appearance Temperature (WAT):
The temperature below which the paraffin's start to precipitate as wax crystals is defined as crude cloud point or WAT.
Pour Point:
The temperature at which oil sample movement stops is defined as the crude oil pour point.
Wax testing
These pictures are from public domain.
Wax properties
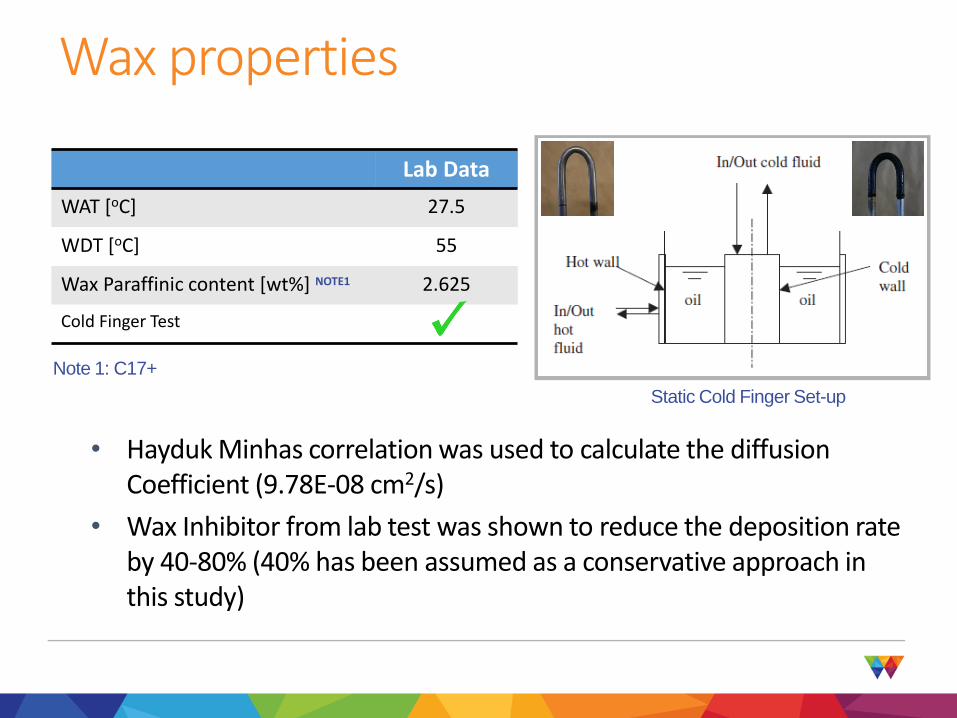
Lab Data
WAT [oC] 27.5
WDT [oC] 55
Wax Paraffinic content [wt%] NOTE1 2.625
Cold Finger Test
Note 1: C17+
Static Cold Finger Set-up
• Hayduk Minhas correlation was used to calculate the diffusion Coefficient (9.78E-08 cm2/s)
• Wax Inhibitor from lab test was shown to reduce the deposition rate by 40-80% (40% has been assumed as a conservative approach in this study)
Viscosity tuning
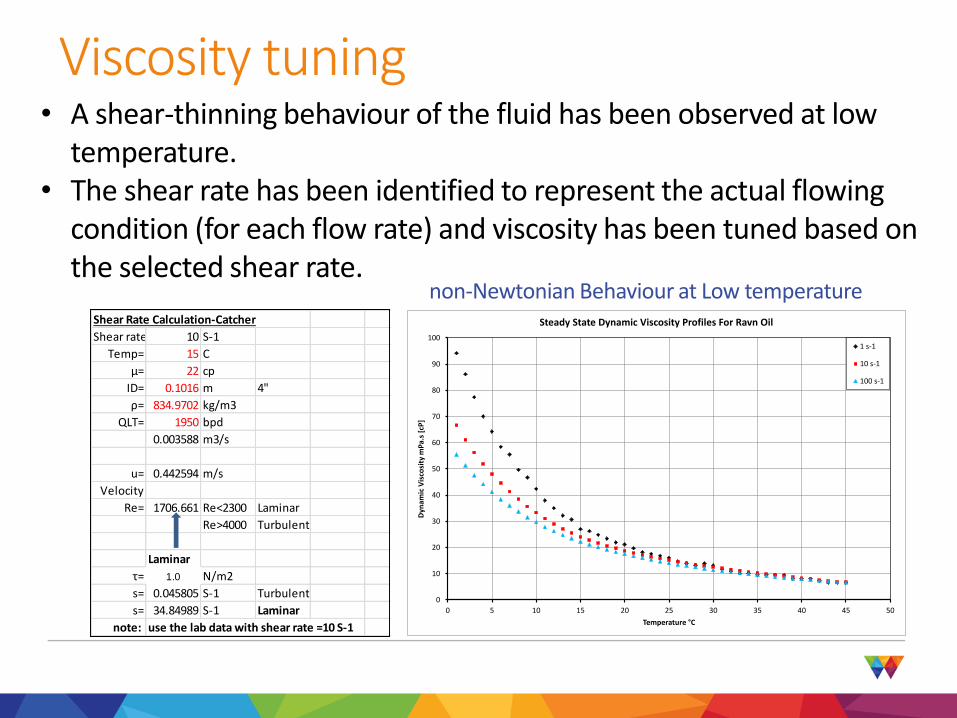
Shear Rate Calculation-Catcher
Shear rate= 10 S-1
Temp= 15 C
μ= 22 cp
ID= 0.1016 m 4"
ρ= 834.9702 kg/m3
QLT= 1950 bpd
0.003588 m3/s
u= 0.442594 m/s
Velocity
Re= 1706.661 Re<2300 Laminar
Re>4000 Turbulent
Laminar
τ= 1.0 N/m2
s= 0.045805 S-1 Turbulent
s= 34.84989 S-1 Laminar
note: use the lab data with shear rate =10 S-1
• A shear-thinning behaviour of the fluid has been observed at low temperature.
• The shear rate has been identified to represent the actual flowing condition (for each flow rate) and viscosity has been tuned based on the selected shear rate.
0
10
20
30
40
50
60
70
80
90
100
0 5 10 15 20 25 30 35 40 45 50
Dyn
amic
Vis
cosi
ty m
Pa.
s [c
P]
Temperature °C
Steady State Dynamic Viscosity Profiles For Ravn Oil
1 s-1
10 s-1
100 s-1
non-Newtonian Behaviour at Low temperature
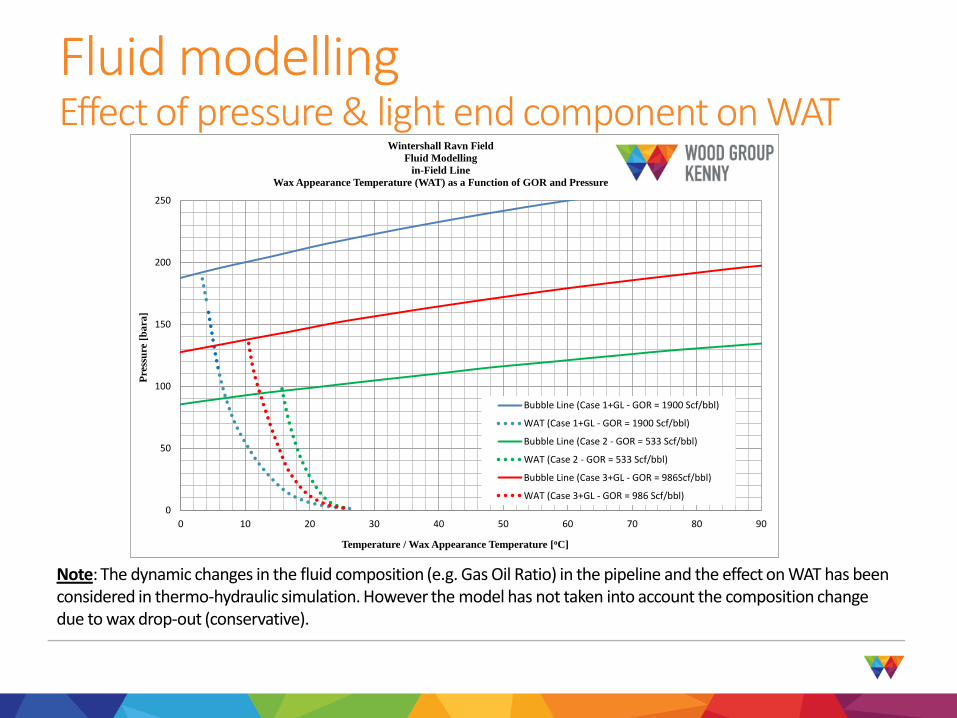
Fluid modelling Effect of pressure & light end component on WAT
Note: The dynamic changes in the fluid composition (e.g. Gas Oil Ratio) in the pipeline and the effect on WAT has been considered in thermo-hydraulic simulation. However the model has not taken into account the composition change due to wax drop-out (conservative).
0
50
100
150
200
250
0 10 20 30 40 50 60 70 80 90
Pre
ssu
re [
ba
ra]
Temperature / Wax Appearance Temperature [oC]
Wintershall Ravn Field
Fluid Modelling
in-Field Line
Wax Appearance Temperature (WAT) as a Function of GOR and Pressure
Bubble Line (Case 1+GL - GOR = 1900 Scf/bbl)
WAT (Case 1+GL - GOR = 1900 Scf/bbl)
Bubble Line (Case 2 - GOR = 533 Scf/bbl)
WAT (Case 2 - GOR = 533 Scf/bbl)
Bubble Line (Case 3+GL - GOR = 986Scf/bbl)
WAT (Case 3+GL - GOR = 986 Scf/bbl)
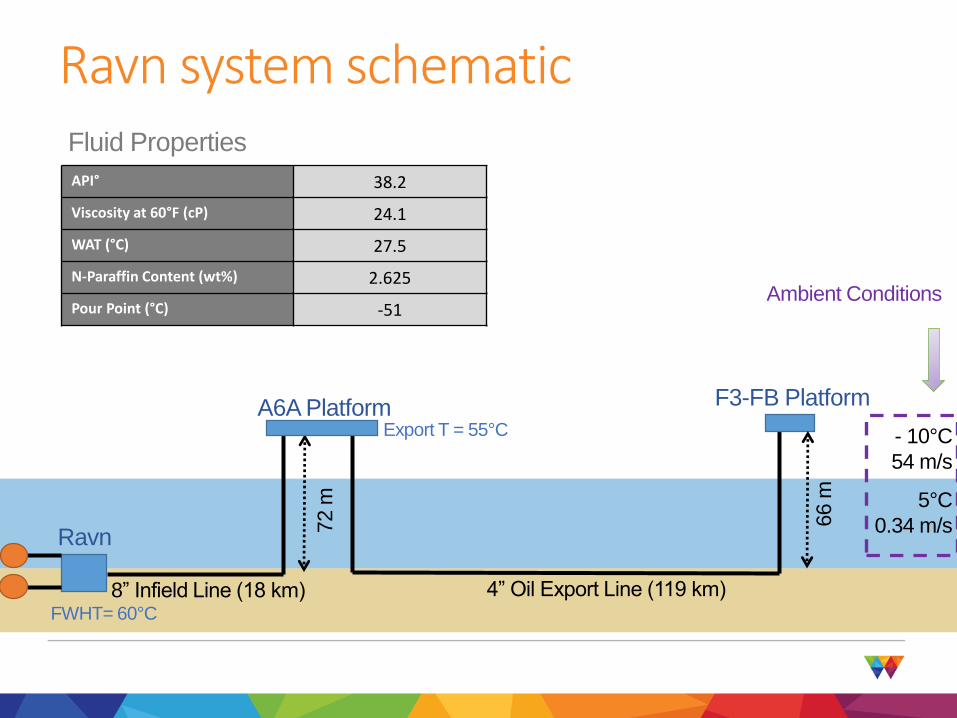
Ravn system schematic
Ravn
F3-FB Platform
4” Oil Export Line (119 km)
72 m 5°C
0.34 m/s
- 10°C
54 m/s
66 m
API° 38.2
Viscosity at 60°F (cP) 24.1
WAT (°C) 27.5
N-Paraffin Content (wt%) 2.625
Pour Point (°C) -51
Fluid Properties
Export T = 55°C
Ambient Conditions
FWHT= 60°C
8” Infield Line (18 km)
A6A Platform
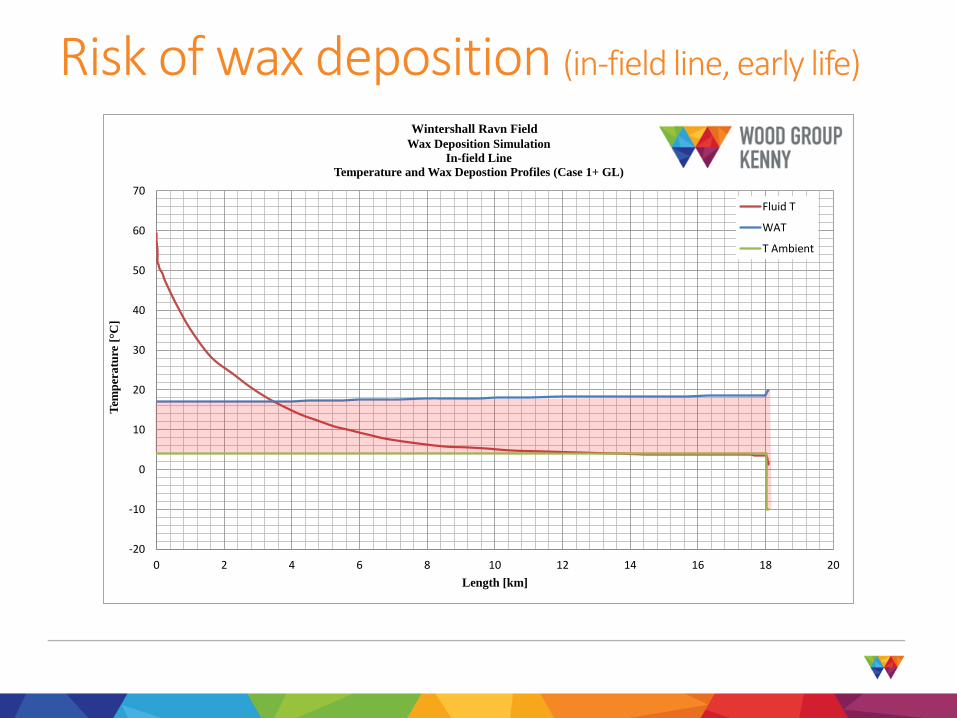
Risk of wax deposition (in-field line, early life)
-20
-10
0
10
20
30
40
50
60
70
0 2 4 6 8 10 12 14 16 18 20
Tem
per
atu
re [ C
]
Length [km]
Wintershall Ravan Field
Wax Deposition Simulation
In-field Line
Temperature and Wax Depostion Profiles (Case 1+ GL)
Fluid T
WAT
T Ambient
Wintershall Ravn Field

Wax deposition thickness (in-field, early life)
0
2
4
6
8
10
12
14
0 2 4 6 8 10 12 14 16 18 20
Wa
x T
hic
kn
ess
[mm
]
Length [km]
Wintershall Ravn Field
Wax Deposition Simulation
In-field Line
Wax Depostion Profiles (Case 1+ GL)
30 days
20 days
10 days
Risk of Wax Depostion at the Topsides
Risk of Wax Depostion at the Subsea
0
1
2
3
4
5
6
7
8
9
10
0 5 10 15 20 25 30
To
tal
Wa
x D
epo
site
d [
m3]
Time [days]
Wintershall Ravn Field
Wax Deposition Simulation
In-field Line - No Inhibitor
Volume of Wax Deposition
Case 1
Case 2
Case 3
Case 4
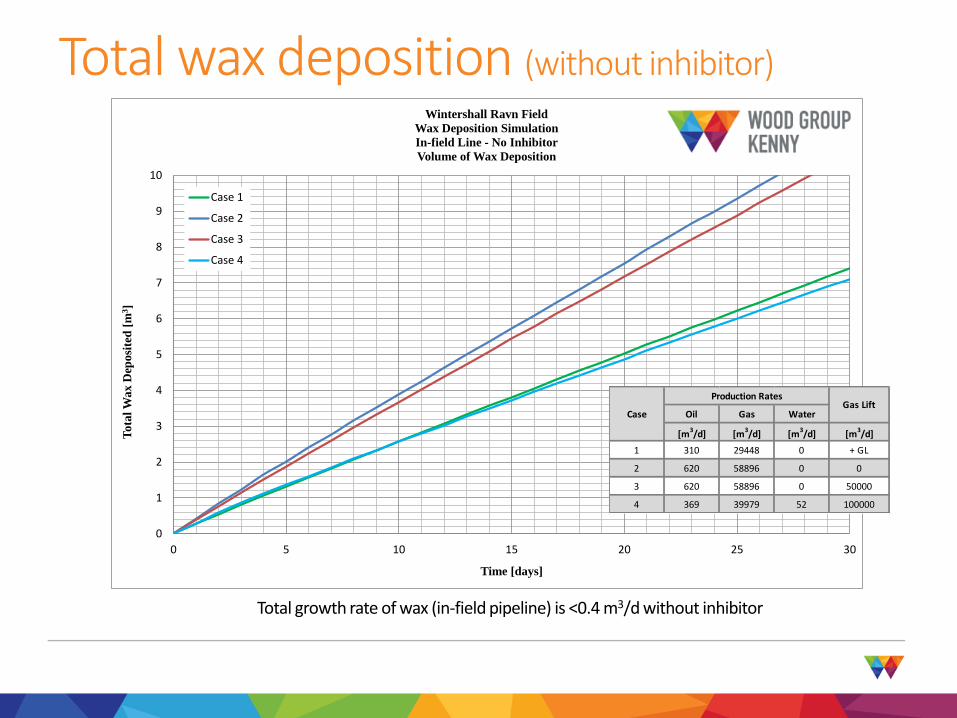
Total wax deposition (without inhibitor)
Total growth rate of wax (in-field pipeline) is <0.4 m3/d without inhibitor
Oil Gas Water
[m3/d] [m
3/d] [m
3/d] [m
3/d]
1 310 29448 0 + GL
2 620 58896 0 0
3 620 58896 0 50000
4 369 39979 52 100000
Case
Production RatesGas Lift
0
1
2
3
4
5
6
7
8
0 5 10 15 20 25 30
To
tal
Wa
x D
epo
site
d [
m3]
Time [days]
Wintershall Ravn Field
Wax Deposition Simulation
In-field Line - With Inhibitor
Volume of Wax Deposition
Case 1
Case 2
Case 3
Case 4
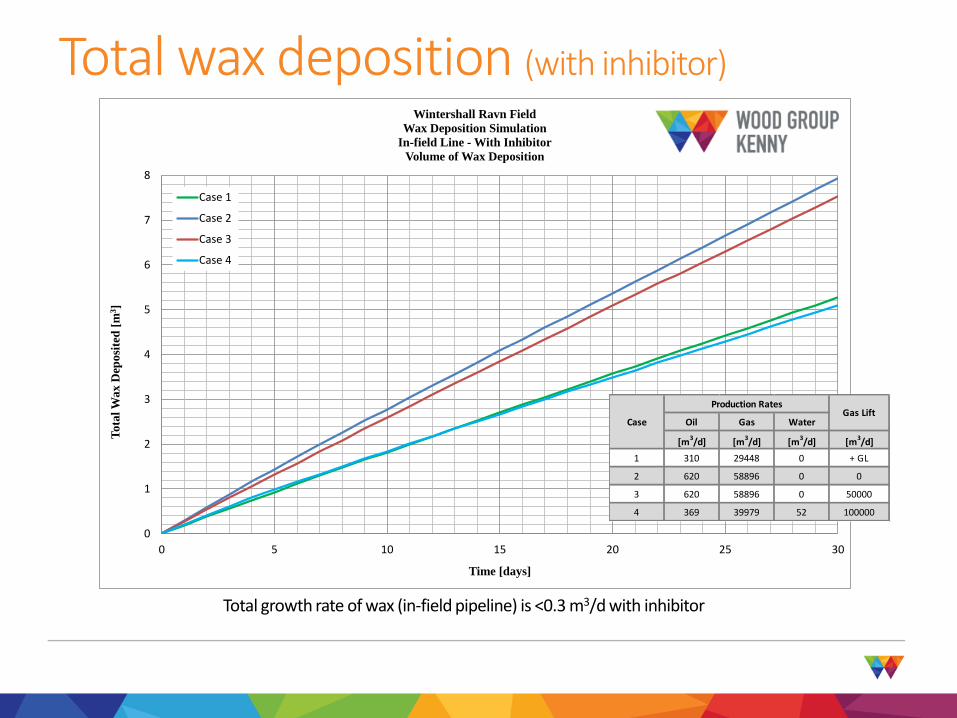
Total wax deposition (with inhibitor)
Total growth rate of wax (in-field pipeline) is <0.3 m3/d with inhibitor
Oil Gas Water
[m3/d] [m3/d] [m3/d] [m3/d]
1 310 29448 0 + GL
2 620 58896 0 0
3 620 58896 0 50000
4 369 39979 52 100000
Case
Production RatesGas Lift

Summary of the results (in-field line)
• WAT is lower at higher pressure for the live fluid• The effect of pressure is more pronounced for the fluids with a
higher GOR (i.e. Gas Oil Ratio)• As soon as the fluid reaches ambient temperature, no wax
deposition would occur (No heat flux to drive the wax deposition –cold slurry flow).
• The first location for wax to deposit depends on the flow rates, GOR, phase fractions, etc.
• After 30 days of operation <4mm and <13mm of (max) wax thickness can be expected at seabed and topside conditions respectively without inhibitor.
• The recommended frequency of pigging operation is every month (based on maximum 4mm of wax deposition in the system) without inhibitor and every 45 days with inhibitor injection (40% efficiency).

Risk of wax deposition (Export Line)
-20
-10
0
10
20
30
40
50
60
0 20 40 60 80 100 120 140
Tem
per
atu
re [ C
]
Distance (km)
Wintershall Ravn Field Wax Deposition Simulation - Export Line
Temperature Profile and Risk of Wax Deposition
Ambient T
WAT
1950bpd Fluid T
2500bpd Fluid T
3500bpd Fluid T
4500bpd Fluid T
Risk of Wax Depostion at the Subsea
Risk of Wax Depostion at the Topsides
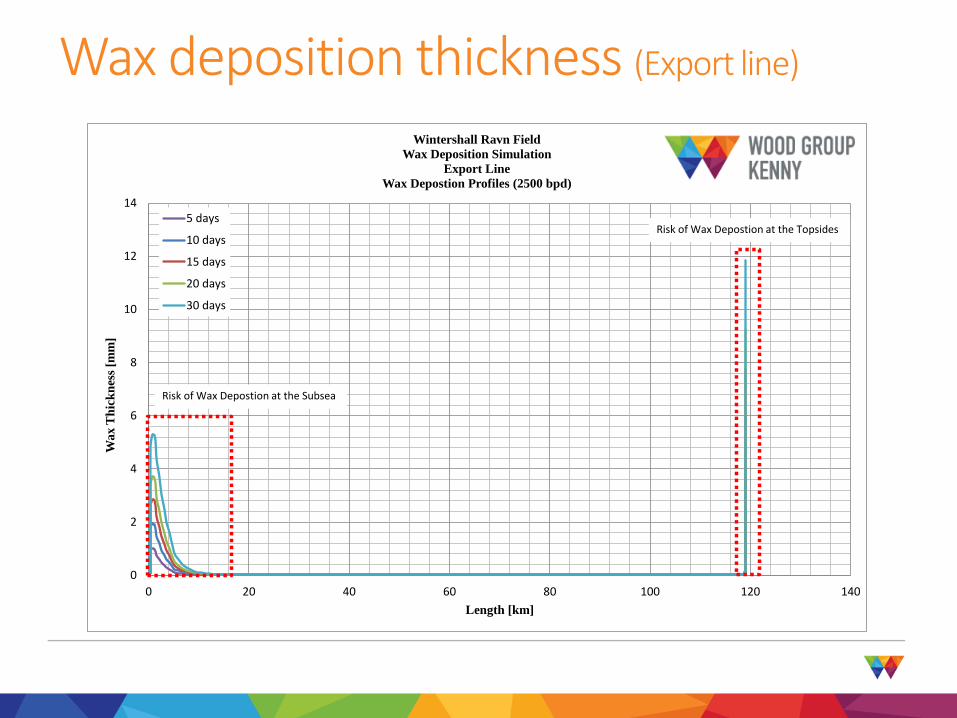
Wax deposition thickness (Export line)
0
2
4
6
8
10
12
14
0 20 40 60 80 100 120 140
Wax T
hic
kn
ess
[mm
]
Length [km]
Wintershall Ravn Field
Wax Deposition Simulation
Export Line
Wax Depostion Profiles (2500 bpd)
5 days
10 days
15 days
20 days
30 days
Risk of Wax Depostion at the Topsides
Risk of Wax Depostion at the Subsea
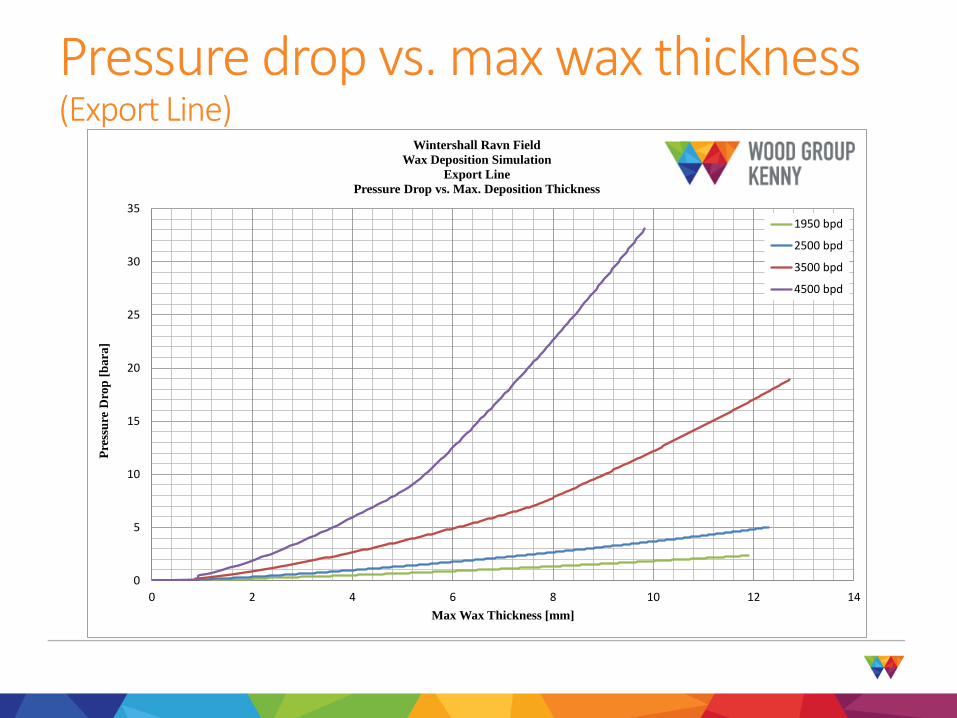
Pressure drop vs. max wax thickness (Export Line)
0
5
10
15
20
25
30
35
0 2 4 6 8 10 12 14
Pre
ssu
re D
rop
[b
ara
]
Max Wax Thickness [mm]
Wintershall Ravn Field
Wax Deposition Simulation
Export Line
Pressure Drop vs. Max. Deposition Thickness
1950 bpd
2500 bpd
3500 bpd
4500 bpd

Self insulation on wax deposition (Export Line)
Results are for the topsides (i.e. the highest deposition thickness and rates)
0
2
4
6
8
10
12
14
0
0.2
0.4
0.6
0.8
1
1.2
1.4
1.6
0 5 10 15 20 25 30
Max W
ax T
hic
kn
ess
[mm
]
Max D
eposi
tion
Rate
[m
m/d
ay]
Time [days]
Wintershall Ravn Field
Wax Deposition Simulation
In-Field Line
Effect of Wax Thickness on Depostion Rates
Case 1 - Deposition Rate Case 2 - Deposition Rate Case 3 - Deposition Rate Case 4 - Deposition Rate
Case 1 - Max Wax Thickness Case 2 - Max Wax Thickness Case 3 - Max Wax Thickness Case 4 - Max Wax Thickness
Summary of the results (Export line)
• Higher flow rate leads to longer section of the export line subject to wax deposition risk.
• Self-insulation effect was observed (Lower rate of deposition by time).
• The maximum wax thicknesses identified for the 4 cases are comparable, however the total wax deposited is more at higher flow rates.
• After 22 days and 31 days of operation <4mm of (max) wax thickness can be expected at seabed condition without and with inhibitor (40% efficiency), respectively.
• Pigging of 4” >100 km export line is challenging and is currently under further evaluation.
• Alternative wax mitigation strategy like wax dispersant, gas condensates has been considered.
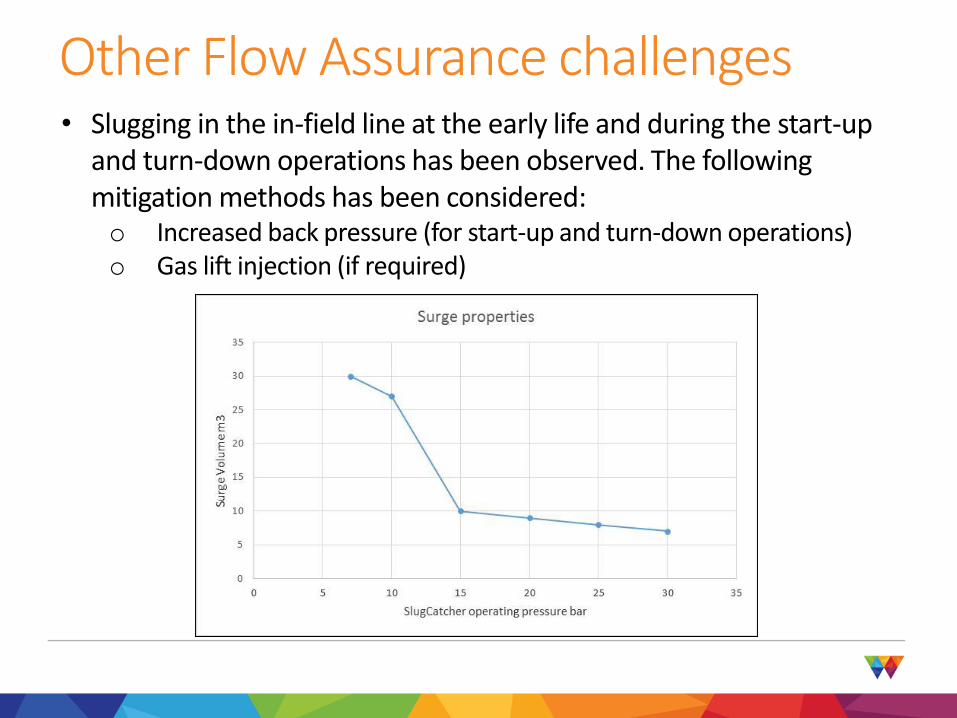
Other Flow Assurance challenges• Slugging in the in-field line at the early life and during the start-up
and turn-down operations has been observed. The following mitigation methods has been considered: o Increased back pressure (for start-up and turn-down operations)o Gas lift injection (if required)

Special thanks to:
Questions?


