
POLYAMIDE (NYLON) 12 POWDER DEGRADATION DURING
THE SELECTIVE LASER SINTERING PROCESS
A Quantification for Recycling Optimization
By
LUKAS JL DUDDLESTON
A thesis submitted in partial fulfillment of the requirements for the degree of
MASTER OF SCIENCE
(MECHANICAL ENGINEERING)
at the
UNIVERSITY OF WISCONSIN – MADISON
2015
Final Oral Examination: August 4th, 2015
Committee:
Tim A Osswald, Professor, Mechanical Engineering
Lih-Sheng Turng, Professor, Mechanical Engineering
Natalie Rudolph, Assistant Professor, Mechanical Engineering

APPROVAL PAGE
The following thesis, Polyamide (Nylon) 12 Powder Degradation during the Selective Laser Sintering Process: A Quantification for Recycling Optimization, has been
approved by:
Professor Tim Andreas Osswald Date KK & CF Wang Professor
Department of Mechanical Engineering College of Engineering
University of Wisconsin-Madison

© Copyright by Lukas JL Duddleston, 2015 All Rights Reserved

i
For my best friend, Ashtyn.

ii
ACKNOWLEDGEMENTS
Before all else, I must thank Professor Tim Osswald for giving a chemist the
opportunity to join the Polymer Engineering Center and for all of the support over the
next sixteen months. I must also thank my loving mother, Priska, and Diane Osswald
for their serendipitous meeting at the Luzern train station, which initiated this journey.
To my father, William, thank you for wholeheartedly supporting my all of academic
endeavors, past, present and future.
A thank you must be given to my committee members as well. Professor Lih-Sheng
Turng, thank you for giving me access to your lab and your instrumentation in the
Wisconsin Institutes for Discovery building. Professor Natalie Rudolph, thank you for
joining the PEC last fall and for always having a minute to talk and then discussing
ideas with me for the next hour.
Andrew Puck, Alex Harris and Elio de Stephanis, you three have been superb
undergraduate assistants, without all of the time you three spent in the lab running
countless experiments, I would still be toiling over experiments. Neil Doll, your wealth
of knowledge regarding the SLS process was invaluable. Patrick Mabry, thank you for
the great tête-à-têtes during our epic ping-pong matches. Lastly, Dr. David C Mazur
and Christopher T Ruska, cheers to spring break 2014.
Finally, to my dearest Maddie Kay, the hours spent at playgrounds provided me with
an escape from the real world and helped me stay young at heart.

iii
What is the most resilient, a parasite? Bacteria? A virus? An intestinal worm? An idea. Resilient... highly contagious. Once an idea has taken hold of the brain it's
almost impossible to eradicate. An idea that is fully formed - fully understood - that sticks; right in there somewhere. - Cobb

iv
ABSTRACT
Selective Laser Sintering, a 3-dimensional printing technique, converts powdered
thermoplastic resins, e.g. polyamide 12 (nylon), into end-use parts using a laser to
melt and fuse the particles. In this layer-by-layer additive manufacturing process the
powder is both the raw material and the mold material. Therefore unsintered powder
can be recovered and recycled in subsequent builds to significantly decrease net
costs. However, unsintered powder is thermally degraded, which results in inferior
parts unless blended (refreshed) with virgin powder. To improve blending protocols,
the powder quality was quantified using differential scanning calorimetry (DSC),
thermogravimetric analysis, and the melt flow index (MFI) for molecular degradation
and using flowability measurements to measure changes in bulk properties. The
results suggested that the sensitivity of DSC to small changes in molecular weight
could reproducibility measure small changes in artificially aged (degraded) powder.
Angle of repose, a flowability measurement, and MFI were sensitive to bulk and
molecular degradation, respectively; however, both techniques lacked reproducibility.
In conclusion, DSC could be a powerful tool to help optimize recycling of SLS powder.

v
TABLE OF CONTENTS
1 INTRODUCTION ................................................................................................ 1
2 THEORETICAL BACKGROUND ....................................................................... 4
2.1. POLYMERS ........................................................................................................ 4
2.2. POLYAMIDE 12 SYNTHESIS ................................................................................. 8
2.3. POLYMER POWDERS ........................................................................................ 11
2.3.1. Powder Flowability and Packing Efficiency ............................................. 13
2.4. MELTING OF SEMI-CRYSTALLINE POLYMERS ....................................................... 13
2.5. ADDITIVE MANUFACTURING ............................................................................... 16
2.5.1. Selective Laser Sintering ........................................................................ 20
2.5.1.1. SLS Machine .................................................................................... 21
2.5.1.2. Pre-Build .......................................................................................... 23
2.5.1.3. The Build and Consolidation ............................................................ 24
2.5.1.4. Post-Build ......................................................................................... 25
2.5.1.5. Advantages ...................................................................................... 27
2.5.1.6. Disadvantages ................................................................................. 28
2.6. AGING AND DEGRADATION ................................................................................ 28
2.6.1. Thermal ................................................................................................... 31
2.6.2. Thermal-Oxidative .................................................................................. 31
2.7. QUANTIFICATION TECHNIQUES .......................................................................... 32
2.7.1. Differential Scanning Calorimetry ........................................................... 32
2.7.2. Thermogravimetric Analysis .................................................................... 36

vi
2.7.3. Powder Flowability and Packing Efficiency ............................................. 36
3 LITERATURE REVIEW .................................................................................... 38
3.1. POWDER FLOWABILITY ..................................................................................... 38
3.2. DEGRADATION PATHWAYS ................................................................................ 39
3.3. THE EFFECTS OF THERMAL DEGRADATION ......................................................... 42
3.3.1. Molecular Weight .................................................................................... 42
3.3.2. Surface Finish Issues.............................................................................. 43
3.3.3. Inferior Mechanical Properties ................................................................ 44
3.4. RECYCLING LITERATURE ................................................................................... 47
3.4.1. Choren et al - 2001 ................................................................................. 47
3.4.2. Gornet et al - 2002 .................................................................................. 48
3.4.3. Dotchev, Pham and Yussoff – 2008 to 2009 ........................................... 49
3.4.4. Mielicki – 2014 ........................................................................................ 52
3.4.5. Wudy et al – Present............................................................................... 52
3.4.6. Summary ................................................................................................ 53
4 PATENT REVIEW ............................................................................................ 54
4.1. DIAMINE- AND DIACID-REGULATED PA12 ........................................................... 54
4.2. HYDROLYSIS .................................................................................................... 56
5 COST-ANALYSIS ............................................................................................ 58
5.1. COST VERSUS INJECTION MOLDING ................................................................... 58
5.2. REFRESH RATE THOUGHT EXPERIMENT ............................................................. 60

vii
6 METHODOLOGY ............................................................................................. 64
6.1. INTRODUCTION ................................................................................................. 64
6.2. MATERIALS ...................................................................................................... 65
6.3. CONTROLLED AGING ........................................................................................ 65
6.4. RECYCLING SCHEME – BLENDING ..................................................................... 66
6.5. THERMAL ANALYSIS ......................................................................................... 67
6.5.1. Differential Scanning Calorimetry ........................................................... 67
6.5.1.1. Degradation Analysis ....................................................................... 67
6.5.1.2. Recycling Scheme – Blending .......................................................... 68
6.5.2. Thermogravimetric Analysis .................................................................... 68
6.6. MELT FLOW INDEX (MFI) .................................................................................. 68
6.7. POWDER FLOW ANALYSIS ................................................................................. 69
6.7.1. Pourability ............................................................................................... 69
6.7.2. Apparent Density .................................................................................... 70
6.7.3. Angle of Repose ..................................................................................... 71
7 RESULTS ......................................................................................................... 72
7.1. THERMAL ANALYSIS ......................................................................................... 72
7.1.1. DSC – Aged Powder ............................................................................... 72
7.1.2. TGA – Aged Powder ............................................................................... 77
7.1.3. Particle Size Dependent Degradation ..................................................... 79
7.2. RECYCLING ..................................................................................................... 80
7.2.1. Recycling Scheme – Blending ................................................................ 80

viii
7.3. MELT FLOW INDEX ........................................................................................... 84
7.4. POWDER FLOWABILITY ..................................................................................... 87
8 CONCLUSIONS AND FUTURE WORK ........................................................... 91
8.1. CONCLUSIONS ................................................................................................. 91
8.2. FUTURE WORK ................................................................................................ 93
9 REFERENCES ................................................................................................. 95

ix
LIST OF FIGURES
Figure 2.1: Synthesis of a polymer, polyamide-12, with 2 function end groups from a monomer. ................................................................................................................... 4
Figure 2.2: The effect of molecular weight on the glass transition temperature, the melting temperature and the degradation temperature. ............................................. 5
Figure 2.3: A hypothetical distribution of polymer molecular weight........................... 7
Figure 2.4: ROM Polymerization of PA12 from Lauryl Lactam ................................... 9
Figure 2.5: A schematic of particle coalescence ...................................................... 11
Figure 2.6: Crystalline Structures, Courtesty of Osswald48. ..................................... 14
Figure 2.7: A representative FDM printer (Top) A close-up of the print head and the part (Bottom) ............................................................................................................ 17
Figure 2.8: Two FDM printed parts with build orientation depedent support material ................................................................................................................................. 18
Figure 2.9: SLA printed parts ................................................................................... 19
Figure 2.10: A schematic of the Sinterstation 2500 .................................................. 22
Figure 2.11: The general AM build sequence from CAD to end-use part ................. 23
Figure 2.12: The SLS Build Cycle ............................................................................ 26
Figure 2.13: A schematic of a DSC based on the Netzsch Polyma DSC61. ............. 33
Figure 2.14: A sketch of a DSC thermogram showing the melting endotherm ......... 35
Figure 2.15: A cross-sectional schematic of the dynamic angle of repose apparatus ................................................................................................................................. 37

x
Figure 3.1: The polymerization of PA12 from either laurolactam or 12-aminolauric acid via a ROP or a condenstation polymerization, respectively. Note that ROP yields PA12, while the condenstation reaction yields PA12 and water. ............................. 40
Figure 3.2: GPC results of degraded PA12 from Pham et al6 .................................. 43
Figure 3.3: The mechanical properties of parts printed with recycled powder, from Wudy38. .................................................................................................................... 44
Figure 3.4: The mechanical properties of parts printed with recycled powder, from Gornet35. .................................................................................................................. 45
Figure 3.5: The mechanical properties of parts printed with recycled powder, from Zarringhalam27. ........................................................................................................ 46
Figure 3.6: Surface quality of parts printed with SLS powders with decreasing MFR, from the work of Dotchev7. ....................................................................................... 50
Figure 3.7: The Dotchev Blending Curves ............................................................... 51
Figure 4.1: Diamine- & Diacid-Regulated PA12 Particles ........................................ 55
Figure 5.1: Cost comparison of SLS versus Injection Molding ................................. 59
Figure 5.2: Effects of Refresh Rate for the 5th build ................................................ 62
Figure 6.1: The experimental workflow .................................................................... 64
Figure 6.2: A schematic of the funnel for ASTM D1895-96, the standard for measuring powder pourability and angle of repose ................................................................... 70
Figure 7.1: Tm,onset for the aged powder. Error Bars: +/- 1 Standard Deviation (SD) 72
Figure 7.2: The Tm,peak for the aged powder. Error Bars: +/- 1 SD ........................... 73
Figure 7.3: The Tm,end for the aged powder. Error Bars: +/- 1 SD ............................ 73
Figure 7.4: The ΔHm for the aged samples. Error Bars: +/- 1 SD ............................. 74
Figure 7.5: The ΔTm for samples aged at 170 °C. Error Bars: +/- 1 SD ................... 75

xi
Figure 7.6: TGA results, the decomposition onset temperature of aged powder ..... 78
Figure 7.7: TGA results, the decomposition inflection temperature of aged powder 78
Figure 7.8: The Tm,peak and Tm,end of degraded powder as a function of particle size. ................................................................................................................................. 79
Figure 7.9: The Tm,end for powder aged from 0 to 96 hours, refreshed at 0 to 60 %, clustered by powder age. ......................................................................................... 81
Figure 7.10: The Tm,end for powder aged from 0 to 96 hours, refreshed at 0 to 60 %, clustered by refresh rate. ......................................................................................... 81
Figure 7.11: The Tm,peak for powder aged from 0 to 96 hours, refreshed at 0 to 60 %, clustered by powder age. ......................................................................................... 82
Figure 7.12: The Tm,peak for powder aged from 0 to 96 hours, refreshed at 0 to 60 %, clustered by refresh rate. ......................................................................................... 82
Figure 7.13: The Melt Flow Rate (MFR) of the aged powder, clustered by aging temperature. Error Bars: +/- 1 SD. ........................................................................... 84
Figure 7.14: The Melt Volume Rate (MVR) of the aged powder, clusted by aging temperature. Error Bars: +/- 1 SD ............................................................................ 84
Figure 7.15: The MFR results presented by Dotchev in 20097................................. 86
Figure 7.16: The Angle of Repose as of the aged powder, clustered by aging temperature. Error Bars: +/-1 SD ............................................................................. 88
Figure 7.17: Apparent density of the aged powder, clustered by aging temperature. Error Bars: +/- 1 SD. ................................................................................................ 89

xii
NOMENCLATURE
2D 2-Dimensional
3D 3-Dimensional
ABS Acrylonitrile-Butadiene-Styrene Copolymer
ALM Advanced Laser Materials, LLC
AM Additive Manufacturing
ASTM American Society for Testing & Materials
CAD Computer-Aided Design
CDT Cyclododecatriene
Cp Isobaric Heat Capacity
DSC Differential Scanning Calorimetry
FDM® Fused Deposition Model (A registered trademark of Stratasys)
FFF Fused Filament Fabrication
HDPE High Density Polyethylene
ΔHf Enthalpy of Fusion (Solidification)
ΔHm Enthalpy of Melting
LS Laser Sintering
MFI Melt Flow Index
MFR Melt Flow Rate
�̅�𝑛 Molecular Number Average
�̅�𝑤 Molecular Weight Average
MW Molecular Weight

xiii
MWD Molecular Weight Distribution
MVR Melt Volume Rate
PA Polyamide (Nylon)
PA11 Polyamide 11
PA12 Polyamide 12
PEEK Poly Ether Ether Ketone
PDI Polydispersity Index
PLA Polylactic Acid
PMMA Polymethylmethacrylate (Acrylic)
POM Polyoxymethylene (Polyacetal)
PS Polystyrene
RM Rapid Manufacturing
RP Rapid Prototyping
ROP Ring-Opening Polymerization
SLA Stereolithography
SLM Selective Laser Melting
SLS® Selective Laser Sintering (A registered trademark of 3D Systems)
Tg Glass Transition Temperature
Tm Melting Temperature
Tm,end Temperature at the end of the melting endotherm
Tm,onset Temperature at the onset of the melting endotherm
Tm,peak Temperature at the peak of the melting endotherm

xiv
ΔTm Melting endotherm range (Tm,end – Tm,onset)
TGA Thermogravimetric Analysis
UHP Ultra-High Purity

1
1 INTRODUCTION
The first industrial revolution at the close of the 19th century brought about an
unprecedented increase in worldwide production, which was quickly followed by the
second industrial revolution in the early 20th century that was started by Henry Ford’s
assembly line and the petroleum fueled economy1. In the second half of the century,
the inclusion of computer technology improved efficiency, but the majority of consumer
and industrial products were still manufactured on assembly lines1. Now in the 21st
century, prominent economic theorists, such as Jeremy Rifkin, have suggested that
3-dimensional (3D) printing will usher in the third industrial revolution and dramatically
shift the paradigm away from the centralized assembly-line factories to localized and
custom production that meets the specific demands of the consumer1–3.
Some of the strongest candidates to drive this revolution are the additive
manufacturing (AM) techniques, which are defined by ASTM International as:
A process of joining materials to make objects from 3D model data, usually layer upon layer, as opposed to subtractive manufacturing methodologies4.
Therefore, AM meets both requirements set forth by Rifkin because one machine
eliminates the need for an assembly line of subtractive techniques, and because end-
use parts are highly customizable and built to order by simply modifying the computer-
aided design (CAD) model.

2
While 3D printing has the potential to be the keystone of the third industrial revolution,
there are still many challenges that must be overcome before this emerging
technology can challenge the status quo of assembly-line based manufacturing. In
particular, quality must be improved and cost must be driven down; however, all
emerging technologies face this barrier.
Selective laser sintering (SLS®) is one area that holds great potential for cost efficiency
improvements; the process converts powdered thermoplastic resins, such as
polyamide 12 (PA12), into end-use parts by melting and consolidating the powder with
a laser. The process currently requires powdered thermoplastics that cost
approximately $100 per kilogram for PA12 and have a build conversion of powder of
only 15 %5,6. While the unsintered (unused) powder is recoverable, it is thermally
degraded during the process and its properties are altered. Therefore, virgin powder
must be blended in to refresh the recovered powder’s properties. Manufacturers
recommend 30 to 70 % virgin powder7. Not only is this blending recommendation
arbitrary, it also is very costly given that refreshing at 30 % is $40 per kilogram cheaper
than refreshing at 70 % virgin powder. In addition, the current literature has not
explored the topic in great detail, and the results have improved the recycling process
from an arbitrary process to a slightly quantitative process that focuses on part quality
rather than understanding the fundamental phenomena that necessitate powder
refreshing. If the cost of SLS is to decrease and break down the high cost barrier, the
reasons for recycling must be understood.

3
The goal of this work is to further explore and quantify the degradation of powder by
measuring powder properties as a function of the degree of degradation (time spent
at a specific temperature) and to assess the influence of refreshing the aged powder
with virgin material. While the long-term goal is to decrease the cost of the SLS
process, a small but significant step must first be taken in understanding the
fundamental science of recycling powder.
Chapter 2 provides a theoretical background. A literature review and a patent review
of the recycling of PA12 powder is given a Chapter 3 and Chapter 4, respectively.
Chapter 5 explores the costs of the SLS process and recycling. Chapter 6 describes
the methodology. The results are presented and discussed in Chapter 7. A summary
and outlook is outlined in Chapter 8.

4
2 THEORETICAL BACKGROUND
2.1. Polymers
Synthesized from monomer units, polymers are macromolecules with extremely large
average molecular weight (MW) compared to the monomer and other organic
molecules. The simplest polymers are assembled from a single monomer. For
example, 12-aminododecanoic acid is linked successively to form long chains to form
PA12. When a monomer reacts with a second monomer it is transformed into the
repeat unit of the polymer.
Figure 2.1: Synthesis of a polymer, polyamide-12, with 2 function end groups from a monomer.

5
In the case of PA12, the carboxylic acid and the amine functional groups rearrange to
form the amide function group, which now links the two original molecules. This occurs
thousands to tens of thousands of times in the synthesis to create long chains of
repeat units, which ultimately yields the macromolecule referred to as a polymer.
Figure 2.2: The effect of molecular weight on the glass transition temperature, the melting temperature and the degradation temperature.
In addition to the repeat unit, there are some other important features of the polymer
chain. While the vast majority of the polymer consists of the repeat unit, the ends of
the chain are typically capped by a different moiety. In the case of polyamide, one end
is usually an amine functional group while the other terminus is a carboxylic acid

6
group. This has great implications as these end groups behave differently than the
repeat unit. For example, these end groups may be more reactive than the rest of the
polymer chain, allowing for additional chemistry to be performed at this location. One
could imagine modifications to improve stability. End groups also influence
crystallinity, as they are an impurity, which in turn affects the melting of the polymer.
When characterizing the polymer, the size of the polymer chain is one of the most
commonly reported values. However, there are many ways to report the size since
most—especially synthetic polymers—are not monodisperse (i.e. the chains do not all
have the same number of repeat units). Therefore, after synthesis, the polymer has a
distribution of chain sizes. From this distribution, the number average and weight
average can be calculated by taking first and second moment of the molecular weight
function, respectively. A polymer with a degree of polymerization i, will be defined as
an i-mer. In other words, an i-mer has an i number of repeat units. The number
average ( ) is defined by
(2.1)
where mi is the weight of all i-mers, ni is the number of i-mers , Mi is the molecular
weight of an i-mer and Mo is the weight of one repeat unit. Therefore ni can be related
to mi by

7
(2.2)
The molecular weight average ( ) is defined by
(2.3)
The is therefore always a larger number than the since more value is given to
i-mers of higher molecular weight for the weight average.
Figure 2.3: A hypothetical distribution of polymer molecular weight
From and the dispersity of the polymer can be calculated. The polydispersity
(PDI) is defined by

8
(2.4)
The PDI is always greater than one since . As the dispersity of the polymer
decreases, the PDI approaches 1 as the weight of the i-mers converges. For
monodisperse polymers, such as protein that have an exact number of repeat units,
the PDI equals 1.
2.2. Polyamide 12 Synthesis
Both the polymerization of dodecane-12-lactam (Lauryl Lactam) and 12-
aminododecanoic acid (12-aminolauric acid, ω-aminolauric acid) yield PA12;
however, due to improved stability, especially at elevated temperatures, the ring-
opening polymerization (ROP) of the lactam is the preferred method of Evonik
Degussa GmbH, the primary supplier of PA12 for SLS powder8–10. Catalyzed by water
and either cationic or anionic initiated, the ROP yields a bifunctional terminated PA12
with an amine and carboxylic acid end group.
Of the two synthetic pathways that yield PA12, the ROP of lauryl lactam is preferred
in industry because it yields a more stable product. The degree of polymerization for
ROP of laurel lactam is not dependent on the concentration of water and the initiators
are less detrimental to polymer stability. When the condensation polymerization is

9
used, water must be removed to drive the reaction due to Le Châtelier's principle.
Therefore, the presence of water would drive the polymerization in reverse.
It is also important to remember that the polymer is a bifunctional terminated molecule
with one amine and one carboxylic acid end group. These two functional groups can
react, just like the bifunctional 12-aminododecanoic acid monomers. Therefore, post-
polymerization can occur with significant implications. If two end groups on two
different polymer chains were to react, the average MW would double for a two chain
system. Statistically it is rare for chain ends to find each other, as the chain-end-to-
repeat-unit ratio is extremely small; however, if this does occur—for example at
elevated temperatures—the average MW would increase, possibly significantly.
Figure 2.4: ROM Polymerization of PA12 from Lauryl Lactam

10
If PA12 is synthesized from lauryl lactam, the source of the feedstock is typically
butadiene, which is a petroleum product. The first step is to react three equivalents of
butadiene in the presence of catalysts to yield one equivalent of cyclododecatriene
(CDT). CDT gained notoriety in 2012 when a fire at the Marl Chemicals Park plant
owned by Evonik GmbH severely limited PA12 feed stocks, which greatly affect the
automotive and the 3D printing industry. There are many synthetic routes to convert
CDT to Lauryl Lactam. One such route first epoxidizes CDT with peracetic acid and
then hydrogenates it to yield a saturated epoxide11. The reactive epoxide is treated
with magnesium iodide to yield an oxime, which is reacted with hydroxylamine to yield
the lauryl lactam. The exact synthetic route is not important but it is important to
remember that currently PA12 is a petroleum based product.
Since the 2012 fire that had significant implications in the world economy, especially
for PA12 automotive parts, there has been a push to find alternative feed stocks—
preferably renewable ones9. In 2013 Evonik started to explore the possibility of using
12-aminododecanoic acid derived from renewable sources; however, this project is
only at the pilot plant stage12. Evonik also built a second CDT plant in Singapore
signaling that the petroleum based synthetic route has long-term importance12.
11
2.3. Polymer Powders
Polymer powders hold an important niche market for rotational molding, spray coating
of metal substrates and additive manufacturing13,14. As the market is relatively small,
especially compared to plastic pellets, there are very few suppliers of commercially
available powders. For example there are approximately 30 commercially available
LS powders compared to the nearly unlimited number of resins available as pellets for
high shear applications such as extrusion or injection molding14.
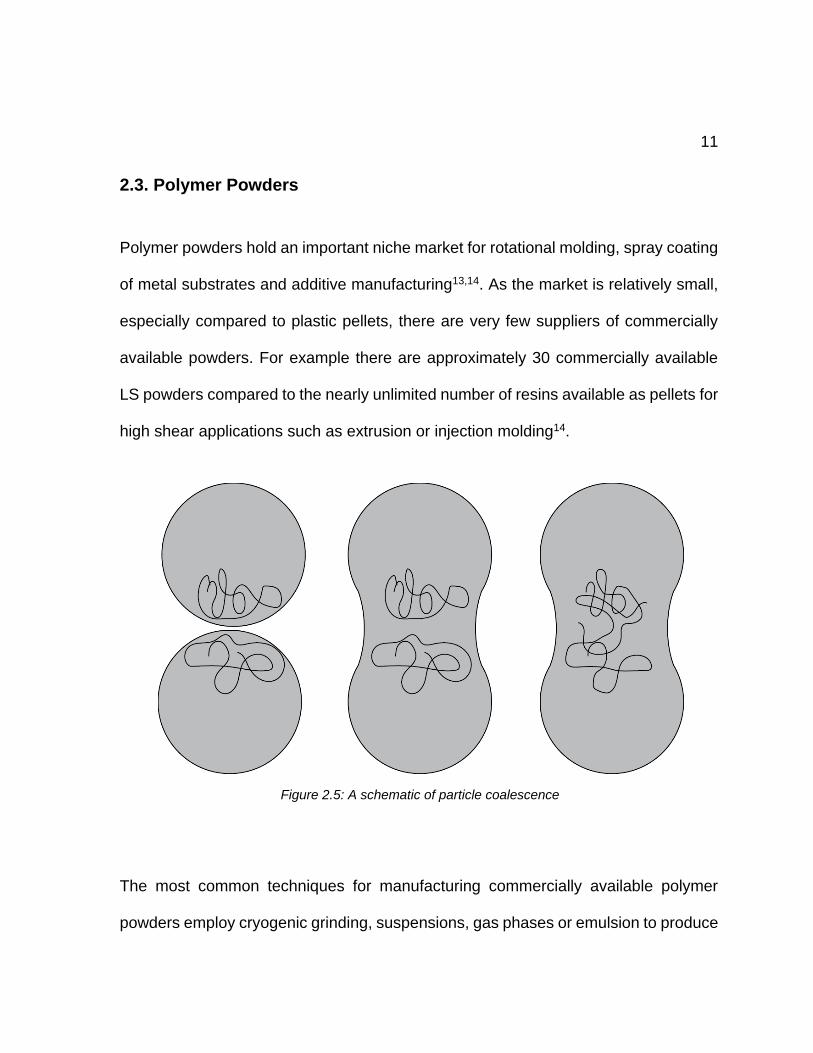
The most common techniques for manufacturing commercially available polymer
powders employ cryogenic grinding, suspensions, gas phases or emulsion to produce
Figure 2.5: A schematic of particle coalescence

12
the particles13. Evonik GmbH, the supplier of powder to ALM uses a physical process,
i.e. cryogenic grinding to produce powdered PA1215. Even though the market share is
limited, powders, typically between 10 µm and 1000 µm in diameter, have distinct
advantages over conventional pellets, which are a few millimeters in diameter. As
powders are manufactured from resins with low melt viscosities, particle coalescence
will occur due to surface tension even under no-shear13,16. This is in stark contrast to
pellets, which require shear forces for pellet coalescence, e.g. extrusion or injection
molding.
Particle coalescence is a multistep process that results in the strong fusion of the
particles if the polymer chains from adjacent particles become intertwined. First the
particles must melt, which results in a flow field due to the low zero-shear viscosity of
the polymer and the high surface tension. This results in the formation of “necks”
between the particles. Finally, if the particles remain molten for long enough,
molecular motion will result in intertwining of the polymer chains. If the polymer does
not reach the melt state or for only for a very short period of time, the molecules from
adjacent particles cannot interact. The particles will be fused but the interface will be
very weak, analogous to a weak weld line.

13
2.3.1. Powder Flowability and Packing Efficiency
The flowability and packing efficiency of polymer powders are very important for the
SLS process and are determined by factors such as particle size distribution, moisture
content, morphology, surface texture, density, electrostatic charges, the temperature,
etc17–20.The four mechanisms that resist particle movement (flow) are: friction,
mechanical interlocking, inter-particle forces and liquid bridging17. Friction between
particles is a material property that is highly dependent on the surface roughness of
the particles. If the particles are not spherical and have organic shapes, it is possible
for two particles to interlock like two puzzle pieces. Interlocking of particles will resist
flow. Inter-particle forces can result in cohesion that could be due to an electrostatic
potential. Finally, if there are liquids between the particles, for example water, capillary
forces can create a bridge across the interface of two particles resulting in a diminution
of independent particle movement.
2.4. Melting of Semi-crystalline Polymers
Melting of polymeric materials is a complex process that is highly dependent on
numerous material properties and is of great importance in the SLS process as the
laser must completely melt the 2D cross-section of the given layer21–23. For this
reason the melting process and the changes in the melting process as function of the
degree of aging must be well understood for successful builds.

14
In the simplest terms, melting is an increase of free volume when temperature
increases, which results in the complete dissociation of the lamella24,25. In semi-
crystalline polymers, such as PA12, the polymer chains regularly align during cooling,
similar to crystal lattice structures of low molecular weight molecules. The chains first
order at the molecular level and then at the nanoscale as lamella and finally form
spherulites at the micrometer scale26, as seen in Figure 2.6. As crystallization is a
molecular phenomenon, it is not surprising that small changes in the polymer’s
structure can influence the dissociation of the lamella and in turn the melting process.
Similar to employing freezing point depression to melt ice by adding salt, the melting
point of a polymer can be decreased with the addition of an impurity. While plasticizers
are the quintessential additive for freezing point depression of polymers, other factors
can have the same effect. While often neglected, the chain-ends do act as impurities
as they differ significantly, especially in PA12, from the repeat unit and therefore
Figure 2.6: Crystalline Structures, Courtesty of Osswald48.

15
depress the melting temperature25. The depression of the melting temperature can be
described by
(2.5)
where Tm infinity is the melting temperature of a polymer of infinite molecular weight,
or in other terms, a polymer with no chain ends.
Additional emphasis must be placed on melting because it is well know that in order
to achieve successful sintering the powder must be quickly melted by the laser. The
polymer melt must then consolidate to ultimately form the solid part, otherwise there
are issues with porosity16. Therefore it is important that the melting temperature range
be as narrow as possible. More in regards to this topic will be discussed in future
sections.
The melting process is so critical that significant work has been completed on the
effects of poor sintering due to incomplete melting. Zarringhalam et al has shown that
incomplete sintering can occur if the laser powder is not sufficient or the particle size
is too great21,22,27. Both optical microscopy and DSC were used to determine that there
were regions of PA12 that never melted. The authors suggested that a different crystal
structure forms when the PA12 crystalizes during the SLS processes compared to the
powder production because the melting endotherm of an incompletely sintered part
shows two distinct peaks.

16
2.5. Additive Manufacturing
Before discussing a specific 3D printing technique, it is imperative to frame the topic
with an overview of the state of the art of AM. AM and the closely related field of rapid
manufacturing (RM) or rapid prototyping (RP) produces end-use parts by joining
materials, layer by layer, to produce 3D parts directly from a CAD file. This is in
contrast to traditional manufacturing that is subtractive, e.g. milling or lathing. The field
has also been referred to as solid free-form fabrication as the AM techniques do not
require a mold to produce parts.
Without the need for costly and time-consuming mold design and manufacturing, AM
has been instrumental in the field of RP and RM for production of highly customizable
parts, including prototypes. Parts can be designed and manufactured in a fraction of
the time compared to traditional prototyping methods. Without the restrictions of a
mold, part geometries can have nearly infinite complexity. It has been estimated that
RP reduces development costs 40 to 70 % and reduces development time by 90 %
28. For example, Saab Avitronics released a case study in 2008 that showed RM can
speed development, reduce part weight and decrease manufacturing costs for low
volume production of unmanned aerial vehicle components29. It should be noted that
rapid does not refer to the speed of manufacturing, since AM techniques are relatively
slow compared to tradition polymer processing machines such as extrusion or
injection molding. The savings arise since purchasing a mold can include a multi-week

17
lead time and be very costly, thousands to hundreds of thousands of dollars
depending on complexity.
Figure 2.7: A representative FDM printer (Top) A close-up of the print head and the part (Bottom)

18
While all of the AM techniques uses the layer by layer manufacturing approach, the
materials used vary greatly and can be divided into three primary categories:
filaments, liquids and powders. Fused deposition modeling (FDM®) or fused filament
fabrication (FFF) is the highly publicized technique due to the low-cost of machines
and materials. FFF feeds a filament into the print nozzle, where it is heated to above
the Tm of the polymer and extruded from the nozzle. The nozzle moves in 3D space
in respect to the build platform to lay down a bead of molten polymer. One major
disadvantage of the FFF technique is the requirement for support structures if
overhangs or undercuts exist. Upon build completion, these support structures must
either be physically removed or chemically dissolved if a second, water or organic
solvent soluble material is used for the support material, it can be dissolved. An
example of an FMD part with the required support material is shown in Figure 2.8.
Figure 2.8: Two FDM printed parts with build orientation depedent support material

19
Note that for overhangs and undercuts support material is required and can be very
dependent on the orientation of the part.
The most prominent liquid based technique is stereolithography (SLA), which in 1987
was the first commercially available 3D printing machine [SOURCE]. 3D Systems was
the manufacturer of the SLA-1 and has continued to be an industry leader for both
SLA and SLS after the acquisition of DTM Corp, the first company to sell a
commercially available SLS machine. SLA uses a laser beam to selectively
polymerize a liquid photopolymer near the surface of a vat of the liquid. The laser
initiates the polymerization, which converts the liquid in to a solid polymer. The build
surface is then lowered into the vat and the subsequent layer is built upon the previous
layer. SLA can be extremely accurate and yields an excellent surface finish; however,
Figure 2.9: SLA printed parts

20
the materials are extremely limited and post-build curing is required to full polymerize
(increase the strength) the parts. Just like FFF, SLA also requires support structures
for overhangs and undercuts.
There are two major powder based techniques, binder jetting and SLS®. Both
techniques layer down a layer of powder, which must be fused. For binder jetting, a
print head sprays a liquid binder material onto the powder layer to fuse the particle.
One advantage of this technique is that the binder material can be colored, which
allows for multicolored parts. Unfortunately the binder material does not create strong
parts, especially compared to SLS, which will be discussed in more detail in the next
section.
2.5.1. Selective Laser Sintering
For uniformity and simplicity this thesis will be solely based on the DTMa Sinterstation
2500 SLS machine and Advanced Laser Materials, LLC (ALM) 650 PA12 SLS grade
powder; however, the results should be applicable to all PA12 powders and all SLS
machines as the majority of the differences are superficial.
a DTM Corporation was acquired by 3D Systems Corporation in 2001

21
Laser Sintering (LS), the generic term, or SLS®, the registered trademark of 3D
Systems Corp., is a powder bed fusion process, which builds the end-use part, layer
by layer, by melting and consolidating a powdered material, e.g. PA12. The powder is
melted by a CO2 laser, which traces 2D cross-section of the current layer. These
layers are sequentially consolidated within the part cylinder to produce the final
part4,30. Before describing the process in more detail, the nomenclature should be
clarified. Sintering is a historical misnomer as consolidation, see §2.5.1.3, of powder
particles requires fully melting the powder. The term sintering is inappropriate since
sintering has traditionally been reserved to describe particle fusion processes below
Tm4,13. However, due to ubiquitous use of the term sintering, the term SLS® will still be
used in this thesis. As SLS® is a registered trademark of 3D Systems Corporation,
Laser Sintering (LS) has been adopted as the generic term. While the term Selective
Laser Melting (SLM) would be more appropriate, it has been reserved for a metal
technique related to metal SLS that fully melts the metal versus metal SLS, which
does not fully melt the metal powder. For these reasons, SLS will be used with the
proviso that the reader should remember that SLS refers to the complete melting of
the polymer by the laser to achieve coalescence.
2.5.1.1. SLS Machine
The SLS machine can be split into three major components: the powder system, the
heating elements and the laser. The powder system includes the part cylinder,
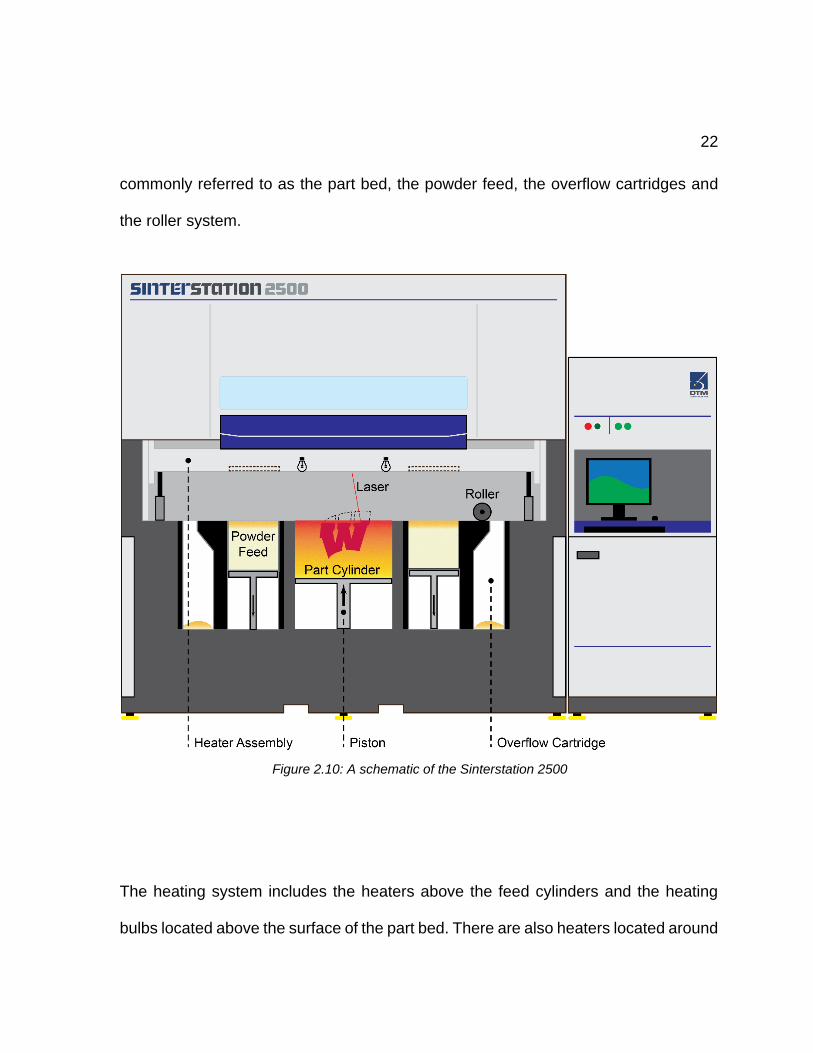
22
commonly referred to as the part bed, the powder feed, the overflow cartridges and
the roller system.
The heating system includes the heaters above the feed cylinders and the heating
bulbs located above the surface of the part bed. There are also heaters located around
Figure 2.10: A schematic of the Sinterstation 2500

23
part and feed cylinders, include on the pistons. The pistons move powder out of the
feed cylinders, which is moved the now lowered part cylinder by the roller system. The
overflow cartridges collect any excess powder that the roller did not deposit in the part
cylinder. The laser is a 25, 50 or 100 watt continuous-wave CO2 laser that operates
at a wavelength of 10.6 µm, or 28.3 THz and can travel at 508 cm/s (200 inches/s).
2.5.1.2. Pre-Build
First the CAD file must be converted to a .STL (the de facto file accepted by 3D
printers) and sliced into 2D cross-sections. The parts are then distributed by the
software within the build cylinder to optimize powder conversion. Next, the powder
feed bins are loaded with either virgin or recycled powder and the build chamber is
Figure 2.11: The general AM build sequence from CAD to end-use part

24
sealed. The build chamber is flushed with nitrogen to decrease the oxygen
concentration to less than 5 %. This is an important step as polymers, especially PA12,
are sensitive to thermal-oxidative degradation31. Finally the part cylinder is loaded with
an approximately 2.5 cm layer of powder using the roller system. The feed bins are
heated to 80 °C and the part cylinder to between 166 and 170 °C.
2.5.1.3. The Build and Consolidation
Once the system is at the temperature set-points, the machine can start printing the
parts; this step is commonly referred to as the build. After preheating, the roller pushes
the powder from the feeder bin to the build cylinder. At this point the surface of the
build surface is heated to 170 °C. Once at temperature, the laser traces the 2-
dimensional (2D) cross-section for the first layer of the build based on the slice
generated from the .stl file. These steps are shown in Figure 2.12. The energy from
the laser is absorbed by the powder, which is converted into thermal energy and thus
increases its temperature. The powder is at 170 °C and must be raised to just above
the Tm, which includes the phase change to molten polymer. When the powder melts,
it coalesces as described in §2.3. It should also be noted that only gravity and capillary
force drive consolidation as there is no mechanical pressure, such as in the injection
molding process16. To minimize warpage the build cylinder is kept near Tm to minimize
part warpage32. Therefore, unsintered powder is maintained at this elevated
25
temperature until the completion of the build. While necessary to ensure part quality,
this is the reason the powder degrades during the build.
Upon completion of the layer, the build cylinder piston is then lowered, typically 0.1
mm and the next lay of powder is deposited by the roller. Therefore, to print parts,
hundreds of layers of powder must be sintered to yield the final part. As each layer
can take between 30 to 60 seconds, which is highly dependent on many factors, the
full build takes many hours.
2.5.1.4. Post-Build
Upon build completion the build volume is cooled very slowly, typically between 24
and 48 hours in total, to minimize thermal gradients within the build cylinder that would
result in warpage and to provide sufficient time for stress relaxation to prevent
warpage32,33. The “part cake”, the term given to the unsintered powder in which the
parts are contained, is removed from the machine and parts are pulled from the
powder. The dense consolidated parts are approximately twice the density of the
powder16. At this point, the unsintered part cake powder can be recovered if it is to be
recycled and used in subsequent builds. The powder is typically sieved through a #70
mesh, 200 µm to remove large agglomerated particles. Interestingly virgin powder is
between 10 and 100 µM, which is significantly small than the mesh. Therefore, some
agglomerated particles could pass through the sieve.

26
Figure 2.12: The SLS Build Cycle

27
2.5.1.5. Advantages
The advantages of AM and the related field of RP are well documented. The ability to
build a physical model without tooling and tooling restrictions has ushered in an era of
unlimited possibilities for part design in combination with the ability to produce the part
nearly instantaneously. All AM techniques, such as the filament based FFF, the
photopolymer liquid based SLA or the powder based SLS have these advantages
However, due to the stark differences between the different AM techniques, there are
significant pros and cons for each method.
There are three major advantages of the SLS process over other AM techniques, such
as FFF. First, the unsintered powder acts as support material, which allows for parts
with undercuts and overhangs5. Second, the mechanical properties of the parts are
comparable to that of injection molded parts, allowing for end-use applications5.
Lastly, the breadth of material available for the SLS process is greater compared to
other processes. For example, FFF primarily uses poly-lactic acid (PLA) and
arcrylonitrile-butadiene-styrene (ABS) copolymer. In contrast, polyamide 11 (PA11),
PA12, polystyrene (PS), polyetheretherketone (PEEK), polyoxymethylene (POM),
polymethylmethylarcylate (PMMA) and high-density polyethylene (HDPE) have all
been sintered successful, however, PA12 accounts for 95 % of the industry usage16.

28
2.5.1.6. Disadvantages
The greatest disadvantage of the SLS process is the economics of the process
because of the long build times and the high-cost of the powder and the machine. The
cost of SLS will be discussed in more detail in Chapter 5 The complexity of the process
could be considered a disadvantage compared to other techniques such as FFF or
SLA. The complexity primarily originates from the requirement to melt only the 2D
cross section with the laser and no more and no less. The vast number of variables,
including the degree of degradation of the powder, makes successful melting a
daunting task, especially compared to a method such as FDM.
2.6. Aging and Degradation
In order to properly discuss the aging of PA12 powder, the wide and varied
mechanisms of aging must be defined and discussed. Aging is any change in the
molecular, supermolecular, or phase structure of a polymer that alters physiochemical
properties31. Aging will influence all aspects of the polymer’s life cycle from
manufacturing, storage and service. While all three are important, emphasis will be
placed on aging during the manufacturing period.
The cause of aging can be from one of four categories: Internal, External, Chemical
or Physical31. Chemical and physical processes are negligible in the SLS process but
internal process arising from thermodynamic instabilities could be important and

29
external processes, such as thermal degradation are known issues5,31,34–38. To ensure
a complete investigation, all of the factors known to cause polymer degradation as
presented the textbook, Resistance and Stability of Polymers, by Ehrenstein and
Pongratz, will be considered31. The factors are listed in Table 2.1.
Table 2.1: External and Internal Factors that contribute to polymer degradation.
External Factors Internal Factors
Temperature Chain Structure
Oxygen Concentration Molecular Weight and Distribution
UV Light Structure of the Molecular Chains
Humidity Radical Concentration
Contaminations Crystal Structure
Radiation Crystallinity
Mechanical Loads Morphology
Free Volume
Orientation
Residual Stresses
Stabilizers
Residual Catalyst
Temperature is of significant importance as the build chamber is between 80
and 170 °C.
Oxygen Concentration is a variable that is controlled in the SLS build
chamber and should be as low as possible as polyamides, including PA12 are
sensitive to oxidation.

30
UV Light is not a concern as there is no source of UV radiation within the build
chamber.
Humidity is not a concern as the build chamber is flushed with dry nitrogen
gas.
Radiation is of possible concern as heating bulbs are used to raise the surface
temperature of the build area and IR radiation is used to heat the powder.
Mechanical Load is not a concern.
Chain Structure is of interest but there is no control over this factor since
powder can only be purchased from select manufacturers.
Molecular Weight and Distribution are of interest but just as the chain
structure cannot be controlled due to external factors, there is no control over
these attributes of the powder. However, it could be monitored during the aging
of the PA12.
Radical Concentration is of no concern as polyamides are a product of a
condensation polymerization or ROP and not a free-radical polymerization.
Crystal Structure and Crystallinity are both concerns and will be monitored
as a function of aging.
Free Volume is a material property that cannot be controlled and should
remain relatively constant.
Orientation and Residual Stresses are not of concern.

31
In summary, temperature, oxygen concentration, molecular weight, radiation, crystal
structure and crystallinity will be considered in detail.
2.6.1. Thermal
Thermal degradation of polymers is any change to the molecular or supra-molecular
structure, i.e. the crystallinity, due to increasing the temperature of the material but not
due to any reactions with oxygen31. The increase of temperature increases the amount
of energy in the system, which increases the rate of degradation. For example, a rise
in temperature intensifies molecular vibration, which increases the probability of chain
scission. If the scission occurs near the chain end, this would slightly decrease the
MWD; however, random scission can dramatically decrease the MWD of the polymer.
The rise in temperature also increases the probability of chain-end reactions, as the
PA12 is bifunctional and the carboxylic acid and amine groups can react. This would
result in increasing the MWD.
2.6.2. Thermal-Oxidative
If the polymer is heated under an oxygen rich atmosphere, there are additional
degradation pathways as diatomic oxygen will readily react with intermediates of the
thermal degradation pathways or with PA12. For example, thermal-oxidation of PA12
results in a yellowing of the polymer due to the generation of impurities. It has also
been hypothesized that oxygen can initiate chain-scission pathways38.

32
2.7. Quantification Techniques
To observe the degradation of the powder both at the molecular and macroscopic
level, the powder properties will be measured using quantification techniques that are
dependent on either the molecular structure, i.e. the MWD, or on the particles, i.e. the
flowability of the powder. A wide variety of tests were conducted as some properties
are more susceptible to changes due to degradation and techniques vary in their level
of sensitivity to detect these changes.
2.7.1. Differential Scanning Calorimetry
As the melting of the powder by the laser is the crux of the SLS process, the maximum
amount of information regarding the melting of the PA12 is critical for understanding
changes in the powder. Thermal analysis, in particular differential scanning
calorimetry (DSC) is a powerful tool for measuring the heat flux during melting.
A DSC measures the energy required to heat a sample at a constant temperature
ramp, typically between 1 and 20 K/min under a constantly purged nitrogen
atmosphere. The temperature range should include the glass transition (Tg) and the
melting temperature (Tm) for semi-crystalline materials. The sample is placed within a
crucible, commonly made of aluminum or other inert materials depending on
application. The second crucible is empty and acts as the reference. The two crucibles
are placed upon heat flux sensors within the DSC oven, and the difference between

33
the sample and the reference is the energy required to increase the sample
temperature. From this data the following can be obtained:
Enthalpy of Melting (ΔHm)
Enthalpy of Fusion or Crystallization (ΔHf)
Melting Temperature (Tm)
Glass Transition Temperature (Tg)
Specific Heat Capacity at Constant Pressure (Cp)
Figure 2.13: A schematic of a DSC based on the Netzsch Polyma DSC61.

34
Figure 2.14 is a sketch of a DSC thermograms that shows the five main values of
interest when melting a polymer. When a polymer melts, it does not do so at a specific
temperature but rather over a temperature range, since the melting of a polymer is
more complex than a simple molecule (see §2.3). Therefore, the melting endotherm
of a polymer occurs over a temperature range in the DSC thermograms. From this
endotherm the following values can be measured: Tm,peak is the temperature at which
the greatest endothermic heat flux occurs; Tm,onset and Tm,end are determined by
drawing a tangent to the baseline of the thermogram and a tangent to the
thermograms just before and after Tm,peak; the ΔTm is difference between Tm,end and
Tm,onset; the total heat flux required to melt the polymer, ΔHmelting, is determined by
interpolating the baseline across the melting endotherm and calculating the area
under the curve. Of the five values, ΔHmelting typically is the least reproducible because
baseline must be interpolated, which can introduce error. There are also multiple
methods of baseline interpolation. For example Netzsch Proteus 7.0 offers these
possibilities: linear, tangential, sigmoidal, horizontal left or right started, tangential left
or right started and Bezier. The user must choose an appropriate method for baseline
interpolation and then chose proper bounds. Fortunately, the four Tm values do not
require user inputs and are significantly more reliable.

35
In the thermal analysis literature, ΔHfusion, is often used instead of ΔHmelting, as for many
materials and some polymers the melting endotherm and crystallization (solidification)
exotherm are quite similar. However, for polymers, including PA12, the endotherm
and exotherm are very different both in shape and the temperature at which it occurs.
Therefore, ΔHmelting will be used to emphasize this difference.
More importantly DSC data can be used to elucidate information about the molecular
structure, including the average molecular weight and the polydispersity polymer.
Based on polymer melting theory, § 2.4, an increase of Tm could indicate an increase
of average MW.
Figure 2.14: A sketch of a DSC thermogram showing the melting endotherm

36
2.7.2. Thermogravimetric Analysis
Thermal stability is a critical attribute of any polymer, especially the SLS grade PA12
as it must be stable at build-chamber temperatures over extended periods of time.
Thermogravimetric analysis (TGA) is a thermal analysis technique that measures
mass changes as a function of temperature and time. Using a precision oven and
microbalance (resolution of 0.0001 mg) small changes in mass can be detected, from
which moisture content, plasticizer content, decomposition temperature, etc. can be
quantified. There are two forms of TGA: dynamic and isothermal. Dynamic TGA ramps
the oven temperature at a constant rate, which can determine the decomposition
temperature of the polymer and any additives. Isothermal TGA quickly ramps the
temperature to a set point and then maintains this temperature to yield stability
information at the given temperature.
2.7.3. Powder Flowability and Packing Efficiency
There are numerous techniques to determine the flowability and packing efficiency of
powders, including polymer powders. For flowability, the techniques can be
subdivided into two general categories. First, a method that measure the elapsed time
required for a powder to pass through an orifice, e.g. a funnel. This is the premise
behind the hourglass. Second, a method that measures the angle bulk powder can
maintain without sliding (avalanching). The simplest of which is the angle of repose

37
test. A pile of powder is created and the angle of the pile relative to the surface is
measured. More advanced techniques include sprinkling powder on a flat surface and
then rotating the surface until the powder avalanches. To observe this phenomena for
dynamic powders, powder can be placed in a rotating cylinder and the powder shape
can be measured, see Figure 2.15.In this apparatus, the angle of repose is both
dependent on the powder and the angular velocity of the cylinder. This dynamic angle
of repose could be valuable, as spreading the powder is a dynamic process.
Figure 2.15: A cross-sectional schematic of the dynamic angle of repose apparatus

38
3 LITERATURE REVIEW
3.1. Powder Flowability
As the powder is transferred from the feeder bins to the part bed by a roller system,
the flowability of the powder is of great importance as the quality of powder deposition
affects the final part quality18,19,39–41. There are numerous factors that influence how
well particles flow, including shape, surface roughness, interparticle friction, etc., and
there are numerous techniques for powder flow quantification39,42. Krantz et al suggest
a suite of techniques to determine particle size distribution, the bed expansion ratio,
the angle of repose and the avalanche angle and the cohesion results from powder
rheology would sufficiently describe powders used in industrial applications, include
SLS. Building off this work, Ziegelmeier et al suggested specific tests, including those
of Krantz et al that would be applicable to packing efficiency within the build chamber
and the flowability during the layering the powder.
The work of Ziegelmeier et al and Krantz et al did not focus on recycled powders but
the results of their analysis of virgin powder suggested that degradation could
influence flowability significantly. These two studies showed that flowability varies
between grades of SLS powder and is a function of the temperature at which the
powder was tested. If merely increasing the temperature changes the flowability of a
powder, then degradation of that powder surely could be significant.

39
3.2. Degradation Pathways
Before the effects of thermal degradation of the powder can be explored, the
degradation pathways should be understood. Unfortunately, only poorly supported
hypotheses have been suggested, primarily in the publications by Wudy et al, at the
University of Erlangen. While underwhelming, it is still necessary to review these
hypotheses and critically examine the implications on the SLS process, especially
from the recycling and cost perspective.
A recent hypothesis from Wudy et al is that a post-condensation polymerization would
increase the average molecular weight and would be classified as thermal
degradation31,43,44. While plausible, it assumes that the polyamide powder was
produced via a condensation polymerization of 12-aminolauric acid. Interestingly, the
schematic of this “post-condensation” polymerization presented in the article actually
shows monomeric laurolactam reacting with terminal carboxylic acid of PA12, which
is a ROP and not a condensation reaction, Figure 3.1. This is critically flawed, as ROP
would not occur at the conditions within the SLS build chamber as catalysts, typically
cationic, are required for polymerization. These catalysts are removed from the
polymer during purification as they are typically very expensive and toxic to humans.

40
In addition, this polymerization would not be a condensation polymerization but a
ROP.
Figure 3.1: The polymerization of PA12 from either laurolactam or 12-aminolauric acid via a ROP or a condenstation polymerization, respectively. Note that ROP yields PA12, while the
condenstation reaction yields PA12 and water.
For thermal-oxidative degradation, Wudy et al have suggested that PA12 radical
species are formed at elevated temperatures (170 °C), which initiates a series of
possible chemical reactions that would result in cross-linking and/or chain-scission.
41
However, there is no evidence that this is the reaction pathway that actually occurs,
let alone the cause of the observed increase of average molecular weight. First, this
mechanism has only been observed in PA6,6 and one cannot assume a similar
reaction will occur with PA1245. Second, the authors provided no data supporting the
hypothesis that this pathway is the cause for the observed changes. Assuming
hydrogen abstraction at the α-carbon due to stabilization of the secondary carbon on
the adjacent amide can be justified46,47. However, this rationale nor any other
supporting data was provided by the authors. Work by Brodski et al used electron
spin resonance spectroscopy to observe radical formation of PA 6, 6,6; 6,8; 6,10; and
11 irradiated by γ radiation47. It was found that radical formation occurred
predominantly at the α-carbon and could lead to their chain-scission or cross-linking.
Before jumping to the conclusion that this occurs in the SLS powder, electron spin
resonance spectroscopy could be used to observe if this phenomena occurs for PA12
as well.
It is unfortunate that the current literature has audaciously included statements
regarding the complex chemistry of polymer degradation; however, this topic must be
addressed if the recycling process is to be fully understood. For the time being, until
the true degradation pathway occurring during the SLS process can be elucidated,
these assumptions must be disregarded to ensure that the data is analyzed in good
faith. Therefore, the assumption must be that changes are occurring at the molecular
level that could result in increased or decreased average MW.

42
3.3. The Effects of Thermal Degradation
It has been well documented that printing with thermally degraded powder yields
inferior parts, and, in extreme cases, the print job can completely fail. The major
observable issues of these inferior parts are a poor surface finish and a decrease in
the mechanical properties. However, the causes for these issues are not well
understood.
3.3.1. Molecular Weight
One of the most important properties of any polymer is its molecular weight distribution
(MWD) as countless other properties, such as Tm, are highly dependent on it25.
In the scope of degradation, molecular weight (or, more specifically, the average
molecular weight) must be considered as degradation at the molecular level which, in
turn, can include chain-scission, additional polymerization or cross-linking. All of which
will increase or decrease the average molecular weight. As a result, bulk properties
such as Tm or melt viscosity will be altered, which ultimately will affect the sintering
process.
Pham et al reported a significant increase in molecular weight as a function of the
number of times the powder was recycled. Using gel permeation chromatography, it
was shown that and the molecular number average both increased. In

43
0
2.5
5
7.5
10
0
250,000
500,000
750,000
1,000,000
Virgin 1 Build 2 Builds 3 Builds
Average Molecular Weight
Mw PDI
0
2.5
5
7.5
10
0
40,000
80,000
120,000
Virgin 1 Build 2 Builds 3 Builds
Average Molecular Number
Mn PDI
addition there was a significant broadening of the PDI from approximately 2 to 8,
Figure 3.2. The increase of PDI is noteworthy since this increase indicates the
presence of extremely long chains. Chains of this length are mostly formed when the
end groups of two or more of the original polymer chains reacted to form massive
chains. This is a major issue because extremely long chains will increase the zero-
shear viscosity, which will in turn limit coalescence16,48,49.
3.3.2. Surface Finish Issues
Surface finish quality is another major issue encountered when printing with recycled
material and has been well documented in the literature. The most common
phenomena observed is the “orange peel” effect, as the surface of the final part has a
Figure 3.2: GPC results of degraded PA12 from Pham et al6

44
texture similar to that of an orange6,7. While a known issue, surface quality was first
quantified in 2015 by Petzold et al and a significant increase in surface roughness was
observed in samples printed with aged powder50.
3.3.3. Inferior Mechanical Properties
A popular method for determining the effect of thermal degradation of the powder is
to print parts, such as tensile bars and measure the mechanical properties such as
tensile strength, fracture strain, the elastic modulus, etc. The literature has clearly
Figure 3.3: The mechanical properties of parts printed with recycled powder, from Wudy38.

45
shown that mechanical properties are highly dependent on the degree of degradation.
For the purposes of this review, it is not practical nor necessary to investigate all trends
but a representative sample will be shown to highlight that it is a significant issue.
Interestingly the reasons for the decrease in mechanical properties are not well
understood and many hypothesis exists for why there is a significant change in
Figure 3.4: The mechanical properties of parts printed with recycled powder, from Gornet35.

46
mechanical properties. For example, one hypothesis is that the recycled powder does
not consolidate (sinter) as completely as virgin powder22.
These results demonstrate the necessity for powder characterization before the build
for several reasons. If minimum strength properties are to be expected, these results
suggest the reuse of recovered power can be dangerous, since degradation of the
powder significantly weakens the parts. If recycling of the recovered powder is to be
successful, powder characterization must be predictive of final part quality. To assure
quality control, one must be able to determine the minimum refresh rate of virgin
powder to improve the properties of the parts printed form recycled powder.
Figure 3.5: The mechanical properties of parts printed with recycled powder, from Zarringhalam27.

47
3.4. Recycling Literature
3.4.1. Choren et al - 2001
Even with the high cost of powder and the known issues with recycling recovered
powder, it is surprising that the first scholarly article on the subject was published in
2001 a full 15 years after the invention of the SLS process at the University of Texas
at Austin by Carl Deckard 34,51. The original study on recycling by Choren et al from
the Milwaukee School of Engineering was a cursory exploration of the mechanical
properties of parts as a function of powder “age” and the laser power. Laser power
was of interest as it was and still is a common practice to increase laser power when
recycled powder is used. This unwritten rule has been based on empirical
observations, but there have not been any rigorous analyses to support the general
rule of thumb.
The results confirmed that recycled powder yields parts of poorer quality but the study
did not yield any meaningful results as the design of experiments was unfortunate.
First, the powder “age” was based on the number of build cycles, which is not a fixed
value for each build and powder used in the build experiences had varied thermal
histories depending on the location within the SLS machine. The mechanical
properties, such as tensile strength, were measured and plotted while simultaneously
varying laser powder and powder age. Therefore it is impossible to determine the

48
effects of either the powder aged or the laser power as both independent variables
were changed at the same time.
3.4.2. Gornet et al - 2002
The 15 years thereafter has even more surprisingly yielded very few investigations of
the thermal degradation of the PA12 that causes the difficulties when trying to recycle
the SLS powder. The next chronological publication on the subject matter came a year
later from Gornet et al from the University of Kentucky. Like Choren et al, the goal of
the study was to improve the final part quality without first investigating the root of the
problem.
The notable improvement was measuring powder properties rather than solely
focusing on the final part properties. As the powder properties must certainly influence
the final part quality and properties, it is only natural and necessary to measure powder
properties as a function of thermal history. The powder’s melting temperature was
determined via DSC and the melt flow rate (MFR) was determined using a Melt Flow
Indexer (MFI). Two interesting trends were noted. The Tm increased and the MFR
decreased as a function of “builds”. Like Choren et al, Gornet et al aged powder by
using it in subsequent builds. The Tm increased approximately 1.5 K, while the MFR
decrease from over 50 g/10 minutes to less than 20 g/10 minutes. Surprisingly the 1.5
K increase of Tm was disregarded by the authors as insignificant and was not

49
discussed. Rather, the authors focused heavily on the MFR, which was touted as a
potential measurement for predicting final part quality when using recycled powder
even though no explanation for the increasing Tm or decreasing MFR was ever
offered. This could have been attributed to the fact that the authors’ goal was to ensure
quality SLS builds at the University of Kentucky Rapid Prototyping Center rather than
the fundamental science behind the thermal degradation of PA12.
3.4.3. Dotchev, Pham and Yussoff – 2008 to 2009
The next major contribution to the recycling literature was in 2008 and 2009 in two
papers by Dotchev, Pham and Yussoff6,7. The research was a collaboration between
Cardiff University in the United Kingdom and the International Islamic University in
Malaysia.
This study may be one of the most comprehensive studies of the degradation as the
powder was aged between 12 and 200 hours at 100, 120, 140, 150, 160 and 180 °C
and analyzed by MFI, DSC, SEM and GPC. The work also included data from builds
using aged and recycled powders. The culmination of the work was a workflow for
testing and refreshing the recovered based on the MFI data.
First, from the results of printing with powder with a known MFR, it was shown that if
the MFR was less than 25 g/10 minutes, the surface quality decreased stepwise until

50
the MFR was 18 g/10 minutes. At this point the surface quality was described as very
bad. From this information, the recycling workflow was developed and published.
After recovering the powder, the first step would be to measure the MFR of the powder
and classify it according to Table 3.1. If the powder has a MFR of 24 or less, the
powder would have to be refreshed with virgin powder to increase the MFR to above
25 g/10 minutes. To estimate the ratio of recovered powder to virgin powder, a
blending curve was generated, Figure 3.7. The blending curve indicates that if the
MFR of the powder is ~21 g/10 minutes, then 30 % virgin powder would be required
and 40 % if the MFR is ~18 g/10 minutes.
Figure 3.6: Surface quality of parts printed with SLS powders with decreasing MFR, from the work of Dotchev7.

51
Table 3.1: The Dotchev Classifcation of Recovered Powder
MFR (g/10 min) Classification
> 50 A (virgin powder) 45 – 49 B1 40 – 44 B2 35 – 39 B3 30 – 34 B4 25 – 29 B5 18 – 24 B6 (Surface Quality Issues)
< 18 C (Unusable Powder)
The work of Dotchev greatly improved the recycling of PA12 by providing the first
workflow for recovering powder, quantifying the powder and determining the required
refresh rate to ensure surface finish quality of the final part. This work flow could be
even more powerful if part strength and not only surface quality were a metric for
determining the refresh rate. Even with acceptable surface finish, the parts will be of
Figure 3.7: The Dotchev Blending Curves

52
inferior strength compared to virgin powder, as shown by Gornet and Choren. Lastly,
the blending curve only includes data for powders with an MFR of between 18 and 48
g/10 minutes. The only drawback of the workflow is that MFI is time consuming and
required 10-20 grams of powder. If multiple tests are conducted during refreshing,
technician time and powder consumption would become significant, especially
compared to a method such as DSC that only requires a few milligrams and sample
prep takes only a minute or two.
3.4.4. Mielicki – 2014
It has been observed that powders recovered from the SLS part cylinder have an
increased particle size distribution due to particle agglomeration. It has been
hypothesized that this agglomeration is occurring at the interface of the powder acting
as the mold and the melted powder. The work of Mieklicki et al further reinforced this
hypothesis as agglomeration was not observed in oven aged powder5,37,43.
Interestingly, it was shown that the particle size distribution does not change when
powder is aged in the oven at 174 °C.
3.4.5. Wudy et al – Present
Since the work of Dotchev et al in 2009, the recycling of powder literature has for the
most part come from universities in Germany with the majority from the LKT at the
University of Erlangen. Wudy et al has published a series of papers on the effects of

53
powder degradation, but the work has primarily been a repeat of work done by Choren
et al, Gornet et al and Dotchev et al6,7,34,35,38,43,44. The only significant contribution to
the field has been the verification of previous results and no new techniques to
improve recycling efficiencies have been provided.
3.4.6. Summary
In conclusion, the literature has thoroughly documented that printing with recovered
powder yields inferior parts with decreased mechanical properties and/or surface
finish issues. The decrease of the MFI has been well documented in numerous
publications, which in conjunction with GPC data from Pham et al has confirmed an
increase of molecular weight as the powder is thermally degraded. Lastly, DSC has
been disregarded as a method to quantify degradation, since authors have questioned
if the technique is sensitive enough.
The vast majority of publications have focused on demonstrating the effects of
degradation on end-use parts, Dotchev et al were the only authors to develop a
workflow for recovering and blending powder to ensure an acceptable surface finish.
However, no authors have created an analogous protocol for ensuring mechanical
properties.

54
4 PATENT REVIEW
The patent literature is a rich source for possible solutions for preventing thermal
degradation and/or improving the recyclability of recovered powder. While there are
countless patents, primarily from Evonik Degussa GmbH and Arkema, Inc., the two
most relevant or promising will be discussed.
4.1. Diamine- and Diacid-regulated PA12
As post condensation is an issue with many commercially available PA12 powders
due to the high temperatures and low moisture content within the SLS machine,
several patents aim to prevent these reactions38,43,52,53. The method of choice to
prevent condensation is to use diamine- and/or diacid-regulated PA12. The reason
post-condensation is undesirable is that is increases the MWD significantly and in turn
the melt viscosity, which can decrease the consolidation of the powder. By introducing
diacids and/or diamine, the stoichiometric ratio of carboxylic acid to amine end groups
is shifted away from 1:1. This decreases the probability of end group condensation
reactions. The addition of these additives was successful in preventing condensation
when the powder was exposed to build chamber conditions since the solution viscosity
did not increase, as unregulated PA12 would. Unfortunately the addition of diacids
increase the brittleness of the part while the diamines cause gelation issues52.

55
The promising viscometry results lead to further work by Evonik Desugga GmbH that
included mixing of diacid- and diamine-regulated PA12 powders53. The rationale for
this idea was not provided; however, the strength of parts printed with this mixture of
powders did not exhibit the issues that arose when just diacid- or diamine-regulated
PA12 powders were used. Additionally, since the amine and carboxycylic acid groups
were isolated in different powder particles, condensation reactions could not occur,
which prevented an increase of the MWD. This patent should solve some if not most
Figure 4.1: Diamine- and Diacid-Regulated PA12 Particles

56
of the issues related to recycling of the recovered powder; however, there does not
appear to have been widespread adoption of the technique. Implementation has either
not occurred or other unknown factors have limited the impact of this invention.
4.2. Hydrolysis
Instead of attempting to prevent condensation reaction, which increase the average
MW, US2009/0291308 suggests that the recovered powder could be treated to initiate
chain scission of the PA12 by hydrolysis54. The patented process required the user to
recover the powder and transfer the material to a container in which the material can
either be water or steam treated. This promoted chain scission as the amide bond is
a product of a condensation reaction and the addition of water would drive this reaction
in reverse according to Le Châtelier's principle.
The results shown in the patent strongly suggest that this technique can reverse the
effects of degradation of observed printed parts; however, the process is complex and
true cost savings were not demonstrated. There are several reason that this process
is neither practical nor economical. First, the approximate average MW of the
recovered powder must be determined. As the goal of this treatment is to decrease
the average MW to that of virgin powder, the degree of water or steam treatment must
be controlled. Once treated, the powder must be completely dried to remove free
water and bound water must be reduced to an acceptable level. This can time

57
consuming as PA12 is a hydrophilic polymer. At this point the approximate MW should
be determined again to confirm successful treatment.
This patent may successfully solve the degradation issues; however, as widespread
implementation of this process has not occurred, a cost-benefit analysis might explain
why. Therefore it is imperative to continue to search for cost-effective solutions to the
problem of increasing molecular weight.

58
5 COST-ANALYSIS
Traditional plastic processing techniques use commodity and engineering
thermoplastic pellets. These resins cost generally less than $5 per kilogram and
account for very little of the total cost of a final product. In unmistakable contrast, the
$100 per kilogram cost of the SLS grade thermoplastic powder contributes
significantly to the cost of the final part5. Therefore, it is essential to consider the
conversion rate of powder into final parts.
5.1. Cost versus Injection Molding
Prior to discussing the implications of recycling and the refresh rate, the cost of SLS
should be compared to that of a traditional manufacturing method such as injection
molding. One of the most comprehensive investigations into the costs of SLS in
comparison to injection molding was conducted at Loughborough University in
Leicestershire, United Kingdom in 2006 by Ruffo et al55. While nearly a decade old, it
still provides an excellent comparison. The Euro (€) was chosen by the authors, and
these values were converted to US Dollars at a rate of $1.20 to €1, as the exchange
rate hovered around that value for the fourth quarter of 2005 and the first quarter of
2006.

59
The authors accounted for dozens of factors that influence the cost of SLS including
powder costs, machine costs, building overhead, production overhead, maintenance
and a technician’s salary. The machine was depreciated over 8 years and it was
assumed that the machine was operating at 60 %. The powder was priced at $70 per
kilogram for the powder and the machine at $435,000. The cost of injection molding a
Figure 5.1: Cost comparison of SLS versus Injection Molding

60
generic part was compared to producing the same part using SLS. For the cost of LS,
two models were investigated when virgin powder was used for all builds. In addition,
a 50 % recycling scenario was included. Depending on the model used, the cost per
unit breakeven point was 8,000 and 11,000 parts, and when recycling powder was
utilized at 50% the breakeven point grew to approximately 15,000 parts. This is
because powder is being reused and not thrown away, so the cost per part does not
include as much waste powder that is not converted into parts.
5.2. Refresh Rate Thought Experiment
In most plastics processing, scrap material is a trifling nuisance that is dealt with by
collecting scrap and grinding the scrap for reuse. For example, in the injection molding
process, the sprue and runner system can be collected and ground. The regrind, can
be mixed with virgin pellets with no significant decrease in the properties of the final
product56. In stark contrast, the “waste” material in the SLS process cannot be simply
recovered and reused. The manufacturers of SLS powder recommend various
refreshing protocols for recycling powder that involve mixing a percent of virgin powder
with recovered powder. However, with a range of 30 to 70 % virgin powder, the cost
and long term powder quality can vary greatly.

61
Table 5.1: The suggested refresh rates for four SLS powders manufactured by EOS GmbH or 3D systems. The range is from 30 to 70 virgin powder.
Manufacturer Product Name Refresh Rate
EOS GmbH PA2200 30 to 50
PA3200 50 to 70
3D Systems DuraForm 30 + 30 (overflow)
GF DuraForm 50 +
A thought experiment can highlight the dramatic effects of different blending regimes.
For this experiment, it is assumed that SLS grade powder costs $100 per kilo, 15 %
of the powder is consumed during a build, 85 % of the powder is recovered, the build
chamber is 30 x 30 x 30 cm3 and the density of the powder is 0.46 g/cm3. Therefore
one build chamber holds approximately 12.5 kg and a build would consume 1.875 kg
or 15 % of 12.5 kg. With a build chamber of this size, it would cost $1250 for sufficient
powder for the initial build with virgin powder.
For the thought experiment, refresh rates of 15 % to 65 % will be considered at
intervals of 10 % given that 15 % was the minimum refresh rate as this amount of
powder is required for a subsequent build to compensate for the 15 % consumed in
the prior build. When looking at the powder used in subsequent builds, it has be
categorized into one of three groups. The first group considered high quality powder
will be virgin powder and powder used in 2 or fewer prior builds based on the work of
Dotchev et al. Powder that was virgin at the start of the prior 3 or 4 builds will be the

62
midgrade material. The final group will be the virgin powder that has been used in the
previous 5 or more builds.
When looking at the 6th build, Figure 5.2, the amount of high quality powder is low if
refreshing at 15 or 25 %, while when refreshing at a rate of 35 or 45 %, over half of
the powder is relatively new. Lastly, when refreshing at 55 or 65 %, there is almost no
powder that has been through the build cycle more than 5 times.
For the subsequent builds, i.e. builds using recovered powder, the price per build
ranges from $187.50 to $812.50, compared to the $1250 for the initial build with virgin
$0
$250
$500
$750
$1,000
0%
25%
50%
75%
100%
15% 25% 35% 45% 55% 65%
2 or less 3 to 4 5 or more Cost per Build
Figure 5.2: Effects of Refresh Rate for the 5th build

63
powder. While the increase is significant, more importantly the ratio of high quality to
medium to low quality powder changes dramatically.
Looking more closely at the 45 % to 65 % refresh rate where greater than 75 % of the
powder is of higher quality, it is important to note that there is a significant change in
cost per build. For the 45 % refresh rate, the cost of each subsequent build is $562.50
while for 65 % the cost is $812.50. This an increase of $250 dollars or 44 %. This is a
nontrivial price difference yet powder manufacturers suggest that the refresh rate
should fall somewhere in that range. This adds significant cost if unnecessary high
ratio virgin powder is blended with recovered powder.
In conclusion, if the cost of SLS is to decrease, one major area that must be improved
upon is the science behind the recycling of recovered powder. This simple thought
experiment has demonstrated that staying more precisely within manufacturer’s
suggestions can cut the raw material cost by more than half.

64
6 METHODOLOGY
6.1. Introduction
The experimental work can be subdivided into three major areas, which are the:
1. Controlled thermal degradation, aging, of the PA12 under conditions that
emulate the DTM Sinterstation 2500 SLS machine.
2. Refreshing aged powder with virgin powder
3. Quantification of the powder quality
Figure 6.1: The experimental workflow
The characterization can be split into two subgroups, based on if the results are
dependent on molecular scale (DSC, MFI and TGA) or macroscopic scale properties

65
(Repose Angle, Pourability and Apparent Density) of the powder. As previous work
has focused heavily on MFI, see §3.4, this was one of the critical measurements to
compare this work with the literature. However, due to recent advances in DSC
sensitivity, this technique was used extensively. Powder flowability and packing were
explored in a cursory manner as the literature contained limited information.
6.2. Materials
All aging experiments were conducted with commercially available PA12, PA650
Nylon 12 Laser Sintering Material manufactured by Advanced Laser Systems (ALM),
LLC (Temple, Texas). The powder has a bulk density of 0.46 g/cm3, average particle
size of 55 µm, a particle size range (D10 to D90) of 30 to 100 µm and a sintered
density of 1.02 g/cm3. The listed Tm is 181 °C and a melt flow rate (MFR) of 50 g/10
minutes at 235 °C, 5.0kg and pre-heated for 3 minutes (the die size was not
specified)57.
6.3. Controlled Aging
As recovering powder from builds introduces a multitude of variable into the thermal
history of the powder due to significant temperature gradients and varied build times,
it is not practical, economical or beneficial to age the powder within the SLS machine
when studying the aging process. To emulate the build chamber of a DTM
Sinterstation® 2500 a Lindberg/Blue M™ Vacuum Oven manufactured by Thermo

66
Fisher Scientific (Waltham, Massachusetts) with digital temperature controller and a
nitrogen purge system was used. Industrial grade nitrogen supplied by Airgas
(Radnor, Pennsylvania) was used to purge the oven since the Sinterstation® 2500
purges the build chamber with nitrogen and will not operate if the oxygen
concentration is greater than 5 %. No more than 100 g of powder was aged in a 1750
mL Pyrex® drying trays at 80, 100 and 170 °C for either 2,4,6,8,12, 24, 48, 96 or 192
hours (1/12, 1/6, 1/4, 1/3, 1/2, 1, 2, 4, 8 days). After aging, the powder was stored under a
nitrogen atmosphere at less than 5 °C in HDPE Nalgene® bottles to minimize post-
aging degradation.
6.4. Recycling Scheme – Blending
Given that both the manufactures and the literature has strongly emphasized the
importance of refreshing degraded powder with virgin powder the effects of this
addition will be investigated. Specifically by adding 20 %, 40 % or 60 % virgin powder
to the powder aged at 170 °C for 0 to 96 hours. Preliminary results showed that the
effects of aging were significantly greater at 170 °C, so to observe the trends due to
blending this temperature subset was selected. To ensure mixing, a minimum of 5 g
of refreshed powder was prepared by vigorously shaking the powder in a small
Nalgene bottle for 60 seconds. Mixing was not a concern as the virgin and aged
powder should mix well according to the work of Venables et al on the mixing of
powders58.

67
As recycling is a repetitive process that occurs at the end of each build, the blended
powder was also aged an additional 12, 24 or 48 hours at 170 °C to emulate the
degradation during a print using refreshed powder
6.5. Thermal Analysis
The crux of the SLS process is melting the PA12 with the laser to sinter the cross-
sections that ultimately will combine to create the part but at the same time, not melt
any additional powder. Both DSC and TGA were used to fully characterize the thermal
properties.
6.5.1. Differential Scanning Calorimetry
6.5.1.1. Degradation Analysis
It is well know that the melting temperature of the PA12 powder increases due to
degradation over time but significantly more information can be gleaned from the DSC
data. All samples were analyzed using the NETZSCH DSC 214 Polyma® with sealed
Concavus® crucibles. Samples were heated from 30 °C to 200 °C at 5 K/minute under
a continuously purged (20 mL/min) nitrogen (UHP Nitrogen, Air Gas) atmosphere. The
NETZSCH Proteus® 7.0.1 analysis software was used to determine Tm,onset, Tm,peak,
Tm,end, ΔHmelting. From Tm,onset and Tm,end the melting temperature range was
determined. All samples were tested in triplicate.

68
6.5.1.2. Recycling Scheme – Blending
To determine the effect of adding virgin powder to the aged powder, sufficient material
was mixed to yield at least 5 grams of either 20, 40 or 60 % virgin to aged powder
mixtures. The DSC analysis as described in §6.5.1.1 was repeated for these samples.
6.5.2. Thermogravimetric Analysis
All samples were analyzed using the NETZSCH TG 209 F1 Libra®. Samples of
approximately 5 mg were heated under a nitrogen atmosphere (Purge Gas: 20 mL/min
of Ultra High Purity (UHP) N2; Protective Gas: 20 mL/min of UHP N2) in an alumina
crucible to 600 °C at 20 K/min. Mass loss as a function of temperature was recorded
by the internal microbalance with a resolution of 0.0001 mg. All samples were tested
in triplicate. The data was analyzed using the NETZSCH Proteus® 6.1.0B.
6.6. Melt Flow Index (MFI)
As the recycling and consolidation literature has suggested that the increase viscosity
of the melt can be indicative of degraded powder and result in poor consolidation, the
MFR of the powder was determined6,7,16,34,35,38. The MFR was measured in triplicate
for all aged samples in accordance with ASTM D1238-13, Procedure C59. In short, the
powder is poured into a vertical barrel, which is at 235 °C. The polymer melts and then
equilibrates at this temperature for 3 minutes. The polymer melt is then forced through

69
a die with a diameter of 2.096 +/- 0.005 mm by a 5.0 kg weight placed upon a rod,
which is slightly smaller than the barrel. The mass of the extrudate, the time to extruder
that mass, and the displacement of the rod are then used to calculate the MFR and
MVR.
6.7. Powder Flow Analysis
There are two ASTM standards used to quantify the followability of a polymer powder.
Standard D1895-96 for the pourability and the apparent density, which determines the
rate at which the powder flows through a funnel and the amount of powder required
to fill a fixed volume, respectively. Standard C1444 measures the angle of repose for
a 1.5 inch tall powder pile created by pouring powder through the same funnel used
in D1895-96.
6.7.1. Pourability
Comparable to the hourglass, which measures time by particle flow through a funnel,
the ASTM standard determines the pourability of a powder by measuring the elapsed
time for powder to flow through a standardized funnel. The funnel was manufactured
by Plastic Consulting, Inc (Palm City, Florida) was used in accordance with the ASTM
D1895-9660. The dimensions of the funnel are provided in Figure 6.2.

70
6.7.2. Apparent Density
The apparent density was determined per ASTM D1895-96, Test Method A. In this
test, the powder flows through the funnel, which is placed above a 100 mL beaker
(3.99 cm in diameter, 7.98cm tall) until full. At which point mass of the powder within
the beaker was weighed, from which the apparent density was calculated.
Figure 6.2: A schematic of the funnel for ASTM D1895-96, the standard for measuring powder pourability and angle of repose

71
6.7.3. Angle of Repose
The powder is allowed to fall from the funnel onto a surface normal to the funnel flow
direction. The angle of the powder pile relative to this surface is then measured to
determine the angle of repose. The greater the angle the poorer the powder flows.
The tests were conducted in accordance with ASTM C 1444b, except instead of using
a glassy paper for the surface, this sheet was replaced with a sheet of printer paper60.
The angle was determined in accordance to the standard by passing sufficient powder
through the funnel until the powder cone was 1.5 inches (3.81 cm) tall. The radius of
the base of the cone was determined at 4 equispaced predetermined points using
concentric circles printed on the sheet of paper.
b ASTM C 1444 was withdrawn from the standards but due to a lack of application in industry even though the test yields valuable information.

72
7 RESULTS
7.1. Thermal Analysis
A wealth of information was gleaned from the thermal analysis, in particular the DSC
data. The Netzsch DSC 214 Polyma® was sensitive enough to reproducibly detect
changes in the thermal properties, specifically the melting temperature, to differentiate
powders based on the degree of aging.
7.1.1. DSC – Aged Powder
The DSC thermograms for the aged powder were analyzed to determine the Tm,onset,
Tm,peak, Tm,end and ΔHf for the melting endotherm. The results shown in Figure 7.1,
170 °C
175 °C
180 °C
80 °C 100 °C 170 °C
Virgin 12 h 24 h 48 h 96 h 192 h
Figure 7.1: Tm,onset for the aged powder. Error Bars: +/- 1 Standard Deviation (SD)

73
Figure 7.2, Figure 7.3 suggest that the Tm,onset does not change when the powder is
aged. While Tm,peak and Tm,end are both dependent on the time at 170 °C but not at 80
°C and 100°C.
180 °C
185 °C
190 °C
80 °C 100 °C 170 °C
Virgin 12 h 24 h 48 h 96 h 192 h
Figure 7.2: The Tm,peak for the aged powder. Error Bars: +/- 1 SD
180 °C
185 °C
190 °C
80 °C 100 °C 170 °C
Virgin 12 h 24 h 48 h 96 h 192 h
Figure 7.3: The Tm,end for the aged powder. Error Bars: +/- 1 SD

74
The most important trend is the increasing Tm,peak and Tm,end for powder aged at 170
°C for 0 to 96 hours but also the decrease for powder aged for 192 hours. Given the
unchanged Tm,onset and the increasing Tm,end the metling range, ΔTm increased as a
function of aging for the powder stored at 170 °C, Figure 7.5.
These results are of significant importance for the SLS process since narrow and
known melting temperature range is necessary for successful consolidation of the
powder as the laser power is finely tuned16. With this deviation in the end of the melting
endotherm, it could be possible that the aged powder would not melt completely. If the
powder does not melt, consolidation would be incomplete. This could have serious
85 J/g
90 J/g
95 J/g
100 J/g
105 J/g
80 °C 100 °C 170 °C
Virgin 12 h 24 h 48 h 96 h 192 h
Figure 7.4: The ΔHm for the aged samples. Error Bars: +/- 1 SD

75
consequence as Zarringhalam has shown that incomplete sintering is a known issue
that decrease part quality21,22,27.
This novel result agrees with the results of previous work by Choren, Gornet and
others; however, only the increase of peak melting temperature was observed, which
in and of itself is important. However, it is much more significant that the melting
temperature range onset remains constant yet the end increases as a function of
powder aged. In combination with the small increase in the ΔHmelting, the energy
required to melt the powder increases because more energy is required melt the
powder and the final temperature that the powder must reach is higher.
0 K
5 K
10 K
15 K
Virgin 12 h 24 h 48 h 96 h 192 h
170 °C
Figure 7.5: The ΔTm for samples aged at 170 °C. Error Bars: +/- 1 SD

76
Traditionally this requirement for more energy has either been neglected, which would
result in partial sintering, or the laser power was increased arbitrarily when recycled
powder was used. From these results, a model to predict laser power based on the
melting endotherm would be the next logical step in improving the recycling of PA12
powder.
A very simple equation could be developed to account for the increase in necessary
energy. For example
𝑃 = 𝛼 ∙ 𝑃0𝑇𝑚,𝑒𝑛𝑑
𝑇𝑚,𝑜𝑛𝑠𝑒𝑡 (7.1)
where P is the laser power in watts, P0 is the default laser power, 12.0 W, and α is an
empirically determined correction factor that would intrinsically account for the
increase of ΔTm. As α would have to be determined empirically, there is significant
work that is required; however, once this correction factor is known, the laser power
input would no longer be a parameter typically determined by operator hunches. In
addition, with modern DSC instrumentation with autosamplers and automatic data
analysis, minimal time would be required to obtain the necessary data. Even with
industrial DSC time costing between $50 and $100 per hour, the test would cost $50.
This cost is trifling compared to the thousands of dollars of wasted material and
opportunity cost lost due to repeating a SLS print job because the laser power was

77
incorrect. Even the capital investment of purchasing a DSC could be justified for
manufacturers running the multiple SLS machines.
7.1.2. TGA – Aged Powder
Unlike the DSC results that showed an obvious trends for all three of the aging
temperatures, the TGA results showed no explicit trends as a function of time at
elevated temperatures. As the powder is neat PA12, there was a single mass loss
event, for which the onset temperature and the inflection temperature was determined.
The inflection temperature is defined as the temperature at which the first derivative
of the mass is the greatest—or in other words, the temperature at which the material
lost mass at the highest rate.
The decomposition onset temperature for the aged powder showed no significant
change for the powders aged at 80 or 100 °C, Figure 7.6. There is a possible
decreasing trend for the powder aged at 170 °C, however, the TGA analysis did exhibit
great reproducibility, which leads to uncertainty in this trend. Similarly the
decomposition inflection temperature showed no trends either, Figure 7.7. Therefore
TGA is not sensitive enough to detect the small changes in the molecular structure
and is not a technique suitable for quantifying the degree of degradation for PA12
powders.

78
Figure 7.6: TGA results, the decomposition onset temperature of aged powder
Figure 7.7: TGA results, the decomposition inflection temperature of aged powder
400 °C
410 °C
420 °C
80 °C 100 °C 170 °C
De
co
mp
ositio
n O
nse
t T
em
pe
ratu
re
Virgin 12 h 24 h 48 h 96 h 192 h
425 °C
435 °C
445 °C
80 °C 100 °C 170 °C
De
co
mp
ositio
n In
fectio
n T
em
pe
ratu
re
Virgin 12 h 24 h 48 h 96 h 192 h

79
7.1.3. Particle Size Dependent Degradation
Since thermal analysis showed a strong trend as a function of degradation, degraded
powder was analyzed after fractionating the powder by particle size using mesh sieves
(53, 75, 125 and 212 µm). Since particle size does not increase significantly during
oven aging (see §3.4.4), powder was recovered from the part cake of a random build.
As expected, the peak melting temperature of the fractions was greater than virgin
powder; however, Tm,peak was also dependent on particle size. The results showed
degradation was greatest for the smallest particles and the least for the largest
particles.
These results suggest that when recovering powder there may be value in removing
the smaller particles and not just the largest particles, which is the current paradigm.
This would remove the most degraded powder, unfortunately the small particles are
180 °C
185 °C
190 °C
195 °C
Tm,peak Tm,end
0-53 µm 54-75 µm 76-125 µm 125-212 µm
Figure 7.8: The Tm,peak and Tm,end of degraded powder as a function of particle size.

80
important for producing dense parts. One solution would be to demand that
manufacturers produce commercially available powder of 10 µm to 30 µm so that
blending in this virgin powder would decrease the particle size distribution.
The study did not include further tests to determine the cause for this trend; however,
the small particles have a higher surface to volume ratio. This could suggest that
observed degradation is no occurring the bulk but rather at a higher rate on the surface
of the particles. On untested hypothesis is that thermal-oxidative degradation is
greater for the small particles, as oxygen present at higher concentrations at the
surface. Polymers have a low thermal conductivity compared to other materials, e.g.
metals; however, particles, even the ones at the upper range of the size distribution,
are small and should reach temperature equilibrium quickly.
7.2. Recycling
7.2.1. Recycling Scheme – Blending
The same thermal analysis was completed for powder aged at 170 °C for between 0
and 96 hours when blended with virgin powder at loading rates of 20 %, 40 % and 60
%. As expected from the results in §7.1.1, the addition of virgin powder decreased the
Tm,peak and Tm,end of the recovered powder but left the Tm,onset unchanged. The Tm,end
results are shown in Figure 7.9, Figure 7.10, and Tm,peak are shown in Figure 7.11
and Figure 7.12.

81
Figure 7.9: The Tm,end for powder aged from 0 to 96 hours, refreshed at 0 to 60 %, clustered by powder age.
Figure 7.10: The Tm,end for powder aged from 0 to 96 hours, refreshed at 0 to 60 %, clustered by refresh rate.
185 °C
187 °C
189 °C
12 h 24 h 48 h 96 h
0 % 20 % 40 % 60 %
185 °C
187 °C
189 °C
0 % 20 % 40 % 60 %
12 h 24 h 48 h 96 h

82
Figure 7.11: The Tm,peak for powder aged from 0 to 96 hours, refreshed at 0 to 60 %, clustered by powder age.
Figure 7.12: The Tm,peak for powder aged from 0 to 96 hours, refreshed at 0 to 60 %, clustered by refresh rate.
182 °C
184 °C
186 °C
188 °C
12 h 24 h 48 h 96 h
0 % 20 % 40 % 60 %
182 °C
184 °C
186 °C
188 °C
0 % 20 % 40 % 60 %
12 h 24 h 48 h 96 h

83
These trends could be one of the reasons that the addition of virgin powder to
recovered material improves the final part quality when using recycled powder. This
is significant as the DSC was able to reproducibly distinguish the quality of the powder.
The lower Tm,end should improve consolidation at the same laser power and part bed
surface temperature and therefore issues caused by incomplete sintering would be
mitigated. The relationship between fresh rate and the decrease of Tm,peak and Tm,end
could also be a potential avenue for determining the amount of virgin powder required
to refresh the recovered powder. One could imagine measuring the Tm,peak and Tm,end
of the recovered powder, from which the required percent of virgin powder could be
determined. Equation 7.1. A dimensionless refresh rate could be described by:
(7.1)
where R is the dimensionless refresh rate in percent, β is an empirically determined
scaling factor.
The use of DSC would also be very practical in an industrial setting as the amount of
material and the time to complete the test are minimal. Only a few milligrams of powder
is required and the test can be completed in less than 30 minutes. Additionally,
samples could be sent out for testing and shipping costs would be trifling. In
conclusion, the DSC analysis is a possible method to reproducibly quantify
degradation and classify the quality of the powder.

84
7.3. Melt Flow Index
Before exploring the MFI data, it is important to note that there is a discrepancy
between the collected data and the specification sheet provided by ALM for PA650.
The data sheet reports an MFI of 50 g/10 minutes for the same test conditions, 3
minute preheat at 235 °C with a 5.0 kg mass, which is approximately half of MFR. One
explanation for this could be that the ASTM Standard, D1238, specifies two different
diameters for the die 2.095 mm and 1.048 mm for the “half” die. It could be possible
that ALM used the half-die prescribed by method C (a method for high melt flow rate
polyolefins) since SLS grade PA12 has a high melt flow rate.
The MFR and MVR data suggests that PA650 does not change when aged at 80 or
100 °C and dramatically decreases when aged at 170 °C. The most noteworthy result
0
50
100
150
200
80 °C 100 °C 170 °C
g/1
0 m
inu
tes
Virgin 12 h 24 h 48 h 96 h 192 h
Figure 7.13: The Melt Flow Rate (MFR) of the aged powder, clustered by aging temperature. Error Bars: +/- 1 SD.
0
60
120
180
240
80 °C 100 °C 170 °C
cm
3/1
0 m
inu
tes
Virgin 12 h 24 h 48 h 96 h 192 h
Figure 7.14: The Melt Volume Rate (MVR) of the aged powder, clusted by aging temperature. Error Bars: +/- 1 SD

85
was the MFR/MVR data for 170 °C, as the MFR/MVR decreases by half after 12 hours
of aging but did not change significantly from 12 hours to 96 hours. In addition, these
results do not agree well with the data presented by Dotchev et al in 2009 that showed
a stepwise decrease in MFR as a function of time and temperature. This is very
important as the blending workflow developed from this work and presented in §3.4.3
was solely based on the observed decrease in MFR.
There are numerous possible explanations for why the MFR decreases. Ockam’s
razor would suggest that this difference is due to the fact Dotchev was using PA2200
manufactured by EOS Manufacturing Solutions. In addition, Dotchev published this
data in 2009 and SLS powder technology has surely advanced, even if the
manufactured have not disclosed these advances. The 50 % drop of MFR shown for
the PA2200 aged at 100 °C could suggest that PA650 is modified to improve thermal
stability or PA2200 is less stable. Improved stability could be due to end group
modification or the additives, while decrease stability could be due to residual catalyst.
These are obviously only rash hypothesis and by no means the answer; however,

86
these differences should raise questions about what exactly the manufacturers of SLS
powder are doing to improve thermal stability of the PA12.
In light of these results, there is even greater need to consider DSC as a possible
replacement for measuring powder quality as it is a more sensitive technique. The MFI
results showed no difference between powder aged at 170 °C for between 12 and 96
hours. In contrast, the DSC data showed a stepwise increase for the same powder for
each time step.
Figure 7.15: The MFR results presented by Dotchev in 20097.

87
7.4. Powder Flowability
Of the three flowability tests (angle of repose, pourability and bulk density) the only
results that hinted a trend as a function of the degree of aging came from the angle of
repose data, while pourability and bulk density could only distinguish between virgin
and powder aged at 170 °C.
The angle of repose results showed an interesting trend for all three test temperatures.
For this data, an increase of the angle indicates a decrease in flowability and a
decrease in angle indicates improved flowability.
For 80 °C, there appears to be a slight increasing trend but it is not significant. For
100 °C the angle first increases and then decreases to almost the original value, while
for 170 °C there is a clear increasing trend. On frustrating aspect of the data is the
large standard deviation, which leads to great uncertainty in the results. However, the
results strongly suggest that angle of repose could be a valuable measure as all 15
aged samples had a greater angle of repose than virgin powder. This suggests
thermal degradation is decreasing the flowability of the powder.

88
Unfortunately the literature has not explored the effects of powder flowability in great
detail, so it is not known if decreased flowability is the cause for inferior parts when
recycled powder is used; however, the results indicate further could yield valuable
information. This only further reinforces the notation that much can still be learned
about the fundamentals of powder degradation.
Unlike the angle of repose, the pourability shows no trend for 80 and 100 °C. The
pourability was sensitive to the thermal degradation at 170 °C, unfortunately the
results showed a decrease in pourability for 12 to 48 hours and then significant
decrease that resulted in no flow through the funnel. While promising, pourability
45
55
65
80 °C 100 °C 170 °C
Virgin 12 h 24 h 48 h 96 h 192 h
32°
34°
36°
38°
80 °C 100 °C 170 °C
An
gle
of R
ep
ose
(D
eg
ree
s)
Virgin 12 h 24 h 48 h 96 h 192 h
Figure 7.16: The Angle of Repose as of the aged powder, clustered by aging temperature. Error Bars: +/-1 SD

89
cannot distinguish between 12 h and 48 h at 170 °C, which limits the usefulness of
this test.
The least useful of the 3 tests, apparent density showed no change until 96 h at 170
°C. It was reassuring that the apparent density agreed with the specification sheet
provided by ALM for PA650. The only practical data the apparent density could
provide would be that the powder is significantly degraded but no information between
virgin and that point.
The decrease in apparent density and the lack of pourability for the samples aged for
96 and 192 hours could be related to thermal-oxidative degradation as these two
samples exhibited yellowing, commonly associated with oxidation of polymers,
especially polyamides. This is important to note, as these samples were both
0.30
0.40
0.50
80 °C 100 °C 170 °C
Ap
pa
ren
t D
en
sity (
g/c
m3
)
Virgin 12 h 24 h 48 h 96 h 192 h
Figure 7.17: Apparent density of the aged powder, clustered by aging temperature. Error Bars: +/- 1 SD.

90
degraded by thermal and thermal-oxidative mechanisms. This suggests that apparent
density and/or pourability could be valuable test if thermal-oxidation is suspected.
In conclusion the results suggest that angle of repose should be explored in more
depth, especially since the apparatus used could be modified to improve the results.
For the current apparatus, the powder falls upon a flat sheet of paper, which resulted
in repose angles of between 32° and 38°. It may be possible to redesign this surface
to better elucidate out slight changes in the powder flowability. In addition, the work of
Schmid et al that used the rotating cylinder to measure the dynamic angle of repose,
see §2.7.3, should be explored for aged powders.

91
8 CONCLUSIONS AND FUTURE WORK
8.1. Conclusions
The work in this study built off of and elaborated upon the work of other research
groups from multiple university. The results both verified and expanded the results of
previous work on the degradation and recycling of SLS grade PA12 powder. The goal
was to explore at the problem from a different perspective, primarily thermal analysis
to question to the widely held belief that DSC was not sensitive enough to detect
degradation. In addition to thermal analysis, the effect of refreshing powder was
explored from the thermal analysis perspective. The results showed that refreshing at
rates of 20, 40 and 60 % changed the properties of the aged powder to varying
degrees.
One of the most promising results was the ability to detect minor changes in the
thermal properties with the Netzsch DSC 214 Polyma®, even though the literature
review suggested DSC was not sensitive enough to detect degradation. In stark
contrast, the results showed that DSC is capable of quantifying degradation and is
even sensitive enough to distinguish between powder that has been refreshed at
either 20, 40 or 60 %. This could hold significant importance, as unlike other methods
such as MFI or the pourability, which require 10-50 g of powder, DSC only requires a
few milligrams. In addition, MFI, which has been touted in the literature as great

92
method to determine degradation is a destructive technique. Assuming 50 g of powder
is requited for MFI, per the ASTM standard, the test would require $5 of powder. In
contrast, flowability testing is nondestructive and the 5-10 mg of powder destroyed in
a DSC sample has a value of essentially zero, $0.001. Yes, DSC instrumentation is
more expensive but also less labor intensive, so testing costs should be comparable.
The results of the MFI were disappointing, as it does not appear that the method can
differentiate powder aged for 12 hours at 170 °C and 96 hours at 170 °C. This is
significant because the thermal analysis strongly suggests a change in powder quality.
TGA should be eliminated as a possible technique to quantify degradation of PA12
powder as there was no evident change in the decomposition temperature or rate of
decomposition as a function of powder degradation.
Considering that only DSC and angle of repose showed any trends as a function of
aging temperature and time, the results from these two could be considered for
inclusion. Building off of Equation 7.1, the inclusion of angle of repose could yield this
equation
(8.1)

93
where D is the dimensionless number, A is the angle of repose converted into radians,
and γ is an empirically determined scaling factor. The dimensionless number, D, would
be in percent and be the percent virgin powder required to refresh the powder.
8.2. Future Work
The results strongly suggest that future work is necessary if recycling efficiency of
PA12 powder is to be maximized, especially given the novel results. The most salient
work would be to build samples with oven aged powder to correlate the quality of parts
to the values provided by both the flowability and thermal analysis. Given the
sensitivity of the DSC, it should be possible to predict the quality of parts depending
on the Tm,peak, Tm,end and the ΔTm. In addition, other quantification techniques should
be investigated to determine the sensitive for detection of degradation. For example,
the patent literature is a proponent of solution viscometry to detect changes in average
MW. However, all of these techniques, DSC, MFI, solution viscometry, indirectly
measure changes in the MWD. To truly investigate the subtle changes that these
techniques pick up, gel permeation chromatograph, which measures the MWD, of
aged powder is a vital next study.
The use of dimensionless numbers could also be a valuable addition to the recycling
literature. Equations 7.1 and 8.1 are two examples of possible dimensionless numbers
that would build off of the work presented in this thesis. However, both of these

94
dimensionless numbers would require a scaling factor that could only be determined
empirically. Therefore, it would be necessary to build off of the novel results in this
work. If parts could be built using powder aged in a controlled environment, it would
be possible to determine if there is a correlation between the quality and strength of
printed parts to the values such as Tm,peak, Tm,end, angle of repose, etc. The scaling
factors could be determine by plotting a property such as tensile strength versus
Tm,peak.
In conclusion, DSC was shown as a novel and very sensitive technique to quantify
changes in the SLS powder when the powder was thermally degraded. MFI did not
show useful results in this study but did in the work of others. Angle of repose showed
promising results and could be the basis of future techniques to quantify the
macroscopic quality of the powder.

95
9 REFERENCES
(1) Rifkin, J. The Third Industrial Revolution: How Lateral Power Is Transforming
Energy, the Economy, and the World; St. Martin’s Press, 2011.
(2) Rifkin, J. 2011, p 270.
(3) Berman, B. Bus. Horiz. 2012, 55 (2), 155–162.
(4) ASTM International. 2013, F2792-12a, 10–12.
(5) Goodridge, R. D.; Tuck, C. J.; Hague, R. J. M. Prog. Mater. Sci. 2012, 57 (2),
229–267.
(6) Pham, D. T.; Dotchev, K.; Yusof, W. a. Y. 2008.
(7) Dotchev, K.; Yusoff, W. Rapid Prototyp. J. 2009, 15 (3), 192–203.
(8) Evans, S. Fire in small German town could curb world car production
http://www.bbc.com/news/business-17769466 (accessed Jan 1, 2015).
(9) Smock, D. Lessons from the Nylon 12 Supply Disruption
http://www.mypurchasingcenter.com/commodities/commodities-
articles/lessons-learned-from-nylon-12-supply-disruption/ (accessed Jan 1,
2015).

96
(10) Ullmann’s Fine Chemicals, 3 Volume Set; Wiley, 2014.
(11) Frisch, K.C., Lie, G., Axelrood, S.L., & Mich, T. 1965, No. 2, 3–7.
(12) Evonik Industries. An Altern. raw Mater. Polyam. 12 acid Evonik is Oper. a Pilot
plant bio-based ω -amino lauric 2013.
(13) Rosenzweig, N.; Narkis, M. Polymer Powder Technology; J. Wiley, 1995.
(14) Aquite, W. A Novel Polymer Extrusion Micropelletization Process, Univesity of
Wisconsin-Madison, 2015.
(15) Evonik Industries. VESTOSINT ® Polyam. 12 Coat. Powders.
(16) Kruth, J. P.; Levy, G.; Klocke, F.; Childs, T. H. C. CIRP Ann. - Manuf. Technol.
2007, 56 (2), 730–759.
(17) Freeman Technologies. Why are Powders Complex?
http://www.freemantech.co.uk/_powders/?pt=Why are Powders Complex
Page&p=NA==.
(18) Amado, A.; Schmid, M.; Wegener, K. Rapid.Tech 2014, 1–7.
(19) Schmid, M.; Amado, F.; Levy, G.; Wegener, K. Proc. 6th Int. Res. Virtual Rapid
Prototyp. 2014.

97
(20) Davis, J. R.; Committee, A. S. M. I. T. S. S. T. Handbook of Thermal Spray
Technology; ASM International, 2004.
(21) Majewski, C. E.; Zarringhalam, H.; Hopkinson, N. Proc. SFF Symp. 2008, 45–
54.
(22) Zarringhalam, H.; Majewski, C.; Hopkinson, N. Rapid Prototyp. J. 2009, 15 (2),
126–132.
(23) Shi, Y.; Li, Z.; Sun, H.; Huang, S.; Zeng, F. Proc. I MECH E Part L J. Mater.
Appl. 2004, 218 (3), 247–252.
(24) Flory, P. J. J. Chem. Phys. 1947, 15 (6), 397–408.
(25) Hiemenz, P. C.; Lodge, T. P. Polymer Chemistry, Second Edition; Taylor &
Francis, 2007.
(26) Osswald, T. A.; Menges, G. Materials Science of Polymers for Engineers;
Hanser Publications, 2012.
(27) Zarringhalam, H.; Hopkinson, N.; Kamperman, N. F.; de Vlieger, J. J. Mater. Sci.
Eng. A 2006, 435-436, 172–180.
(28) Wohler Associates. Wohlers Report 2009; 2009.

98
(29) Du Plessis, P. In Proceedings of the TCT Conference; CRP Group: Coventry,
2008.
(30) Deckard, C. R. Selective laser sintering, University of Texas - Austin, 1988.
(31) Ehrenstein, G. W.; Pongratz, S. Resistance and Stability of Polymers; Carl
Hanser Verlag GmbH & Co. KG: München, 2013.
(32) Beaman, J. J.; Barlow, J. W.; Bourell, D. L.; Crawford, R. H.; Marcus, H. L.;
McAlea, K. P. Solid Freeform Fabrication: A New Direction in Manufacturing:
with Research and Applications in Thermal Laser Processing; Springer US,
2013.
(33) Forderhase, P.; McAlea, K. Proc. SFF Symp. 1994, 102–109.
(34) Choren, J.; Gervasi, V.; Herman, T.; Kamara, S.; Mitchell, J. Solid Free. Fabr.
Symp. 2001, 39–45.
(35) Gornet, T. J.; Davis, K. R.; Starr, T. L.; Mulloy, K. M. Solid Free. Fabr. Symp.
2002, 546–553.
(36) Katalinic, E. B.; Harmony, M.; Technology, B. 2010, 21 (1).
(37) Mielicki, C.; Gronhoff, B.; Wortberg, J. 2014, 728, 728–731.

99
(38) Wudy, K.; Drummer, D.; Kühnlein, F.; Drexler, M. AIP Conf. Proc. 2014, 1593
(May), 691–695.
(39) Ziegelmeier, S.; Wollecke, F.; Tuck, C.; Goodridge, R.; Hague, R. Solid Free.
Fabr. Symp. 2013, 354–367.
(40) Amado, A.; Schmid, M.; Levy, G.; Wegener, K. Proc. SFF Symp. 12.
(41) Rietzel, D.; Aquite, W.; Drummer, D.; Osswald, T. a. 2–7.
(42) Krantz, M.; Zhang, H.; Zhu, J. Powder Technol. 2009, 194 (3), 239–245.
(43) Wudy, K.; Drummer, D. Proc. PPS-29 2014.
(44) Drummer, D.; Wudy, K.; Drexler, M. Proc. PPS-30 2015.
(45) Allen, N. S. Polym. Degrad. Stab. 1984, 8, 55–62.
(46) Graves, C. T.; Ormerod, M. G. Polymer (Guildf). 1963, 4, 81–91.
(47) Brodskii, A. I.; Fomenko, A. S.; Abramova, T. M.; Furman, E. G.; Dar’eva, E. P.;
Kukhtenko, I. I. In Dokl. Akad. Nauk SSSR; 1964; Vol. 156, pp 1147–1149.
(48) Osswald, T. A.; Menges, G. Material Science of Polymers for Engineers; Hanser
Publications: Cincinatti, Ohio, 2012.

100
(49) Osswald, T.; Rudolph, N. Polymer Rheology, 1st ed.; Strohm, C., Ed.; Hanser
Publications: Cincinatti, Ohio, 2014.
(50) Petzold, S.; Smet, J.; Osswald, T. A. SPE ANTEC 2015 2015.
(51) Selective Laser Sintering, Birth of an Industry
http://www.me.utexas.edu/news/2012/0712_sls_history.php (accessed Nov 6,
2015).
(52) Monsheimer, S.; Simon, U.; Grebe, M.; Christoph, W.; Altkemper, S. Powder
with Improved Recycling Properties, Process for Its Production, and use of the
Powder in a Process for Producing Three-Dimensional Objects. US
2006/0071359 A1, 2006.
(53) Monsheimer, S.; Grebe, M.; Altkemper, S.; Baumann, F.-E.; Hessel-Geldmann,
S.; Warnke, K.; Stemmer, H.; Muegge, J.; Tuerke, M.; Simon, U. Copolyamide
Powder and Its Preperation, Use of Copolyamide Powder in a Shaping Process
and Mouldings Produced from this Copolyamide Powder. US 8,591,797 B2,
2013.
(54) Pfister, A.; Gersch, M. Method and Device of Layerwise Manufacturing A Three-
Dimensional Object of a Powdery Material. US2009/0291305 A1, 2009.

101
(55) Ruffo, M.; Tuck, C.; Hague, R. Proc. Inst. Mech. Eng. Part B J. Eng. Manuf.
2006, 220 (9), 1417–1427.
(56) Osswald, T.; Baur, E.; Brinkmann, S.; Oberbach, K.; Schmachtenberg, E.
International Plastics Handbook: The Resource for Plastics Engineers; Hanser,
2006.
(57) Advanced Laser Materials, L. Technical Data Sheet (PA 650); 2011.
(58) Venables, H. J.; Wells, J. I. Drug Dev. Ind. Pharm. 2001, 27 (7), 599–612.
(59) ASTM International. 2014, D1238, 1–16.
(60) ASTM International. 2000, C1444 (1), 1–2.
(61) NETZSCH-Geraetebau GmbH. DSC 214 Polyma; 2014.


