PostgreSQL Logging
Gabrielle RothEnterpriseDB
PgOpen 18 Sep 2012

...not just for lumberjacks
photo by U.S. Fish and Wildlife Service - Midwest Region. Creative Commons license.
Why you want logs
Why you want logs
Why you want logs
Why you want logs
Historical record starts, stops, reloads of config file who's connected data or schema changes
Troubleshooting aid Legal requirement

The Basics
photo from brittgow (flickr). Creative Commons license.
The Basics:
How to get logsEasy!
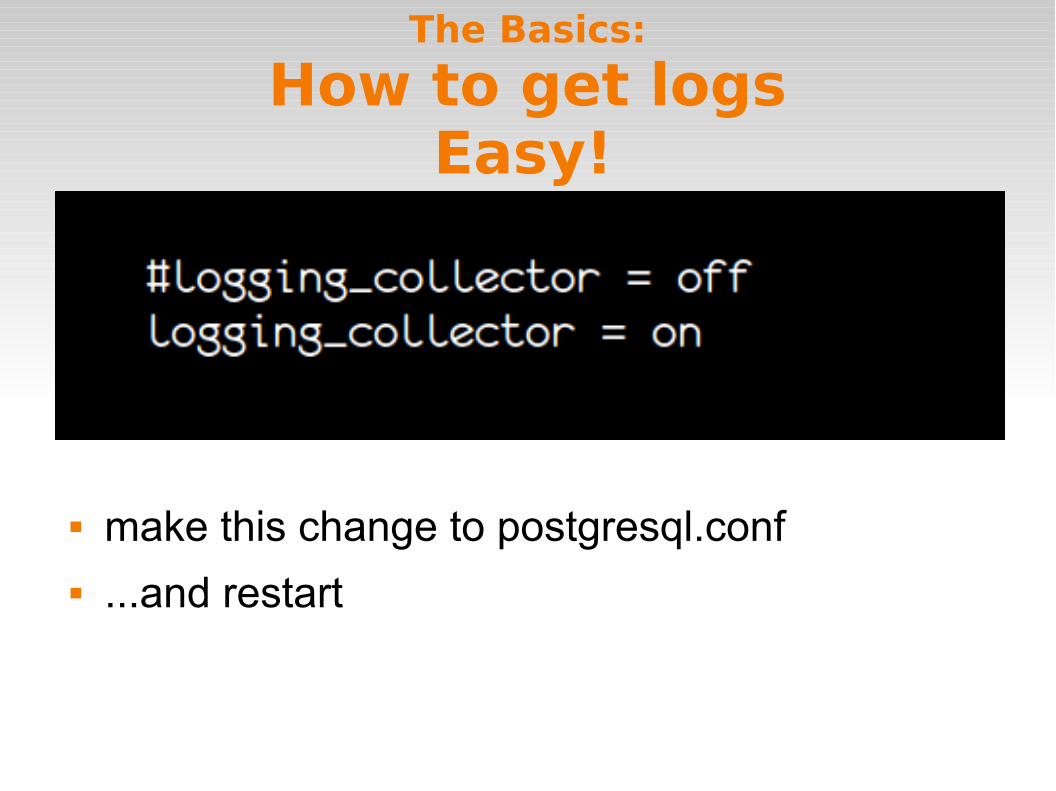
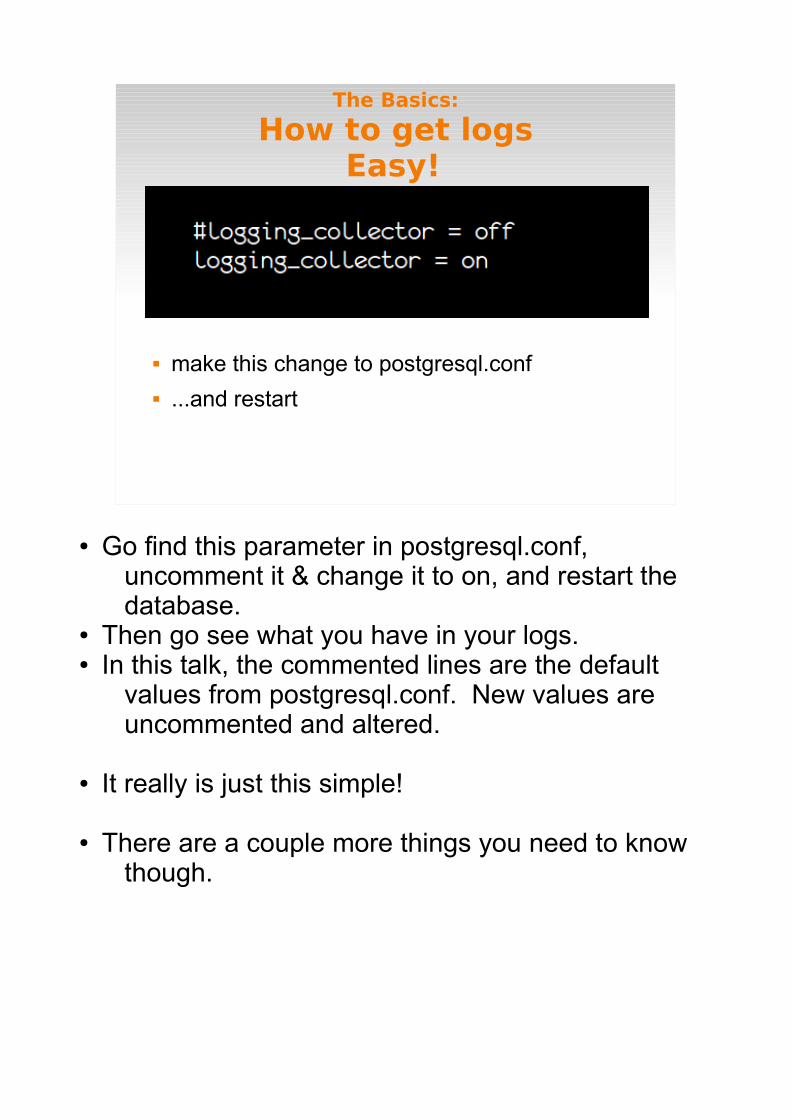
make this change to postgresql.conf ...and restart
The Basics:A few more things you need to know...
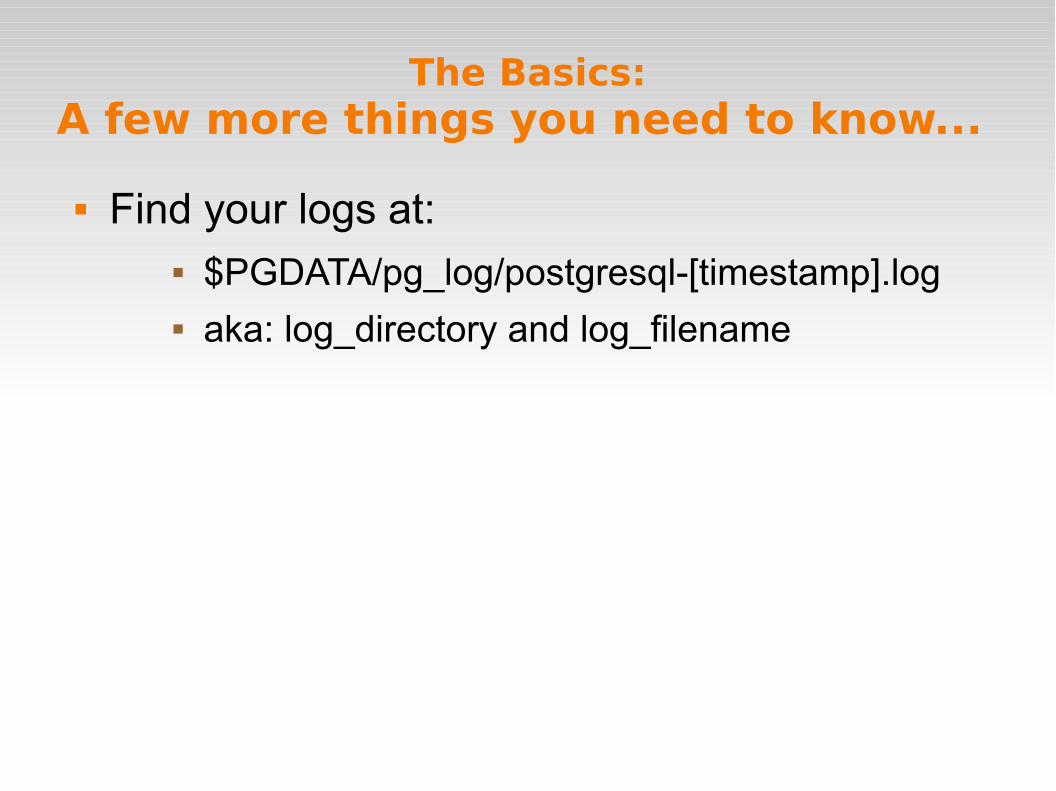
Find your logs at: $PGDATA/pg_log/postgresql-[timestamp].log aka: log_directory and log_filename
The Basics:A few more things you need to know...
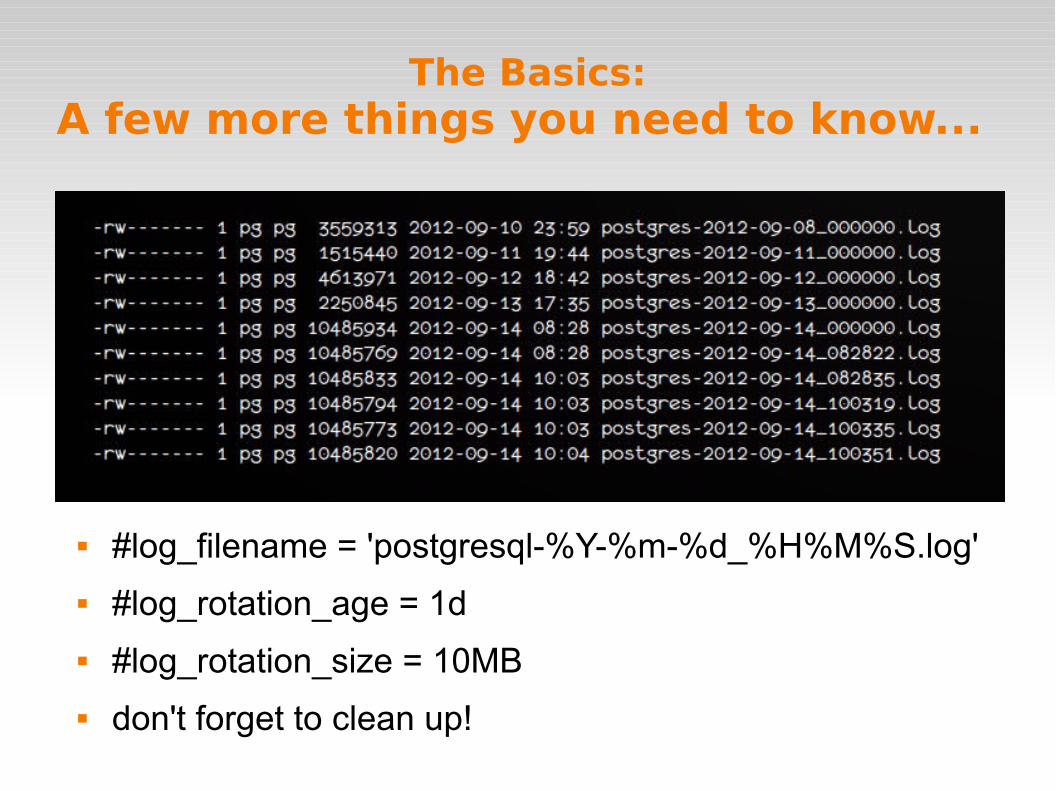
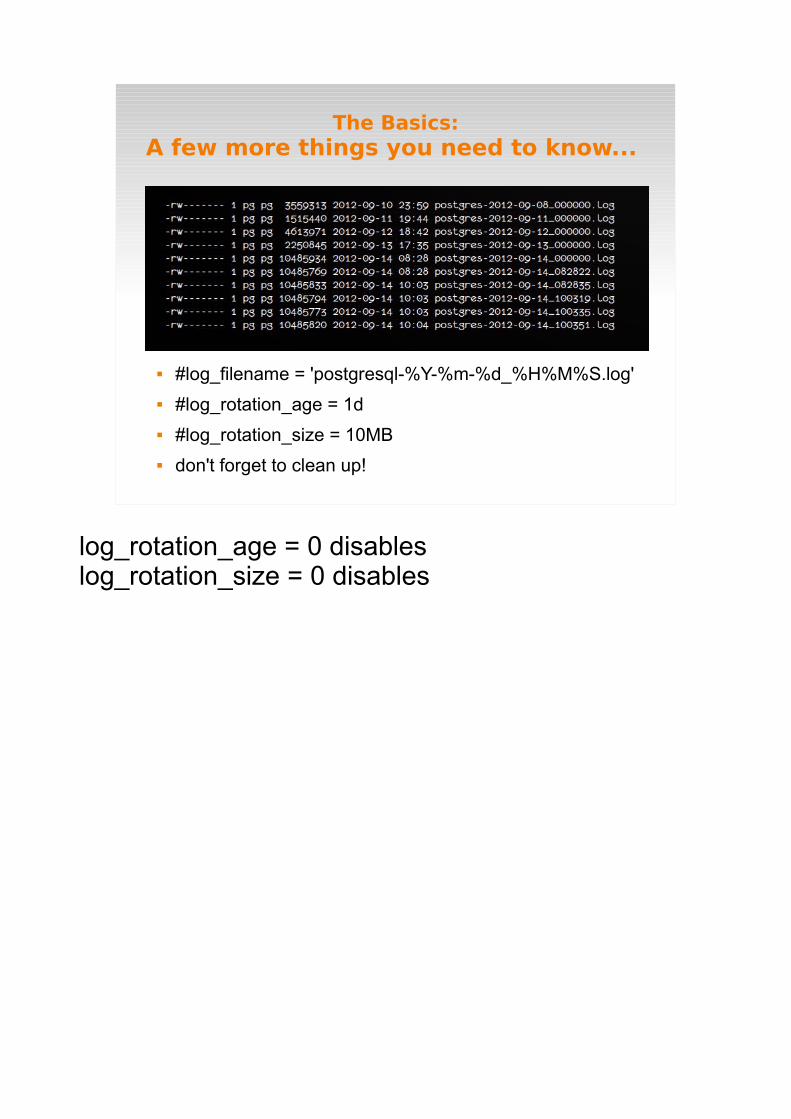
#log_filename = 'postgresql-%Y-%m-%d_%H%M%S.log'
#log_rotation_age = 1d
#log_rotation_size = 10MB
don't forget to clean up!
Voila.
The Basics:Recap
...now let's customize it a bit
photo © Shanti Isenagle. Used with permission.
Logging-related GUCs inpostgresql.conf
Three sections: Where to Log When to Log What to Log ...and some random locations.
Defaults are pretty conservative
Most parameters require pg_ctl reload; others require restart (noted in postgresql.conf)
Customize:
What to Log
who connected/disconnected log_connections/log_disconnections
what's changed log_statement
apply message prefix* log_line_prefix
Customize:who connected
Customize:who connected
Customize:what's changed
Customize:what's changed
Customize:add a message prefix
Customize:add a message prefix
Customize:resolve the hostname
Customize:
What to log recap
Customize:
When to Log message levels
log_min_messages client_min_messages log_min_error_statement
long queries log_min_duration_statement
Customize:
Message Levels
Let's talk about the levels first.
DEBUG, INFO, NOTICE, WARNING, ERROR, LOG, FATAL, PANIC.
(or something like that.)
Customize:
log_ and client_min_messages, log_min_error_statement
the defaults are probably fine.
Customize:
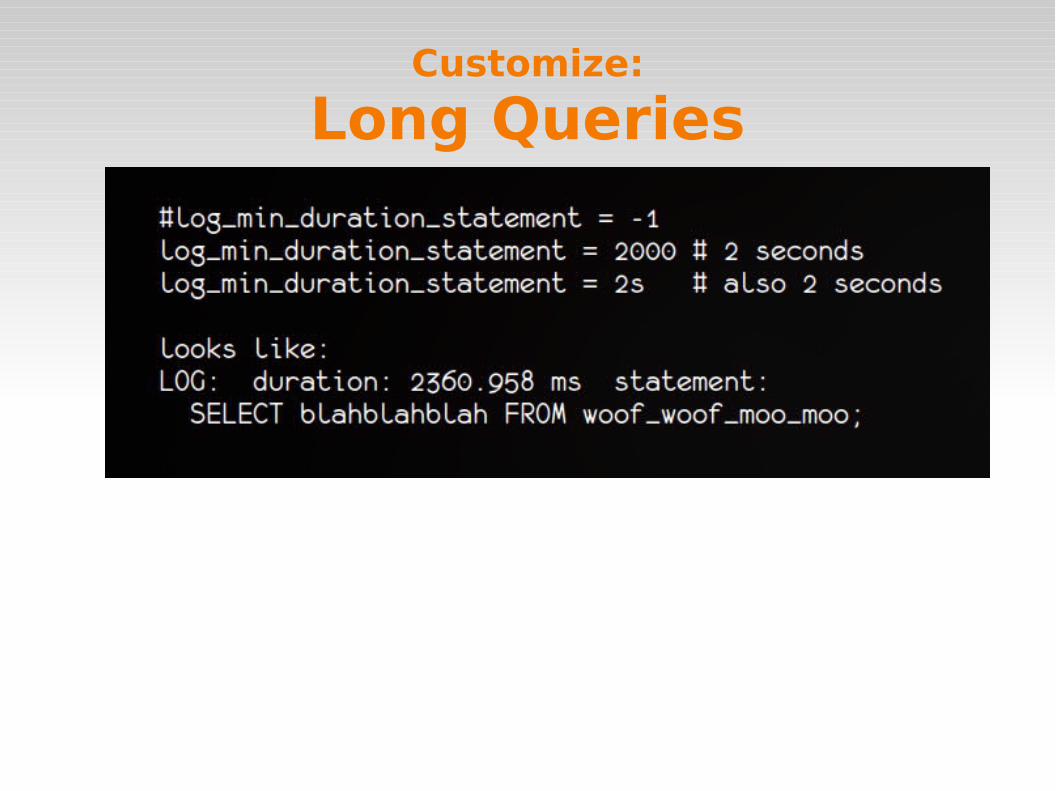
Long Queries
log_statement + log_min_duration_statement
Customize:
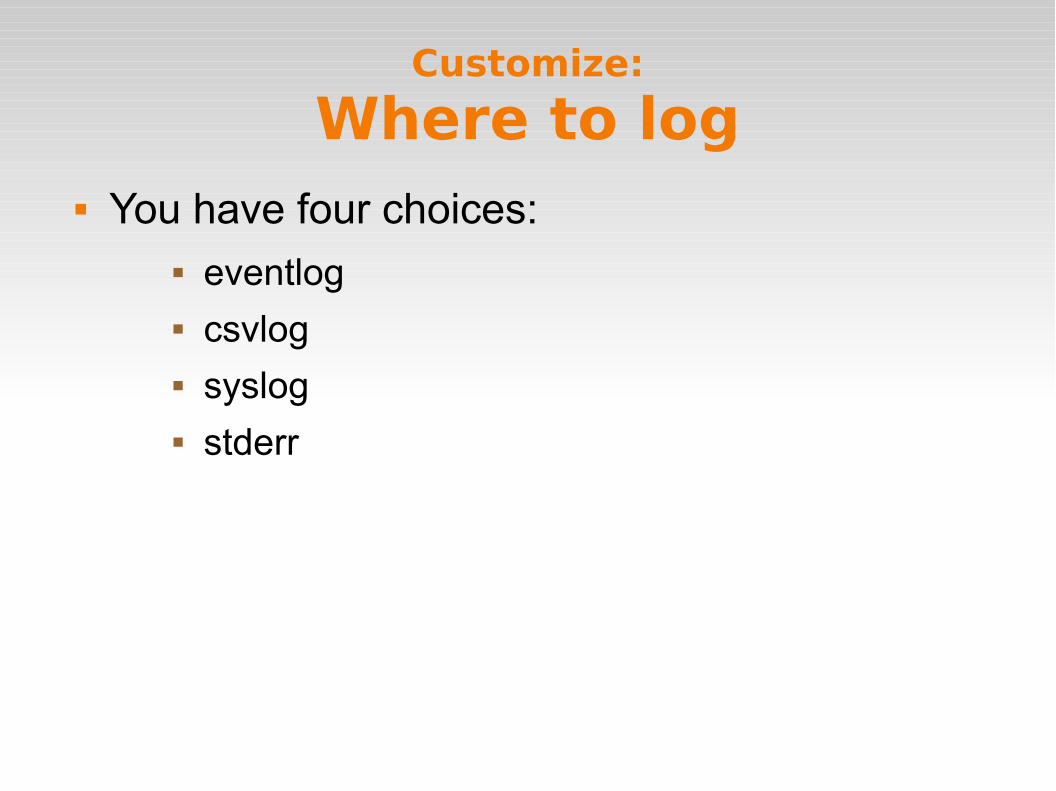
Where to log You have four choices:
eventlog csvlog syslog stderr
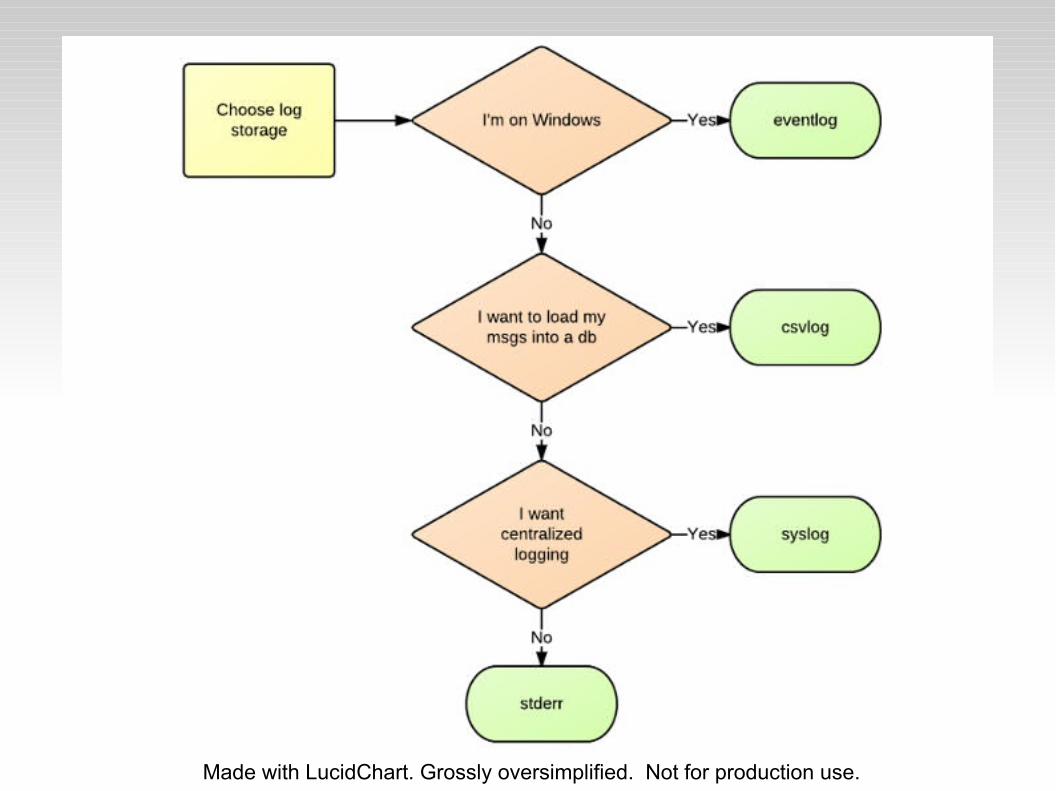
Made with LucidChart. Grossly oversimplified. Not for production use.
Customize:
eventlog (Windows) get service start/stop messages by default edit postgresql.conf restart via Services menu OR
reload via PgAdmin
use Event Viewer to view set up a custom filter to reduce annoyance
More help? see me afterwards or at the code sprint.
Customize:
stderr (review)
Customize:
stderr make sure the pg user has perms on the log
directory, otherwise:
...and the database won't start.
Customize:
stderr Pros:
easy! Pg handles the log rotation for you
Cons: you need to ship logs yourself to a central
server you need to clean up old logs yourself
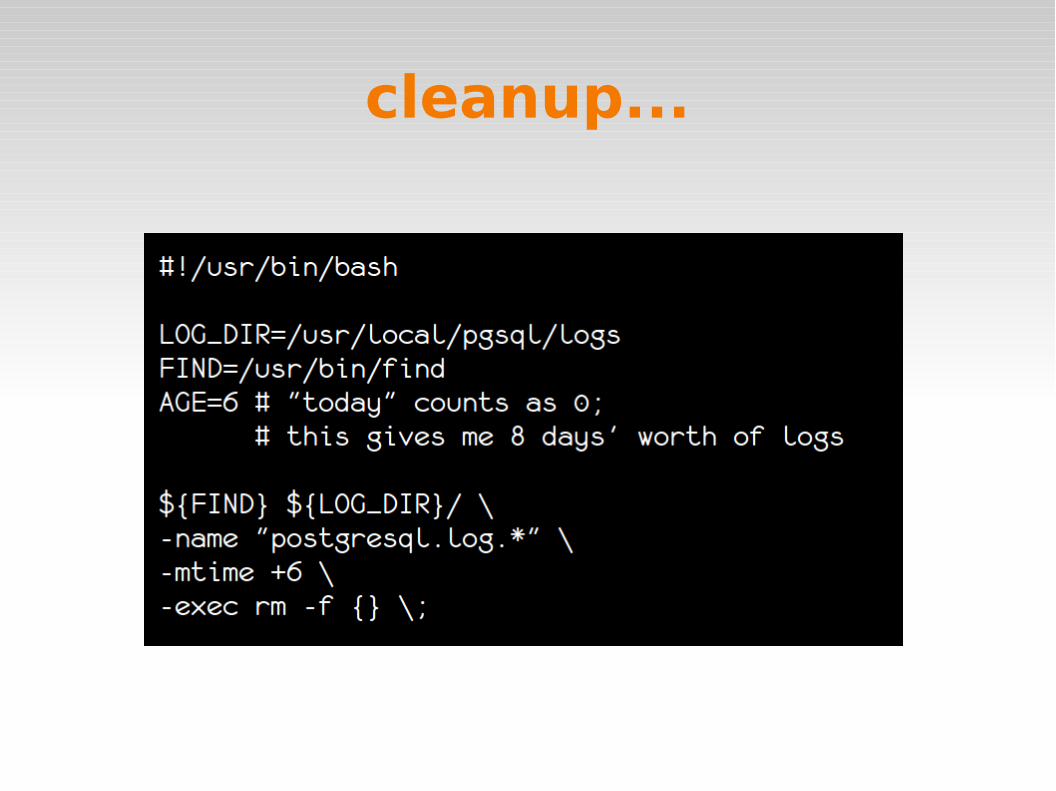
cleanup...
Customize:
csvlog
Customize:
csvlog
log_filename = 'postgresql-[timestamp].log' but file is named postgresql-[timestamp].csv
Customize:
csvlog Pros:
Pg handles the log rotation you get a lot of cool stuff without extra effort loading logs into a database is a snap!
Cons: you need to ship logs yourself to a central
server you need to clean up old logs yourself logs are no longer human-readable you may not agree with the available fields
Customize:
syslog
Customize:
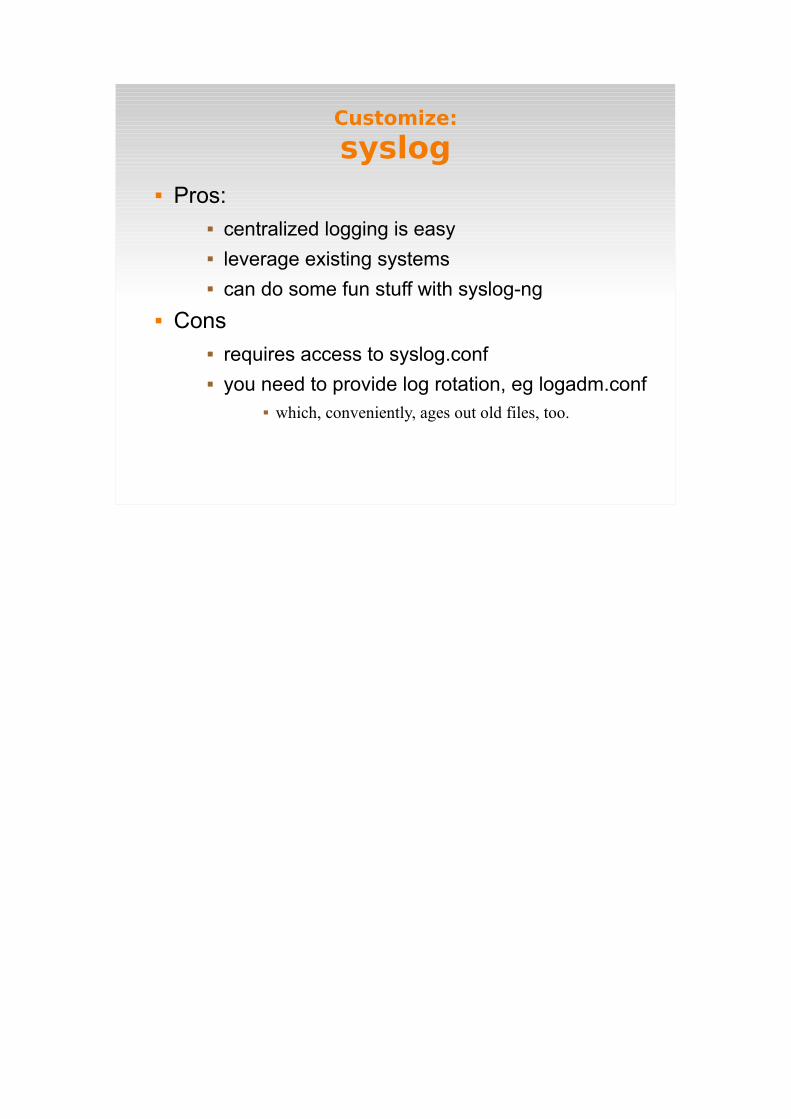
syslog Pros:
centralized logging is easy leverage existing systems can do some fun stuff with syslog-ng
Cons requires access to syslog.conf you need to provide log rotation, eg logadm.conf
which, conveniently, ages out old files, too.
Customize:
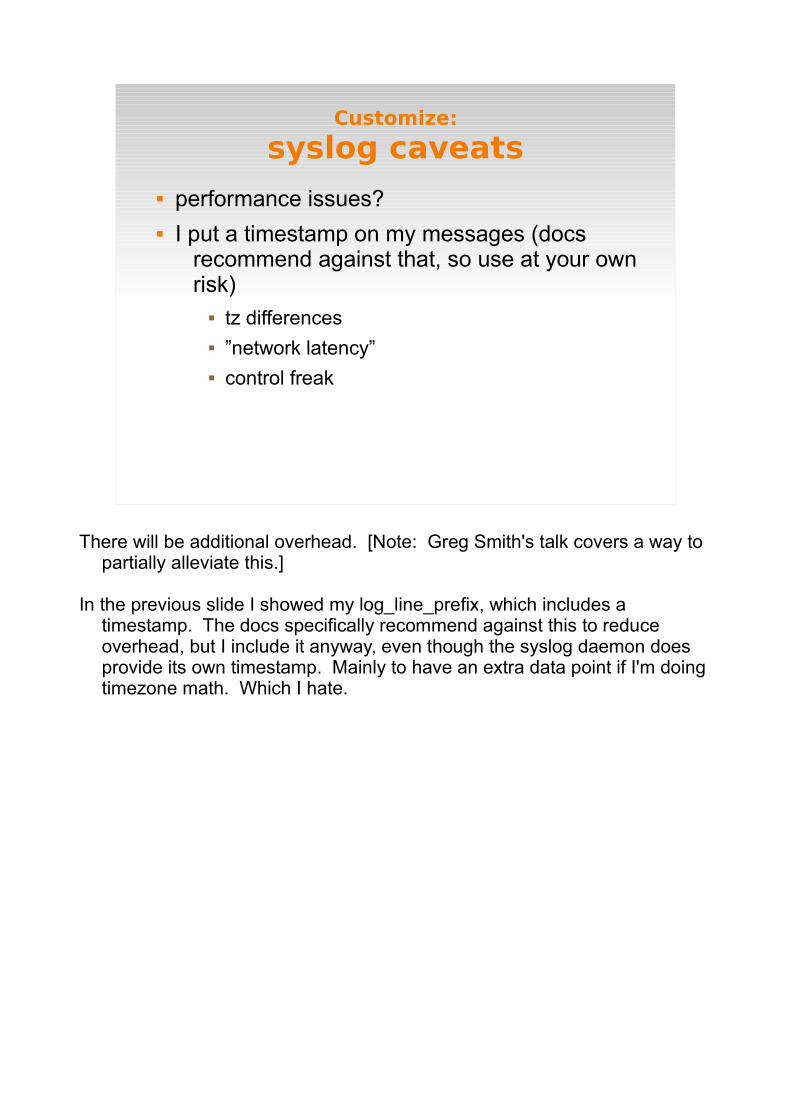
syslog caveats performance issues? I put a timestamp on my messages (docs
recommend against that, so use at your own risk)
tz differences ”network latency” control freak
Recap
Customize:
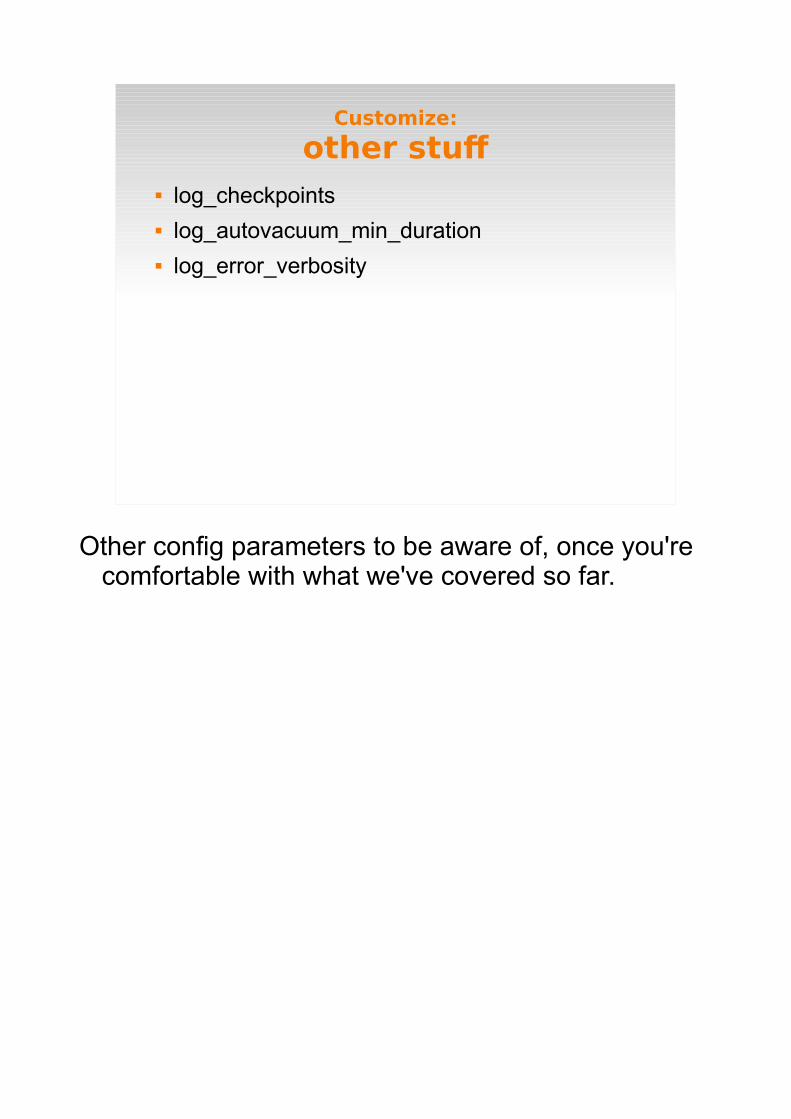
other stuf log_checkpoints log_autovacuum_min_duration log_error_verbosity
Override a configured value from psql
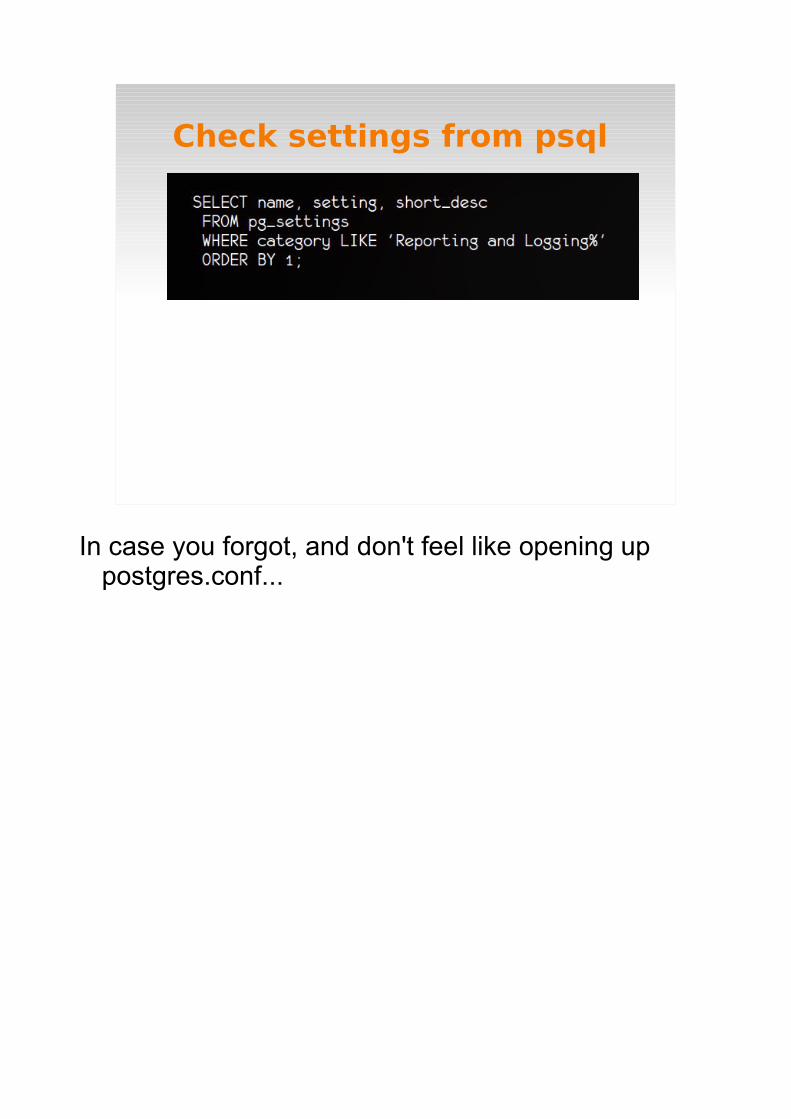
Check settings from psql
Tools
photo Dougtone (flickr). Creative Commons license.
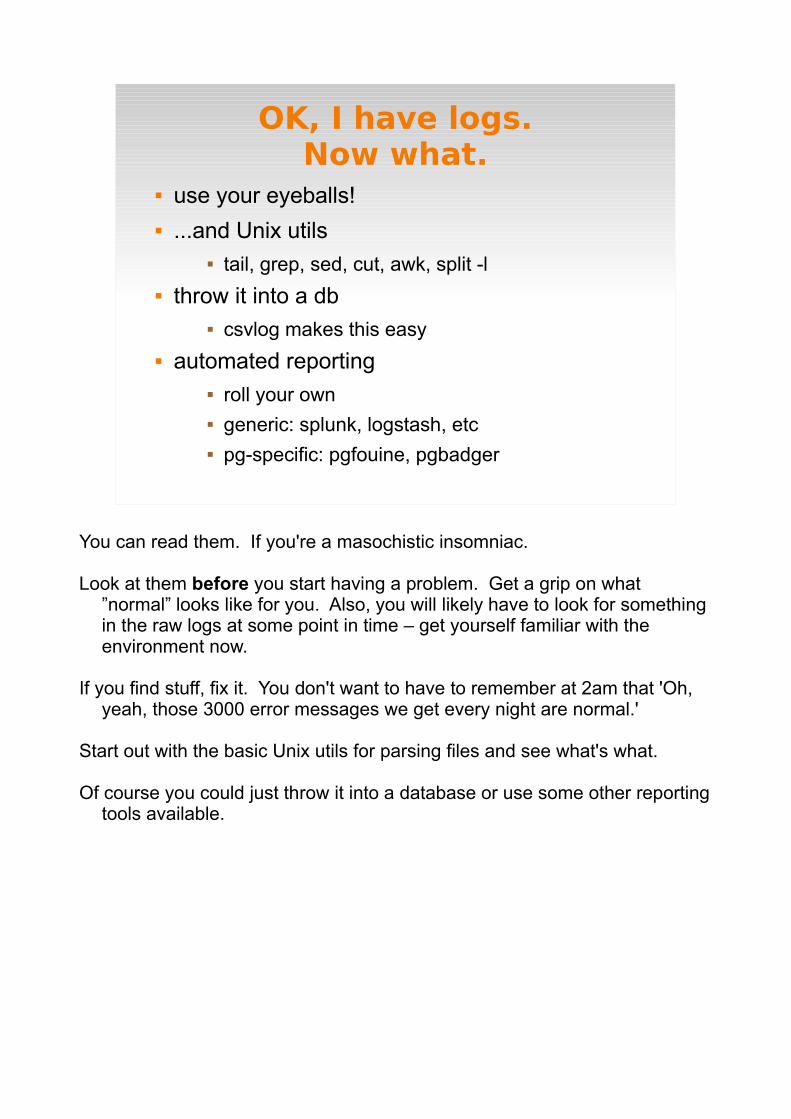
OK, I have logs.Now what.
use your eyeballs! ...and Unix utils
tail, grep, sed, cut, awk, split -l
throw it into a db csvlog makes this easy
automated reporting roll your own generic: splunk, logstash, etc pg-specific: pgfouine, pgbadger
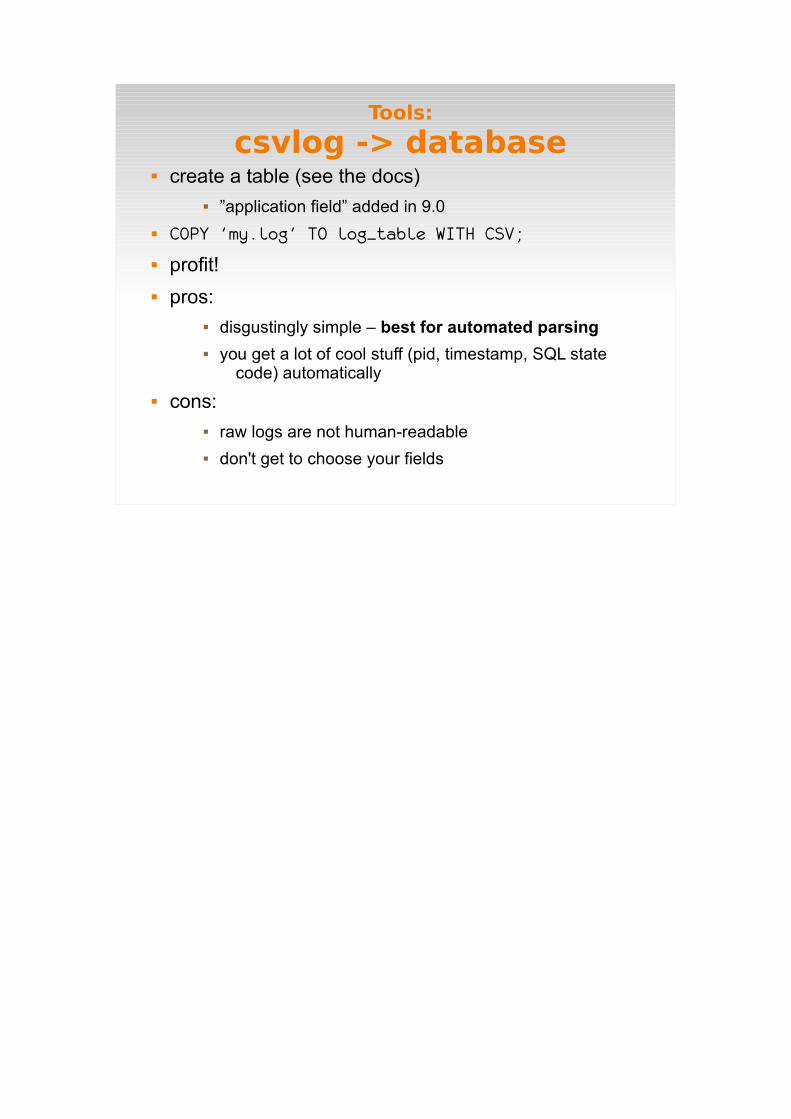
Tools:
csvlog -> database create a table (see the docs)
”application field” added in 9.0
COPY 'my.log' TO log_table WITH CSV;
profit!
pros: disgustingly simple – best for automated parsing you get a lot of cool stuff (pid, timestamp, SQL state
code) automatically
cons: raw logs are not human-readable don't get to choose your fields
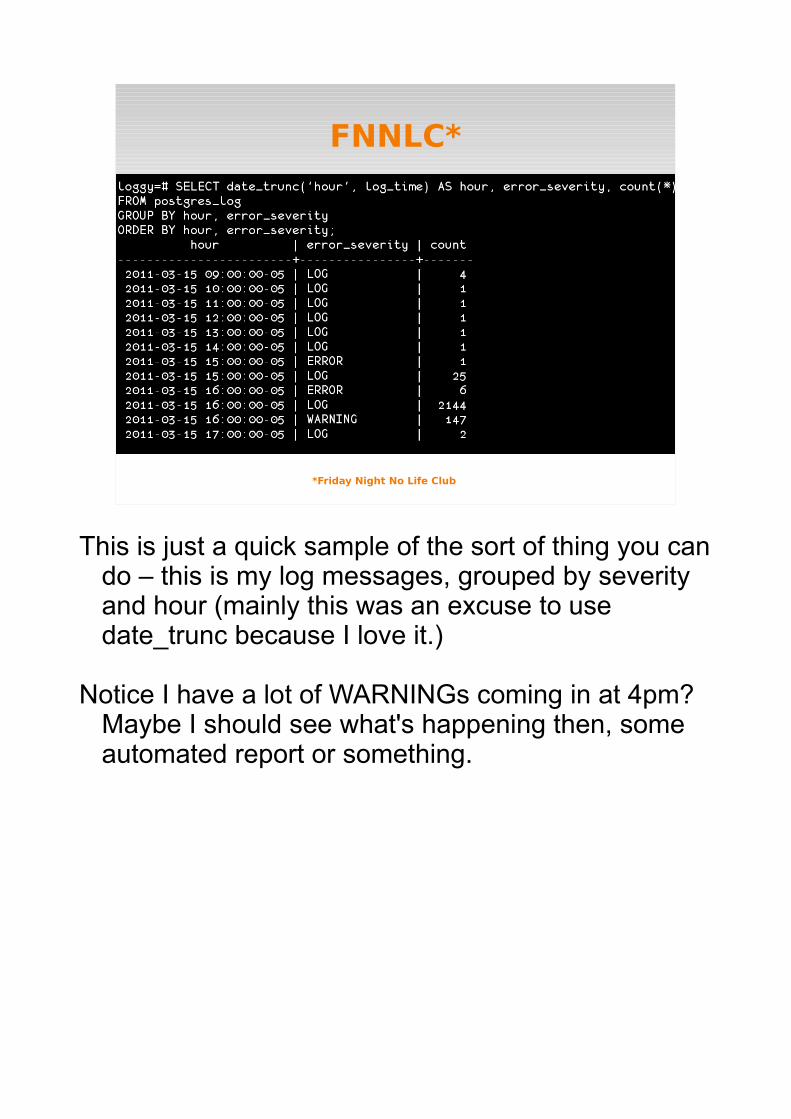
FNNLC*
*Friday Night No Life Club

(generic) Tools:
splunk & logstash www.splunk.com logstash.net Splunk costs $$$$, logstash is open-source Both are easy to install Both require some tweaking to handle Pg log
Tools:
pgfouine pg log parser pgfouine.projects.postgresql.org pHp 8.4 slow on larger logs

Tools:
pgbadger pg log parser https://github.com/dalibo/pgbadger Perl use this one :)
Tools:
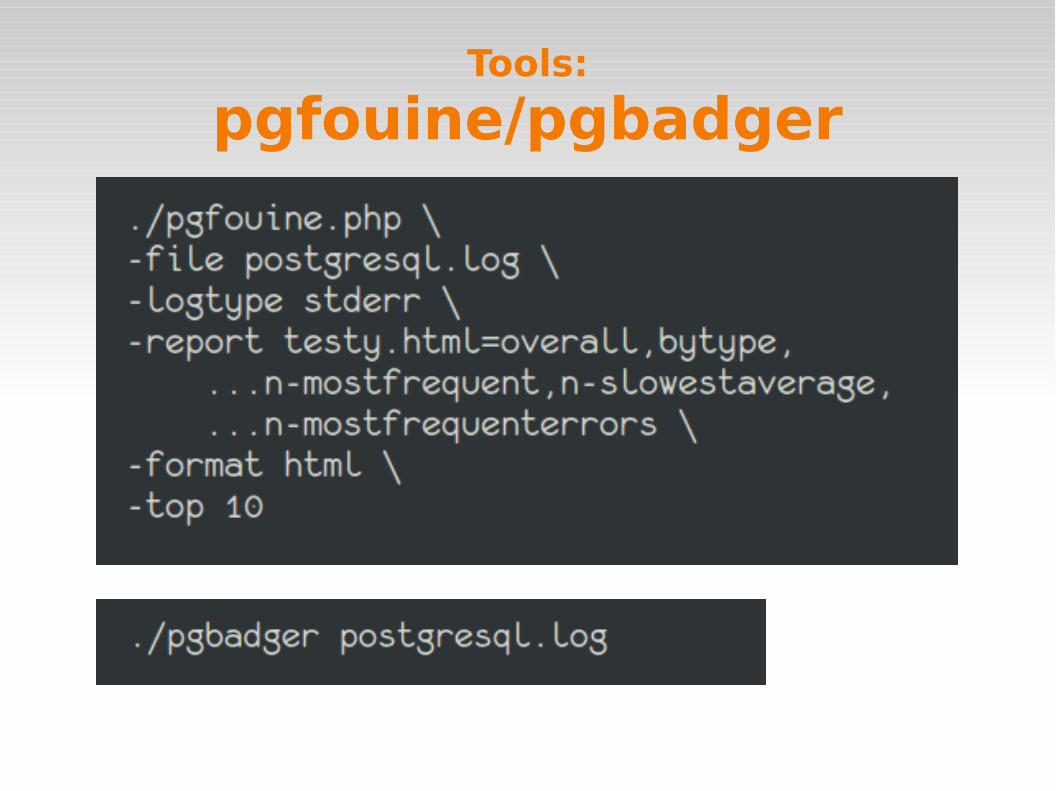
pgfouine/pgbadger
Tools:
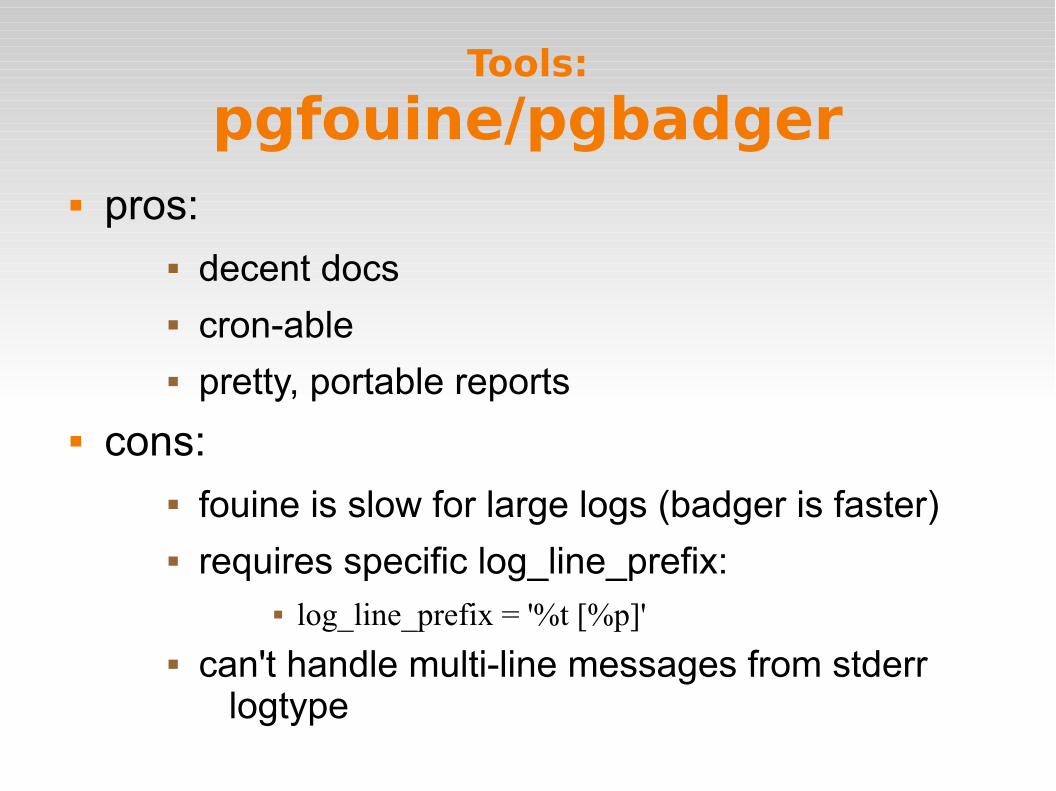
pgfouine/pgbadger pros:
decent docs cron-able pretty, portable reports
cons: fouine is slow for large logs (badger is faster) requires specific log_line_prefix:
log_line_prefix = '%t [%p]' can't handle multi-line messages from stderr
logtype
Tools:
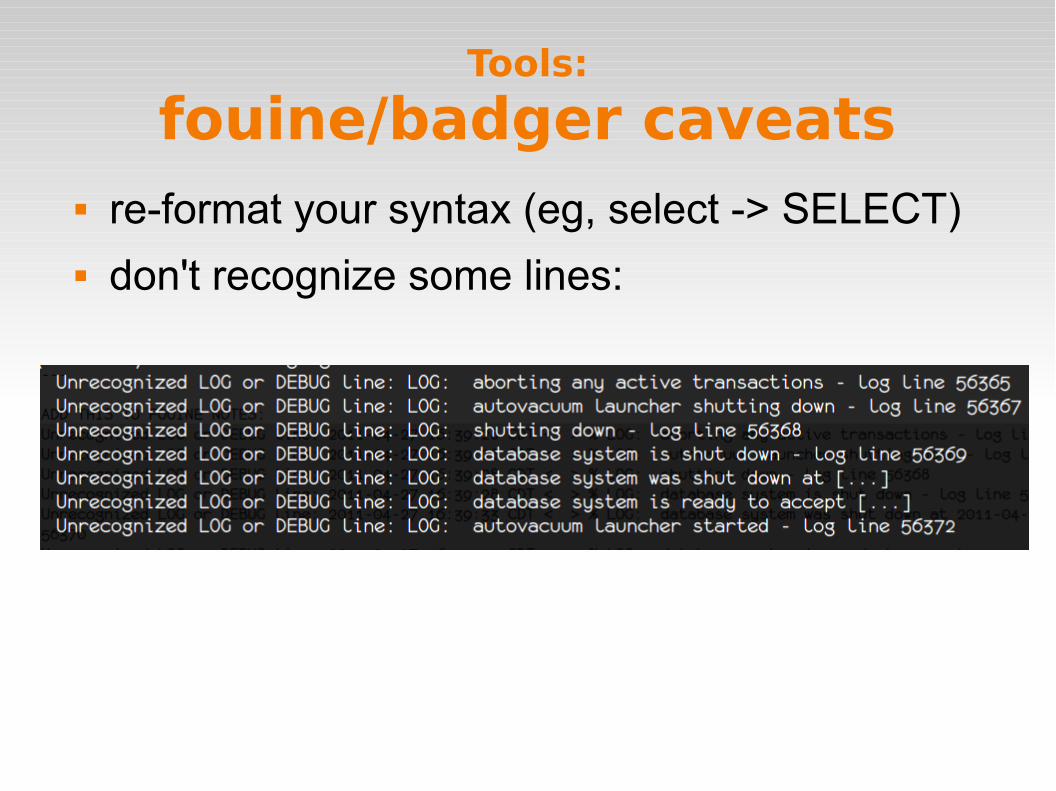
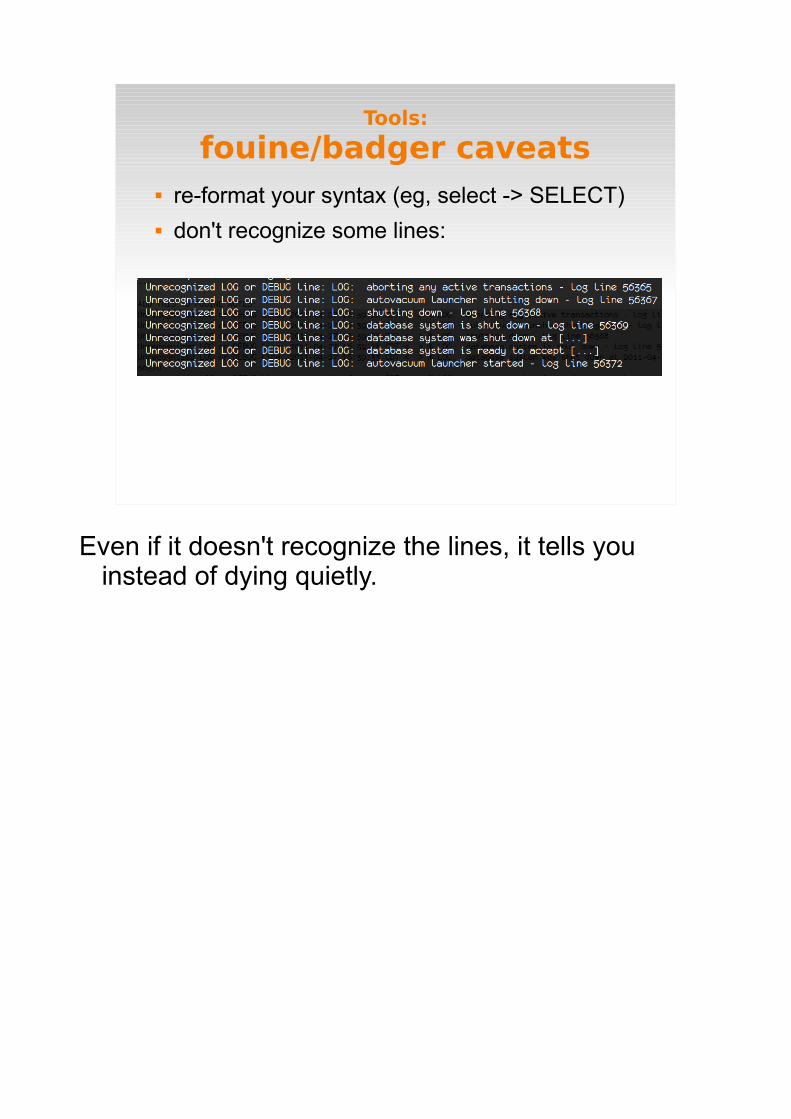
fouine/badger caveats re-format your syntax (eg, select -> SELECT) don't recognize some lines:

Further tweaking
photo benfulton. Creative Commons license.
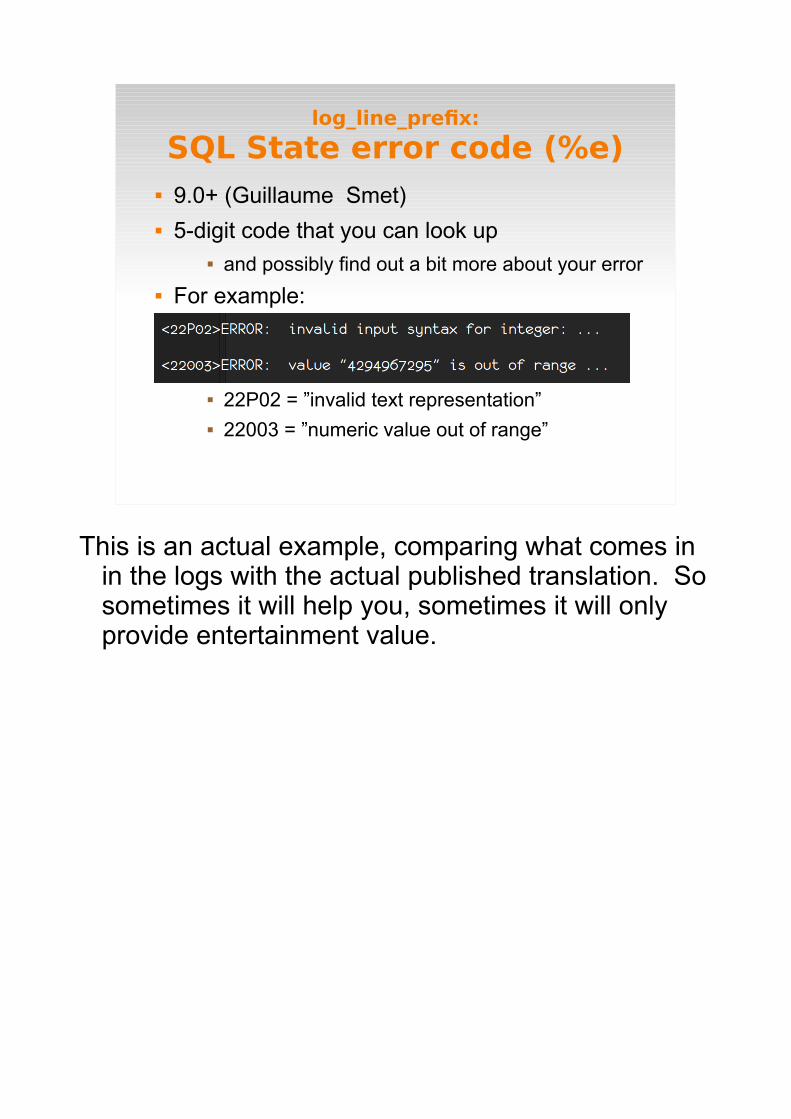
log_line_prefix:
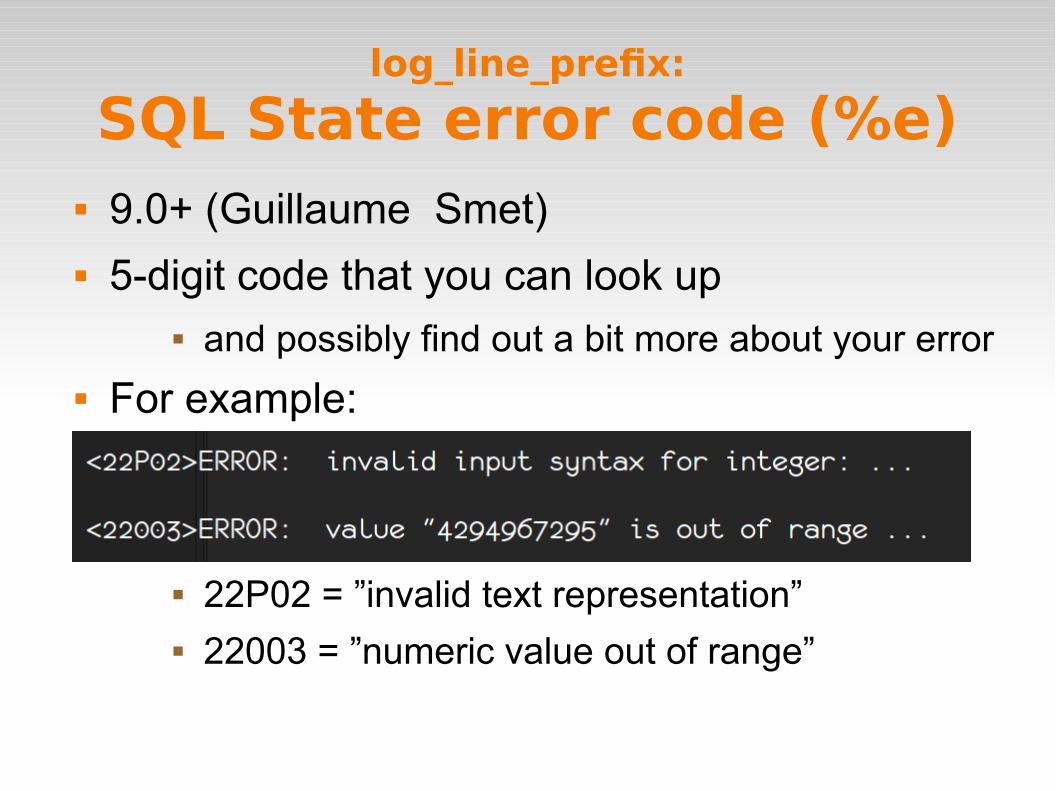
SQL State error code (%e) 9.0+ (Guillaume Smet) 5-digit code that you can look up
and possibly find out a bit more about your error
For example:
22P02 = ”invalid text representation” 22003 = ”numeric value out of range”
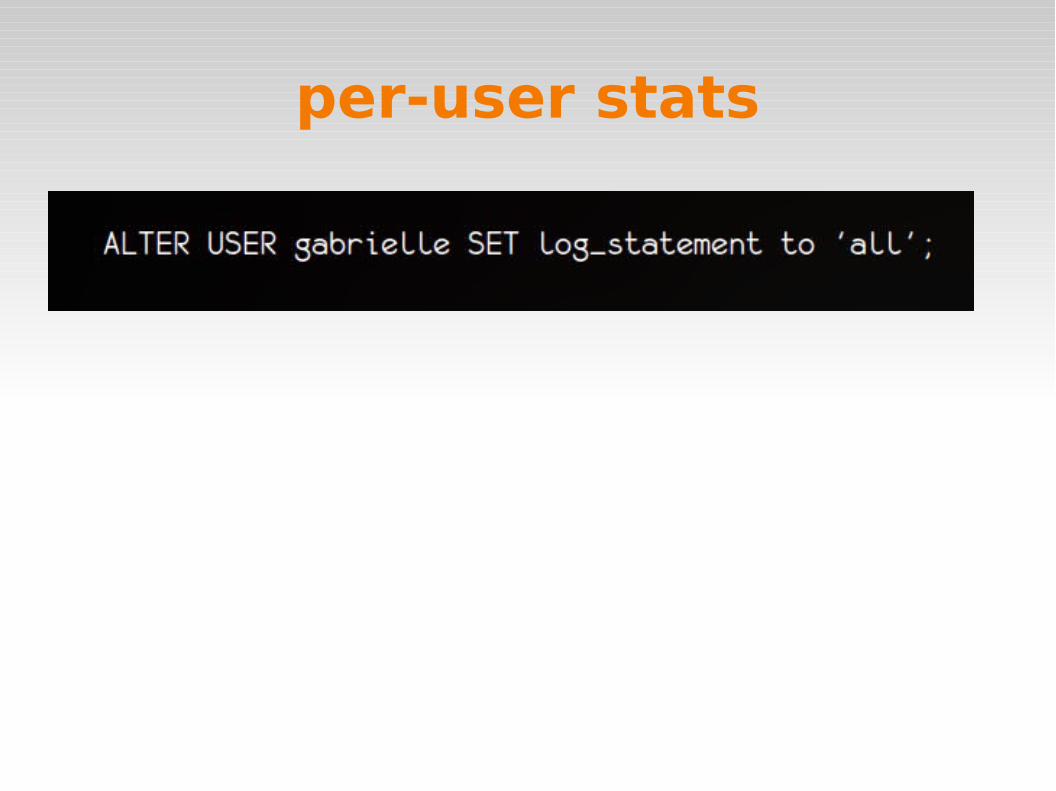
per-user stats
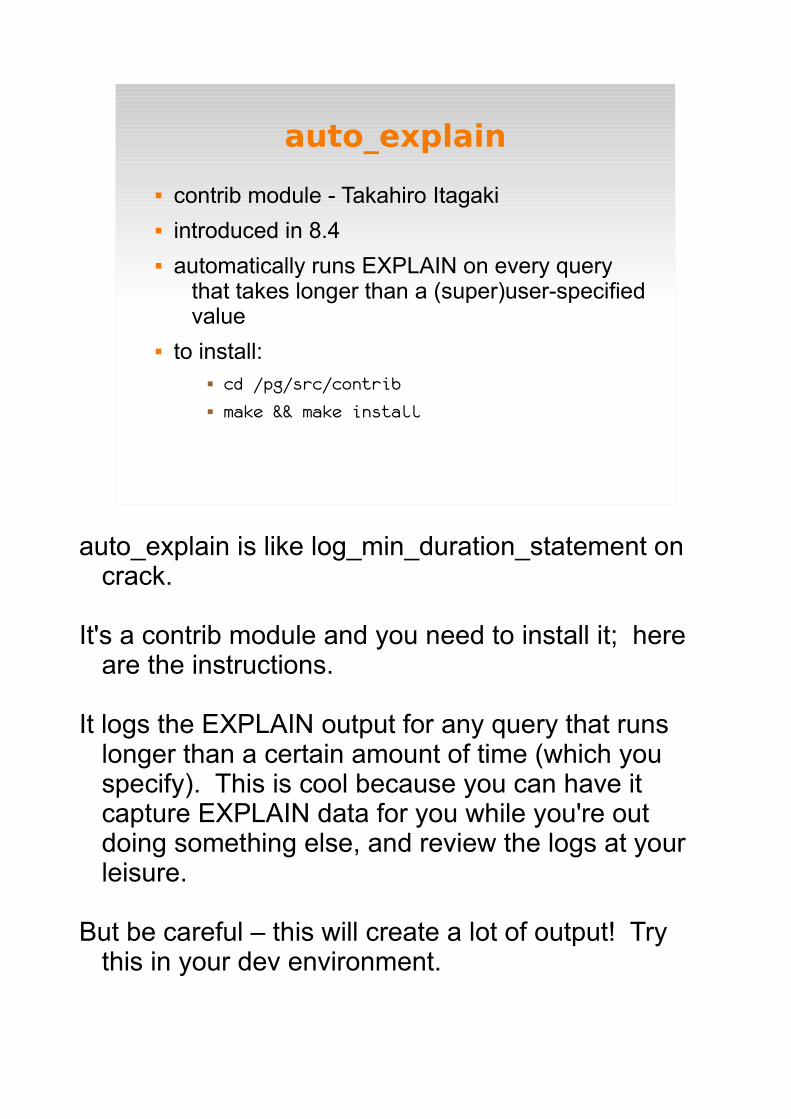
auto_explain
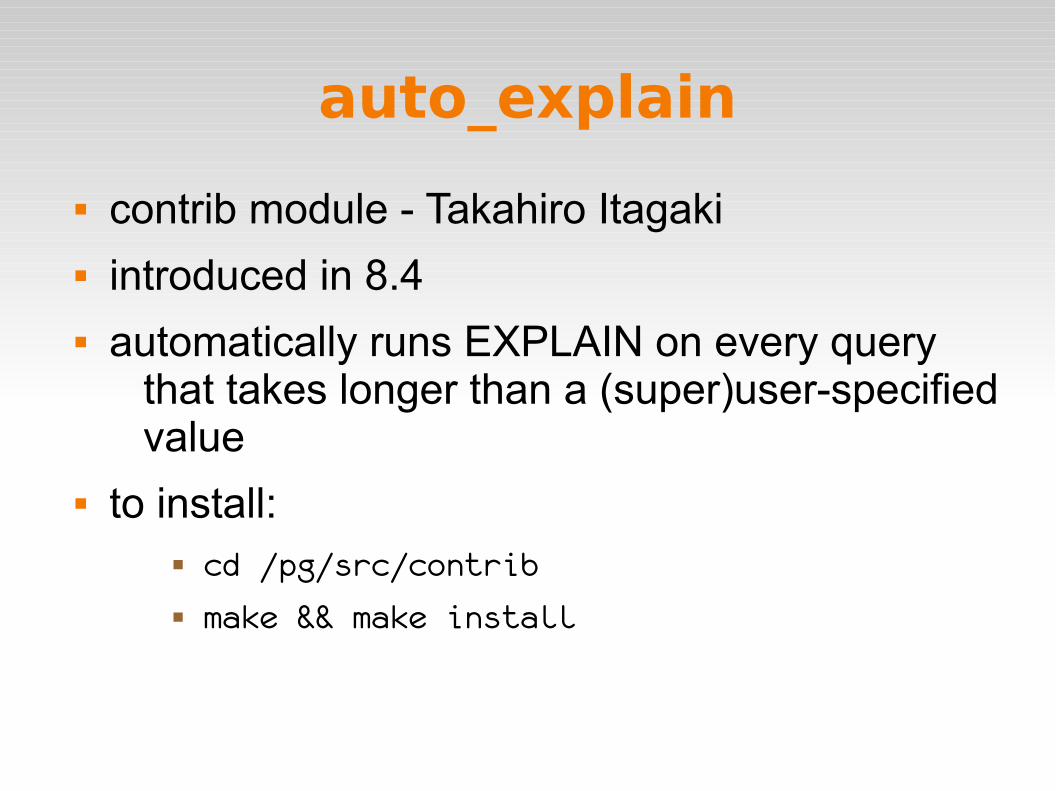
contrib module - Takahiro Itagaki introduced in 8.4 automatically runs EXPLAIN on every query
that takes longer than a (super)user-specified value
to install: cd /pg/src/contrib make && make install
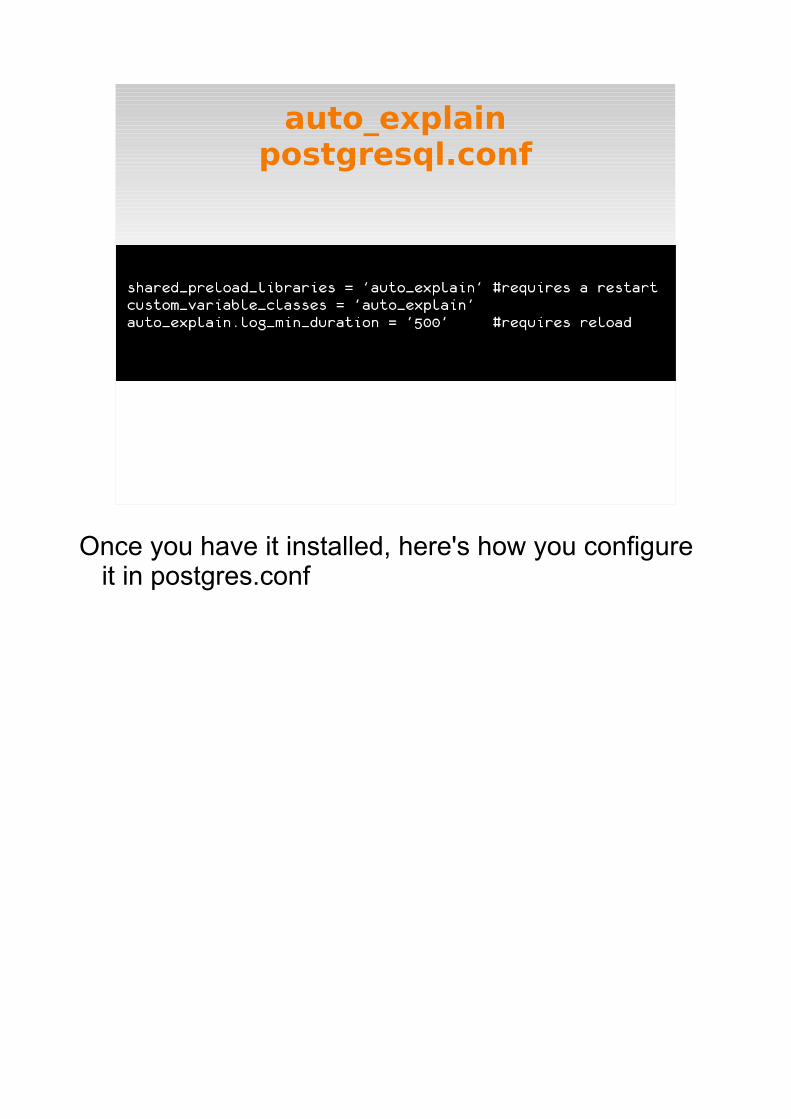
auto_explainpostgresql.conf
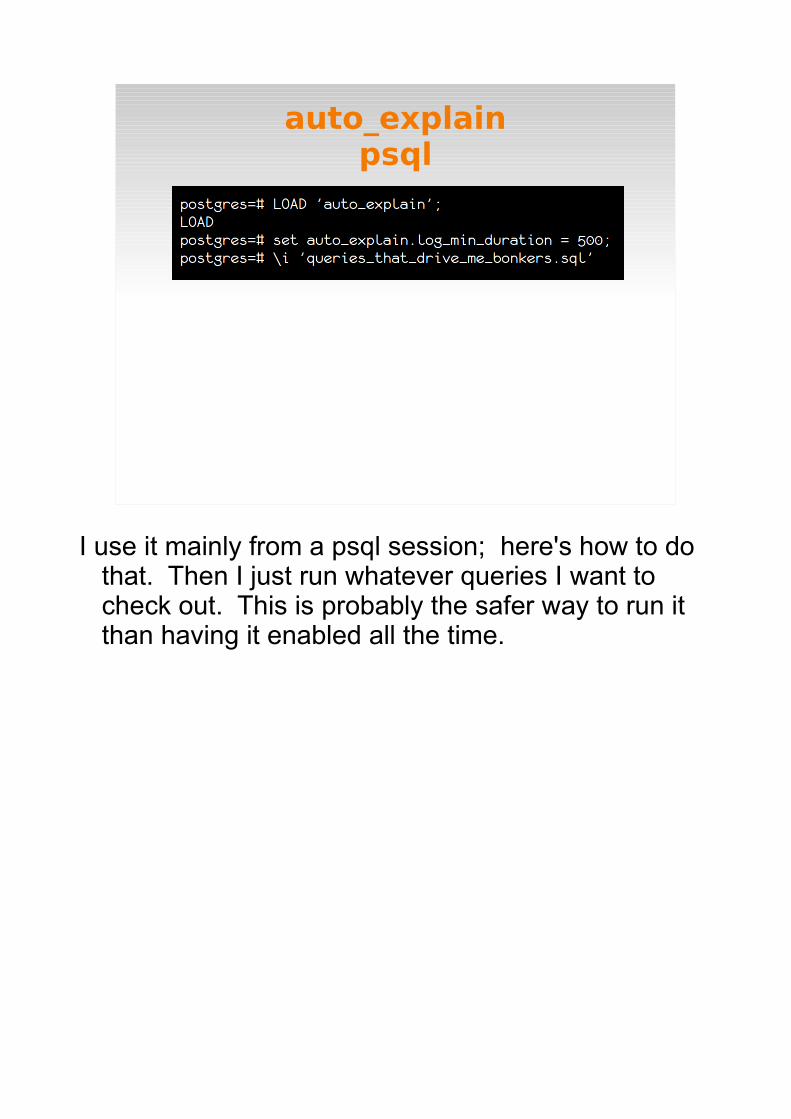
auto_explainpsql
auto_explain
2010-10-11 10:24:15 PDT [11146]: [1552-1] user=markwkm,db=dbt5 LOG: duration: 0.048 ms plan: Query Text: UPDATE customer_account SET ca_bal = ca_bal + -11675.200000 WHERE ca_id = 43000039241 Update (cost=0.00..8.28 rows=1 width=71) -> Index Scan using pk_customer_account on customer_account (cost=0.00..8.28 rows=1 width=71) Index Cond: ((ca_id)::bigint = 43000039241::bigint)2010-10-11 10:24:15 PDT [11472]: [705-1] user=markwkm,db=dbt5 LOG: duration: 12.903 ms plan: Query Text: SELECT * FROM SecurityDetailFrame1(false,8,'2002-2-12','RDEN') Function Scan on securitydetailframe1 (cost=0.00..10.00 rows=1000 width=1080)
One last thing:
Instead:
Safety first (sort of)!
Manage postgresql.conf in $vcs git, svn, whatever
Put your logs on their own partition Don't dink around with your settings and leave
for the weekend. Monitor your monitoring (it's meta!)
especially file sizes/disk space
That's it!
photo by kcxd (flickr). Creative Commons license.
More...
”Query Logging and Workload Analysis”
Greg Smith
19 Sep 1:30pm

Thank you!
console font: monofur by tobias b koehler http://www.dafont.com/monofur.font
PDXPUG Josh Heumann feedback welcome!
Code sprint on Thursday [email protected], @gorthx
PostgreSQL Logging
Gabrielle RothEnterpriseDB
PgOpen 18 Sep 2012

...not just for lumberjacks
photo by U.S. Fish and Wildlife Service - Midwest Region. Creative Commons license.
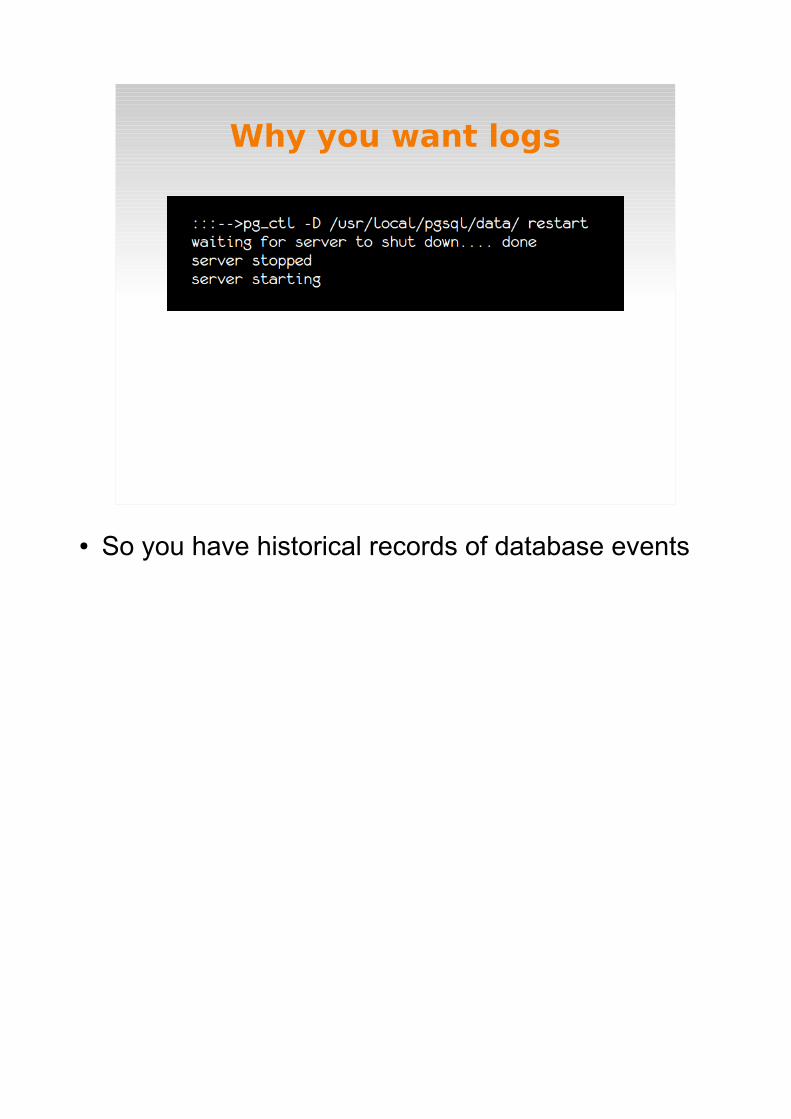
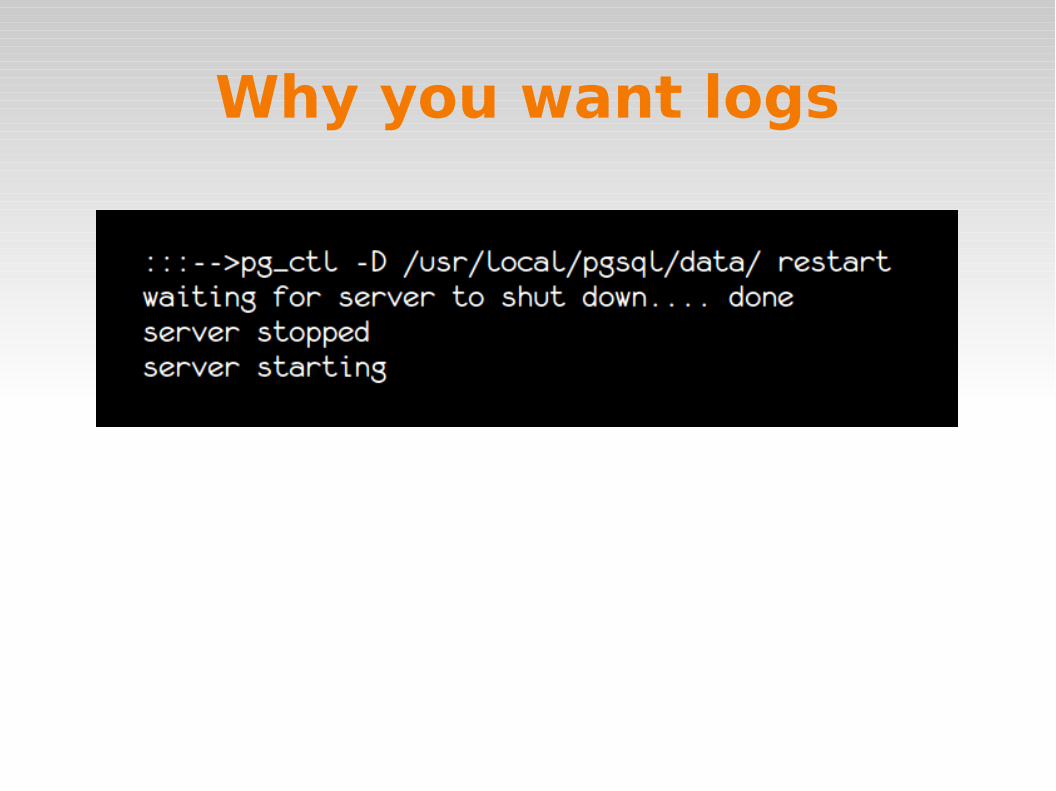
Why you want logs
● So you have historical records of database events
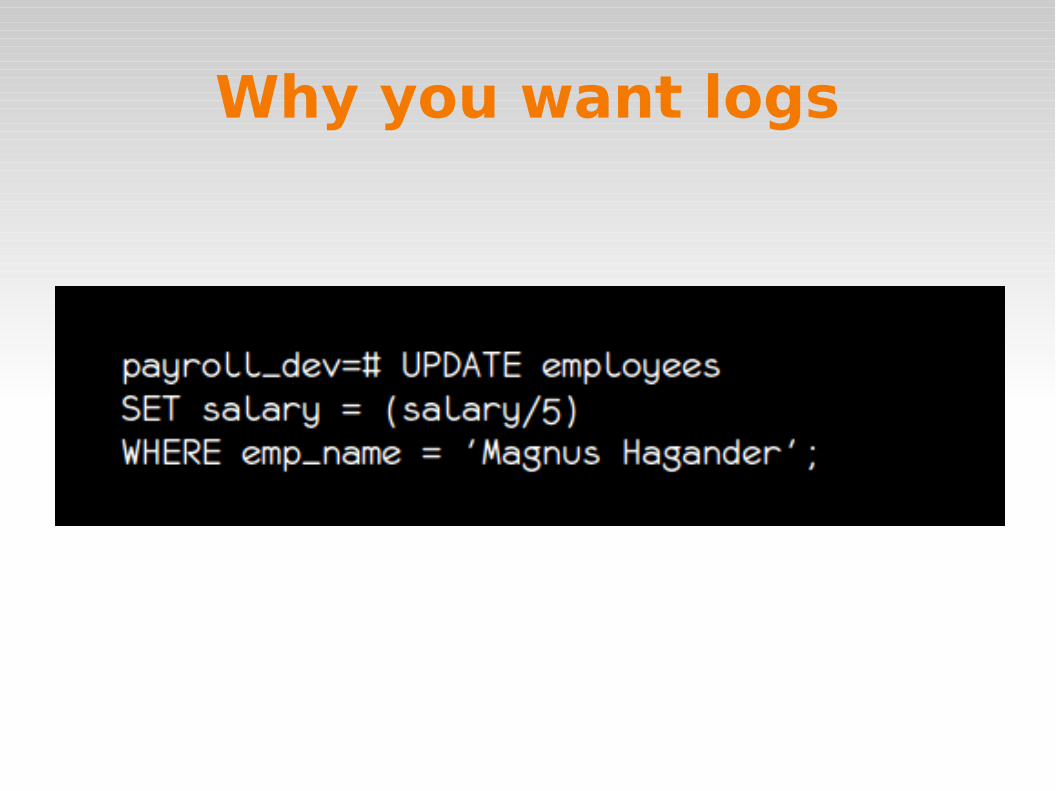
Why you want logs
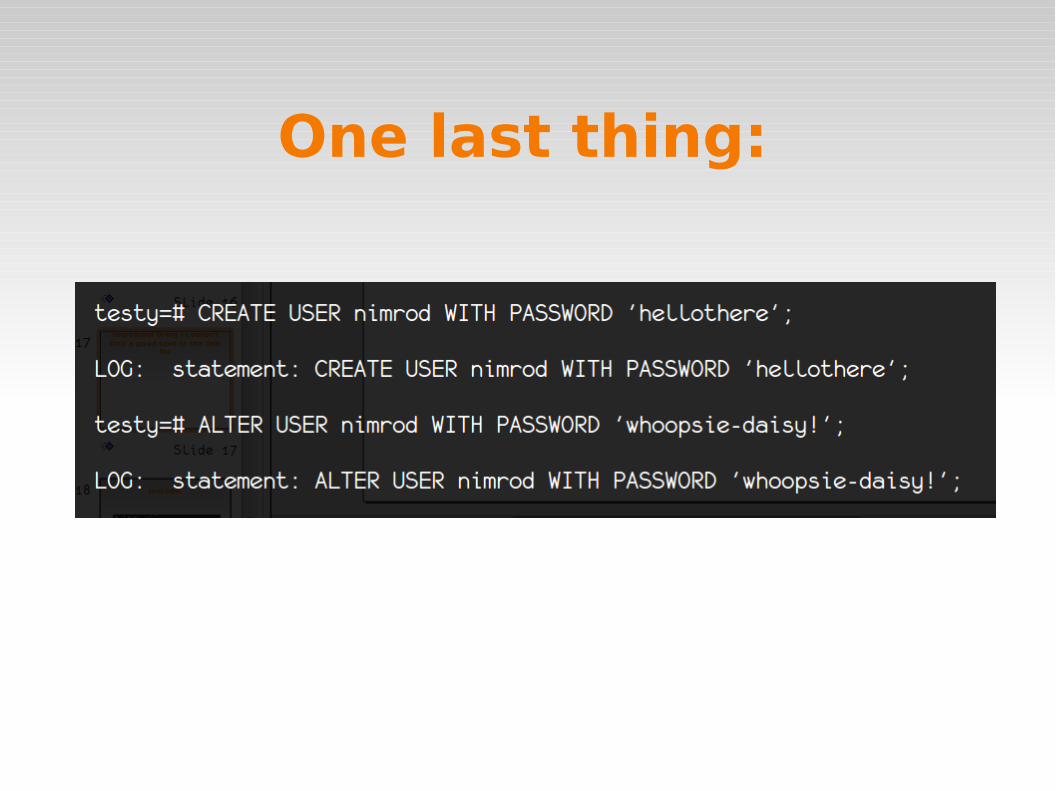
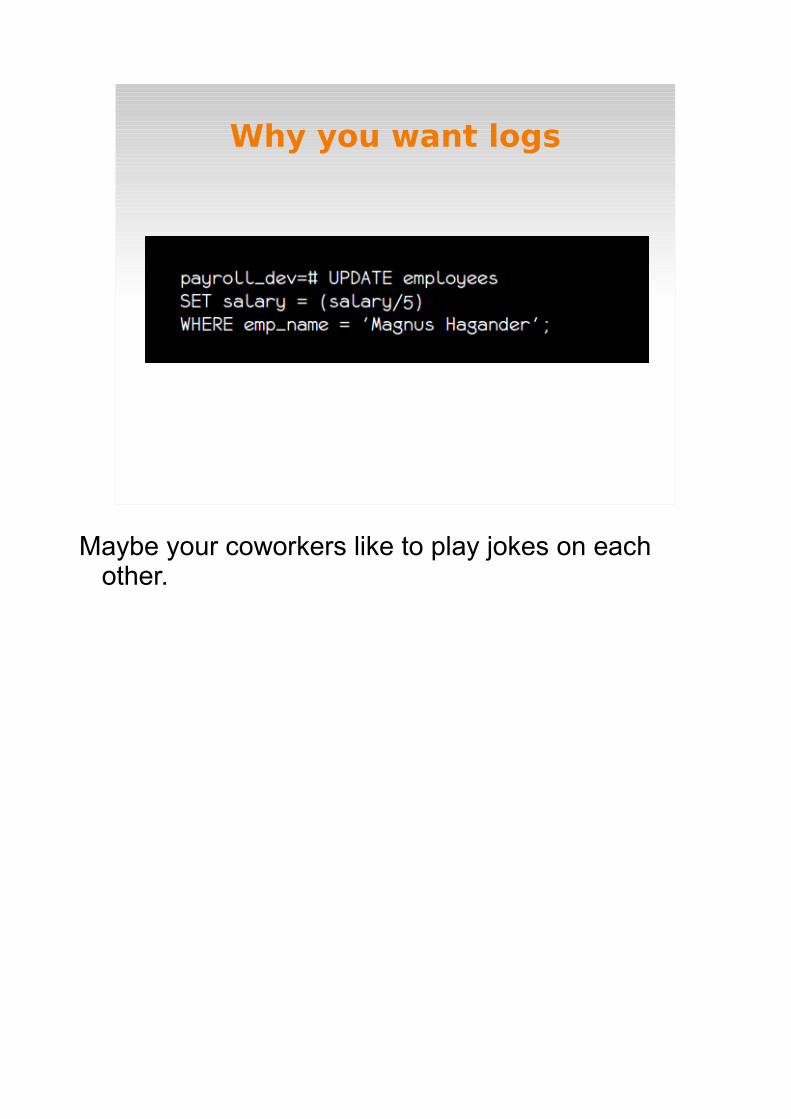
Maybe your coworkers like to play jokes on each other.
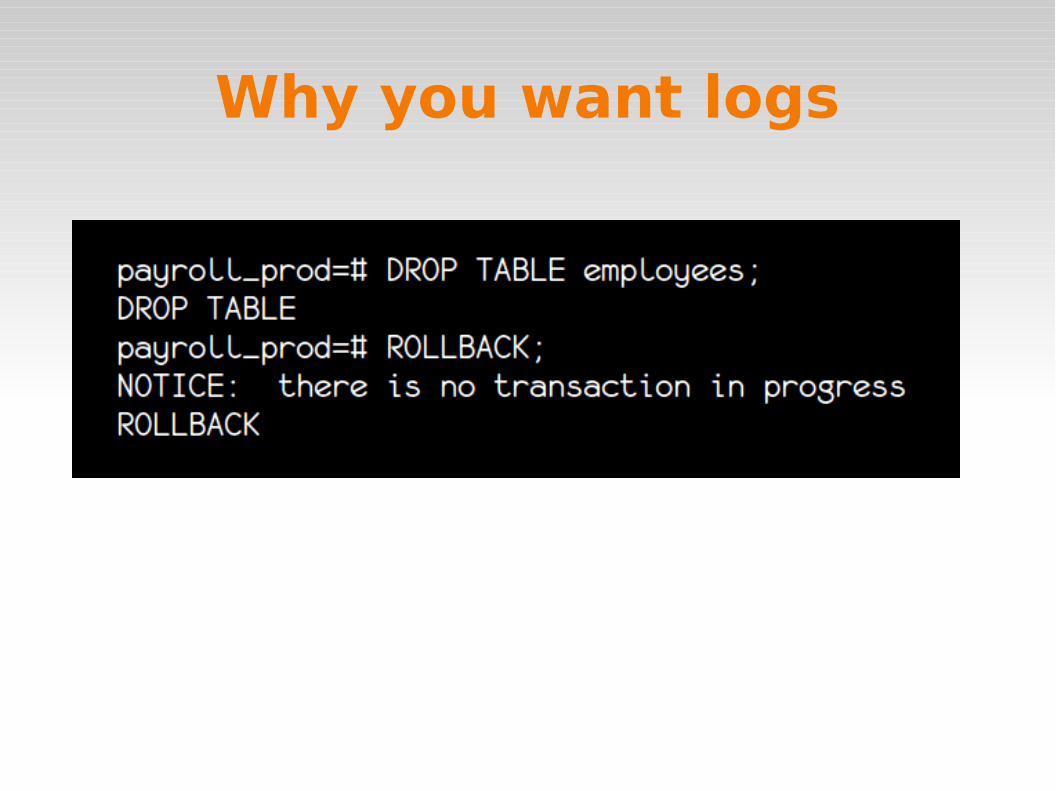
Why you want logs
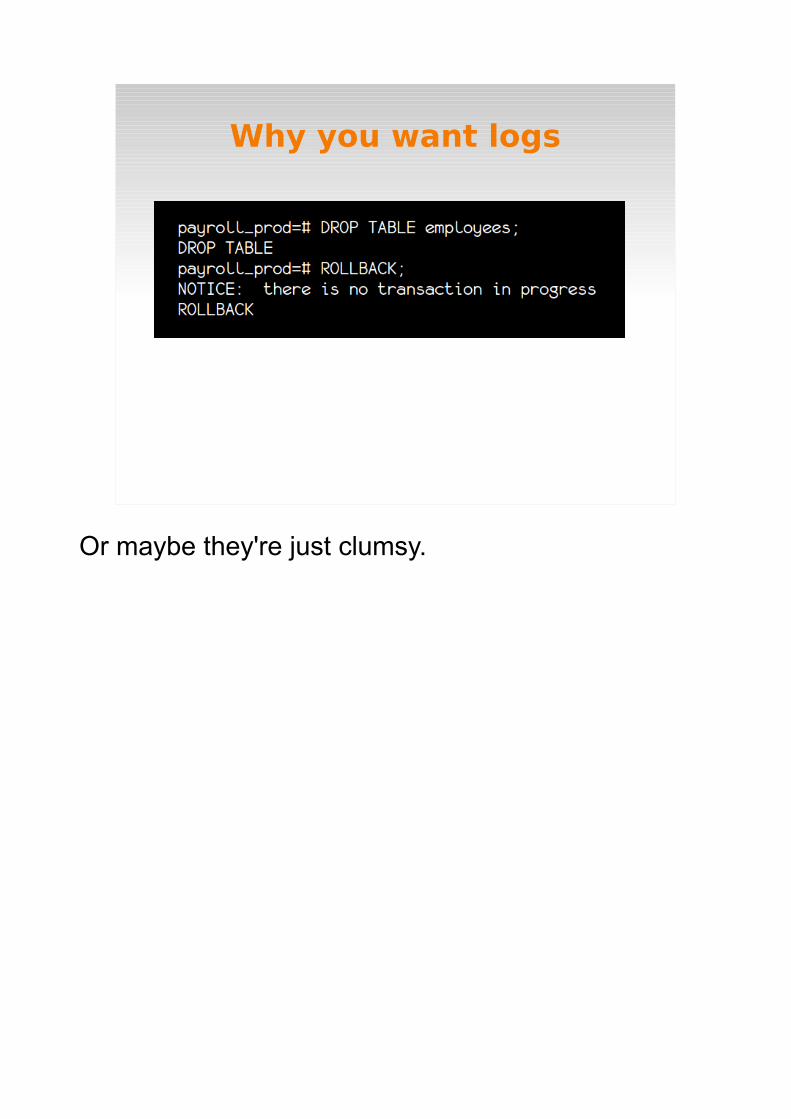
Or maybe they're just clumsy.
Why you want logs
Historical record starts, stops, reloads of config file who's connected data or schema changes
Troubleshooting aid Legal requirement
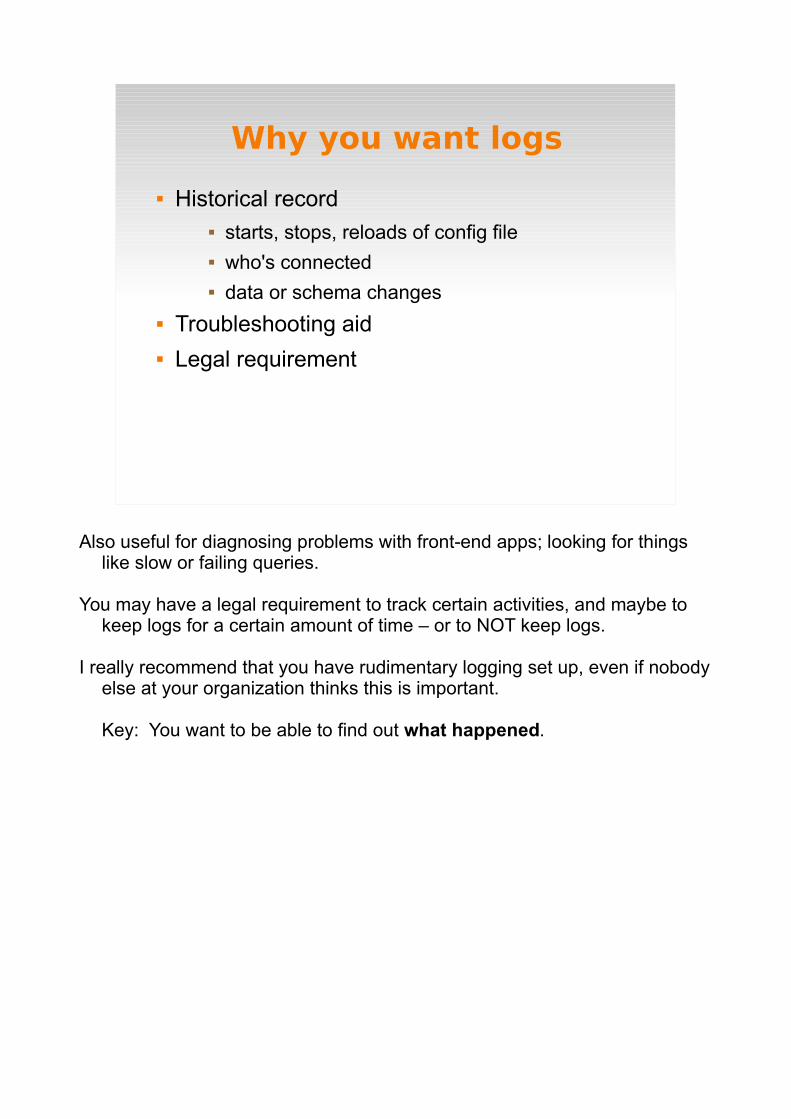
Also useful for diagnosing problems with front-end apps; looking for things like slow or failing queries.
You may have a legal requirement to track certain activities, and maybe to keep logs for a certain amount of time – or to NOT keep logs.
I really recommend that you have rudimentary logging set up, even if nobody else at your organization thinks this is important.
Key: You want to be able to find out what happened.
The Basics
photo from brittgow (flickr). Creative Commons license.
● comes with postgres, but not enabled by default● all you have to do is turn it on!
The Basics:
How to get logsEasy!
make this change to postgresql.conf ...and restart
● Go find this parameter in postgresql.conf, uncomment it & change it to on, and restart the database.
● Then go see what you have in your logs.● In this talk, the commented lines are the default
values from postgresql.conf. New values are uncommented and altered.
● It really is just this simple!
● There are a couple more things you need to know though.

The Basics:A few more things you need to know...
Find your logs at: $PGDATA/pg_log/postgresql-[timestamp].log aka: log_directory and log_filename
The Basics:A few more things you need to know...
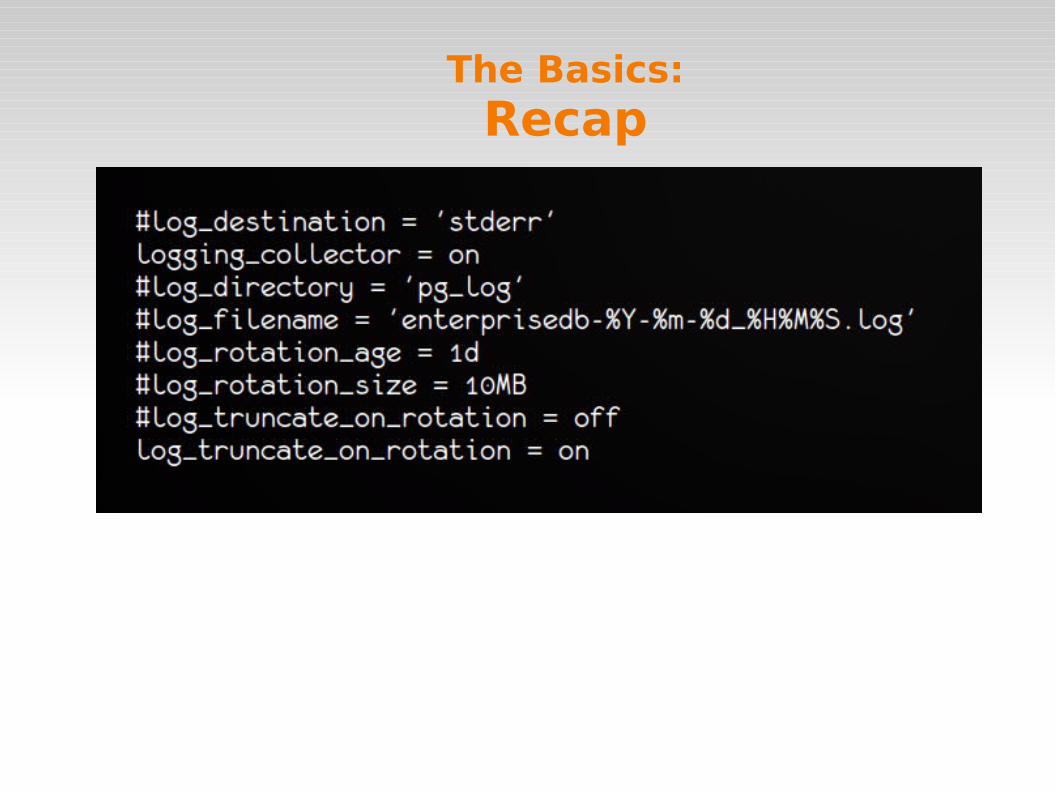
#log_filename = 'postgresql-%Y-%m-%d_%H%M%S.log'
#log_rotation_age = 1d
#log_rotation_size = 10MB
don't forget to clean up!
log_rotation_age = 0 disableslog_rotation_size = 0 disables
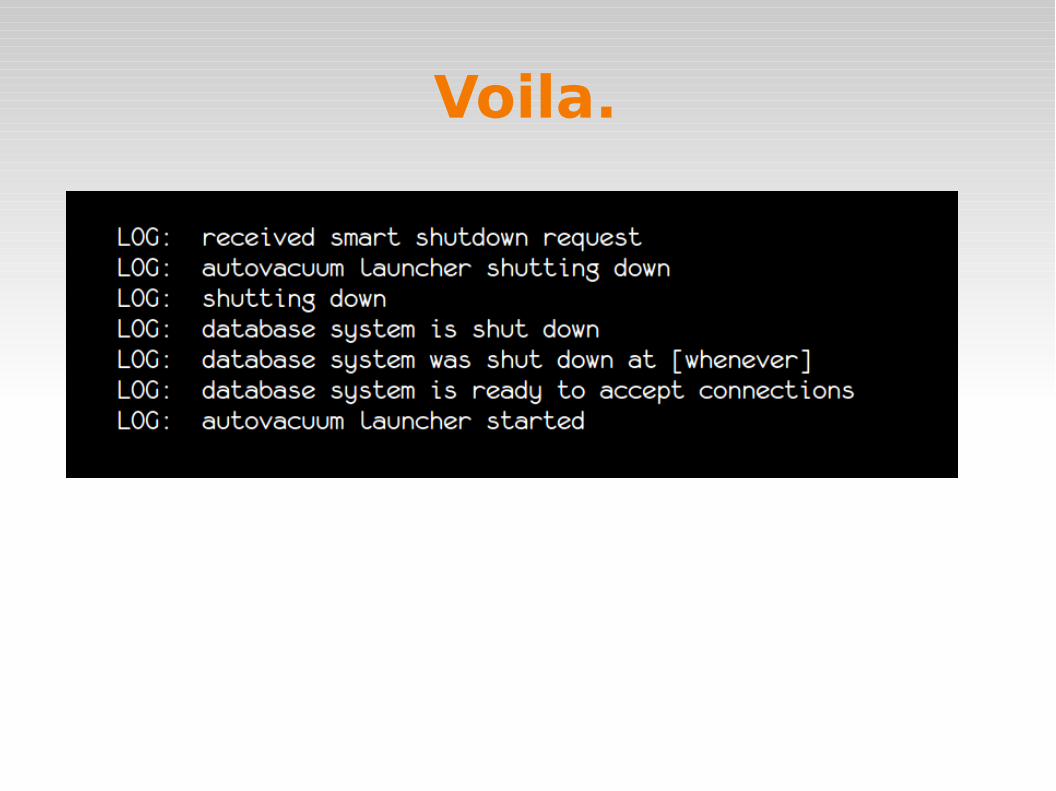
Voila.
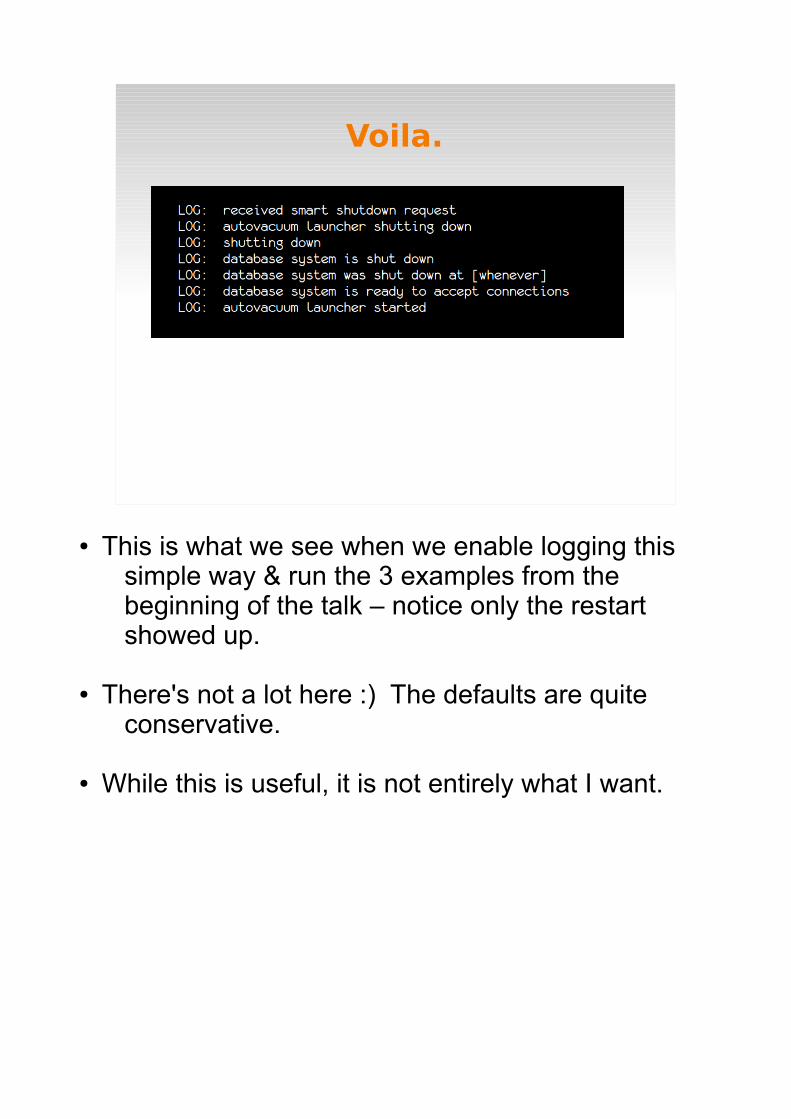
● This is what we see when we enable logging this simple way & run the 3 examples from the beginning of the talk – notice only the restart showed up.
● There's not a lot here :) The defaults are quite conservative.
● While this is useful, it is not entirely what I want.

The Basics:Recap

...now let's customize it a bit
photo © Shanti Isenagle. Used with permission.
Logging-related GUCs inpostgresql.conf
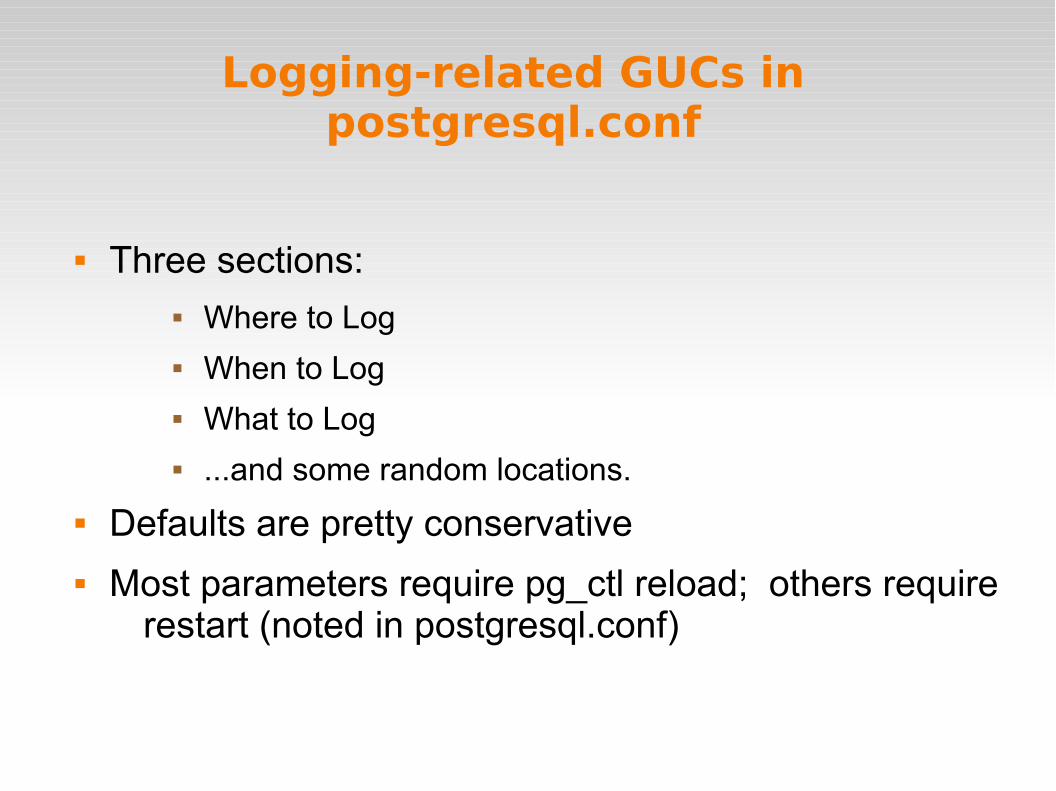
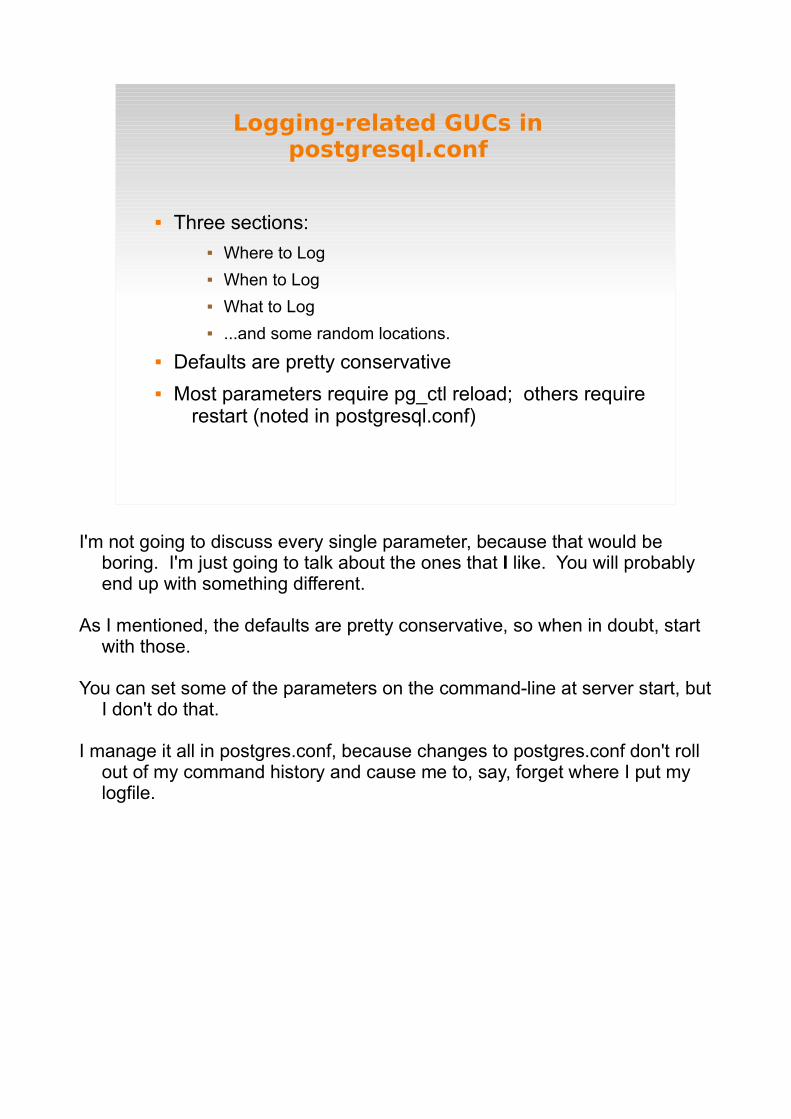
Three sections: Where to Log When to Log What to Log ...and some random locations.
Defaults are pretty conservative
Most parameters require pg_ctl reload; others require restart (noted in postgresql.conf)
I'm not going to discuss every single parameter, because that would be boring. I'm just going to talk about the ones that I like. You will probably end up with something different.
As I mentioned, the defaults are pretty conservative, so when in doubt, start with those.
You can set some of the parameters on the command-line at server start, but I don't do that.
I manage it all in postgres.conf, because changes to postgres.conf don't roll out of my command history and cause me to, say, forget where I put my logfile.
Customize:
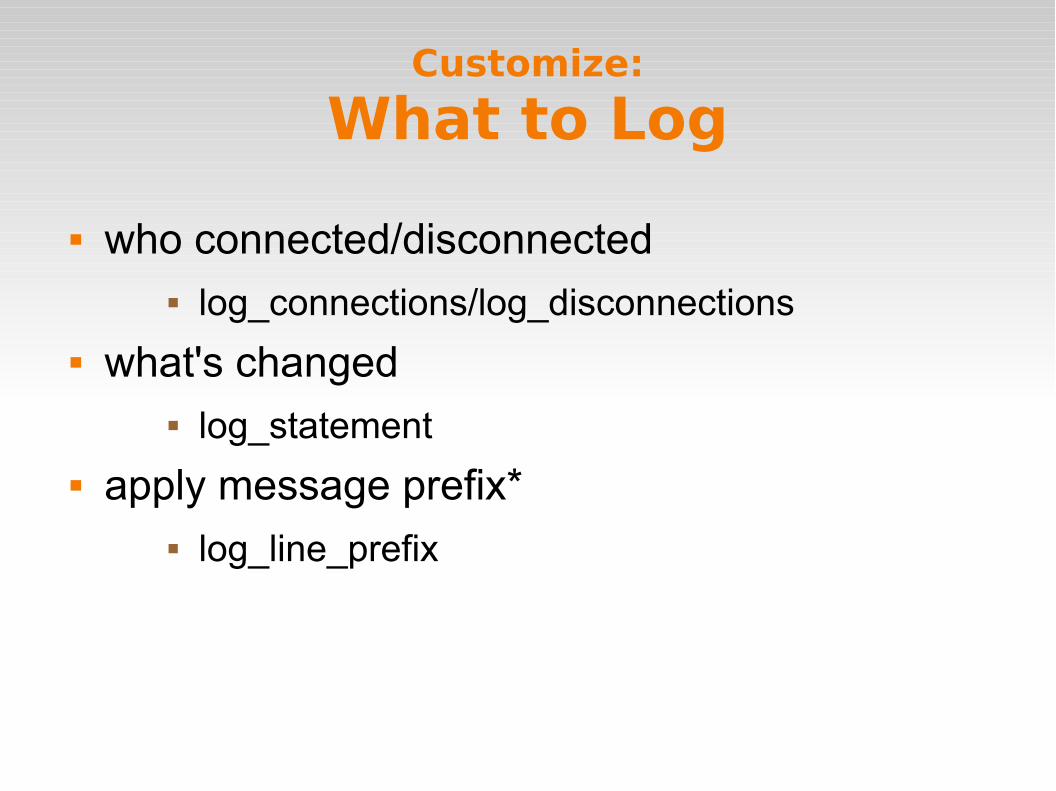
What to Log
who connected/disconnected log_connections/log_disconnections
what's changed log_statement
apply message prefix* log_line_prefix
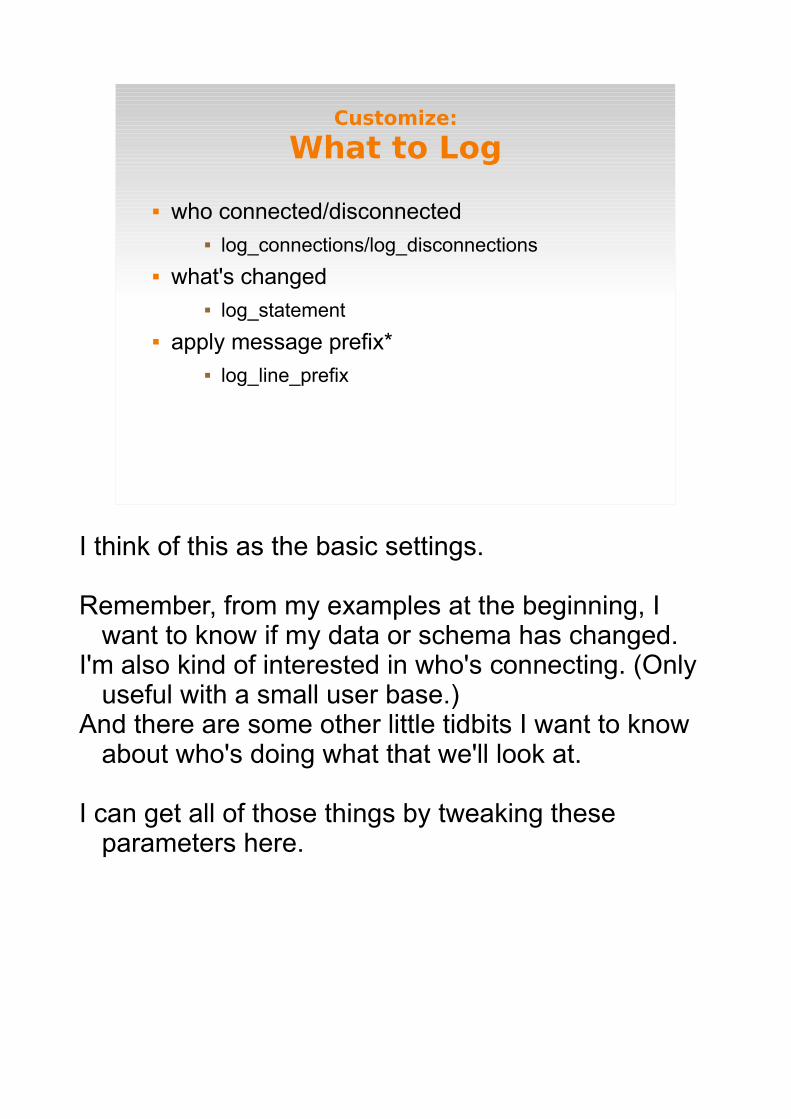
I think of this as the basic settings.
Remember, from my examples at the beginning, I want to know if my data or schema has changed.
I'm also kind of interested in who's connecting. (Only useful with a small user base.)
And there are some other little tidbits I want to know about who's doing what that we'll look at.
I can get all of those things by tweaking these parameters here.
Customize:who connected
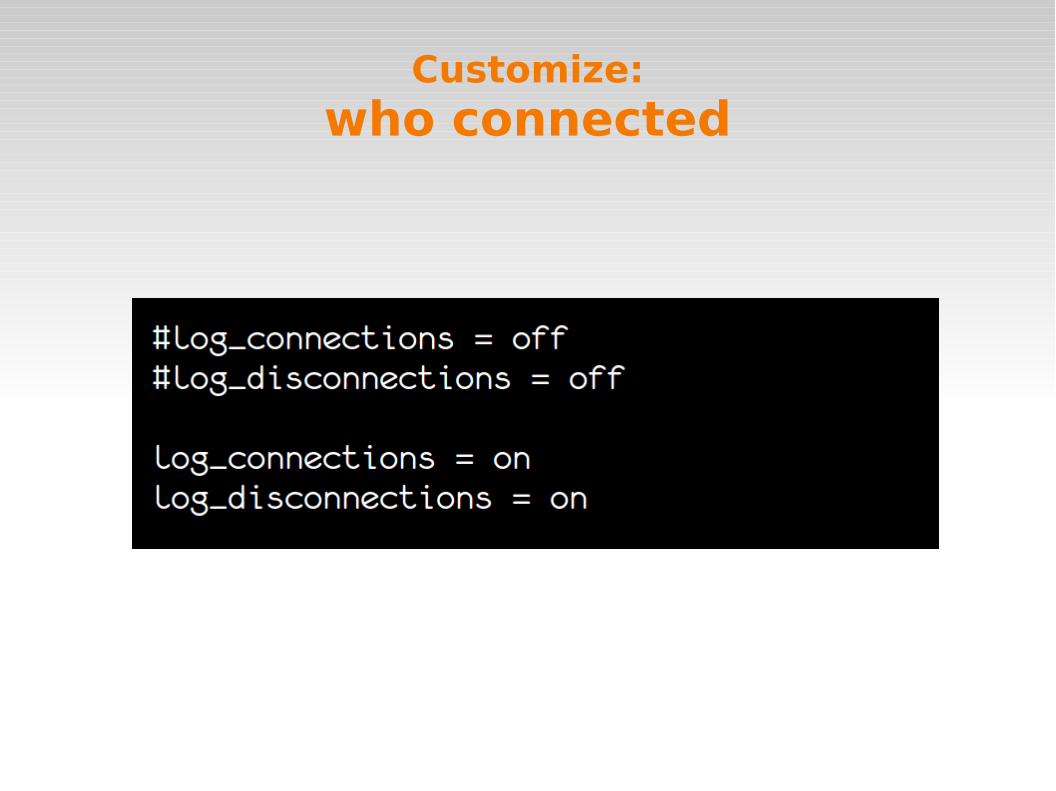
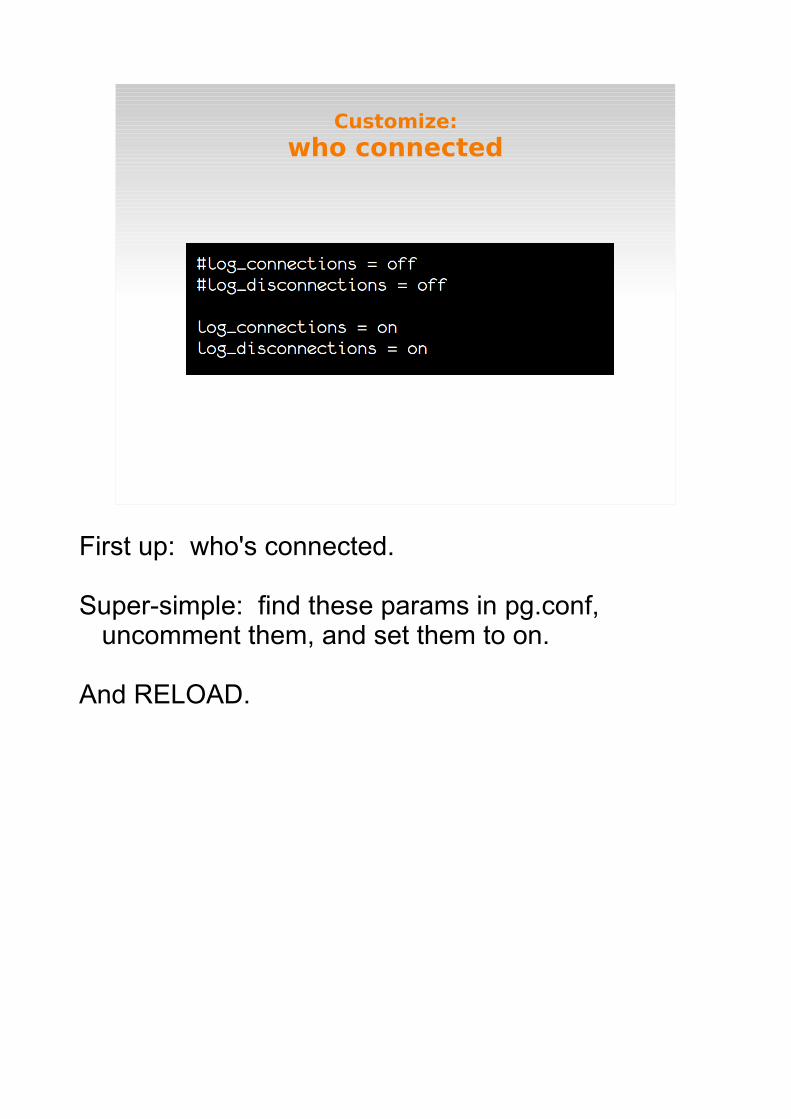
First up: who's connected.
Super-simple: find these params in pg.conf, uncomment them, and set them to on.
And RELOAD.
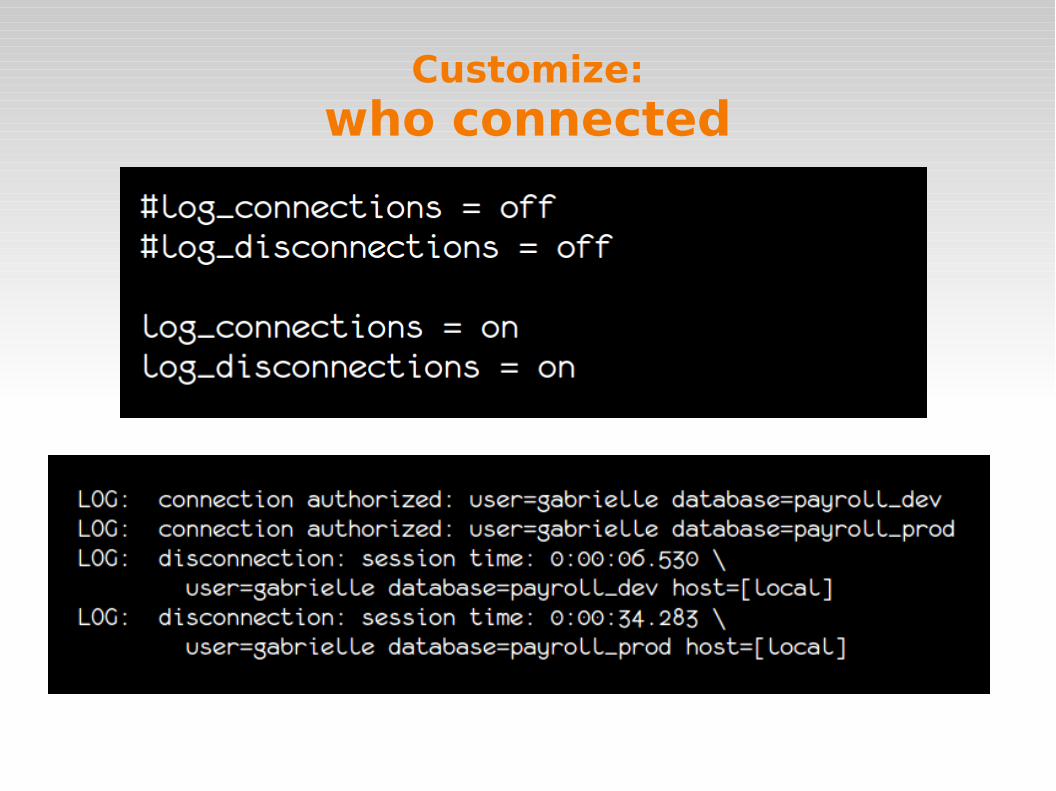
Customize:who connected
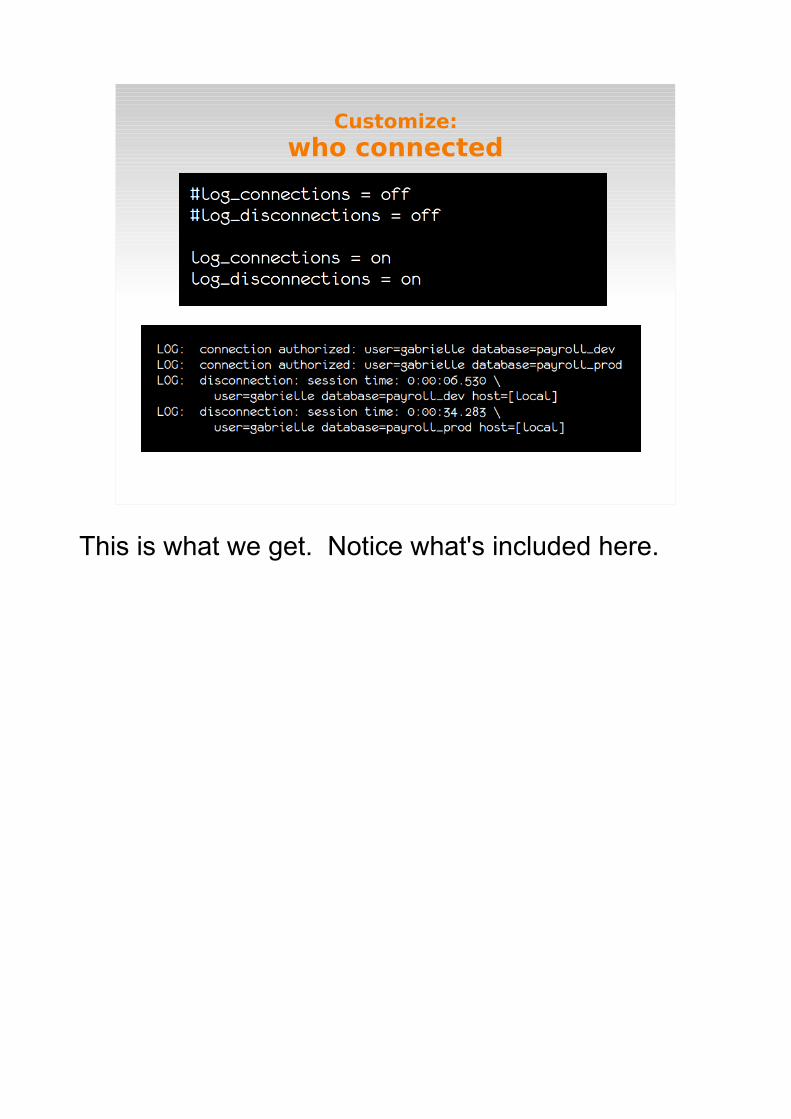
This is what we get. Notice what's included here.
Customize:what's changed
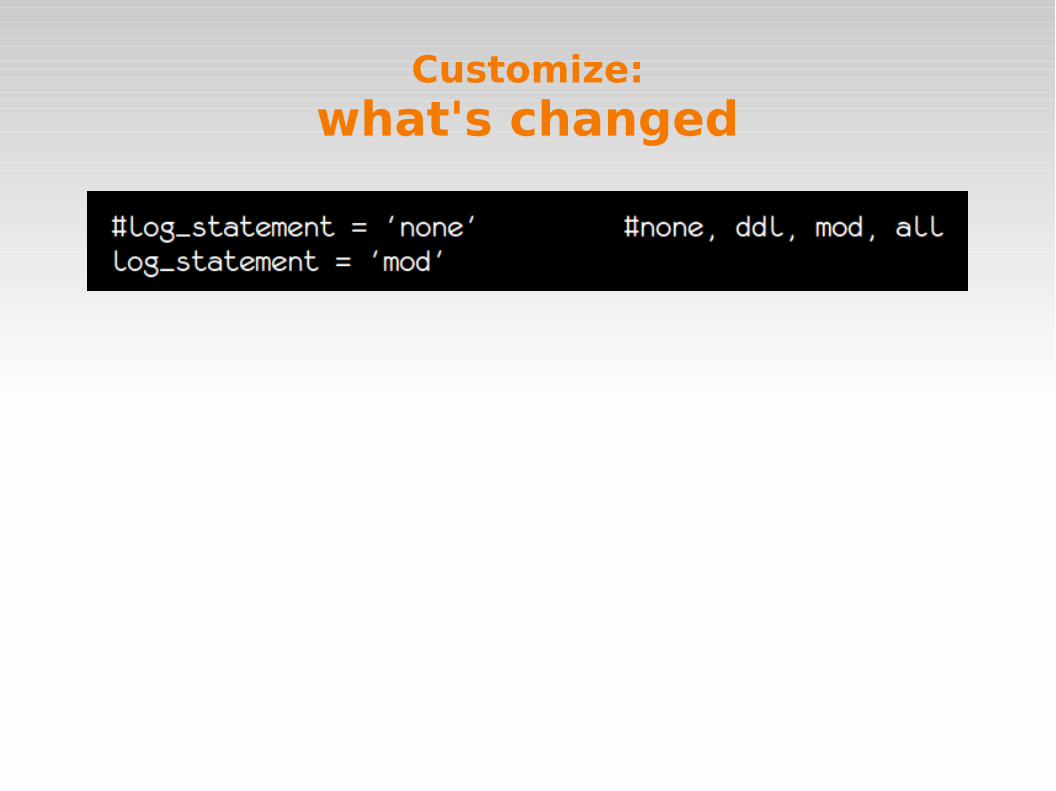
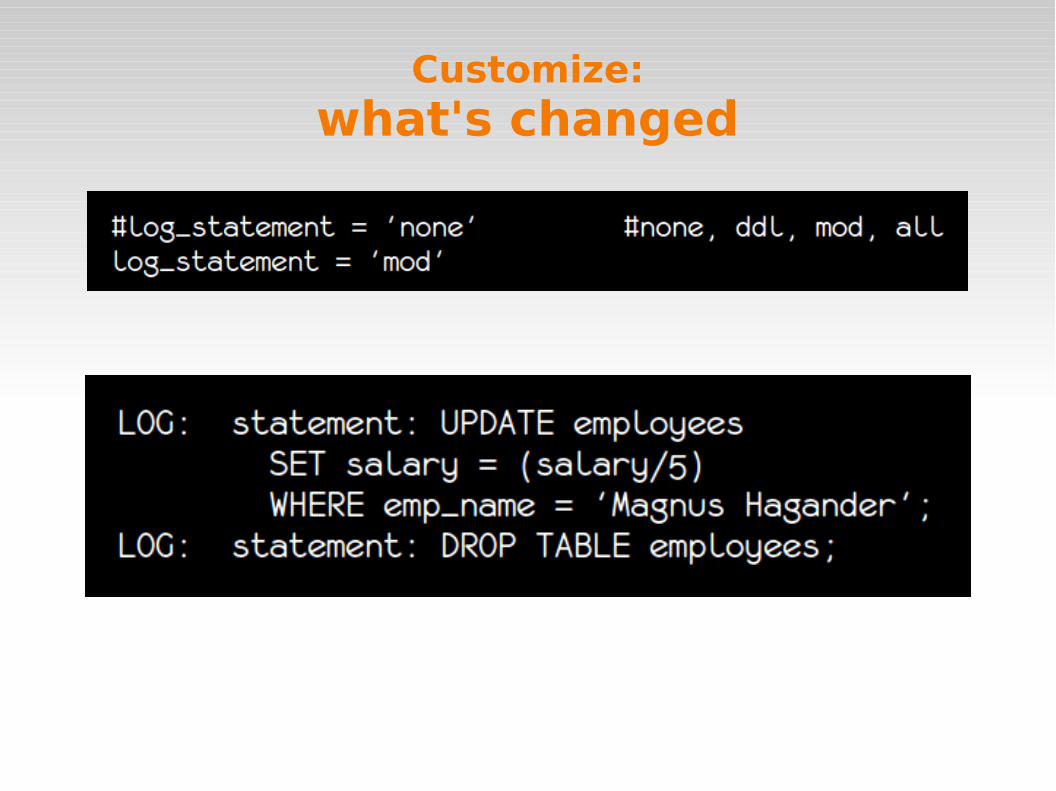
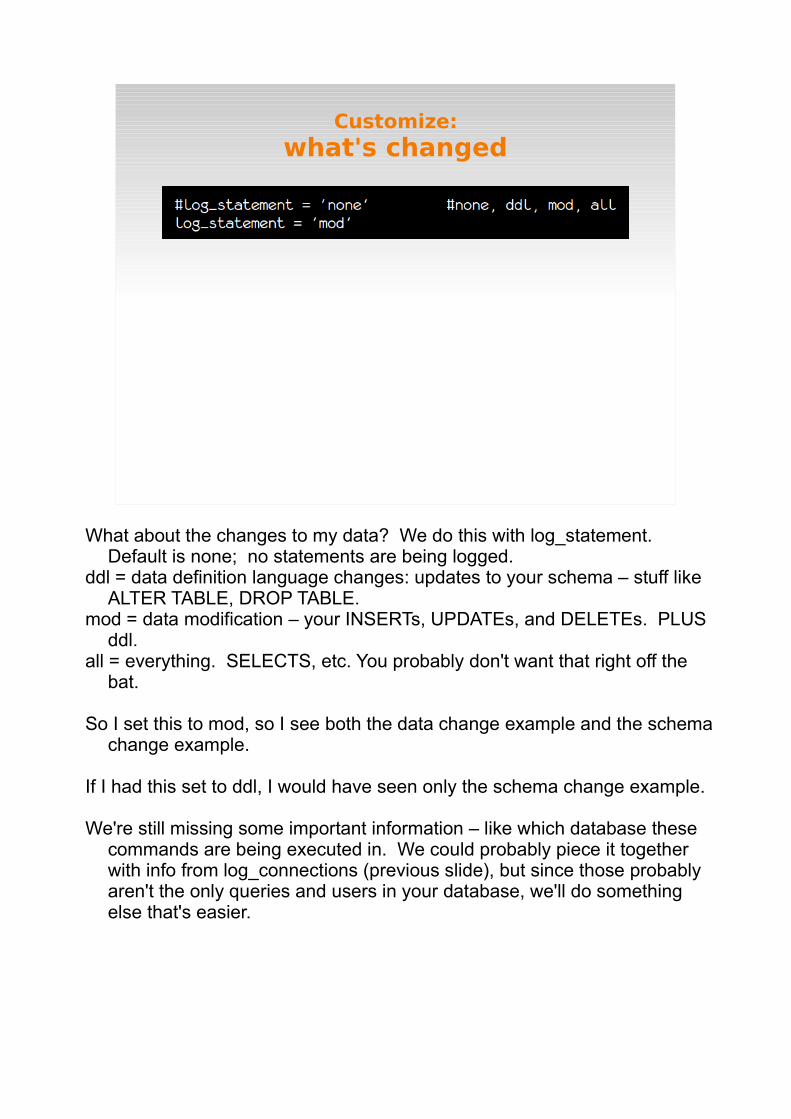
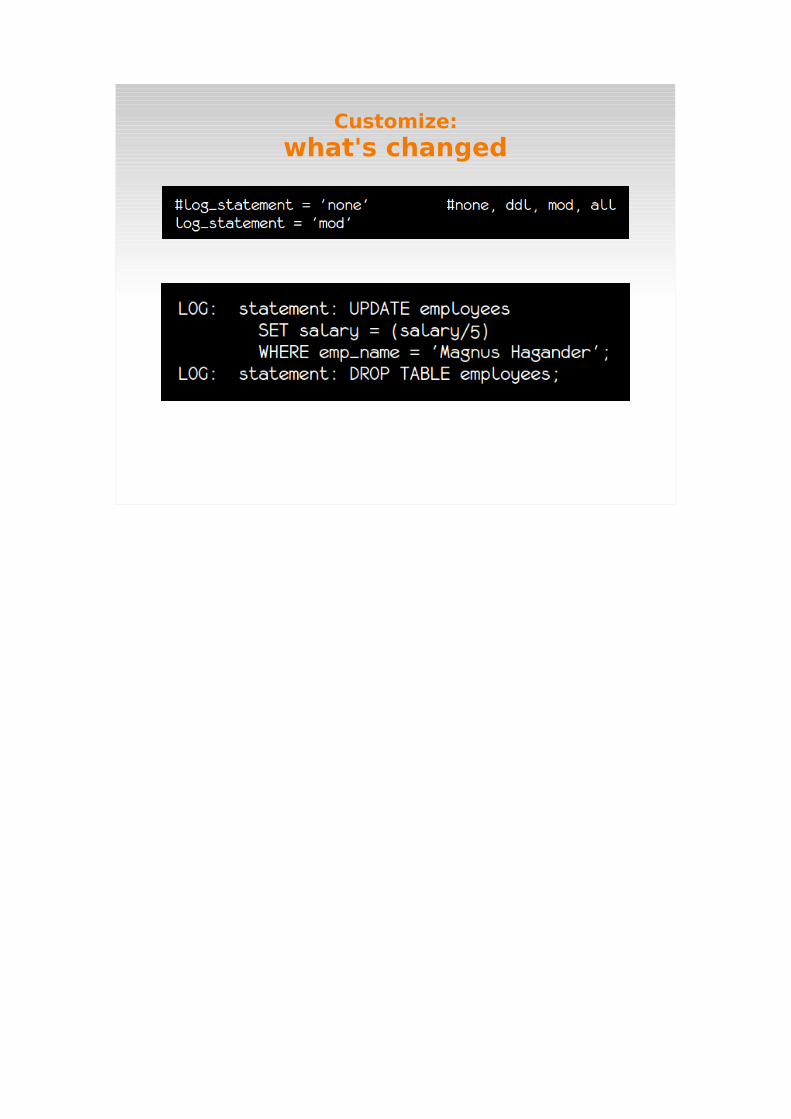
What about the changes to my data? We do this with log_statement. Default is none; no statements are being logged.
ddl = data definition language changes: updates to your schema – stuff like ALTER TABLE, DROP TABLE.
mod = data modification – your INSERTs, UPDATEs, and DELETEs. PLUS ddl.
all = everything. SELECTS, etc. You probably don't want that right off the bat.
So I set this to mod, so I see both the data change example and the schema change example.
If I had this set to ddl, I would have seen only the schema change example.
We're still missing some important information – like which database these commands are being executed in. We could probably piece it together with info from log_connections (previous slide), but since those probably aren't the only queries and users in your database, we'll do something else that's easier.
Customize:what's changed
Customize:add a message prefix
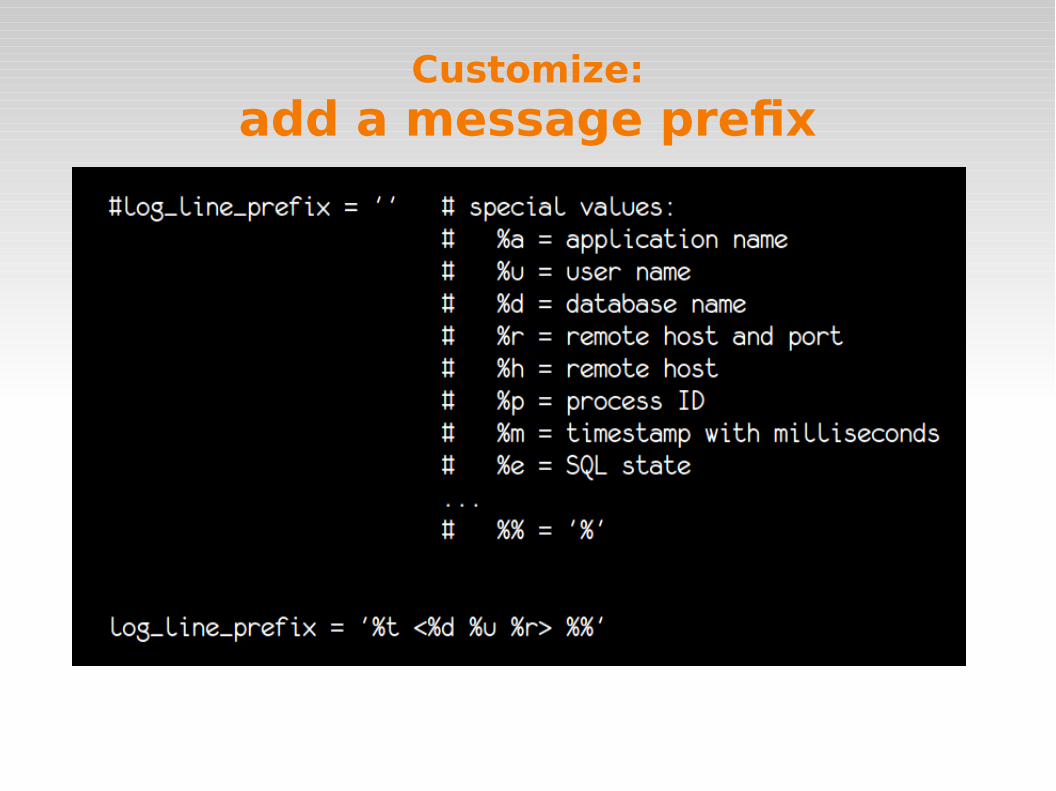
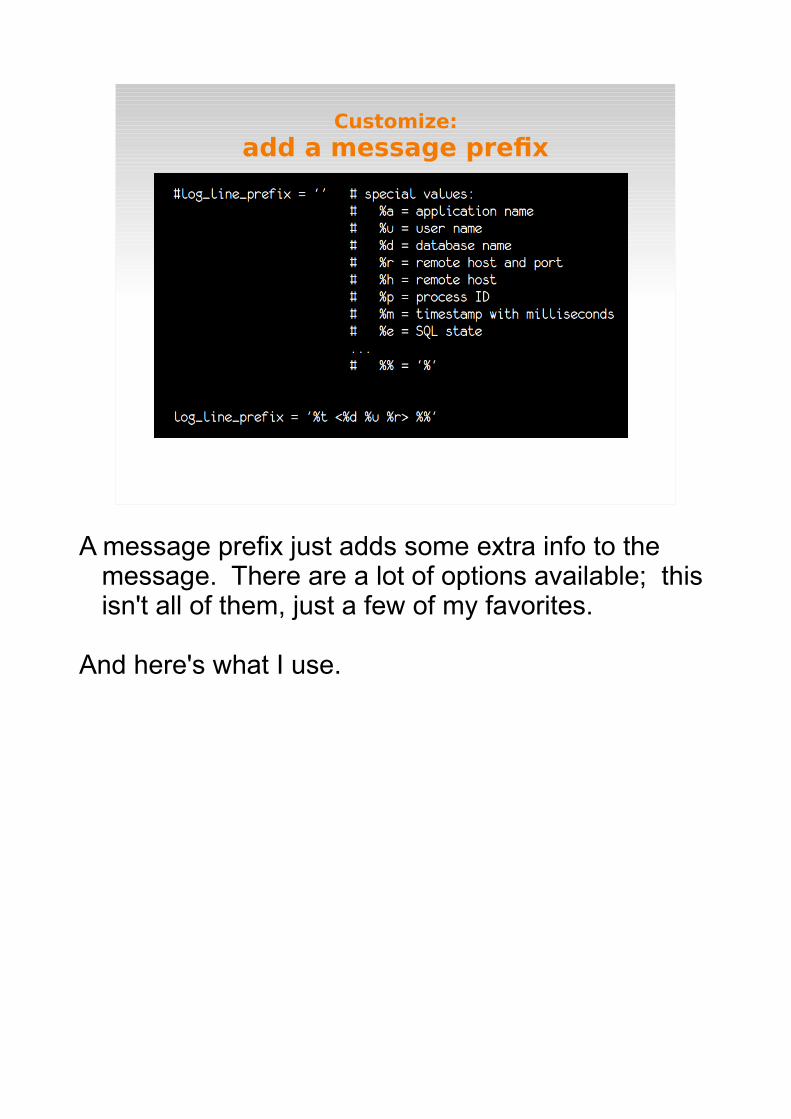
A message prefix just adds some extra info to the message. There are a lot of options available; this isn't all of them, just a few of my favorites.
And here's what I use.
Customize:add a message prefix
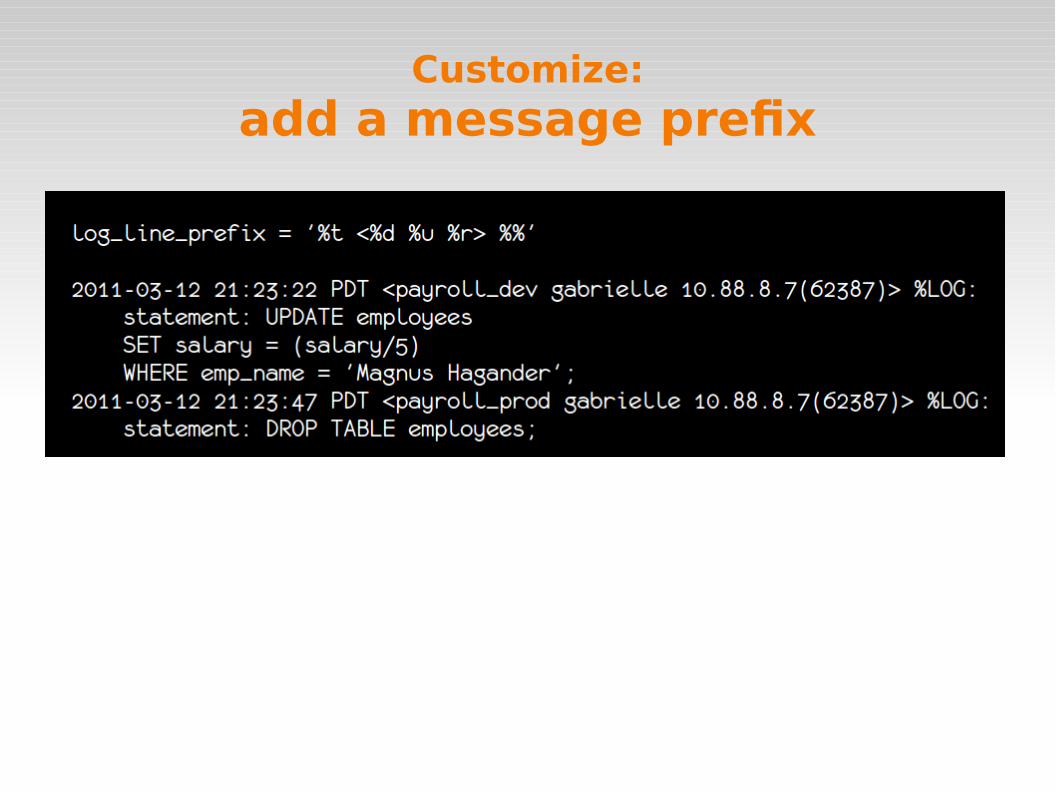
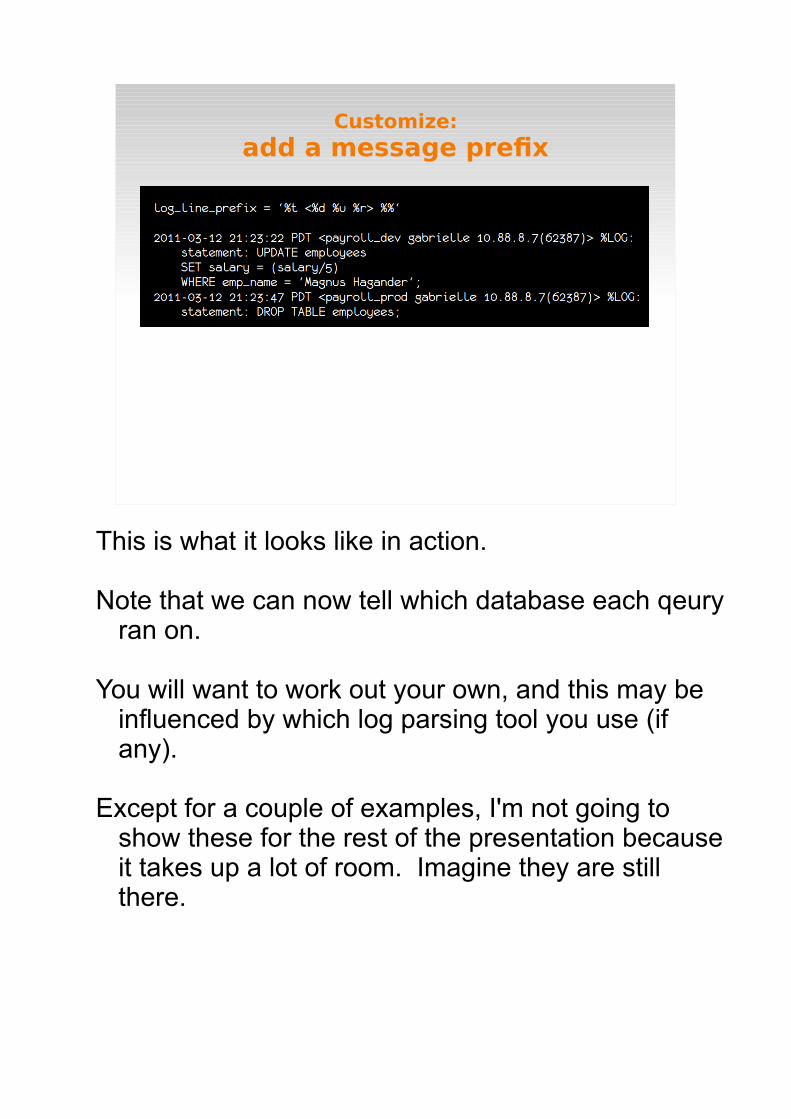
This is what it looks like in action.
Note that we can now tell which database each qeury ran on.
You will want to work out your own, and this may be influenced by which log parsing tool you use (if any).
Except for a couple of examples, I'm not going to show these for the rest of the presentation because it takes up a lot of room. Imagine they are still there.
Customize:resolve the hostname
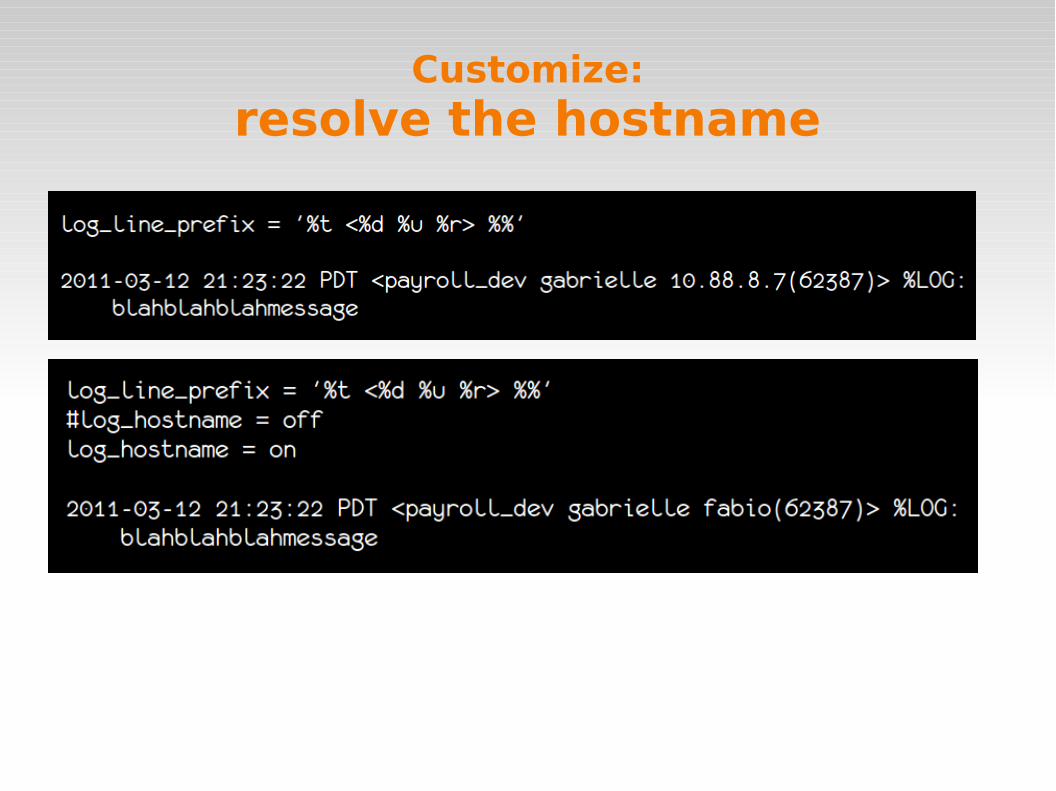
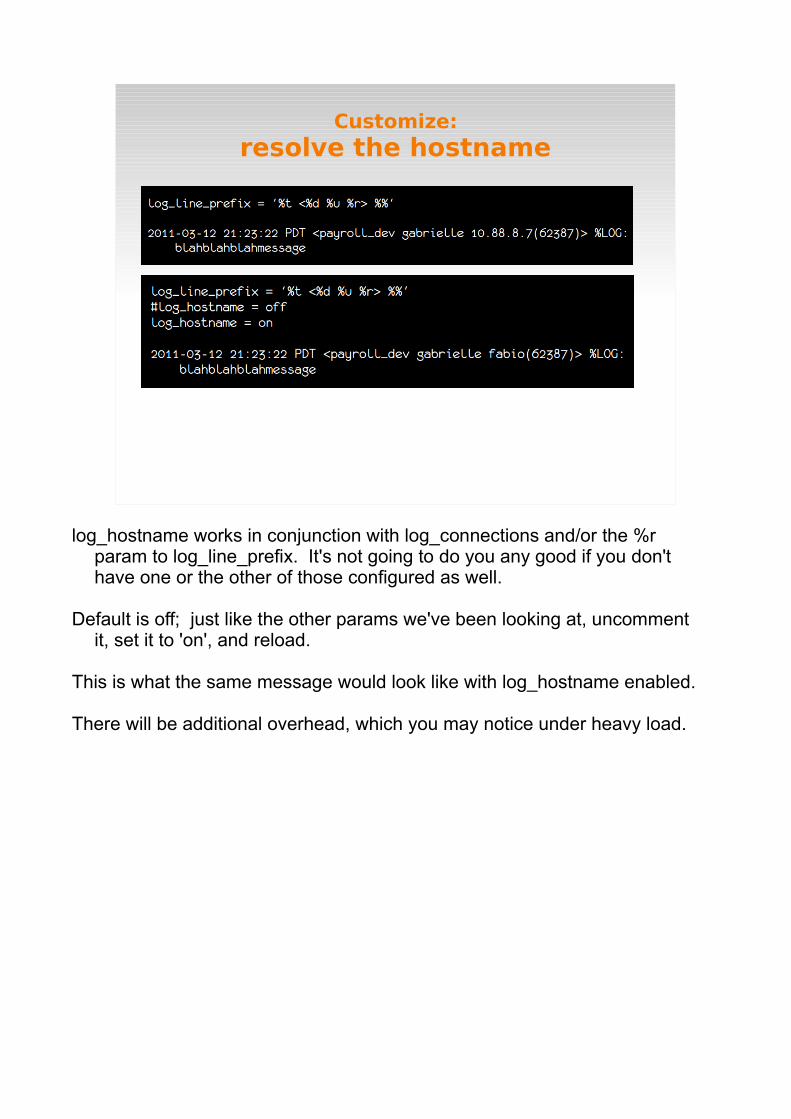
log_hostname works in conjunction with log_connections and/or the %r param to log_line_prefix. It's not going to do you any good if you don't have one or the other of those configured as well.
Default is off; just like the other params we've been looking at, uncomment it, set it to 'on', and reload.
This is what the same message would look like with log_hostname enabled.
There will be additional overhead, which you may notice under heavy load.
Customize:
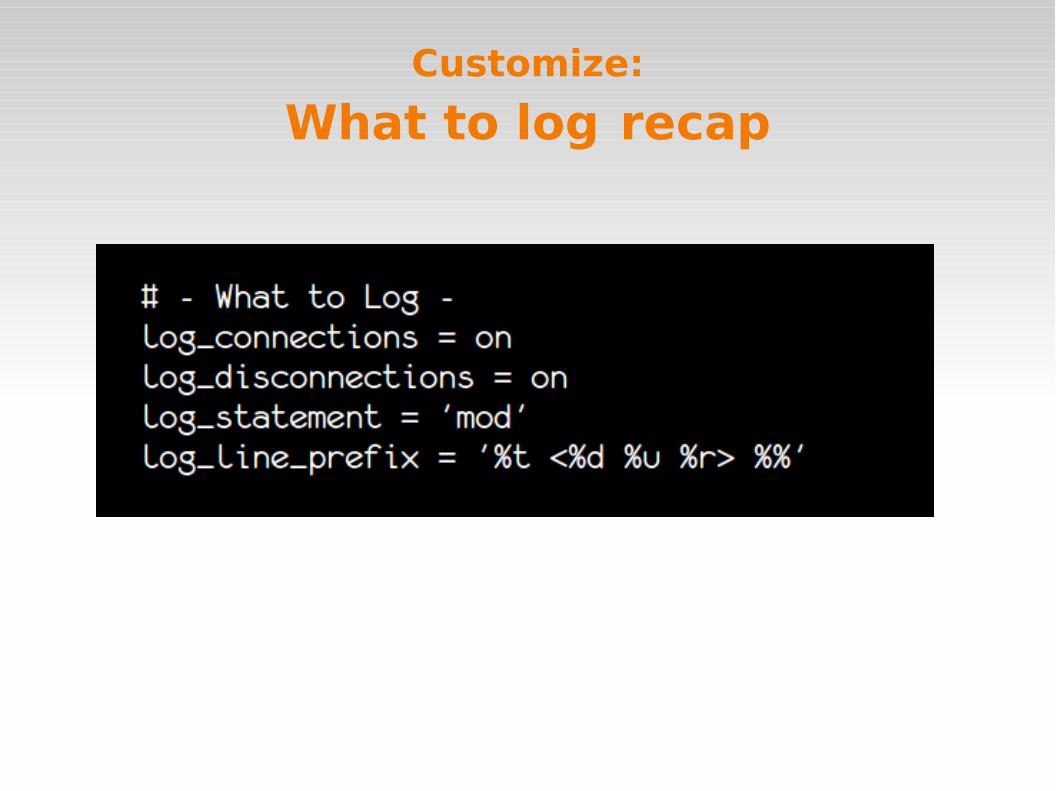
What to log recap
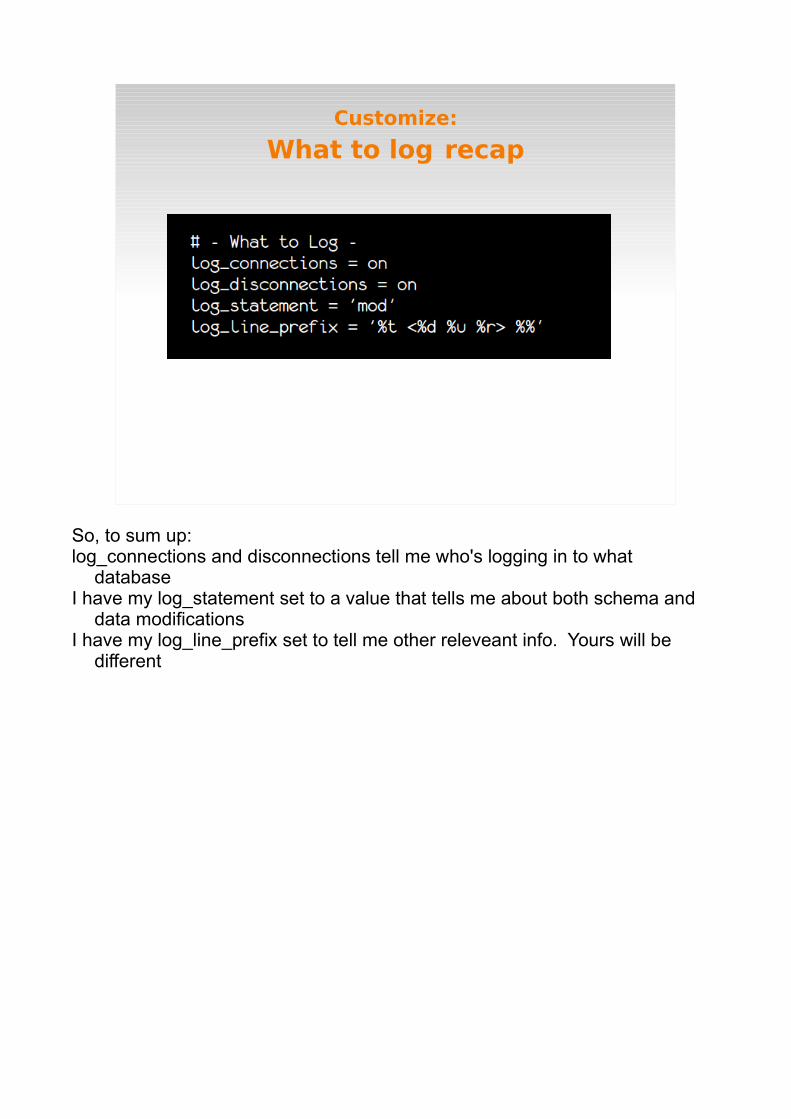
So, to sum up:log_connections and disconnections tell me who's logging in to what
databaseI have my log_statement set to a value that tells me about both schema and
data modificationsI have my log_line_prefix set to tell me other releveant info. Yours will be
different
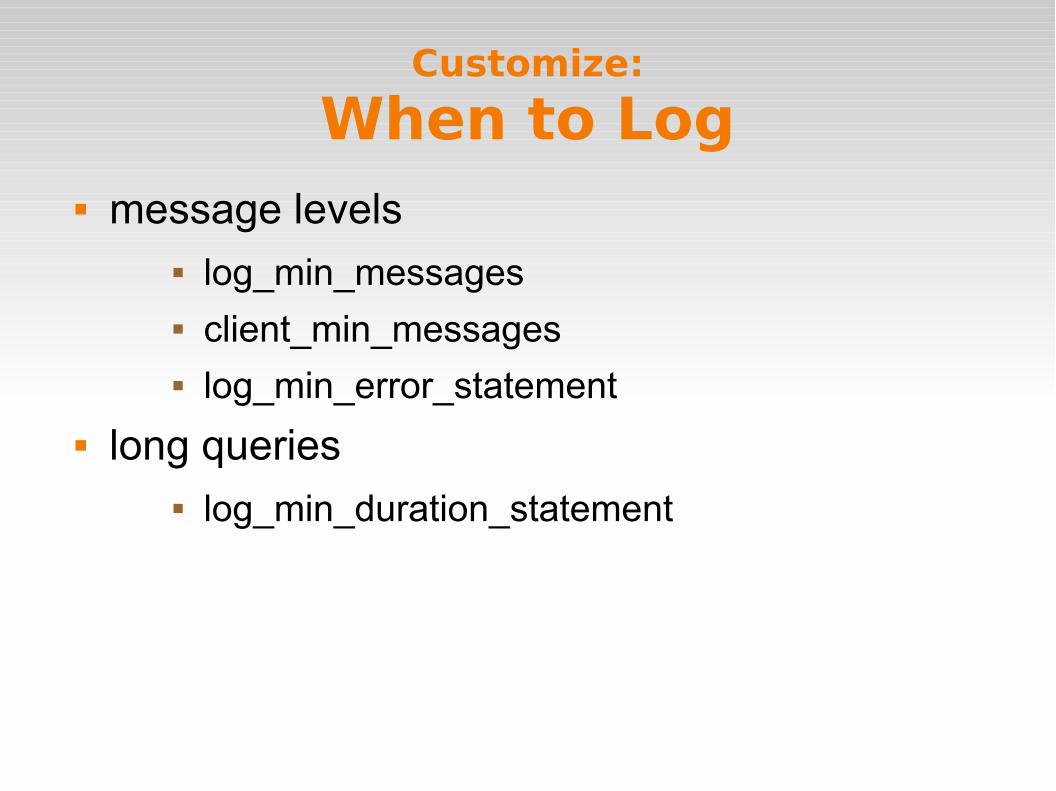
Customize:
When to Log message levels
log_min_messages client_min_messages log_min_error_statement
long queries log_min_duration_statement
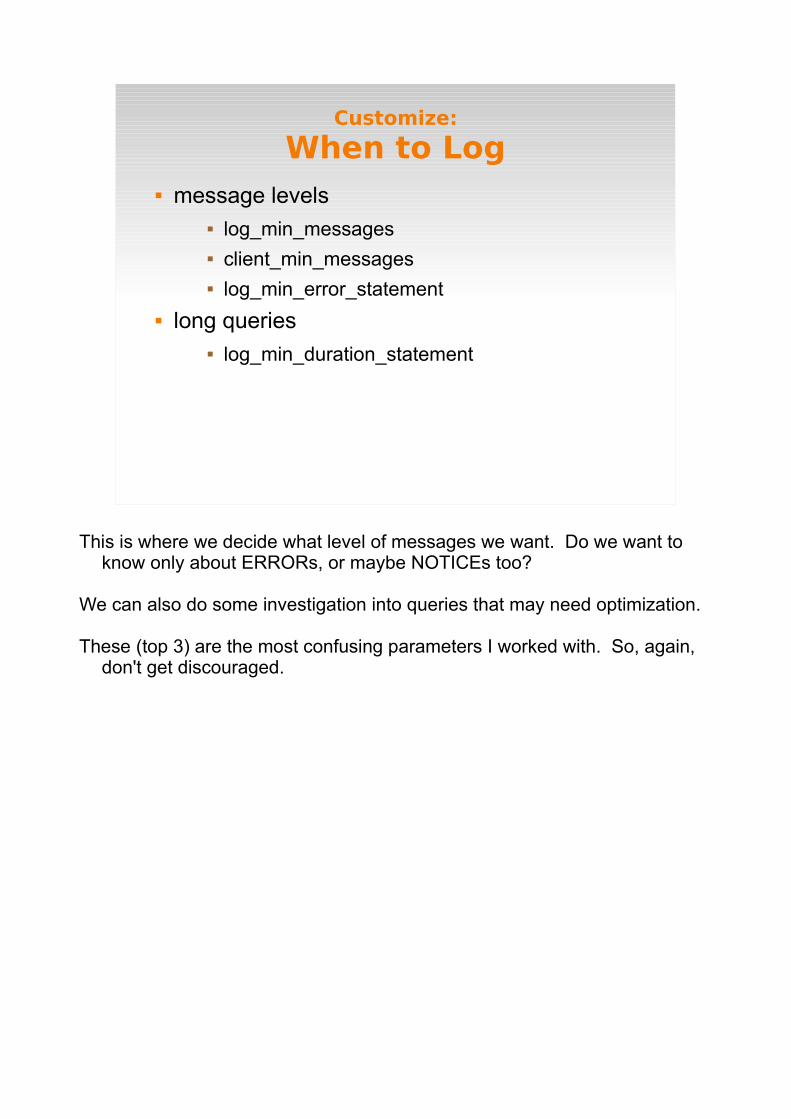
This is where we decide what level of messages we want. Do we want to know only about ERRORs, or maybe NOTICEs too?
We can also do some investigation into queries that may need optimization.
These (top 3) are the most confusing parameters I worked with. So, again, don't get discouraged.
Customize:
Message Levels
Let's talk about the levels first.
DEBUG, INFO, NOTICE, WARNING, ERROR, LOG, FATAL, PANIC.
(or something like that.)
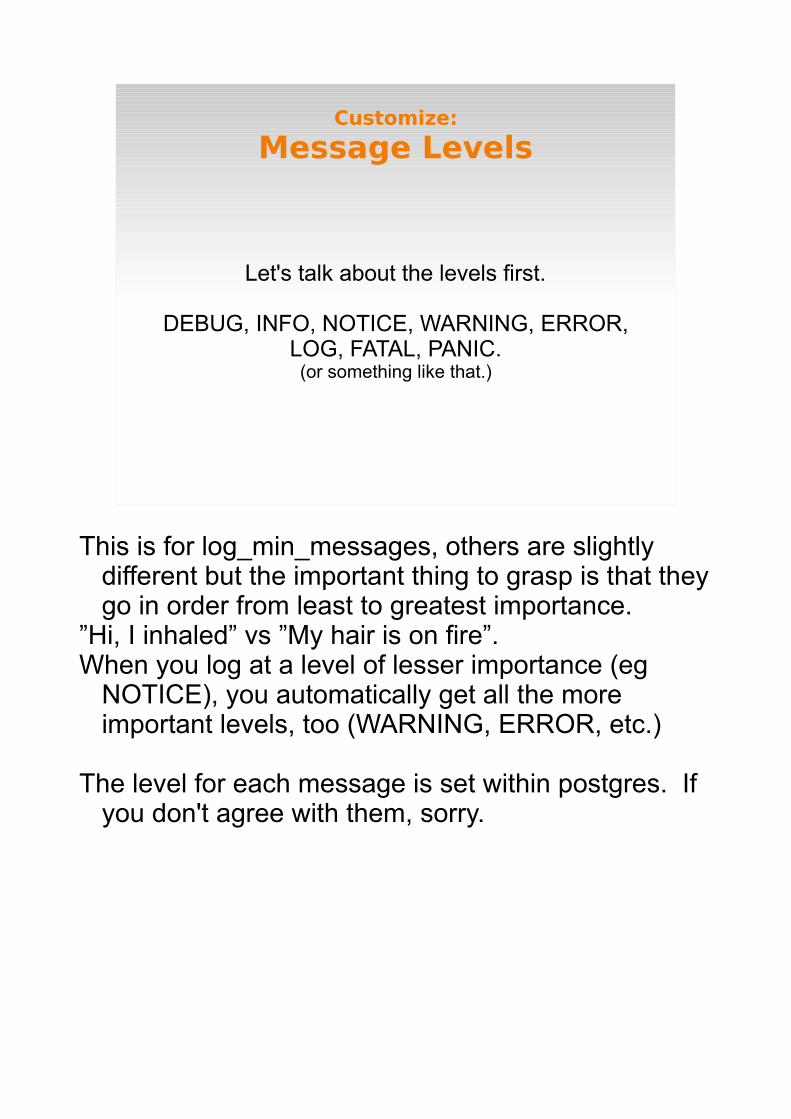
This is for log_min_messages, others are slightly different but the important thing to grasp is that they go in order from least to greatest importance.
”Hi, I inhaled” vs ”My hair is on fire”.When you log at a level of lesser importance (eg
NOTICE), you automatically get all the more important levels, too (WARNING, ERROR, etc.)
The level for each message is set within postgres. If you don't agree with them, sorry.
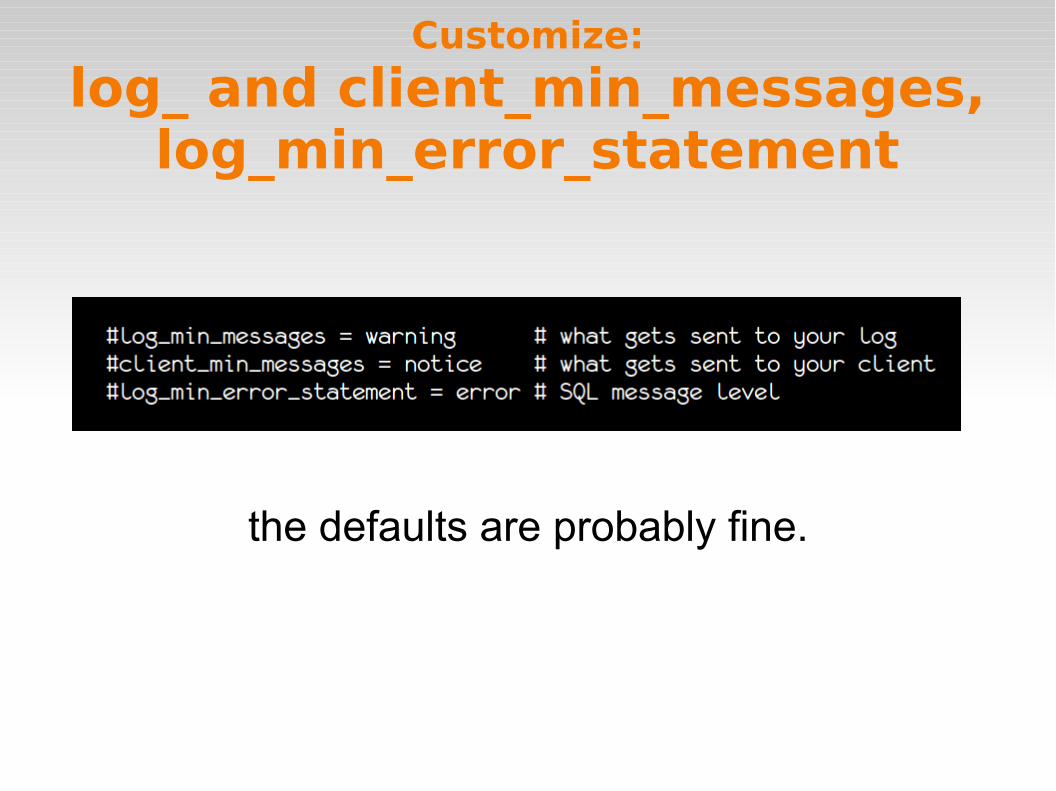
Customize:
log_ and client_min_messages, log_min_error_statement
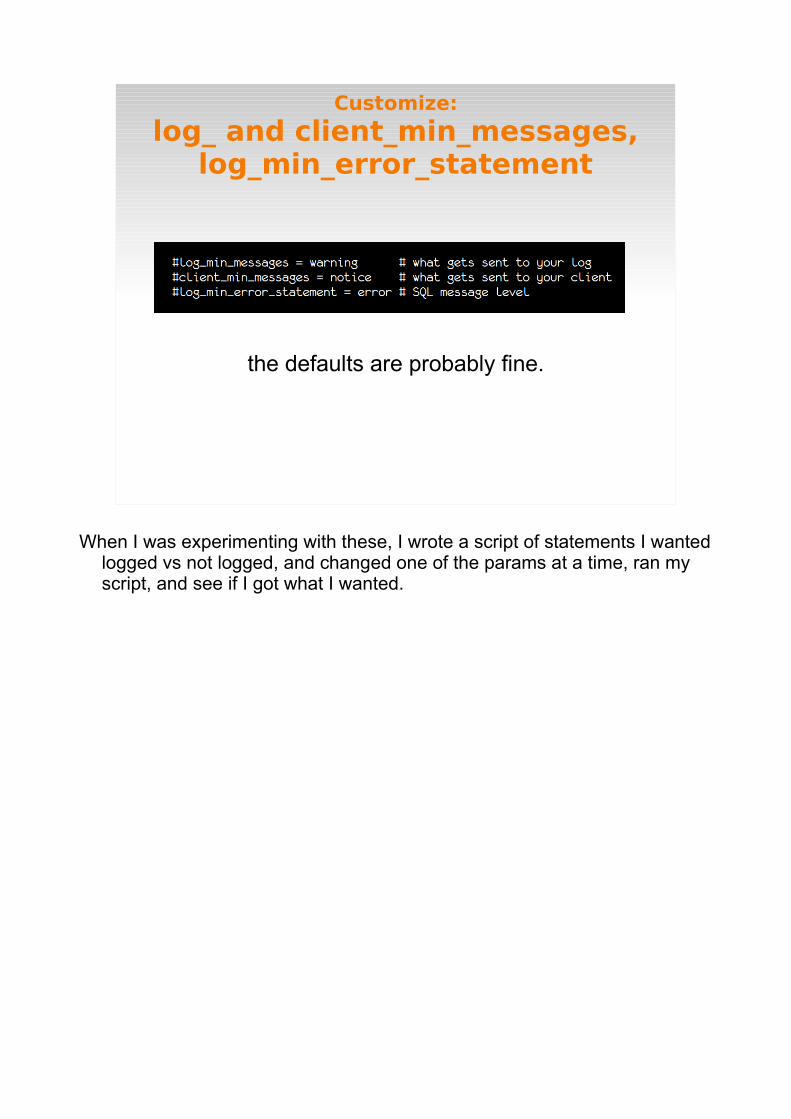
the defaults are probably fine.
When I was experimenting with these, I wrote a script of statements I wanted logged vs not logged, and changed one of the params at a time, ran my script, and see if I got what I wanted.
Customize:
Long Queries
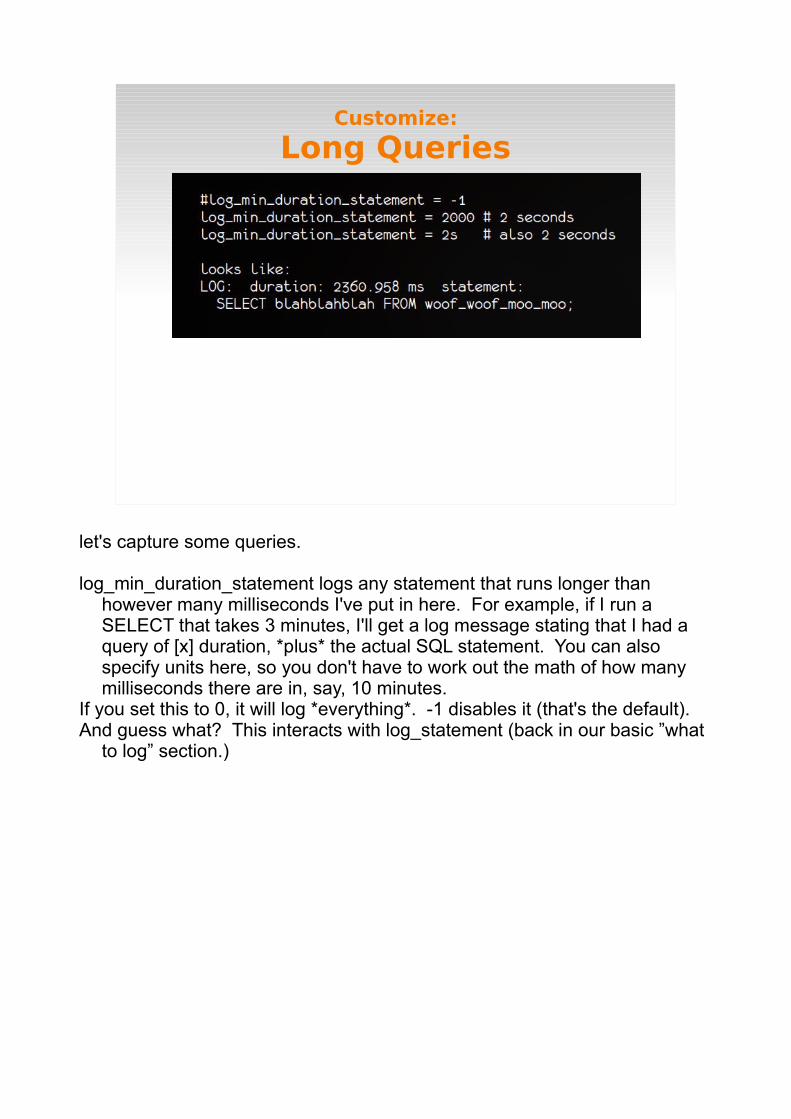
let's capture some queries.
log_min_duration_statement logs any statement that runs longer than however many milliseconds I've put in here. For example, if I run a SELECT that takes 3 minutes, I'll get a log message stating that I had a query of [x] duration, *plus* the actual SQL statement. You can also specify units here, so you don't have to work out the math of how many milliseconds there are in, say, 10 minutes.
If you set this to 0, it will log *everything*. -1 disables it (that's the default).And guess what? This interacts with log_statement (back in our basic ”what
to log” section.)
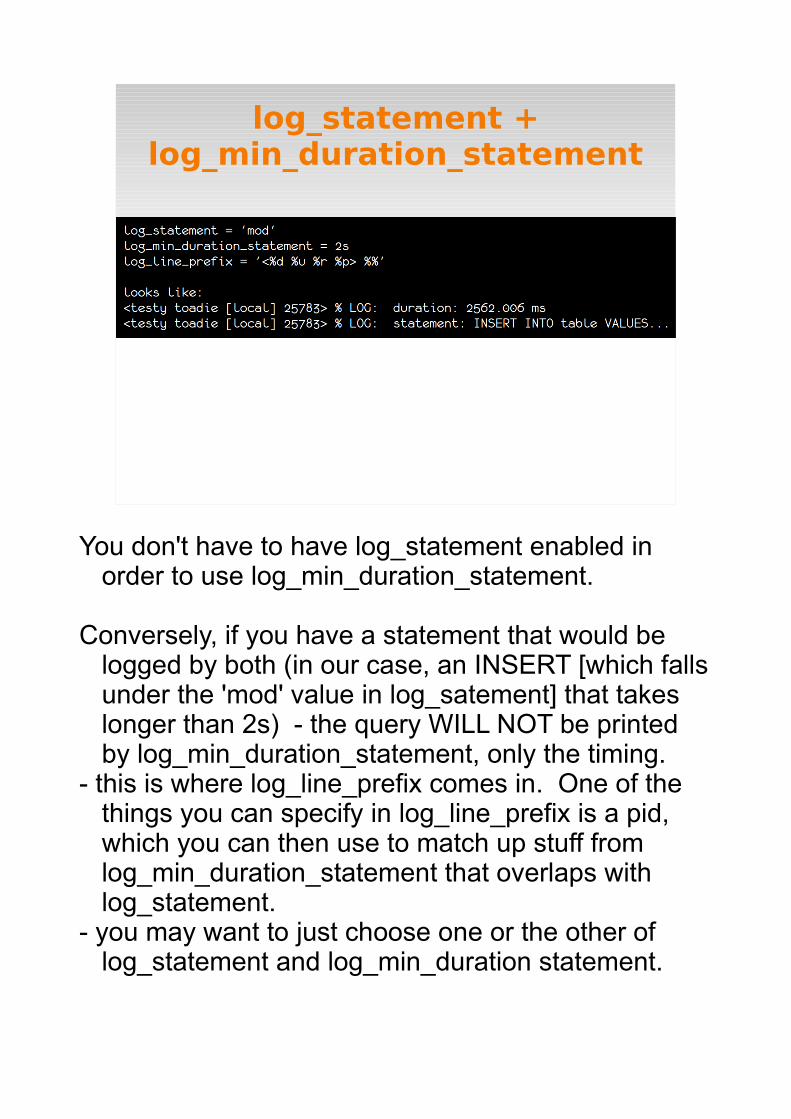
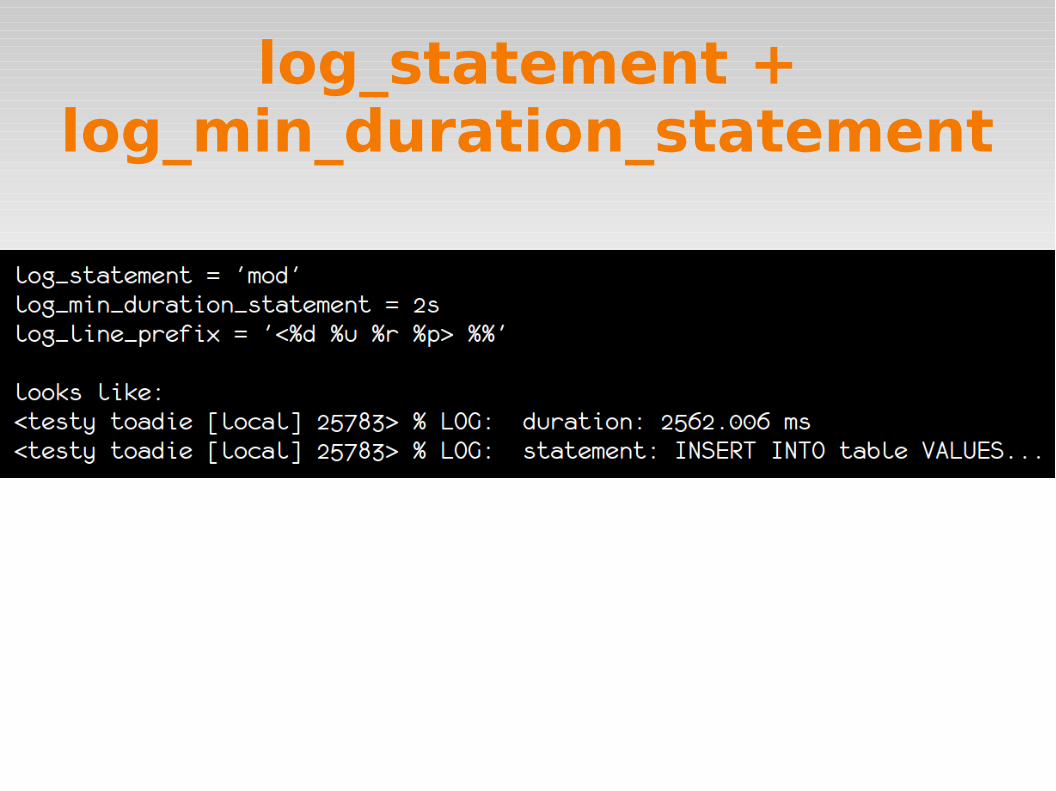
log_statement + log_min_duration_statement
You don't have to have log_statement enabled in order to use log_min_duration_statement.
Conversely, if you have a statement that would be logged by both (in our case, an INSERT [which falls under the 'mod' value in log_satement] that takes longer than 2s) - the query WILL NOT be printed by log_min_duration_statement, only the timing.
- this is where log_line_prefix comes in. One of the things you can specify in log_line_prefix is a pid, which you can then use to match up stuff from log_min_duration_statement that overlaps with log_statement.
- you may want to just choose one or the other of log_statement and log_min_duration statement.

Customize:
Where to log You have four choices:
eventlog csvlog syslog stderr
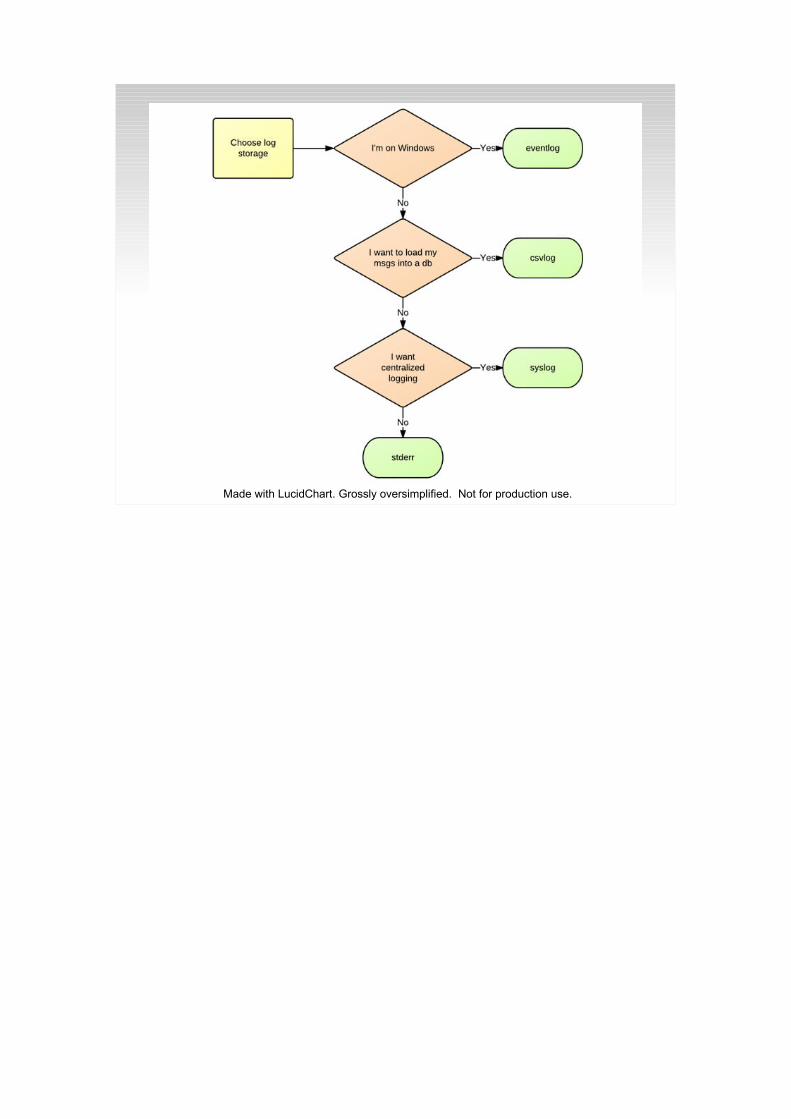
Made with LucidChart. Grossly oversimplified. Not for production use.
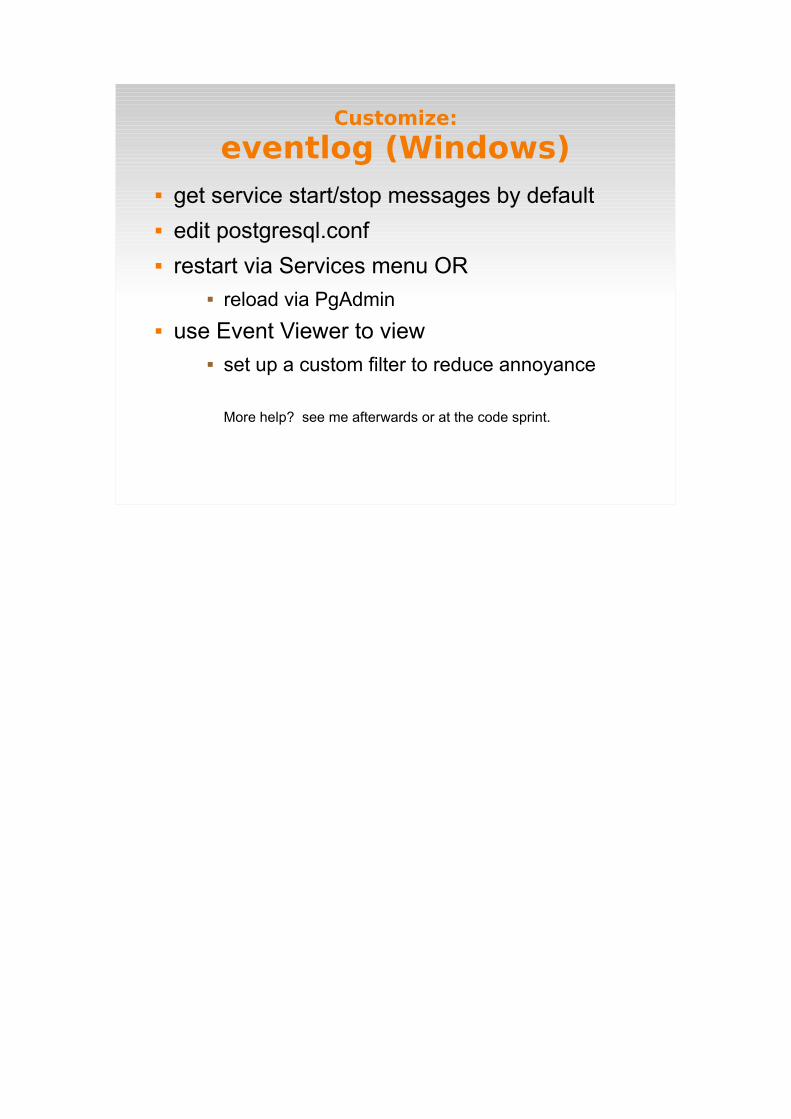
Customize:
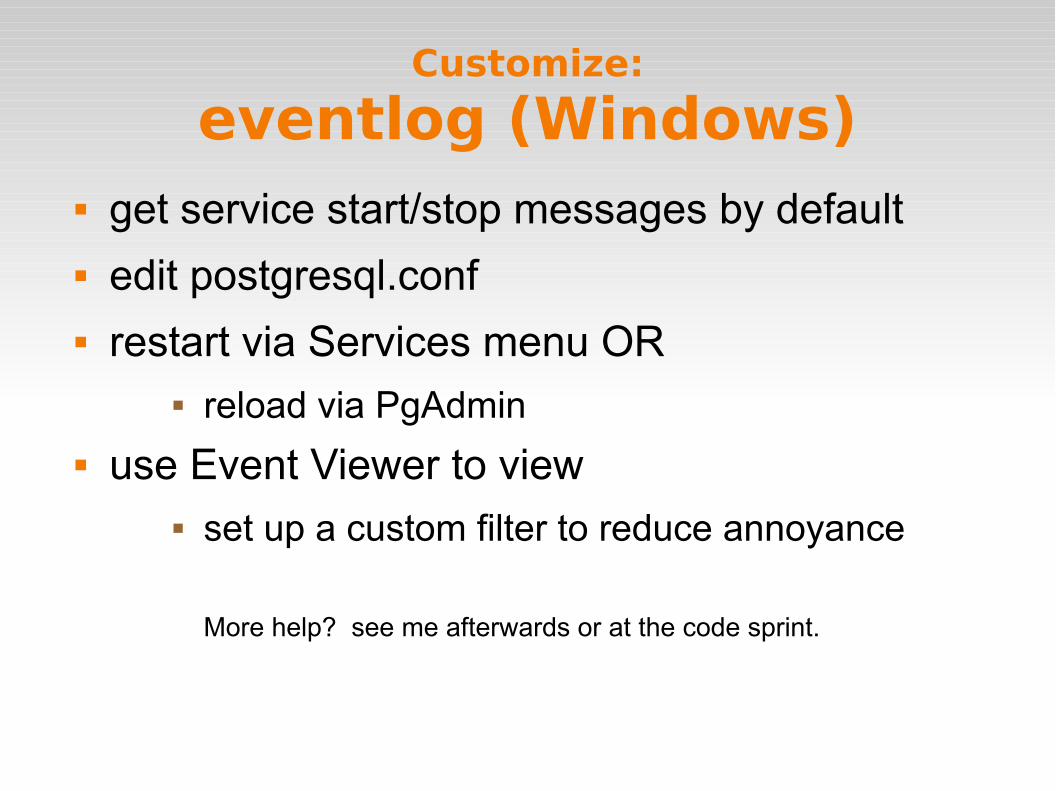
eventlog (Windows) get service start/stop messages by default edit postgresql.conf restart via Services menu OR
reload via PgAdmin
use Event Viewer to view set up a custom filter to reduce annoyance
More help? see me afterwards or at the code sprint.
Customize:
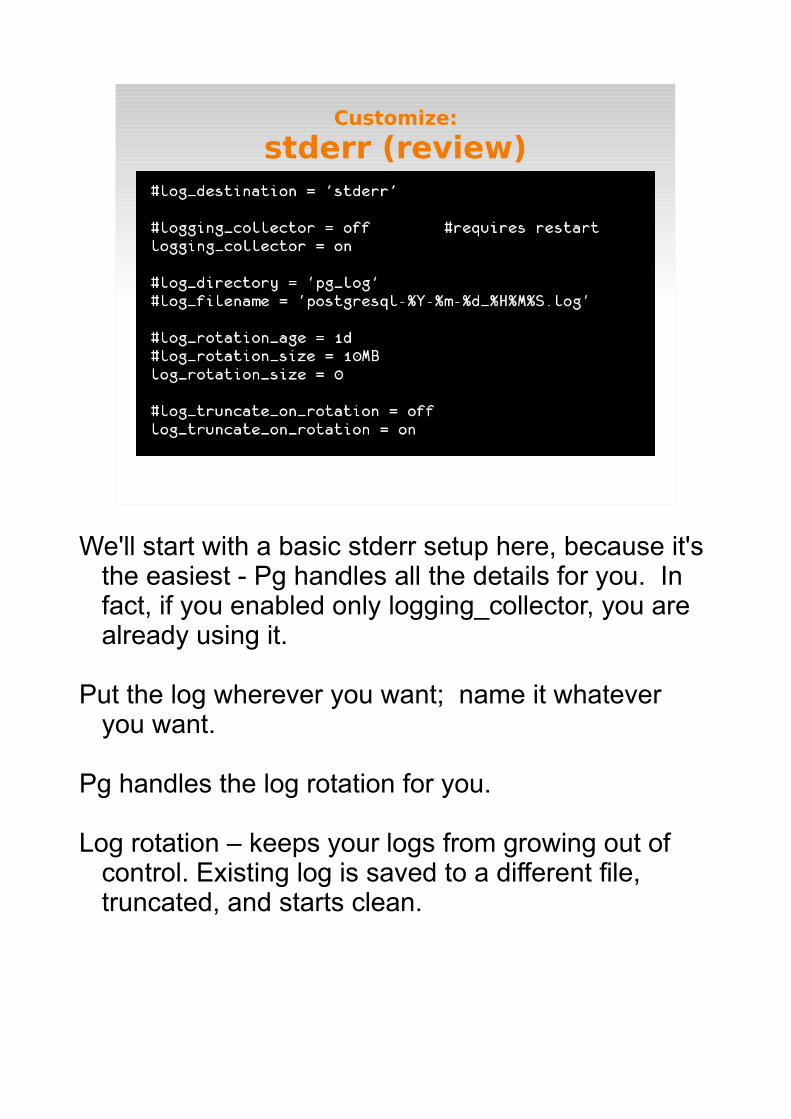
stderr (review)
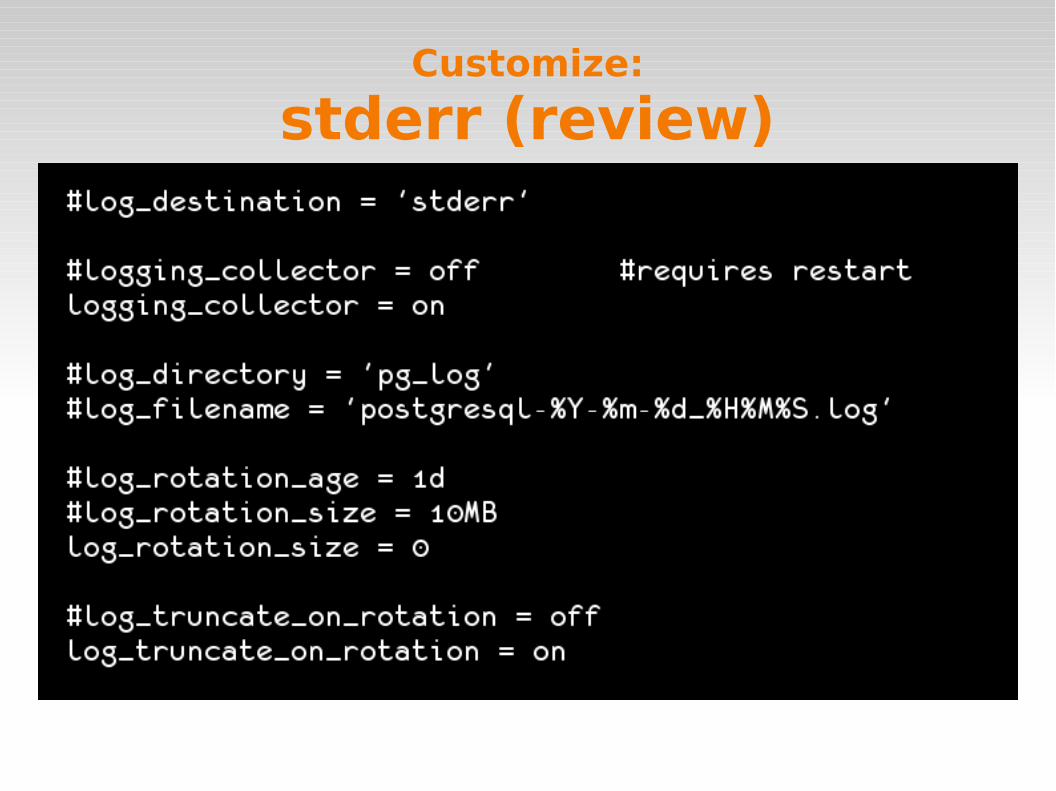
We'll start with a basic stderr setup here, because it's the easiest - Pg handles all the details for you. In fact, if you enabled only logging_collector, you are already using it.
Put the log wherever you want; name it whatever you want.
Pg handles the log rotation for you.
Log rotation – keeps your logs from growing out of control. Existing log is saved to a different file, truncated, and starts clean.
Customize:
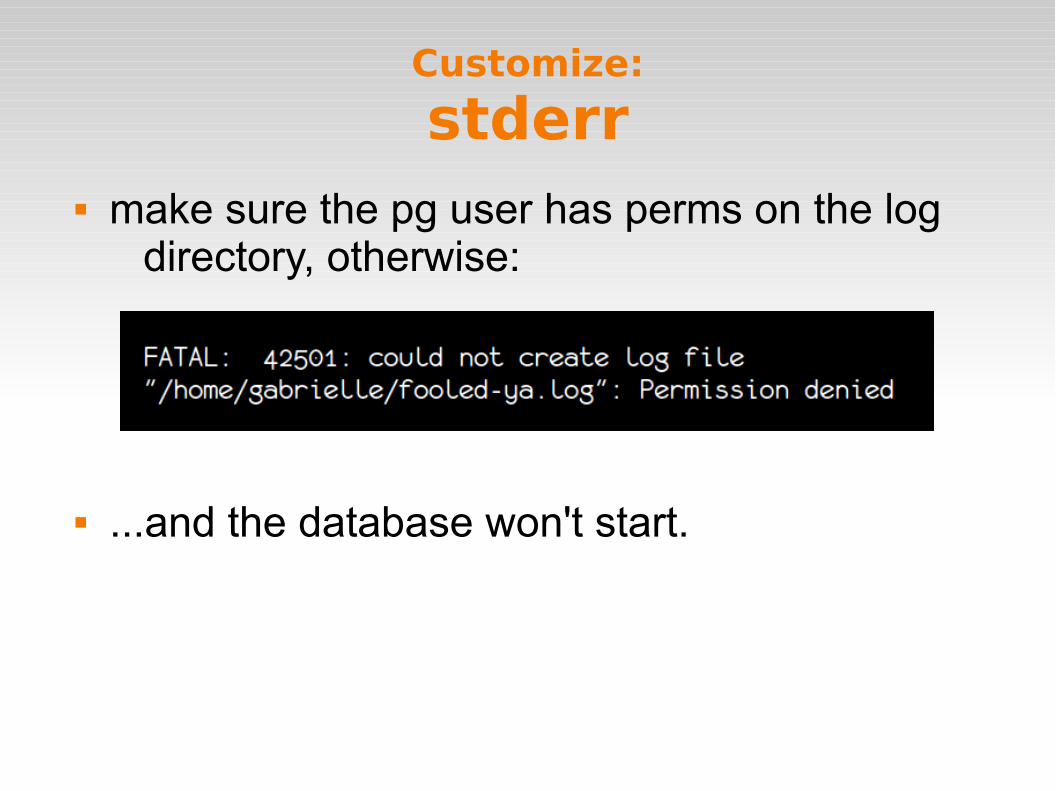
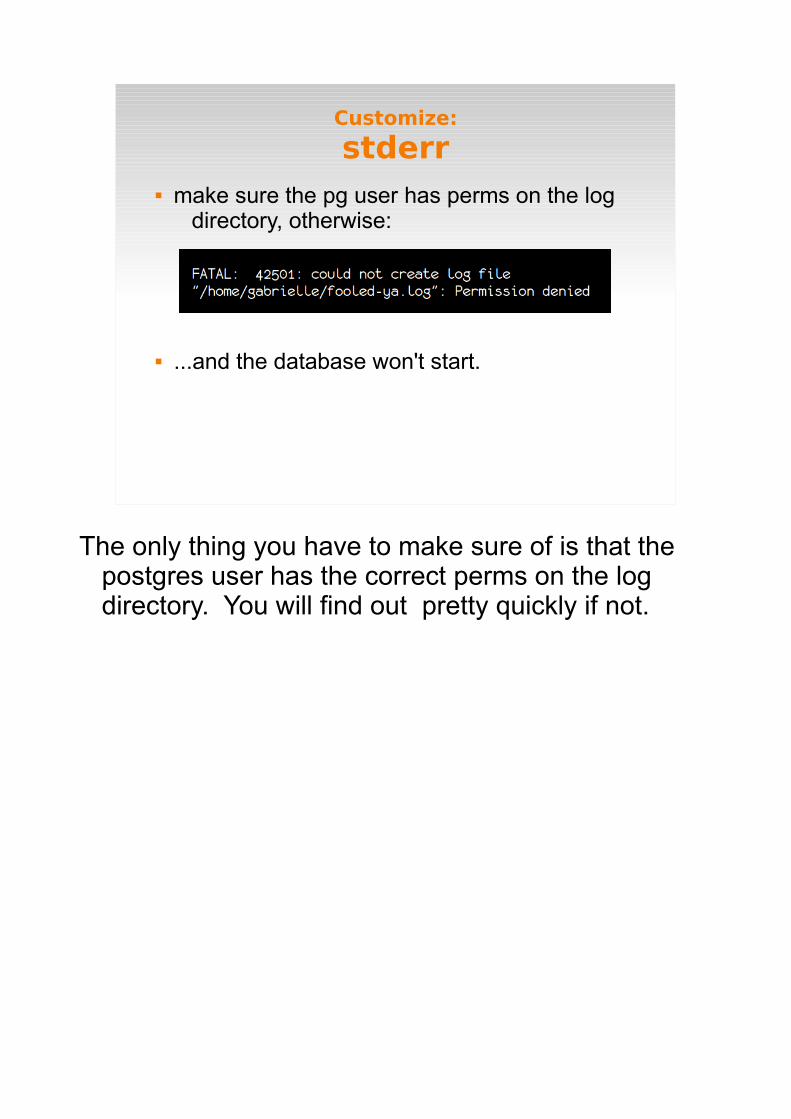
stderr make sure the pg user has perms on the log
directory, otherwise:
...and the database won't start.
The only thing you have to make sure of is that the postgres user has the correct perms on the log directory. You will find out pretty quickly if not.
Customize:
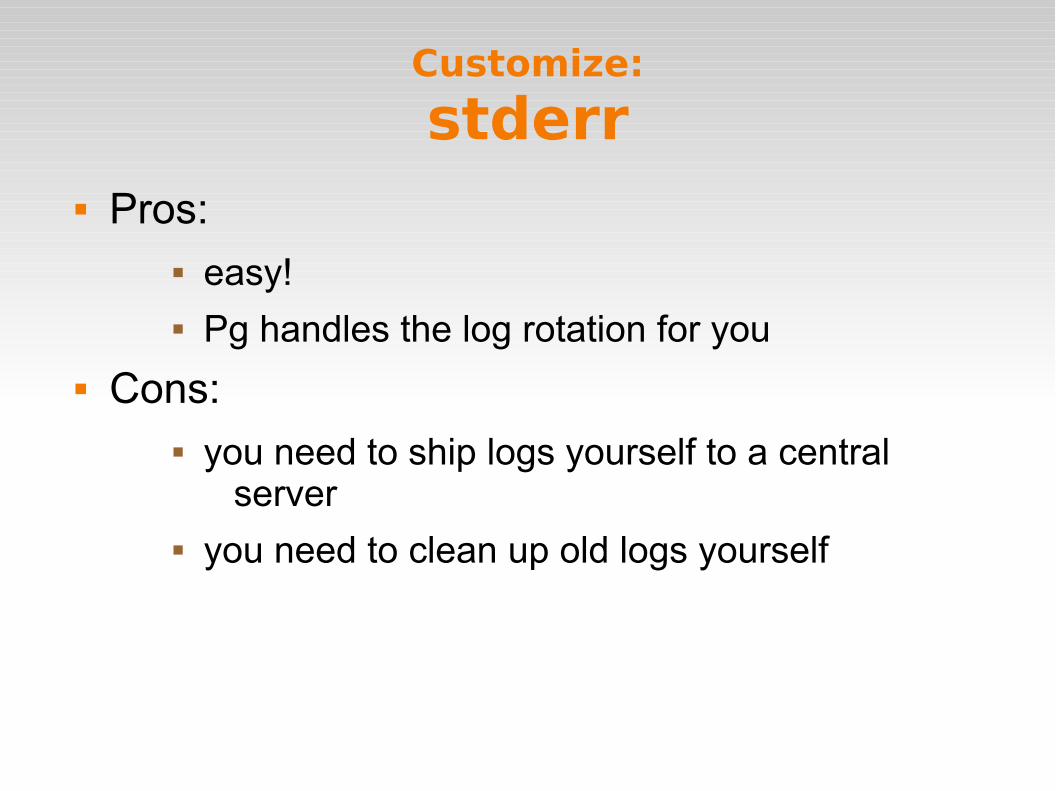
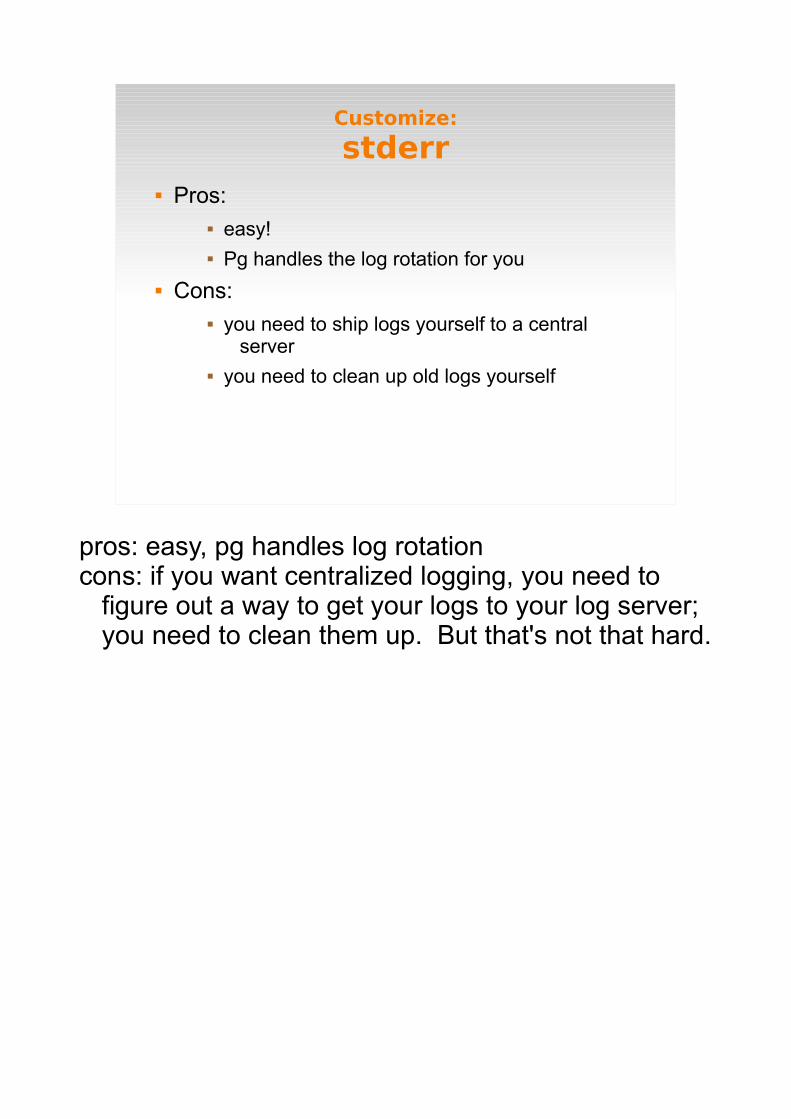
stderr Pros:
easy! Pg handles the log rotation for you
Cons: you need to ship logs yourself to a central
server you need to clean up old logs yourself
pros: easy, pg handles log rotationcons: if you want centralized logging, you need to
figure out a way to get your logs to your log server; you need to clean them up. But that's not that hard.
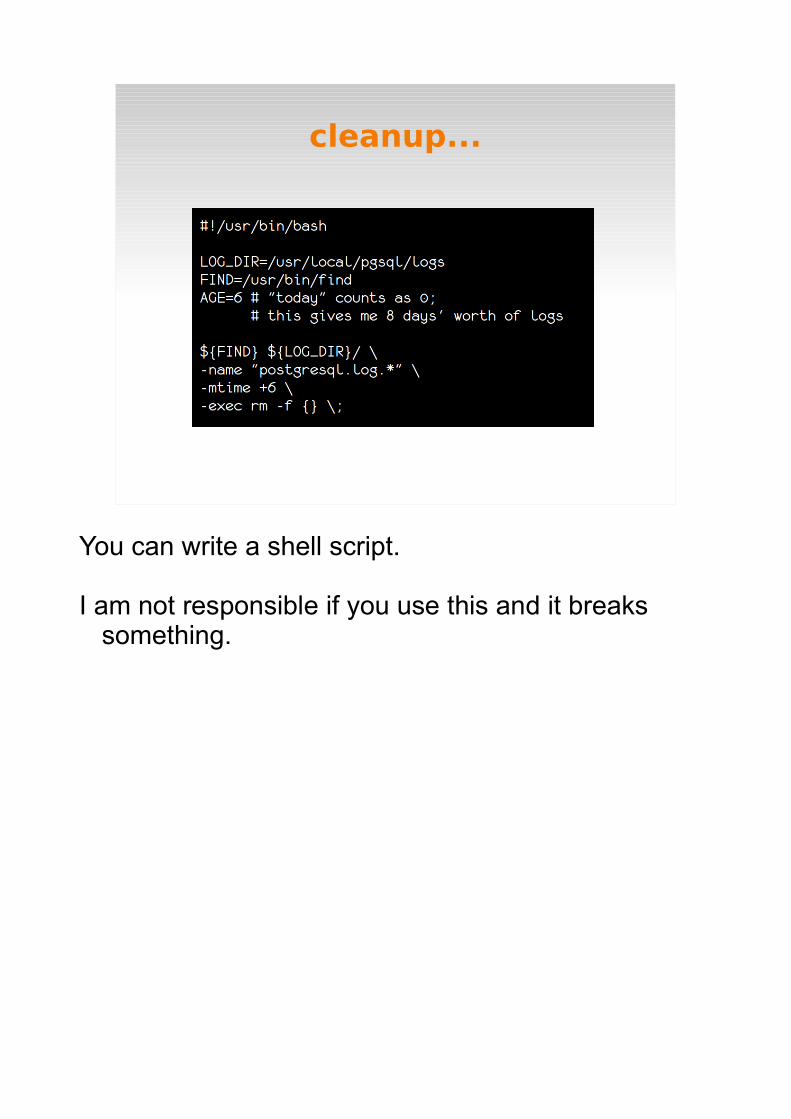
cleanup...
You can write a shell script.
I am not responsible if you use this and it breaks something.
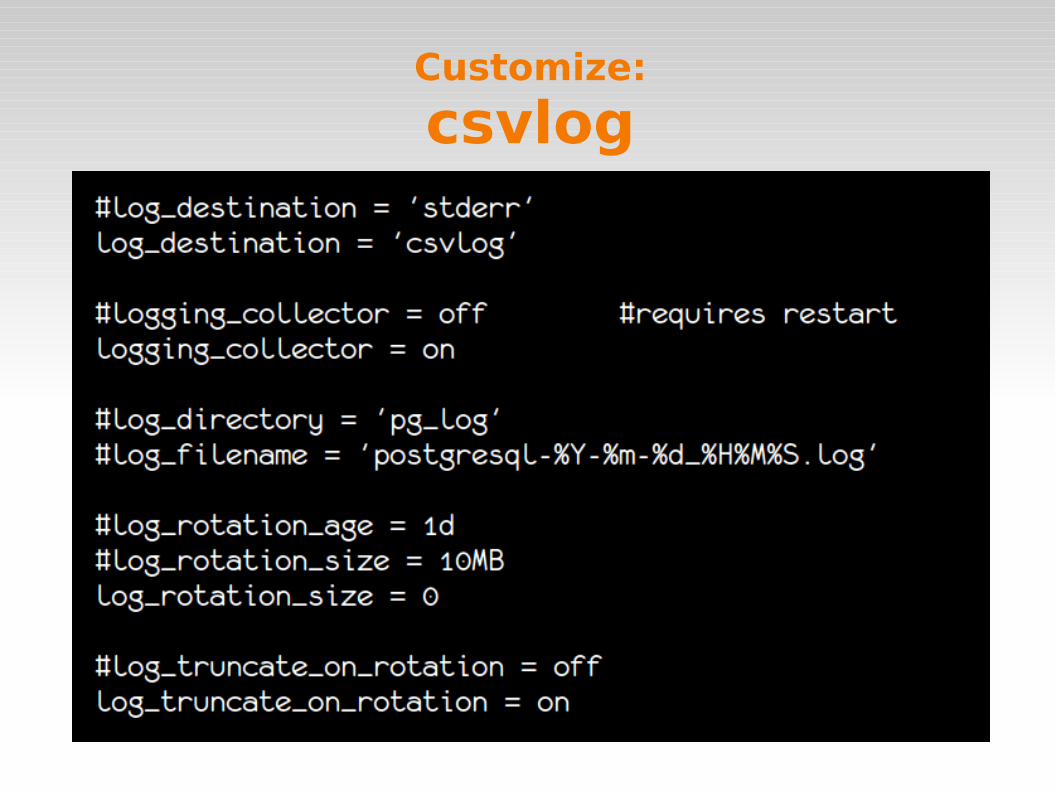
Customize:
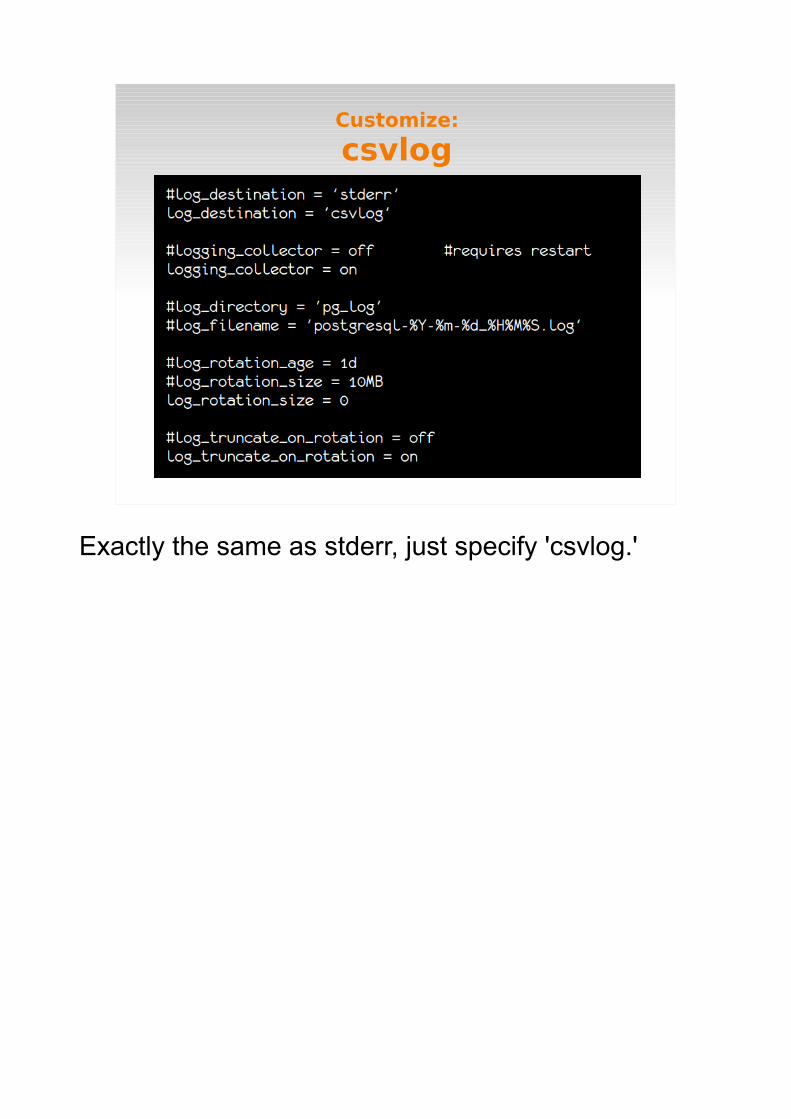
csvlog
Exactly the same as stderr, just specify 'csvlog.'
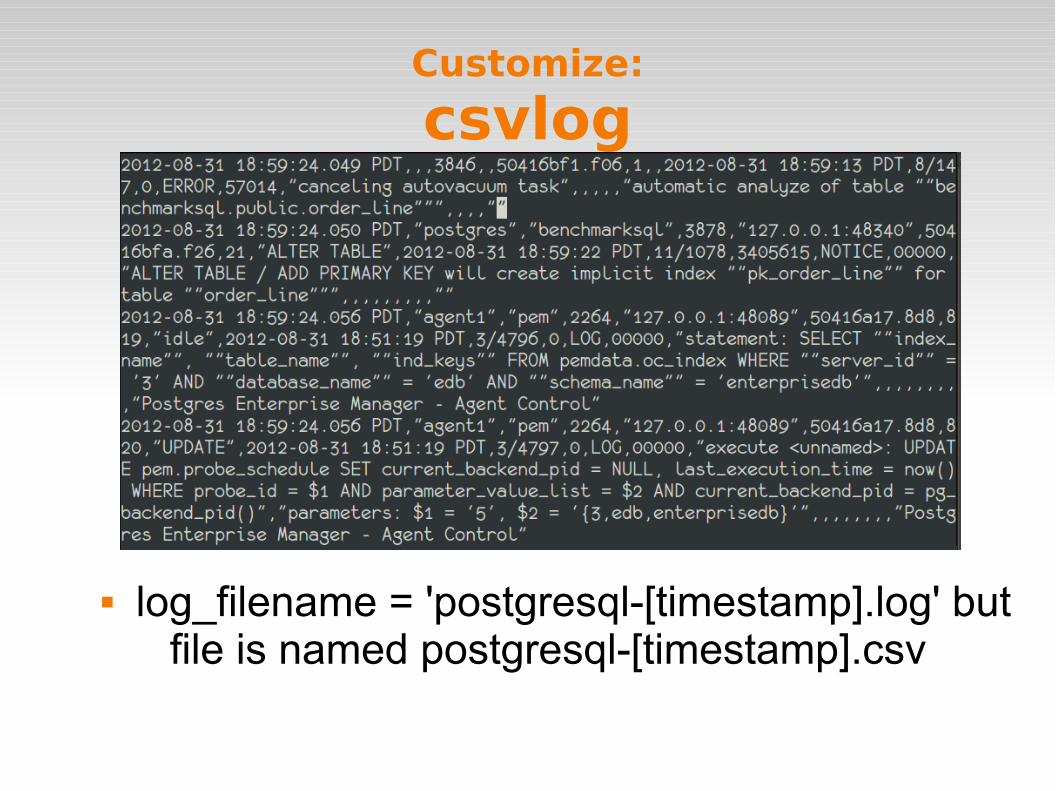
Customize:
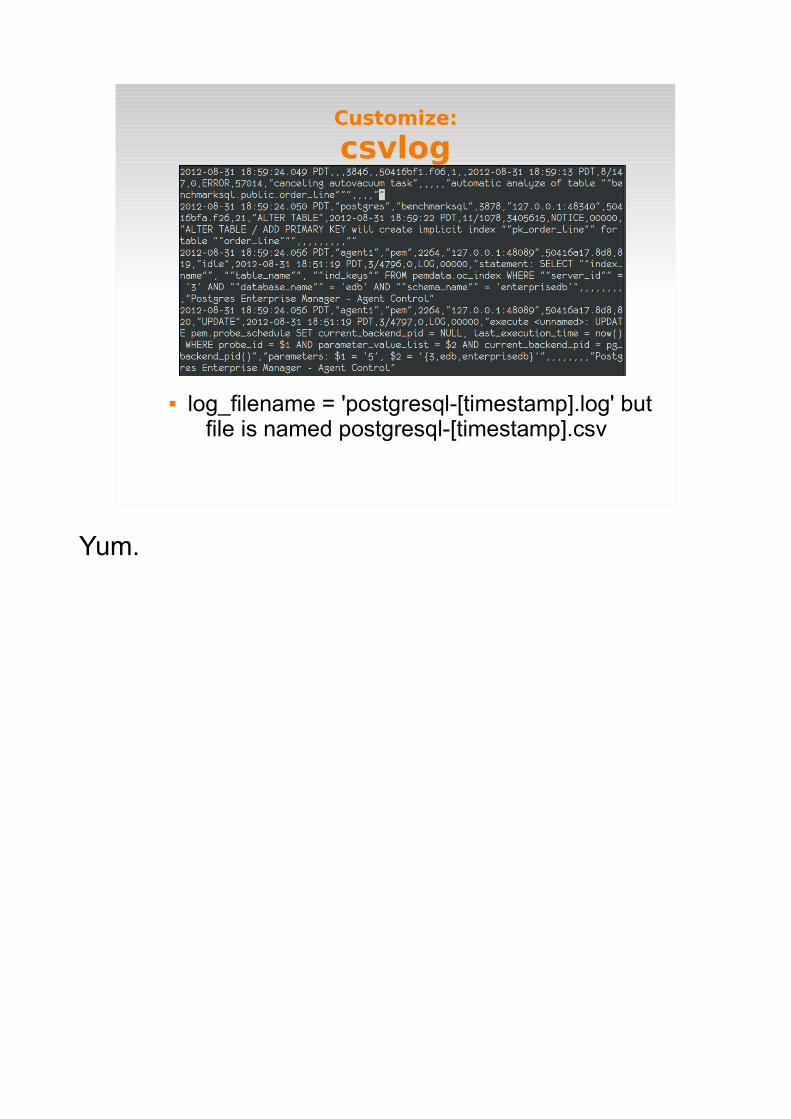
csvlog
log_filename = 'postgresql-[timestamp].log' but file is named postgresql-[timestamp].csv
Yum.
Customize:
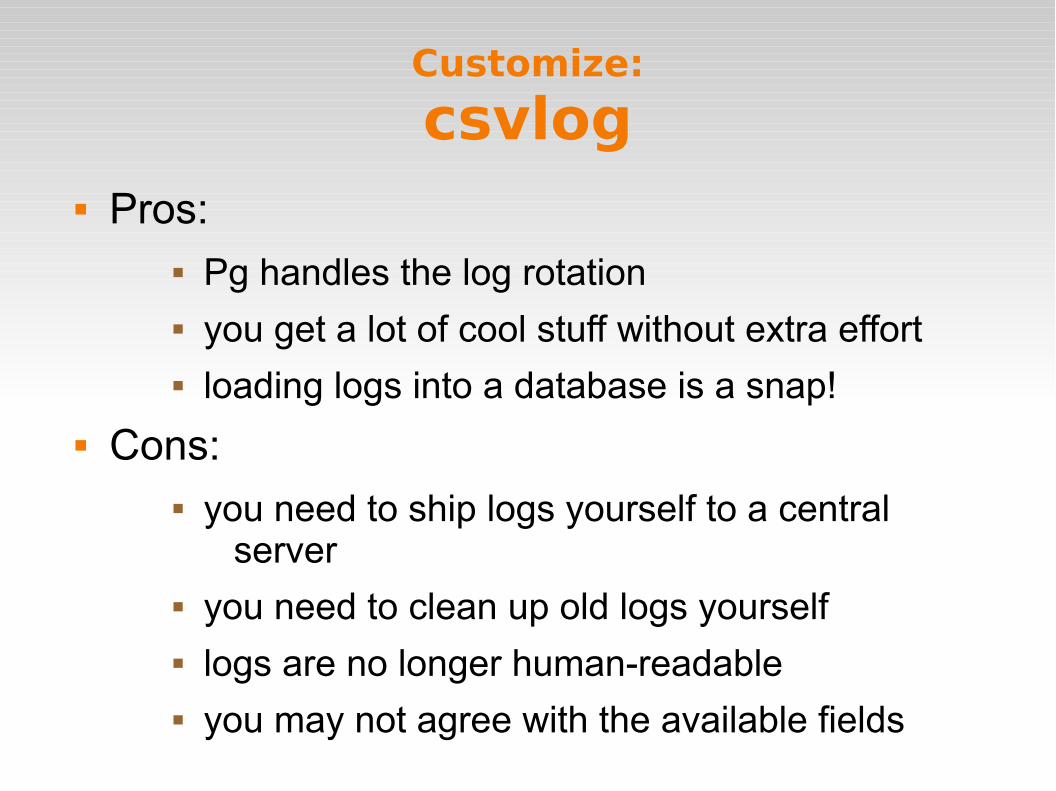
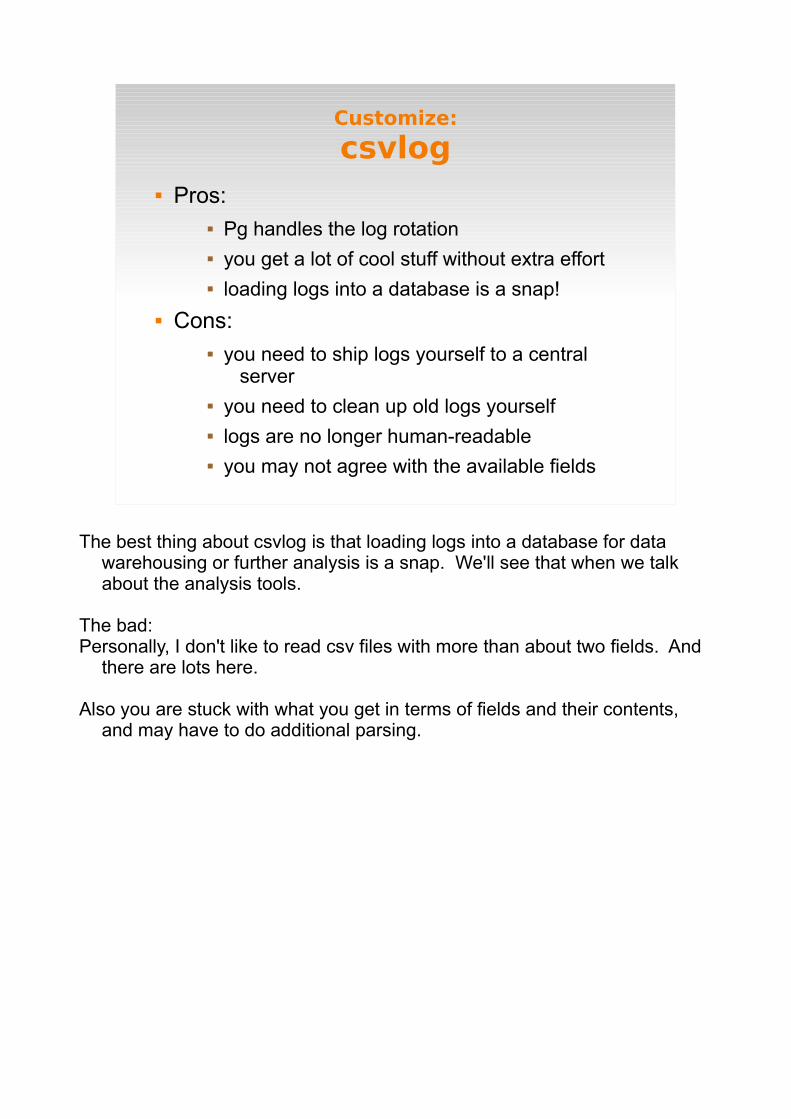
csvlog Pros:
Pg handles the log rotation you get a lot of cool stuff without extra effort loading logs into a database is a snap!
Cons: you need to ship logs yourself to a central
server you need to clean up old logs yourself logs are no longer human-readable you may not agree with the available fields
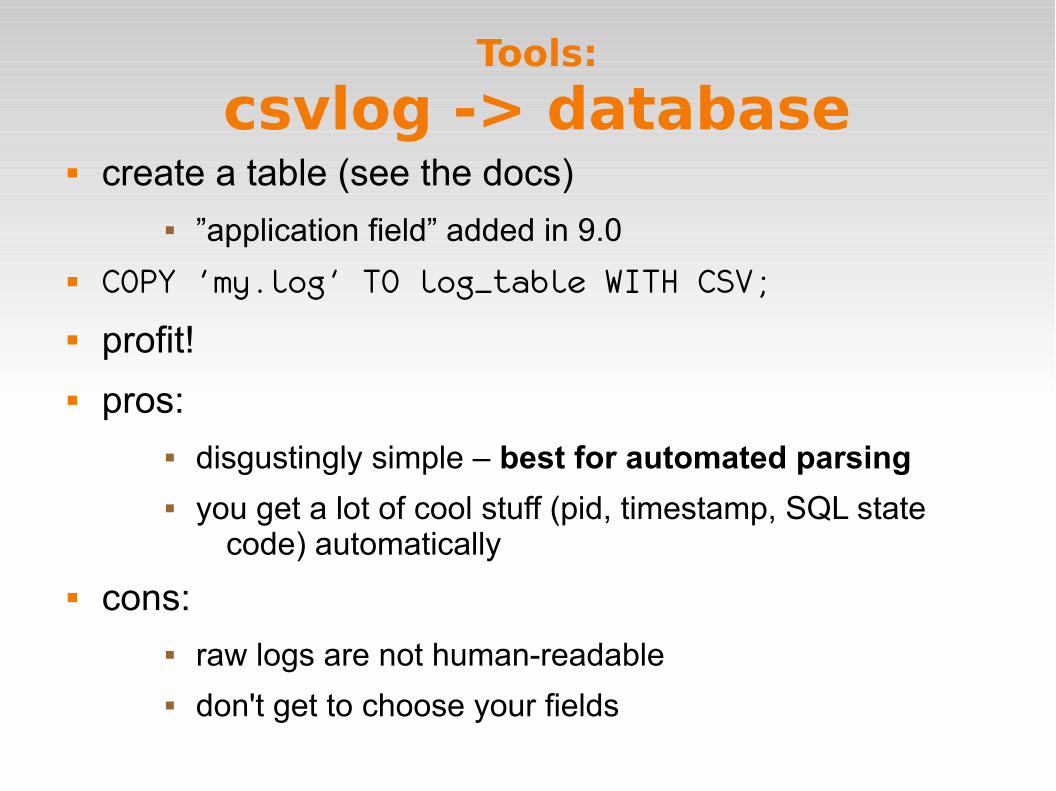
The best thing about csvlog is that loading logs into a database for data warehousing or further analysis is a snap. We'll see that when we talk about the analysis tools.
The bad:Personally, I don't like to read csv files with more than about two fields. And
there are lots here.
Also you are stuck with what you get in terms of fields and their contents, and may have to do additional parsing.
Customize:
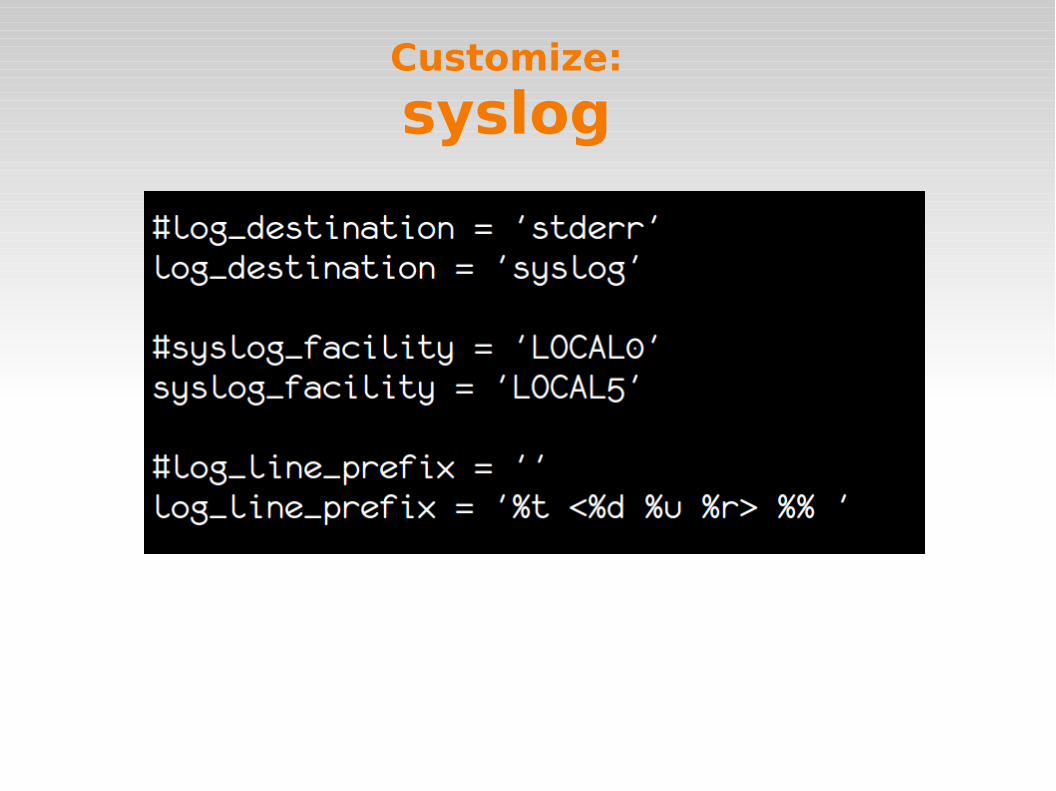
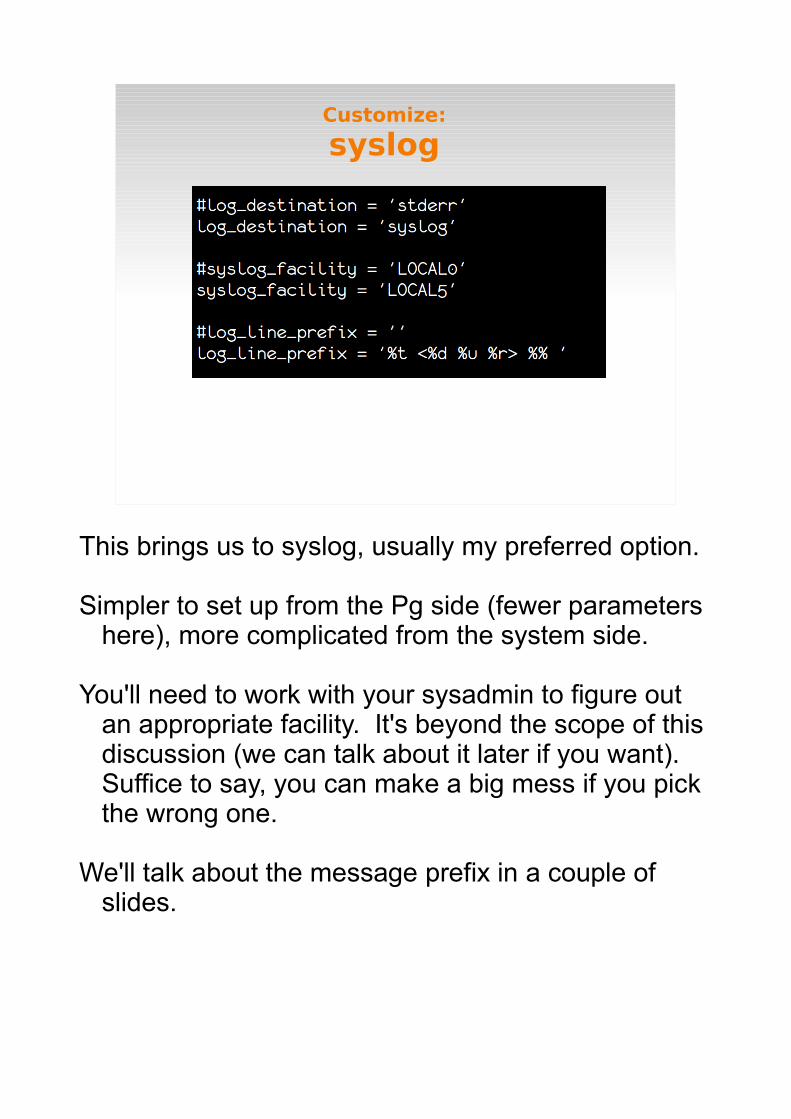
syslog
This brings us to syslog, usually my preferred option.
Simpler to set up from the Pg side (fewer parameters here), more complicated from the system side.
You'll need to work with your sysadmin to figure out an appropriate facility. It's beyond the scope of this discussion (we can talk about it later if you want). Suffice to say, you can make a big mess if you pick the wrong one.
We'll talk about the message prefix in a couple of slides.
Customize:
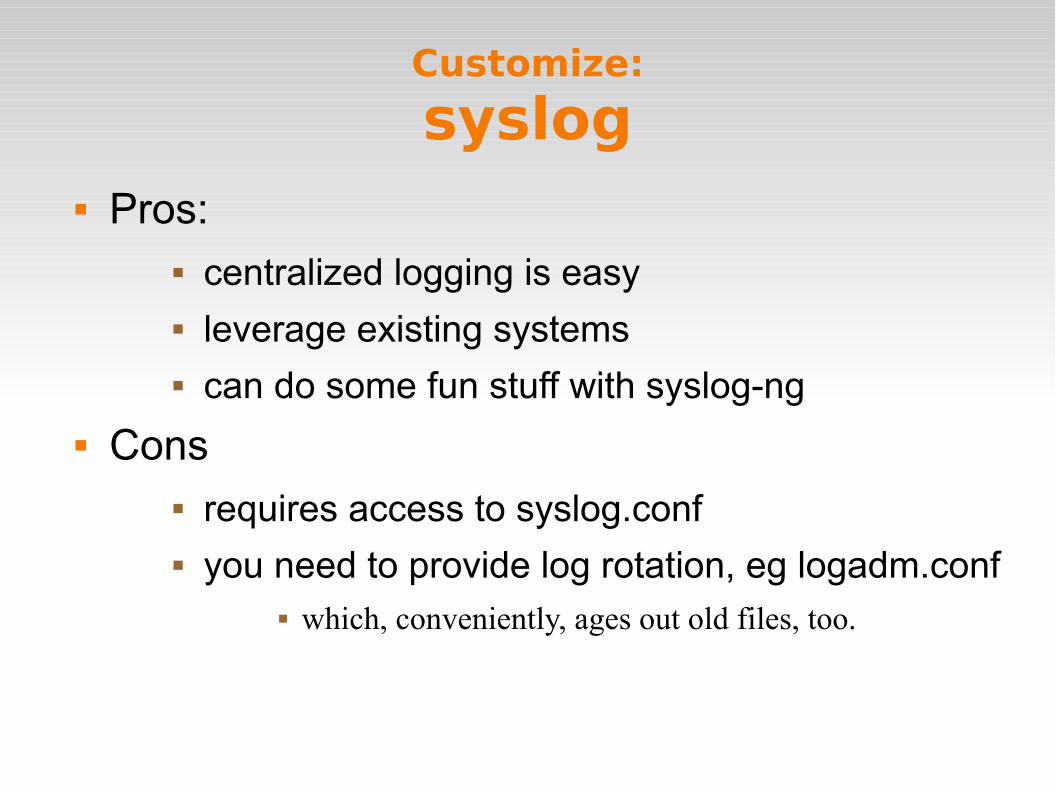
syslog Pros:
centralized logging is easy leverage existing systems can do some fun stuff with syslog-ng
Cons requires access to syslog.conf you need to provide log rotation, eg logadm.conf
which, conveniently, ages out old files, too.
Customize:
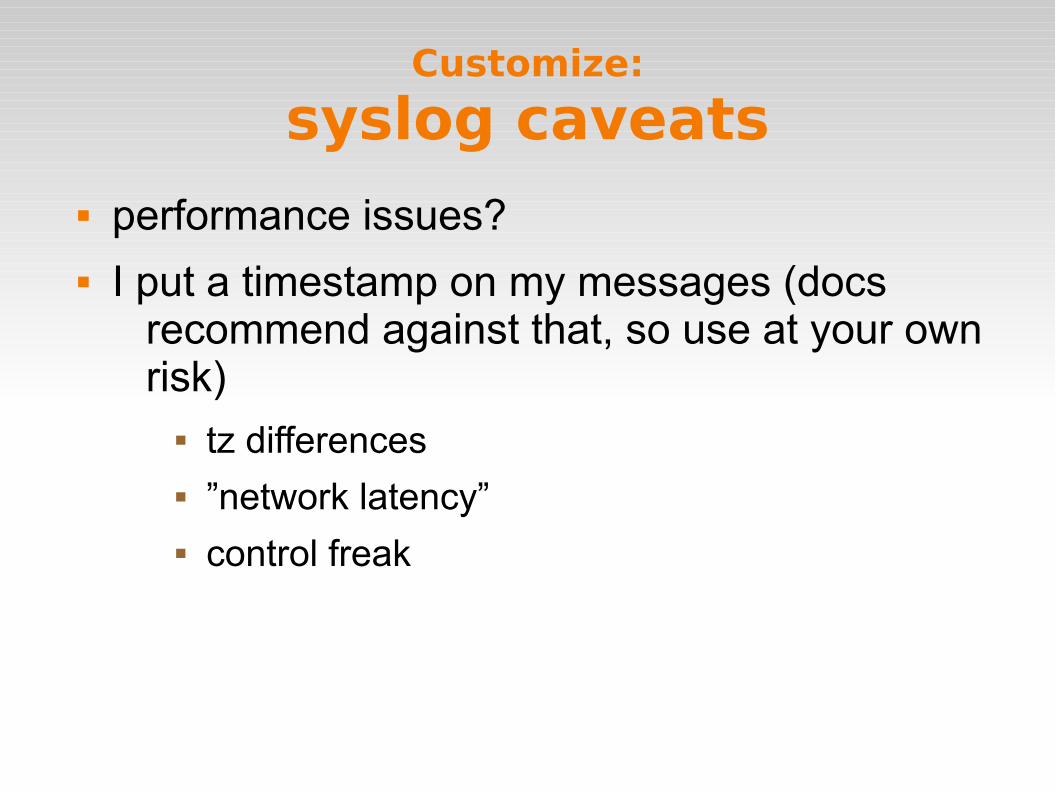
syslog caveats performance issues? I put a timestamp on my messages (docs
recommend against that, so use at your own risk)
tz differences ”network latency” control freak
There will be additional overhead. [Note: Greg Smith's talk covers a way to partially alleviate this.]
In the previous slide I showed my log_line_prefix, which includes a timestamp. The docs specifically recommend against this to reduce overhead, but I include it anyway, even though the syslog daemon does provide its own timestamp. Mainly to have an extra data point if I'm doing timezone math. Which I hate.
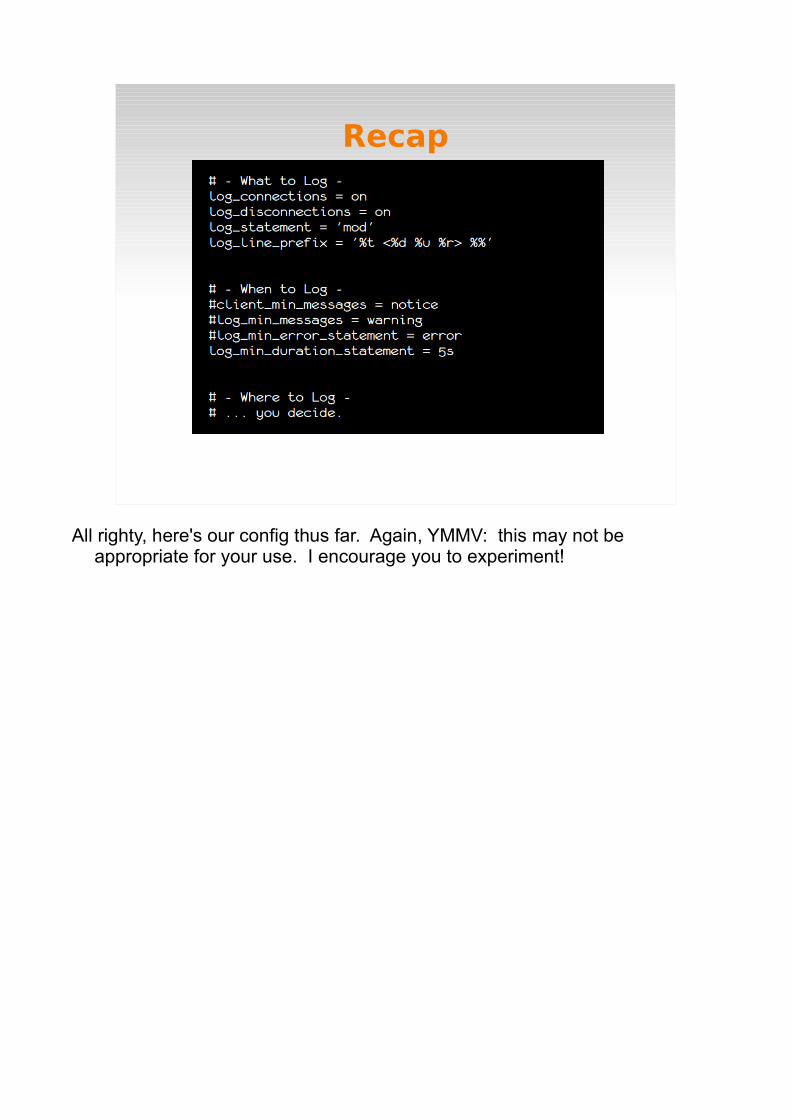
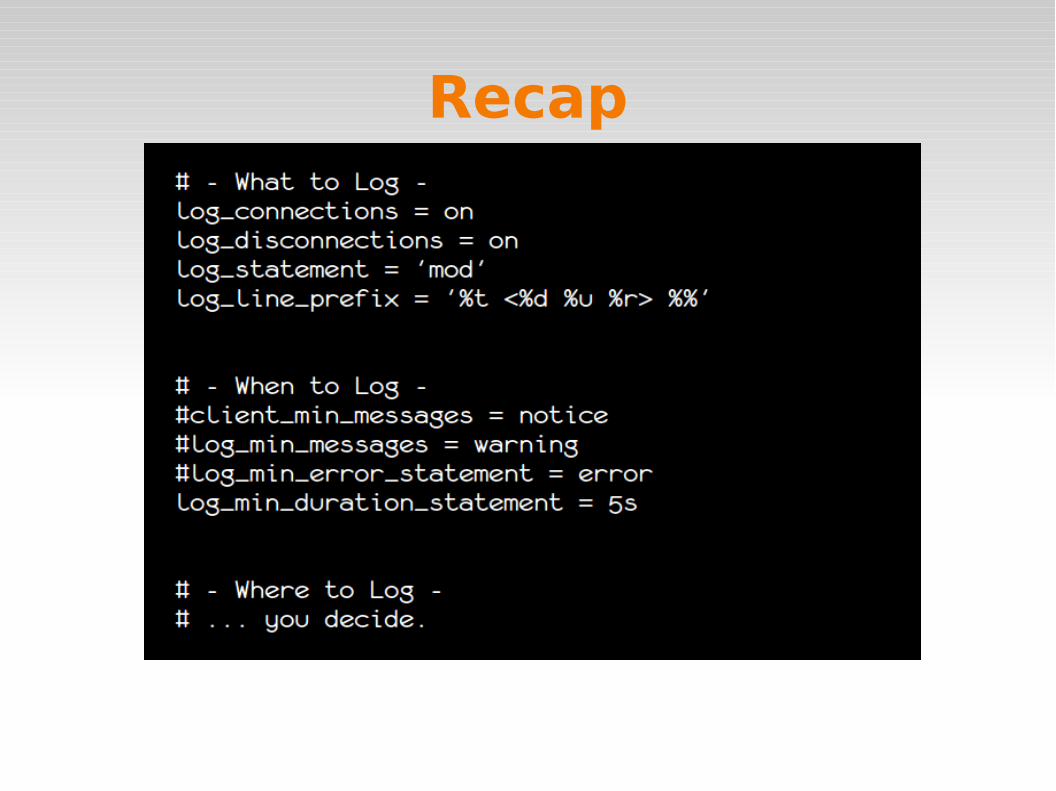
Recap
All righty, here's our config thus far. Again, YMMV: this may not be appropriate for your use. I encourage you to experiment!
Customize:
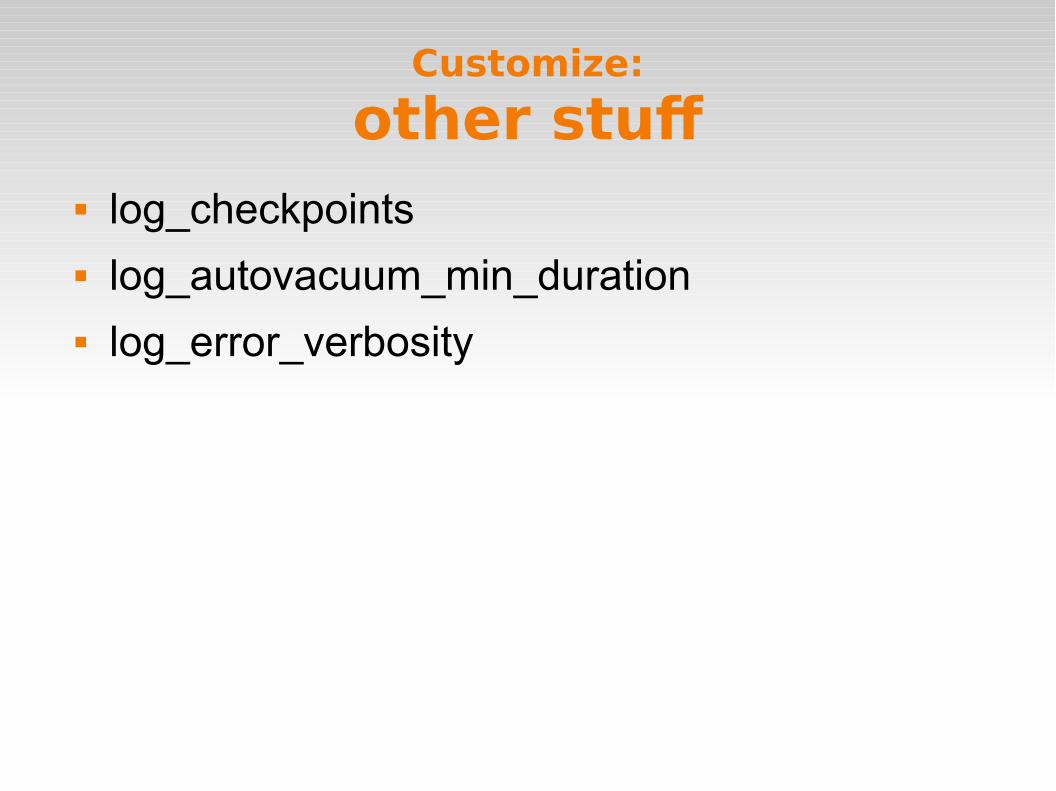
other stuf log_checkpoints log_autovacuum_min_duration log_error_verbosity
Other config parameters to be aware of, once you're comfortable with what we've covered so far.

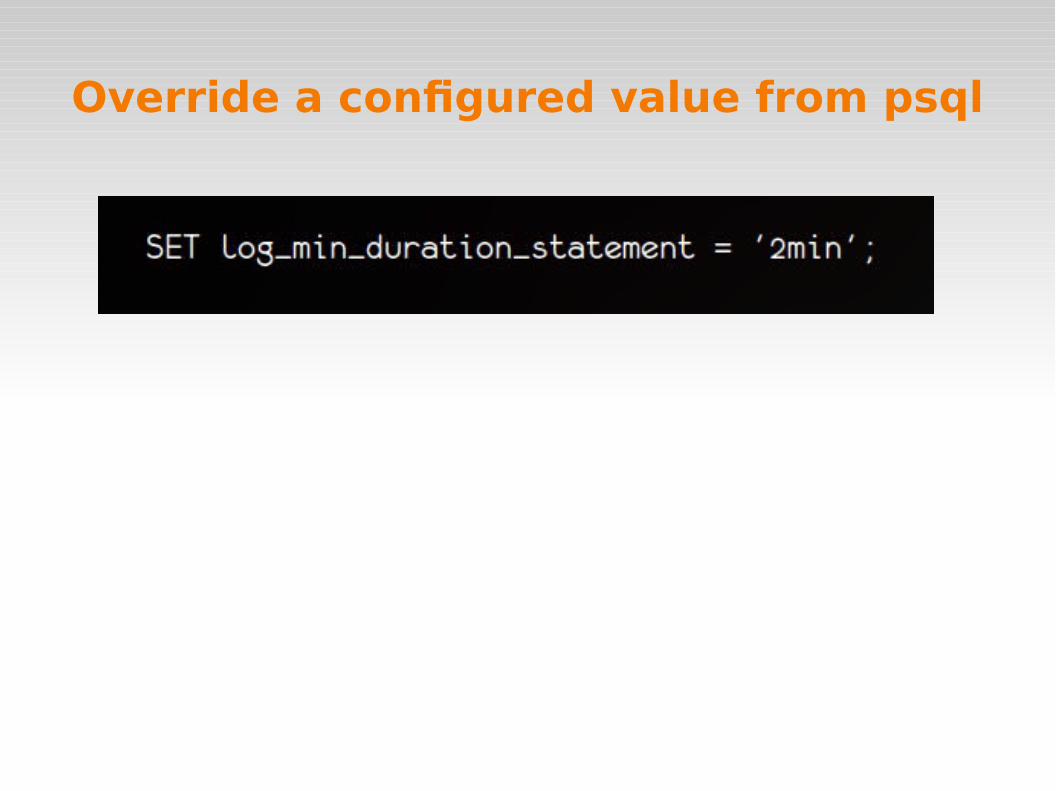
Override a configured value from psql
If you have THE POWER.
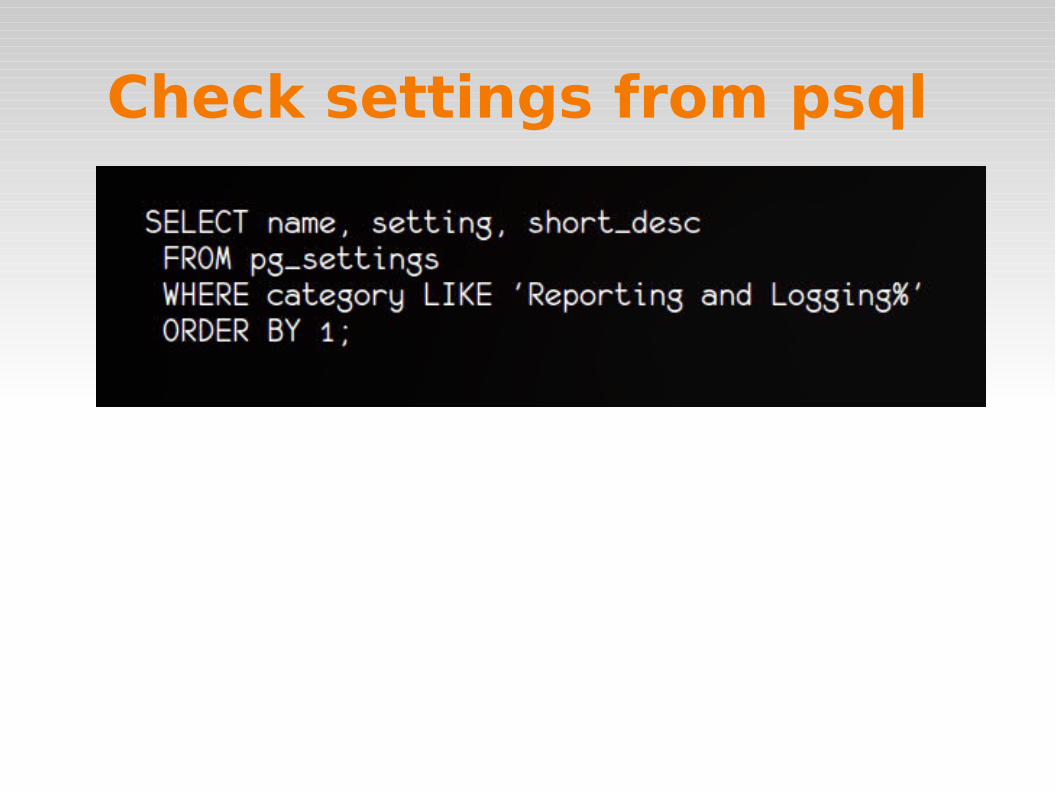
Check settings from psql
In case you forgot, and don't feel like opening up postgres.conf...

Tools
photo Dougtone (flickr). Creative Commons license.
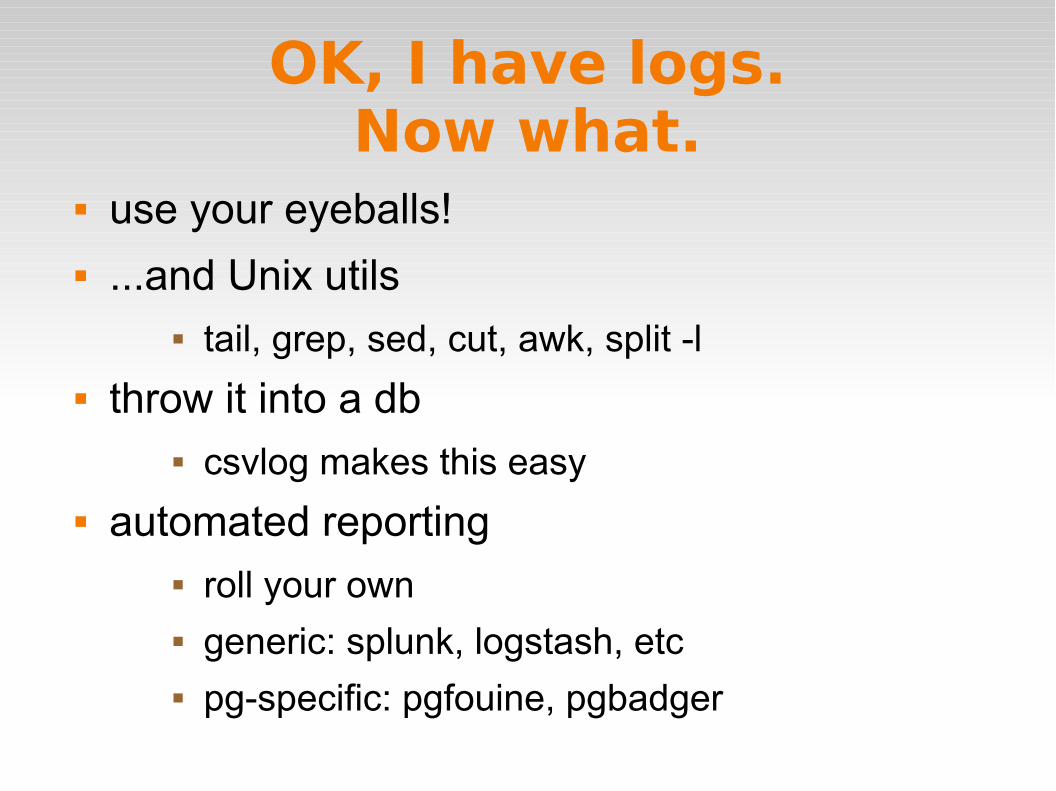
OK, I have logs.Now what.
use your eyeballs! ...and Unix utils
tail, grep, sed, cut, awk, split -l
throw it into a db csvlog makes this easy
automated reporting roll your own generic: splunk, logstash, etc pg-specific: pgfouine, pgbadger
You can read them. If you're a masochistic insomniac.
Look at them before you start having a problem. Get a grip on what ”normal” looks like for you. Also, you will likely have to look for something in the raw logs at some point in time – get yourself familiar with the environment now.
If you find stuff, fix it. You don't want to have to remember at 2am that 'Oh, yeah, those 3000 error messages we get every night are normal.'
Start out with the basic Unix utils for parsing files and see what's what.
Of course you could just throw it into a database or use some other reporting tools available.
Tools:
csvlog -> database create a table (see the docs)
”application field” added in 9.0
COPY 'my.log' TO log_table WITH CSV;
profit!
pros: disgustingly simple – best for automated parsing you get a lot of cool stuff (pid, timestamp, SQL state
code) automatically
cons: raw logs are not human-readable don't get to choose your fields
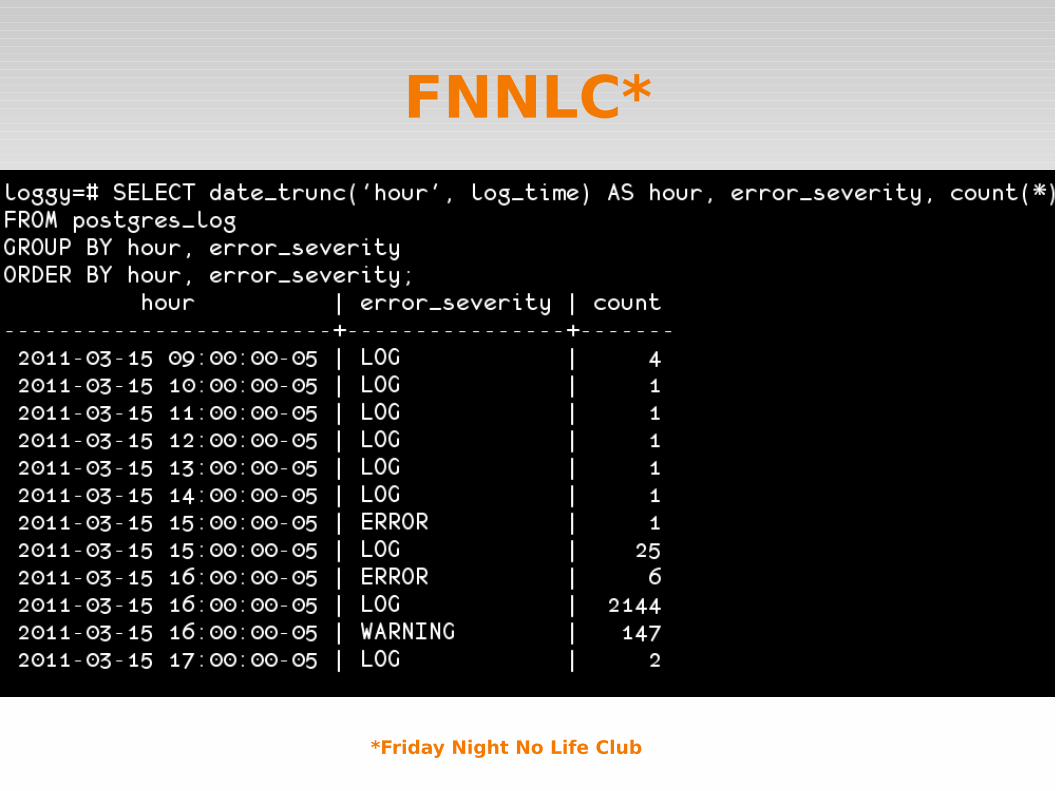
FNNLC*
*Friday Night No Life Club
This is just a quick sample of the sort of thing you can do – this is my log messages, grouped by severity and hour (mainly this was an excuse to use date_trunc because I love it.)
Notice I have a lot of WARNINGs coming in at 4pm? Maybe I should see what's happening then, some automated report or something.
(generic) Tools:
splunk & logstash www.splunk.com logstash.net Splunk costs $$$$, logstash is open-source Both are easy to install Both require some tweaking to handle Pg log
● I don't recommend setting these up just for postgres, but certainly leverage your existing systems if you already have these in place
Tools:
pgfouine pg log parser pgfouine.projects.postgresql.org pHp 8.4 slow on larger logs
The original.

Tools:
pgbadger pg log parser https://github.com/dalibo/pgbadger Perl use this one :)
The new kid on the block.
Tools:
pgfouine/pgbadger
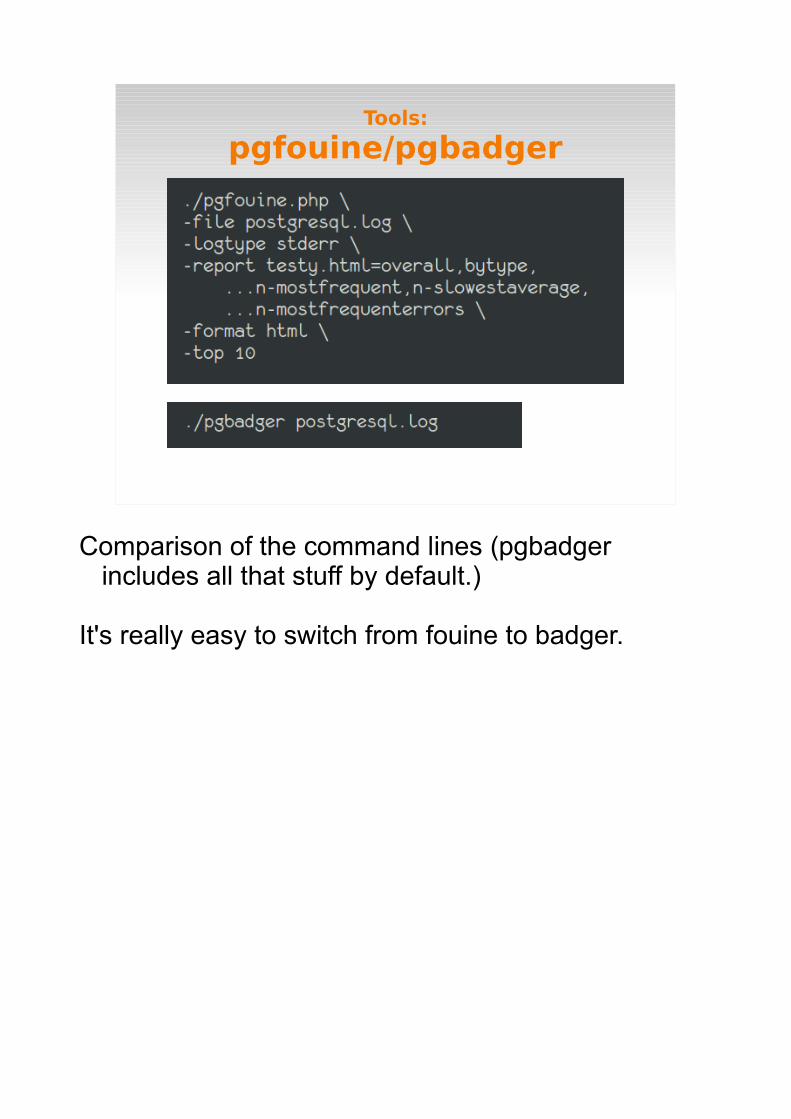
Comparison of the command lines (pgbadger includes all that stuff by default.)
It's really easy to switch from fouine to badger.

Tools:
pgfouine/pgbadger pros:
decent docs cron-able pretty, portable reports
cons: fouine is slow for large logs (badger is faster) requires specific log_line_prefix:
log_line_prefix = '%t [%p]' can't handle multi-line messages from stderr
logtype
CSS for the layout is included in each, so you can just ship the report somewhere and it won't display all weird. This makes it easy to share them with your friends!
Tools:
fouine/badger caveats re-format your syntax (eg, select -> SELECT) don't recognize some lines:
Even if it doesn't recognize the lines, it tells you instead of dying quietly.

Further tweaking
photo benfulton. Creative Commons license.
log_line_prefix:
SQL State error code (%e) 9.0+ (Guillaume Smet) 5-digit code that you can look up
and possibly find out a bit more about your error
For example:
22P02 = ”invalid text representation” 22003 = ”numeric value out of range”
This is an actual example, comparing what comes in in the logs with the actual published translation. So sometimes it will help you, sometimes it will only provide entertainment value.

per-user stats
auto_explain
contrib module - Takahiro Itagaki introduced in 8.4 automatically runs EXPLAIN on every query
that takes longer than a (super)user-specified value
to install: cd /pg/src/contrib make && make install
auto_explain is like log_min_duration_statement on crack.
It's a contrib module and you need to install it; here are the instructions.
It logs the EXPLAIN output for any query that runs longer than a certain amount of time (which you specify). This is cool because you can have it capture EXPLAIN data for you while you're out doing something else, and review the logs at your leisure.
But be careful – this will create a lot of output! Try this in your dev environment.
auto_explainpostgresql.conf
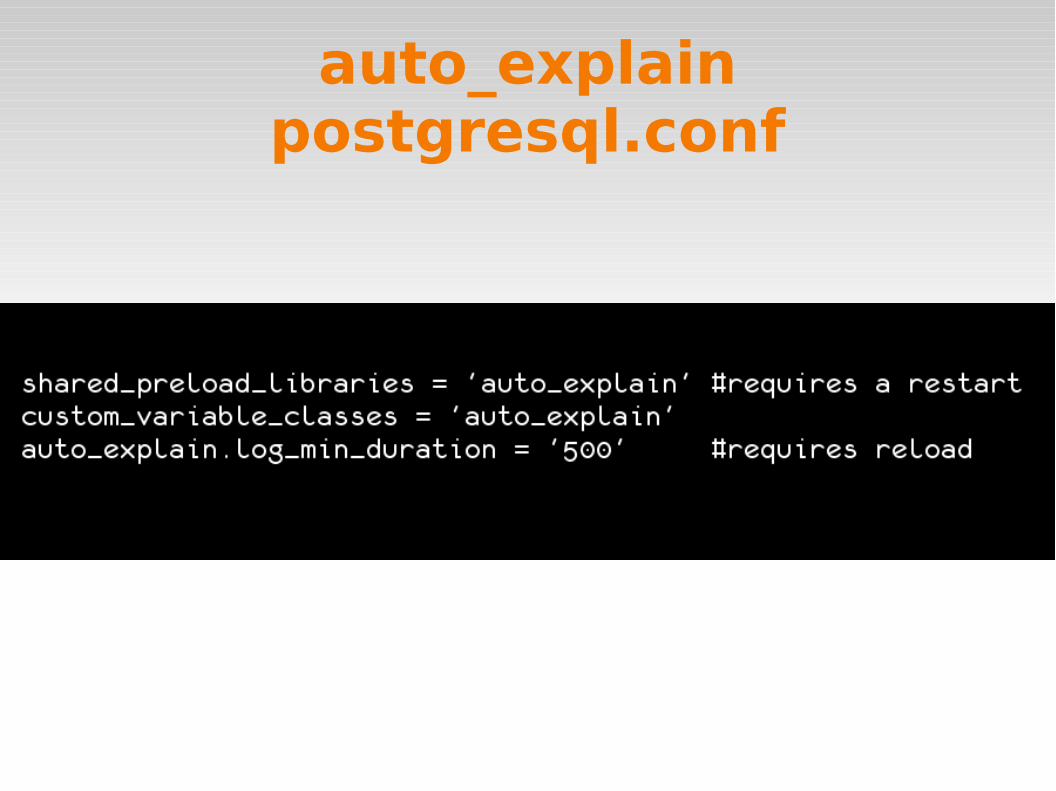
Once you have it installed, here's how you configure it in postgres.conf
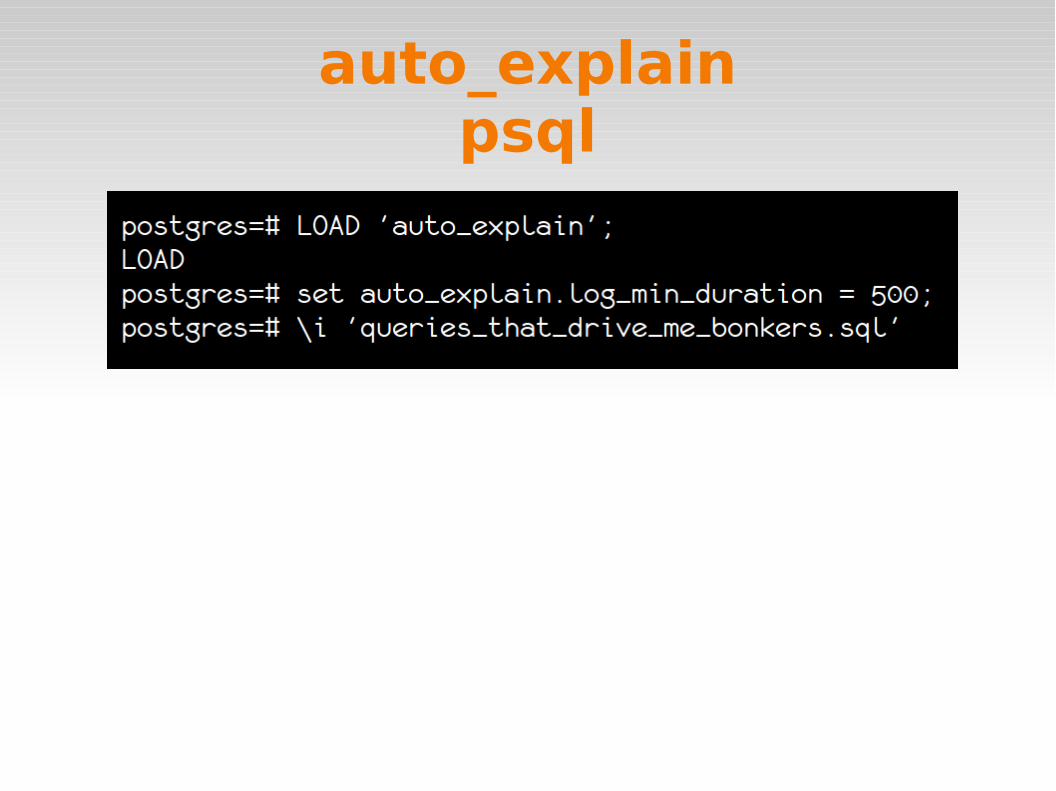
auto_explainpsql
I use it mainly from a psql session; here's how to do that. Then I just run whatever queries I want to check out. This is probably the safer way to run it than having it enabled all the time.
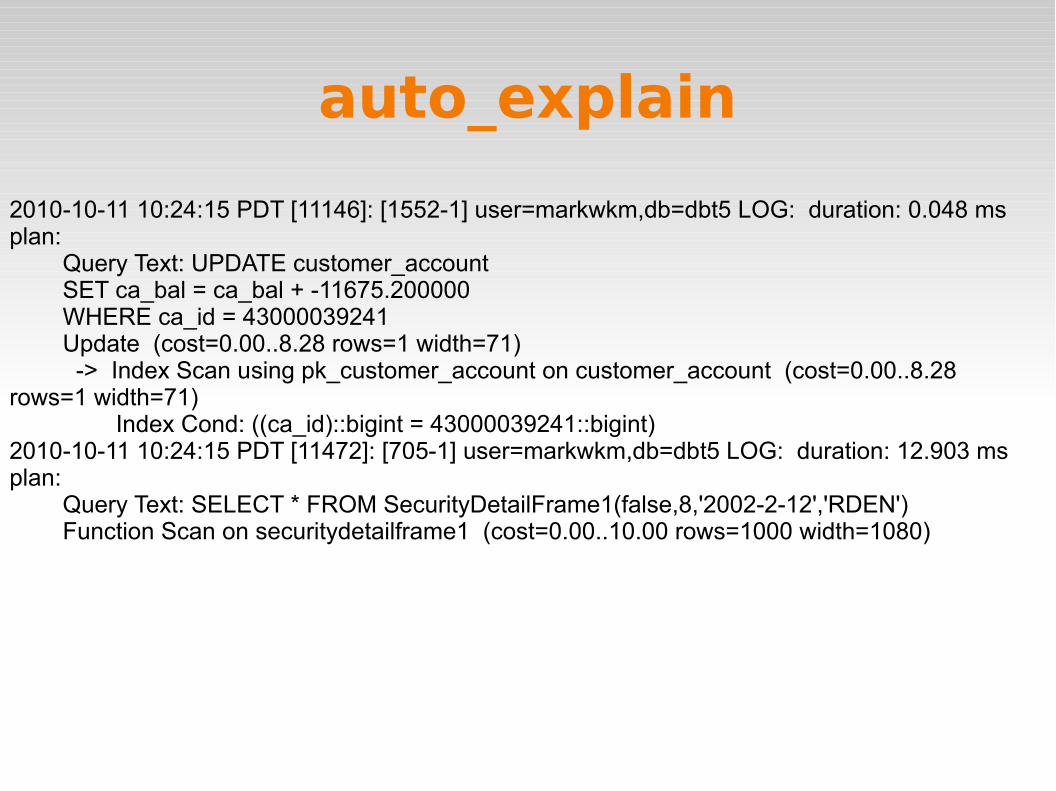
auto_explain
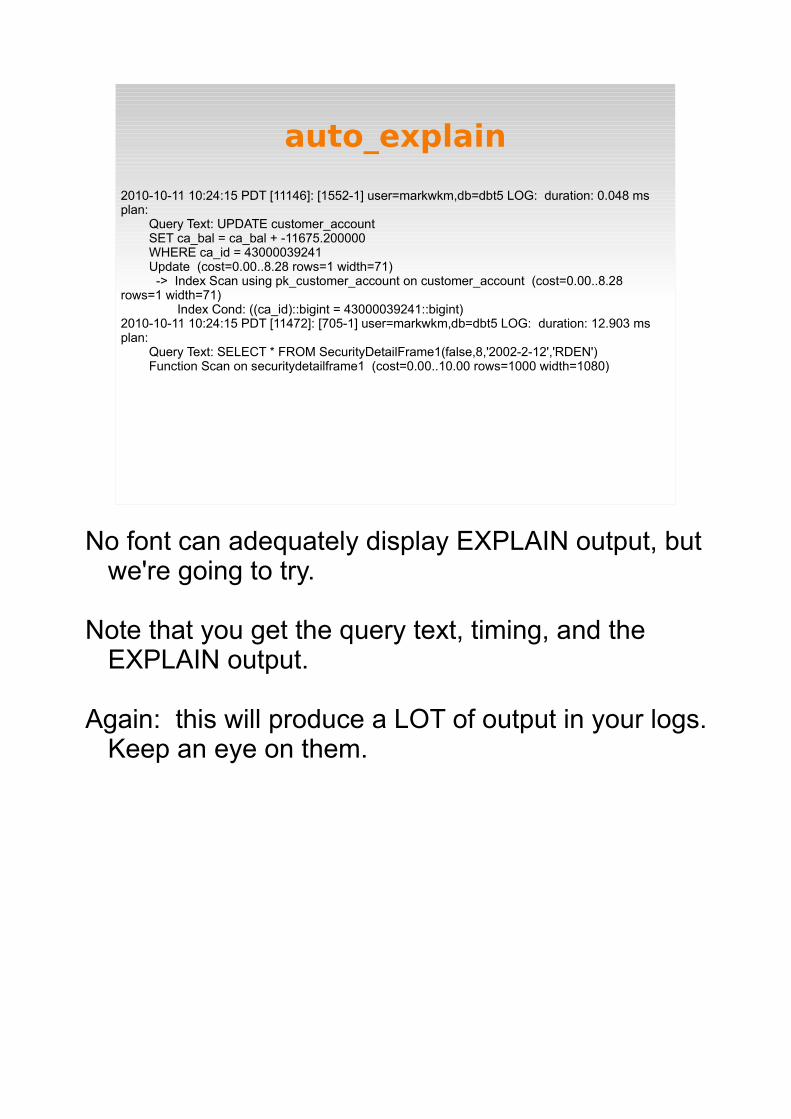
2010-10-11 10:24:15 PDT [11146]: [1552-1] user=markwkm,db=dbt5 LOG: duration: 0.048 ms plan: Query Text: UPDATE customer_account SET ca_bal = ca_bal + -11675.200000 WHERE ca_id = 43000039241 Update (cost=0.00..8.28 rows=1 width=71) -> Index Scan using pk_customer_account on customer_account (cost=0.00..8.28 rows=1 width=71) Index Cond: ((ca_id)::bigint = 43000039241::bigint)2010-10-11 10:24:15 PDT [11472]: [705-1] user=markwkm,db=dbt5 LOG: duration: 12.903 ms plan: Query Text: SELECT * FROM SecurityDetailFrame1(false,8,'2002-2-12','RDEN') Function Scan on securitydetailframe1 (cost=0.00..10.00 rows=1000 width=1080)
No font can adequately display EXPLAIN output, but we're going to try.
Note that you get the query text, timing, and the EXPLAIN output.
Again: this will produce a LOT of output in your logs. Keep an eye on them.
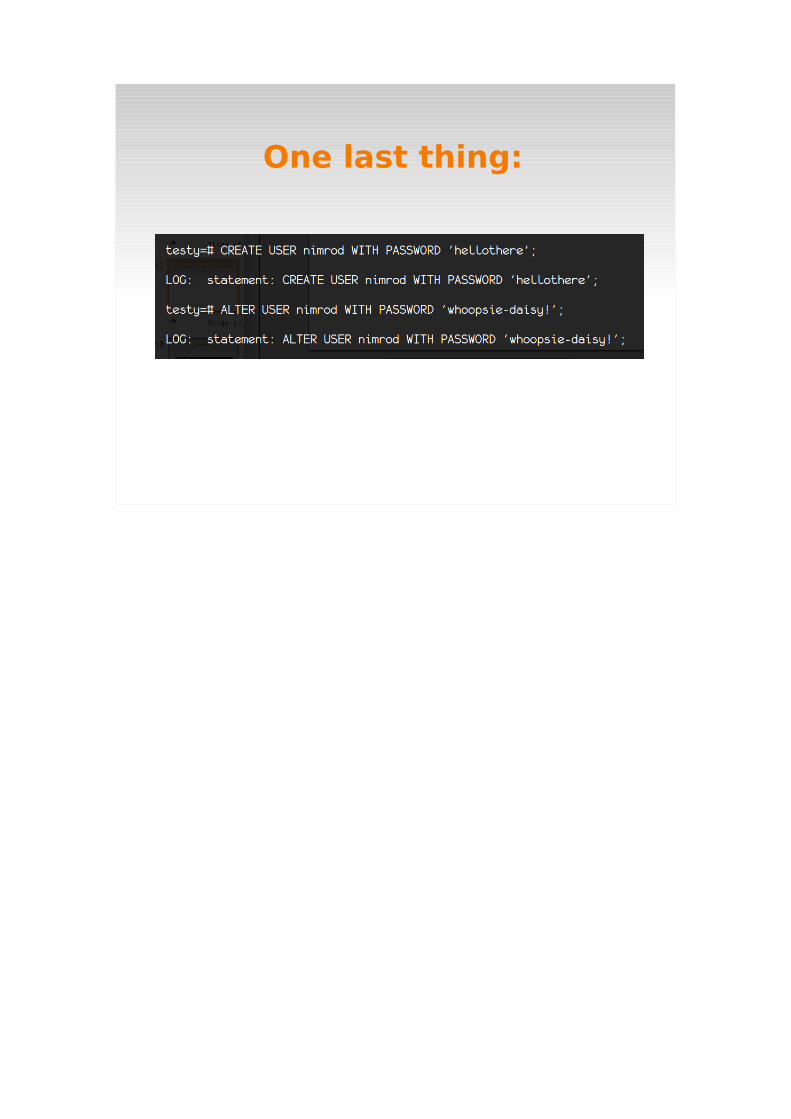
One last thing:
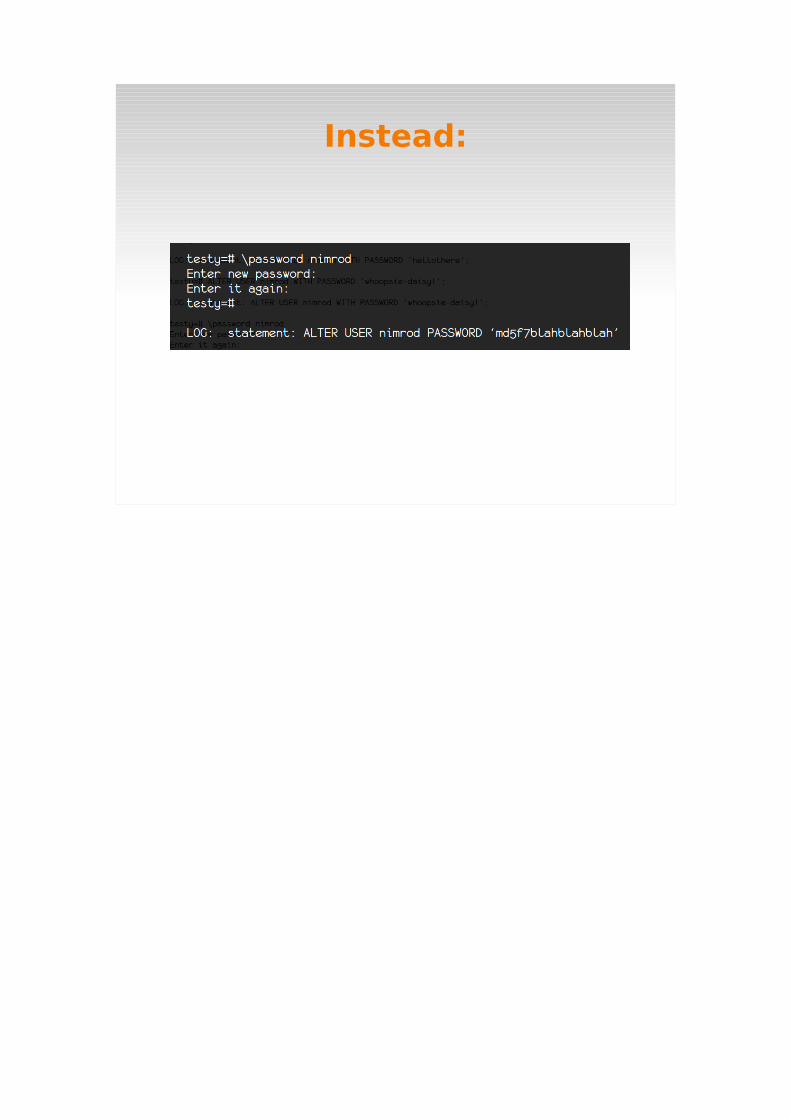
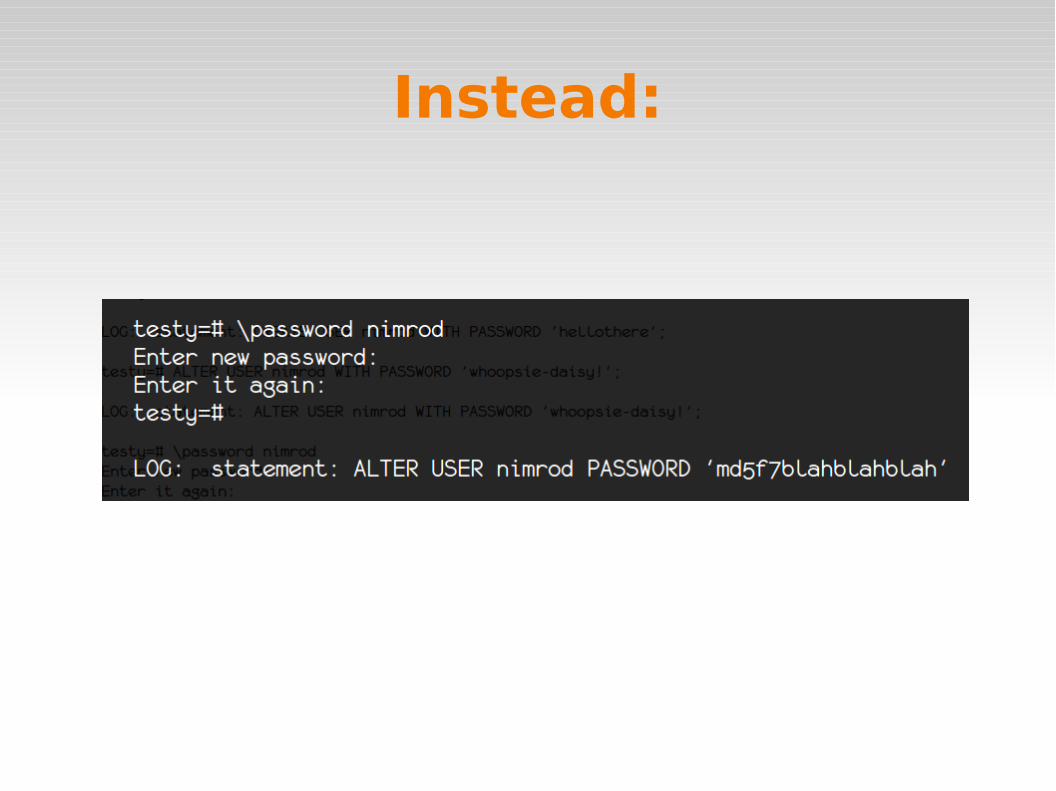
Instead:
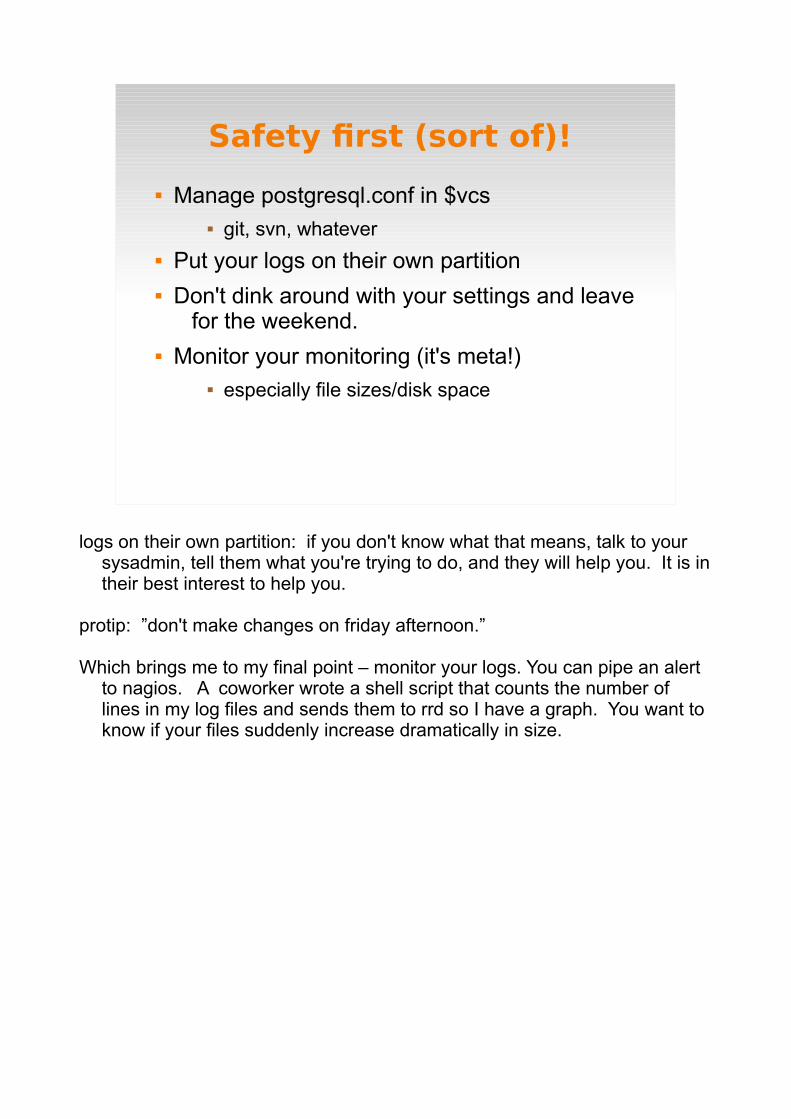
Safety first (sort of)!
Manage postgresql.conf in $vcs git, svn, whatever
Put your logs on their own partition Don't dink around with your settings and leave
for the weekend. Monitor your monitoring (it's meta!)
especially file sizes/disk space
logs on their own partition: if you don't know what that means, talk to your sysadmin, tell them what you're trying to do, and they will help you. It is in their best interest to help you.
protip: ”don't make changes on friday afternoon.”
Which brings me to my final point – monitor your logs. You can pipe an alert to nagios. A coworker wrote a shell script that counts the number of lines in my log files and sends them to rrd so I have a graph. You want to know if your files suddenly increase dramatically in size.

That's it!
photo by kcxd (flickr). Creative Commons license.

More...
”Query Logging and Workload Analysis”
Greg Smith
19 Sep 1:30pm

Thank you!
console font: monofur by tobias b koehler http://www.dafont.com/monofur.font
PDXPUG Josh Heumann feedback welcome!
Code sprint on Thursday [email protected], @gorthx


