
POULTRY EVOLUTION
A CONCENTRATION ON NAG, CPSI, and the UREA CYCLE
by
Laura Wertman
A thesis submitted to the Faculty of the University of Delaware in partial
fulfillment of the requirements for the degree of Degree in Biochemistry with
Distinction
Spring 2012
© 2012 Wertman
All Rights Reserved

POULTRY EVOLUTION
A CONCENTRATION ON NAG, CPSI, AND THE UREA CYCLE
by
Laura Wertman
Approved: __________________________________________________________
Carl Schmidt, Ph.D.
Professor in charge of thesis on behalf of the Advisory Committee
Approved: __________________________________________________________
Brian Bahnson, Ph.D.
Committee member from the Department of Chemistry & Biochemistry
Approved: __________________________________________________________
Nicole Donofrio, Ph.D.
Committee member from the Board of Senior Thesis Readers
Approved: __________________________________________________________
Donald Sparks, Ph.D.
Chair of the University Committee on Student and Faculty Honors

1
ACKNOWLEDGMENTS
University of Delaware Undergraduate Research Program
Dr. Carl J. Schmidt
Dr. Brian J. Bahnson
Dr. Nicole M. Donofrio
The Schmidt Lab
Graduate Student Liang Sung for his great mentoring abilities
Friends and Family for all of their support

2
TABLE OF CONTENTS
LIST OF TABLES ..................................................................................................... 4 LIST OF FIGURES .................................................................................................... 5
ABSTRACT............................................................................................................... 7
1 INTRODUCTION .......................................................................................... 9
2 METHODS .................................................................................................. 15
Protein Alignment of Human, Rat, and Chicken CPSI................................... 15
Gene Expression of Urea Cycle Enzymes ..................................................... 15 PCR of urea cycle enzymes........................................................................... 16
Real-time qRT-PCR of Urea Cycle Enzymes ................................................ 18 Phylogenetic Tree Production for Urea Cycle Enzymes ................................ 19
General Bacterial Plate Preparation ............................................................... 20 Raf PCR Product Cloning ............................................................................. 20
Leghorn Male Hepatocarcinoma (LMH) Cell Growth and Splitting .............. 23 Genomicus Gene Search of CPSI and NAGS ................................................ 24
3 GENE EXPRESSION OF UREA CYCLE ENZYMES................................. 25
Results/Discussion ........................................................................................ 25
RPKM studies of urea cycle enzymes...................................................... 25 PCR of urea cycle enzymes ..................................................................... 26
Conclusion.................................................................................................... 28
4 PROTEIN ALIGNMENT OF HUMAN, RAT, AND CHICKEN CPSI ......... 29
Results/Discussion ........................................................................................ 29 Conclusion.................................................................................................... 30
5 PHYLOGENETIC TREE PRODUCTION OF UREA CYCLE ENZYMES . 32
Results/Discussion ........................................................................................ 32
Inactivation of CPSI Enzymatic Activity ................................................. 32

3
Conclusion.................................................................................................... 33
6 RAF PCR PRODUCT CLONING ................................................................ 34
Results/Discussion ........................................................................................ 34 Conclusion.................................................................................................... 37
7 GENOMICUS OF CPSI AND NAGS........................................................... 38
Results/Discussion ........................................................................................ 38
Conclusion.................................................................................................... 40
REFERENCES ........................................................................................................ 41
BIBLIOGRAPHY .................................................................................................... 43
A The Urea Cycle ............................................................................................. 45
B Phylogenetic Tree Images ............................................................................. 46 C Phylogenetic Tree Distance Tables ............................................................... 53
D Sequence Accession Numbers....................................................................... 57

4
LIST OF TABLES
Table 1 Primer-Pairs for CPSI, OTC, ASS, ASLI, ASL, and ARG .................... 16
Table 2 Scientific Names, Common Names, and Taxonomic IDs of all
Organisms Included in the Phylogenetic studies ................................... 20
Table 3 Enzyme expression levels as per BigBird database libraries ................. 26
Table 4 qPCR results for cDNA ROSSDuod [10 ng/µL] ................................... 27
Table 5 qPCR results for cDNA N3CELC (normal tissue) ................................ 27
Table 6 qPCR results for HS4CELC (heat stress tissue) .................................... 27
Table 7 qPCR results for Normal [9.9 ng/µL] (top) and Heat Shock [10.2
ng/µL] (bottom) ................................................................................... 28
Table 8 CPSI .................................................................................................... 53
Table 9 OTC ..................................................................................................... 54
Table 10 ARG2 (normal) .................................................................................... 54
Table 11 ARG2 (agmatase)................................................................................. 55
Table 12 ASL (normal) ....................................................................................... 55
Table 13 ASL (carnosine) ................................................................................... 56
Table 14 ASSI .................................................................................................... 56
Table 15 Accession Numbers for All Sequences Utilized .................................... 57

5
LIST OF FIGURES
Figure 1 The urea cycle. Here the yellow colored enzymes and red path lines
depict poultry’s known inability to synthesize Arginine from
Ornithine, while the green enzymes represent their alternate ability of
creating Arginine from Citruline. ........................................................... 9
Figure 2 An evolutionary tree of vertebrates. Here, a (+) represents the
postulated presence of a functioning urea cycle and (-) represents the
absence of such. If the sign is not in parentheses then some members
of the group are also known to either possess or lack the functioning
complement of urea-cycle enzymes. “deletion” as labeled after
cotylosauria indicates the proposed loss of activity of one or more
enzymes, resulting in loss of urea cycle functioning (9) ........................ 13
Figure 3 Preservation of the NAG binding site as per Pekkala’s work. Note the
perfect conservation of these residues across Rats (top row), Humans
(middle row), and Poultry (bottom row). .............................................. 29
Figure 4 Missing transit peptide in poultry ......................................................... 30
Figure 5 PCR gel results for CPSRafPCR 1/10/12 (left) and CPSRafPCR2,3
1/11/12. Figure (a) top to bottom: CPS1a, CPS1b, Raf, B-Raf. Figure
b top to bottom: CPS1a, CPS1b, Raf, B-Raf using 10ng H2CELC;
CPS1a, CPS1b, Raf using D2duod4778, then B-Raf using
D14Duod4947, 1kb DNA ladder. Note in figure (a) the lack of any
significant PCR product compared to the base ladder versus the Raf
products shown in Figure (b). ............................................................... 35
Figure 6 PCR gel results for CPSRafPCR4 1/13/12 (left) RafcDNA198/196
1/26/12. Figure (a) top to bottom: CPSa, CPSb, B-Raf using D14
Duod 4947. Figure (b) top to bottom: Raf from IOWA198 heat-
stressed poultry sample cDNA, Raf from IOWA196 normal cDNA,
1kb DNA ladder, purified Raf from D2Duod4778. Note the supposed
Raf product from poultry numbers 196 and 198 versus the lack of
actual Raf in the purified product from PCR using D2Duod4778. ........ 36

6
Figure 7 PCR gel results for Rafspread 1/31/12 (left) and Rafspread part 2
2/5/12 (right). Figure (a) top to bottom: LMH cDNA combo, 653VLL
Ross w7cDNA, cDNA198, cDNA 196, 1kb ladder. Figure (b) top to
bottom: dilutions of cDNA 4932 starting from 100µL, 9µL, .9µL and
then two wells of 1kb ladder. No useful products were attained for
any of the cDNA types utilized. ........................................................... 37
Figure 8 Genomicus representation of CPSI in various organisms ...................... 38
Figure 9 Genomicus representation of NAGS in various organisms.................... 39
Figure 10 The Urea Cycle .................................................................................... 45
Figure 11 CPSI .................................................................................................... 46
Figure 12 OTC ..................................................................................................... 47
Figure 13 ARG2 (normal) .................................................................................... 48
Figure 14 ARG2 (agmatase)................................................................................. 49
Figure 15 ASL (normal) ....................................................................................... 50
Figure 16 ASL (carnosine synthase) ..................................................................... 51
Figure 17 ASSI .................................................................................................... 52

7
ABSTRACT
This study concentrates on the urea cycle of poultry and investigates the
evolutionary process behind the absence of urea production in poultry. Previous
genomic mapping studies of the genes encoding the urea cycle enzymes have detected
all urea cycle genes except N-acetyl glutamate synthase (NAGS) and polymerase
chain reaction (PCR) experiments revealed low levels of expression of the remaining
enzymes. So, while this study began with the hypothesis that poultry did not contain
the enzymes necessary to produce urea, genomic studies and sequence analysis shows
that there is only one absent enzyme, NAGS, as well as one possibly deficient enzyme,
carbamoyl phosphate synthase I (CPSI). It has been hypothesized that, by selecting
against N-acetyl glutamate (NAG) production and thus eliminating synthesis of urea,
poultry enabled the laying of land-based and hard-shelled eggs. CPSI, while found in
the poultry genome, appears to be nonfunctional due to sequence analysis showing
lack of a mitochondrial transit peptide. Why, then, is CPSI conserved in the chicken
genome? This is potentially due to interactions between CPSI and Raf, a promoter of
cell growth. While CPSI remains enzymatically nonfunctional in relation to urea cycle
studies, it has been shown to interact with Raf (1). Phylogenetic tree analysis
performed in this experiment also revealed that most of the urea cycle enzyme genes
are in evolutionary agreement, suggesting that the genes are all intact, potentially
serving some other purpose in the poultry genome. Finally, use of the Genomicus
v66.01 gene search helped depict conserved syntanic relationships of CPSI with its
surrounding enzymes across similar species. Meanwhile gene searching of NAGS

8
revealed much less conservation across the genomes of various organisms, with a
notable absence of any NAGS locus in the anole. Closer analysis showing the deletion
of the locus of NAGS in both lizards and birds makes it appear as though the deletion
must have occurred basal to the divergence of these genuses, resulting in elimination
of the urea cycle.

9
Chapter 1
INTRODUCTION
There exist three different classes of nitrogenous waste excretors:
ureootelics—where nitrogenous waste is emitted in the form of urea via the urea cycle
as shown in Figure 1 below, ammonotelics—where ammonia is the primary form of
nitrogenous waste released, and uricotelics—where uric acid is the main form of
nitrogenous waste produced (2). Poultry are manufacturers of hard-shelled eggs and
excrete nitrogenous waste solely in the form of urate, also known as uric acid.
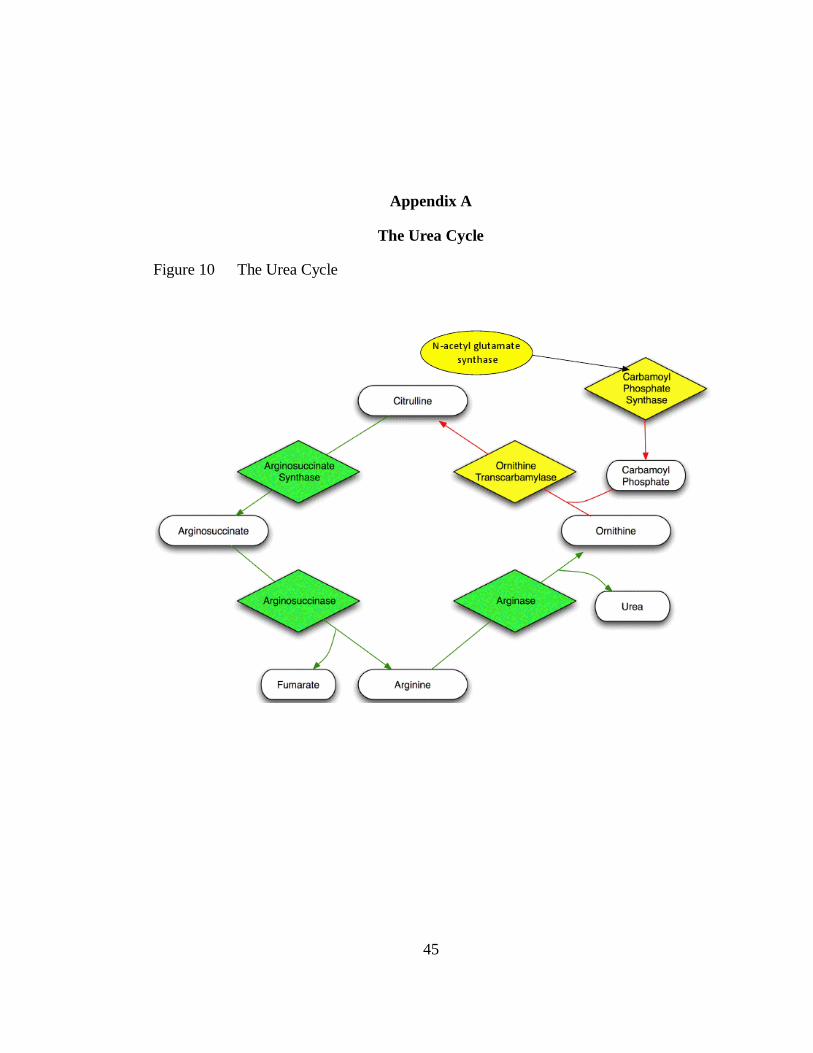
Figure 1 The urea cycle. Here the yellow colored enzymes and red path lines
depict poultry’s known inability to synthesize Arginine from Ornithine,
while the green enzymes represent their alternate ability of creating
Arginine from Citruline.

10
Similar to poultry, terrestrial turtles excrete nitrogenous waste mainly in the
form of uric acid. These reptilians have also displayed significant liver arginase
activities (28000 µmoles product/hr/g wet wt. liver) yet low levels of CPSI (10),
ornithine transcarbamylase, OTC (276), and arginosuccinate synthase, ASS (10), a
trend consistently in poultry, but varying greatly from other uricotelic animals
showing low arginase activities in the liver (2). Despite the uricotelic functioning of
terrestrial turtles, the ureotelic-type arginase functioning remains in small amounts
compared to most ureotelics, suggesting that terrestrial turtles are intermediates in the
evolutionary process toward uricotelism.
Previous studies in the lab of Dr. Carl Schmidt show that all urea cycle
enzymes, aside from NAGS, are present in the poultry genome. T.Shimogiri has also
shown the expression of ARG1 in the liver, ARG2 in extra hepatic tissues such as the
kidney, and so on (3). More specifically, radiation hybrid (RH) mapping was
performed, indicating the location of CPSI on GGA7 (Gallus Gallus Arm 7); OTC on
GGA1, ASL onto GGA19 and ARG2 on GGA5. ASS however, could not be assigned
to a specific chromosomal region, but it was proposed that it may be a marker of
GGA17 (3). It has also been proposed that the deletion of even a single urea cycle
enzyme would require a transition to uric acid metabolism (4).
This loss in urea cycle functioning coincides with the findings that poultry are
incapable of forming arginine from ornithine, a pathway that could only possibly work
if CPSI and OTC were active. Still, findings have shown citruline can be metabolized
to arginine, supporting past findings of an active ASS liver enzyme (4). With the
decrease in the functional urea cycle enzymes comes an increasing requirement for
dietary arginine (2). Normally, ureotelics would use the urea cycle enzymes to

11
synthesize L-arginine from ornithine, but uricotelic poultry lack the active CPSI
enzyme necessary for fixation of ammonia and require additional arginine from
external sources. The amino acid requirement for arginine is essential for successful
protein synthesis, growth, feathering, and other biological functions (5). While dietary
arginine is essential and poultry certainly cannot produce arginine from ornithine, an
alternate route of arginine production from citruline has proven successful, using
arginosuccinate synthase followed by arginosuccinate lyase to yield arginine. The
reduced arginase activity in poultry liver further prevents wasting of any arginine (6).
Also in relation to the presence of arginine in poultry, NAG synthase has
undergone much evolutionary change going from prokaryotes to vertebrates and
mammals. In prokaryotes, NAGS is inhibited by arginine and acts as a precursor to
the arginine-biosynthesis pathway (7). In mammals, NAGS was originally stimulated
by arginine and did not act as a precursor to arginine biosynthesis. According to
Haskins though, the evolution from arginine inhibition of NAGS to activation was
gradual, starting with complete inhibition in bacteria, partial in fish, and activation in
frogs and mammals, further allowing the transition from aquatics to land (8).
Once NAGS no longer served as a precursor to arginine biosynthesis,
mammals began synthesizing arginine via the enzymes of the urea cycle, instead using
NAGS to supply CPSI with its allosteric activator N-Acetyl Glutamate (NAG).
Binding NAG to CPSI creates a conformational change in the subunits of the enzyme
and that without it the CPSI activity is undetected (7). Therefore, CPSI has been
deemed the rate-limiting step, requiring allosteric binding with NAG in order to
activate the urea-cycle (8)

12
Haskins explains that the appropriate transition of toxic ammonia into non-
toxic metabolites was an evolutionary necessity permitting animals to transition from
water-based environments into land-based environments (8). So, knowing that the
urea cycle converts ammonia to urea in many animals, studies have suggested the urea
cycle came into play at the start of metamorphosis (9) as a means of more efficiently
excreting nitrogenous toxicities. The research of Cohen and Brown further explain the
favorable free-energy changes of the cycle steps allowing for thermodynamic
feasibility.
It has also been suggested that the evolution of uric acid synthetic enzymes
would have allowed for an even greater freedom from aquatic environments during
embryonic growth, allowing for less dependence on urea cycle enzymes and their
functions. Presumably, this is what happened in the course of reptilian (9) and avian
evolution. Had poultry maintained urea production through evolution, this very
soluble and toxic waste would have been excreted during embryonic development, but
would have no release or ability to escape the hard shell, thus killing its embryo. An
evolutionary tree as designed by Brown and Cohen also proposed deletions as the
main reason for the dysfunctional urea cycle in poultry. Here, Brown defines a
deletion as reducing enzymatic activity so greatly that the urea cycle is no longer able
to function at enough of a level to properly eliminate ammonia in the form of urea.

13
Figure 2 An evolutionary tree of vertebrates. Here, a (+) represents the postulated
presence of a functioning urea cycle and (-) represents the absence of
such. If the sign is not in parentheses then some members of the group
are also known to either possess or lack the functioning complement of
urea-cycle enzymes. “deletion” as labeled after cotylosauria indicates the
proposed loss of activity of one or more enzymes, resulting in loss of
urea cycle functioning (9)
Studies performed by Brown propose that the loss of even one urea cycle
enzyme would require poultry to evolve toward uricotelism. One hypothesis in this
project is that, by selecting against NAG production and eliminating urea production,
poultry were able to lay land-based, hard-shelled eggs.
This proposed loss of urea cycle functioning coincides with the inability of
poultry to produce arginine from ornithine while maintaining the ability to produce
arginine from citruline (10). Liver activities of arginase in the vertebrates have a
decreasing trend descending from sharks to frogs, turtles, and lizards, to snakes and

14
birds that have completely lost arginase functioning, supporting the observation of
liver arginase activity loss through evolution.
This project proposes the investigation of the structure of poultry carbamoyl
phosphate synthase I (CPSI), an enzyme that, in humans, is responsible for the proper
flow of the urea cycle when activated by N-acetyl glutamate and is potentially
functional in the promotion of cell growth when bound with the proto-oncogene Raf.
This protein kinase is of significant importance in signal transduction, and is involved
in the Ras/MAP-kinase pathway, cell proliferation, and in maintaining a differentiated
cell phenotype (1). Raf exists in three different isoforms; A-Raf, B-Raf and C-Raf.
Both A-Raf and C-Raf interact with CPSI but ASS only interacts specifically with A-
Raf (1). Other CPSI functioning relations include pyrimidine synthesis from carbamyl
aspartate, which have also been shown to require a supply of carbamyl phosphate (11).
Exploring the presence or absence of certain binding sites on poultry CPSI compared
to human CPSI allows for further determination of poultry CPSI functionality.
Looking at the structure of the CPSI enzyme, the presence or absence of any
NAG binding site would first determine whether or not poultry evolved to prevent
urea production via selection for loss of NAG binding. Kazuyo has demonstrated
stimulation of urea formation by adding NAG and ornithine in perfused liver (12). So,
should the NAG binding site remain, the urea cycle could potentially be activated in
poultry by introducing cloned NAG into a poultry liver cell line. This would activate
the urea cycle as shown in Figure 1. If the NAG binding site no longer remains,
cloning and introducing a specialized human CPSI that maintains an NAG binding site
along with cloned NAG may then result in poultry urea production, thus proving that
there is expression of all enzymes involved in the urea cycle.

15
Chapter 2
METHODS
Protein Alignment of Human, Rat, and Chicken CPSI
A specific comparison was done in which the sequences of chicken, human,
and rat CPSI were aligned using UniprotKB’s alignment tool (13). The highlighting
feature of this website’s program allowed for notation of the allosteric activator as
well as other sequence features.
Gene Expression of Urea Cycle Enzymes
As noted previously, the lab of Dr. Carl Schmidt had already determined the
presence of various enzymes in the poultry genome. Multiple experiments had been
carried out in order to determine the expression levels of these different enzymes and
were recorded into the BIGBIRD database—a database created by the University of
Delaware, Mississippi State University, and University of Arizona laboratories while
working on mapping the poultry genome and performing heat stress studies. To
investigate the various expression levels of the urea cell cycle enzymes, specific rpkm
values—reads per kilobase of model, representing the number of transcripts per
million transcripts of sample per kilobase (l4)—of each urea cycle enzyme were
identified and the tissues with the highest levels of expression were selected for further
analysis.

16
PCR of urea cycle enzymes
Primers were designed for each of the urea cycle enzymes by inputting FASTA
formatted sequences from the NCBI database into the Primer3Plus web system. Using
this system, the general settings consisted of the product size ranging from 75-150.
From there, the task was set to the detection tab and the “pick primers” option selected
for creation of primers. In each case the first designed primer was selected and sent to
the Primer3Manager for ordering. The resulting primers of choice are displayed in
Table 1 below.
Table 1 Primer-Pairs for CPSI, OTC, ASS, ASLI, ASL, and ARG
Enzyme
Symbol
Sequence
Reference
Forward primer
Reverse primer
Tm
CPSI NM_001045841.1 GTAGTGCCCTGGGTGAAAAA
CCAACACCATCACTCCACAG
55.3
55.5
OTC AF065629.1 ATCCTTGGCCATGATTTTTG
GCCCAGGTGAATGTCTTGTT
55.6
55.7
ASS NM_001013395.1 CTGAAGGAGCAGGGCTACAC
ACACCTTCTTAGCCCCCAGT
57.6
58.3
ASLII NM_001030714.1 GCCATTCAGACAAGCTCAC
GGCTGATGCTCTTCAAGTCC
55.5
55.9
ASLII NM_001030714.1 TGCCATTCAGACAAGCTCAC
GGCTGATGCTCTTCAAGTCC
57.6
58.3
ASLI NM_205501.1 TACCCTCCAGGTCAACAAGG
GGCATTCCTTTACGAACCAA
56.3
53.2
ARG2 NM_001199704.1 GATGTTGATCGCCTTGGAAT
GCATCGATGTCAAAGCTCAA
53.1
53.5
Once all primers were designed and ordered, all forward and reverse primers
for each urea cycle enzyme were labeled with the appropriate identification stickers
and diluted to a stock concentration of 1x10⁻⁵
M using tris-EDTA buffer at pH 8.0
(note: later primers were diluted using nuclease-free water, which is also acceptable).
17
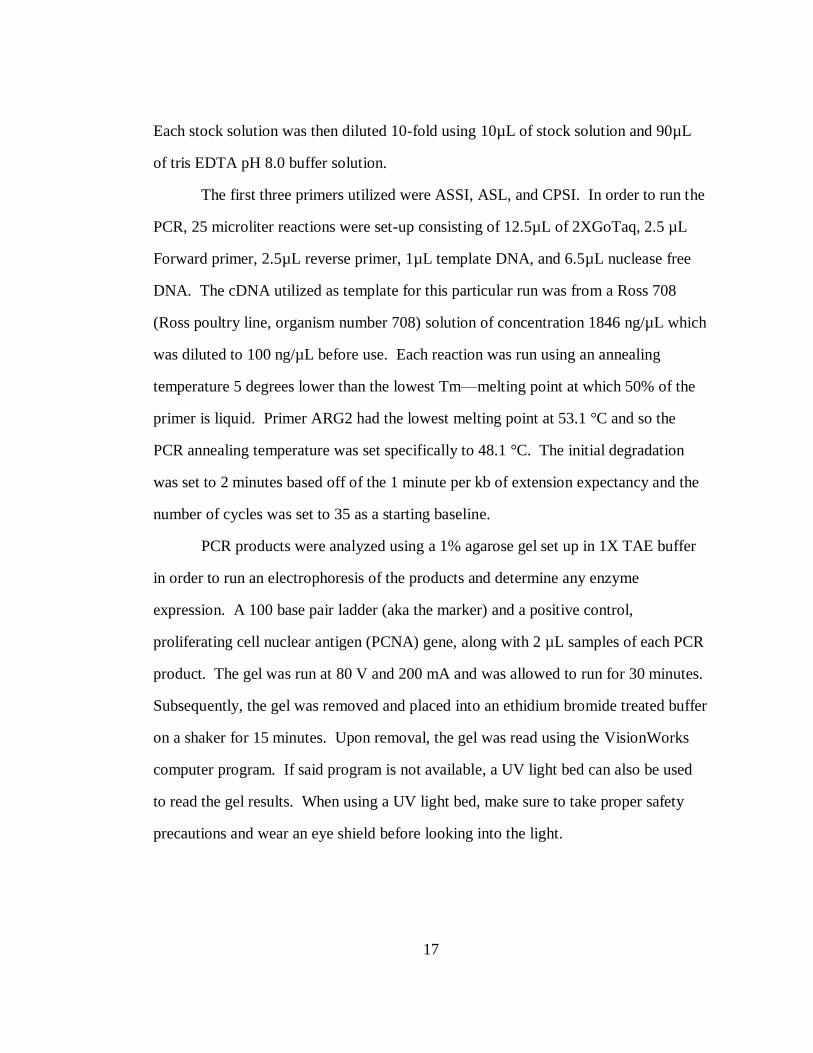
Each stock solution was then diluted 10-fold using 10µL of stock solution and 90µL
of tris EDTA pH 8.0 buffer solution.
The first three primers utilized were ASSI, ASL, and CPSI. In order to run the
PCR, 25 microliter reactions were set-up consisting of 12.5µL of 2XGoTaq, 2.5 µL
Forward primer, 2.5µL reverse primer, 1µL template DNA, and 6.5µL nuclease free
DNA. The cDNA utilized as template for this particular run was from a Ross 708
(Ross poultry line, organism number 708) solution of concentration 1846 ng/µL which
was diluted to 100 ng/µL before use. Each reaction was run using an annealing
temperature 5 degrees lower than the lowest Tm—melting point at which 50% of the
primer is liquid. Primer ARG2 had the lowest melting point at 53.1 °C and so the
PCR annealing temperature was set specifically to 48.1 °C. The initial degradation
was set to 2 minutes based off of the 1 minute per kb of extension expectancy and the
number of cycles was set to 35 as a starting baseline.
PCR products were analyzed using a 1% agarose gel set up in 1X TAE buffer
in order to run an electrophoresis of the products and determine any enzyme
expression. A 100 base pair ladder (aka the marker) and a positive control,
proliferating cell nuclear antigen (PCNA) gene, along with 2 µL samples of each PCR
product. The gel was run at 80 V and 200 mA and was allowed to run for 30 minutes.
Subsequently, the gel was removed and placed into an ethidium bromide treated buffer
on a shaker for 15 minutes. Upon removal, the gel was read using the VisionWorks
computer program. If said program is not available, a UV light bed can also be used
to read the gel results. When using a UV light bed, make sure to take proper safety
precautions and wear an eye shield before looking into the light.

18
The same protocol using a 25 µL reaction was used for the remaining urea
cycle enzymes and the PCR run with an annealing temperature of 48.1 °C. Again, the
results were analyzed on a 1% agarose gel for 30 min at 80 V and 200 mA and were
compared to a 100 base pair ladder.
Real-time qRT-PCR of Urea Cycle Enzymes
Once it was clear the primers were working a qRT-PCR reaction was set up for
each of the enzymes of the urea cycle. A master mix was created so that each reaction
would have 6µL SYBR green, 4.5µL nuclease-free water, 0.5 µL of a forward and
reverse primer mix—made by adding 10µL forward primer, 10 µL reverse primer, and
80 µL nuclease-free water—and 1 µL cDNA, making each reaction 12 µL total. This
time, the cDNA used was CELCN1 standing for Chicken Embryo Liver Cells at
Normal Temperature.
Each reaction of interest was set up three times (using three different wells) for
the purpose of generating statistically sound results. Once all three reactions were
prepared in the qPCR plate for each enzyme, the plate was spun down for 3 minutes at
4000 rpm. The PCR machine was then turned on and set to use the 7500 fast system
software. A new run was created using the FASTcyber detector.
Another qPCR method was used for trials 3 and 4 in which cDNA was first
diluted to 10 ng/µL and each reaction was set up separately as opposed to use of a
mastermix. Specifically, each reaction used 6 µL SYBR green, 4.5 µL nuclease-free
water, .5 µL of a pre-made mixture of 10 µL forward primer and 10 µL reverse
primer, and 1 µL of the diluted cDNA. Once the plate was set up it was spun for 2
minutes at 4000 rpm and run in the qPCR machine using the same methods of the
previous qPCR method.

19
Phylogenetic Tree Production for Urea Cycle Enzymes
To explore the phylogenetic relationships of the urea cycle pathway, a number
of representative sequences from multiple species at each step in the pathway were
needed for construction of an evolutionary tree. The organisms selected for in this
particular case are described in Table 2. While not every single organism had a
representative sequence for every enzyme of the urea cycle, those that were able to be
found were included in the trees. ARG2 and both forms of ASL also included
alternative enzymes and so two different tables were made and compared for these
particular enzymes.
The protein sequences were identified by using the chicken protein sequences
and the blast algorithm to identify ortholog sequences of other species. Next, the
EMBL-EBI-ClustalW2 system was used by pasting sequences into the box and
clicking submit (15). The resulting phylogenetic tree image was then saved. This
procedure was repeated for each urea cycle enzyme. For reference to each tree,
please see Appendix B.

20
Table 2 Scientific Names, Common Names, and Taxonomic IDs of all Organisms
Included in the Phylogenetic studies
Scientific Name Common Name Taxonomic ID
Gallus gallus Chicken 9031
Rattus norvegicus Rat 10116
Homo sapien Human 9606
Monodelphis domestica Gray short-tailed opossum 13616
Xenopus tropicalis Tree frog 8364
Danio rerio Zebrafish 7955
Anolis carolinensis Anole 28377
Drosophila annanassae Fruit Fly 7217
Escherichia coli E-coli K12
Taeniopygia guttata Zebra Finch 59729
Ornithorhynchus anatinus Ductal Platypus 9258
General Bacterial Plate Preparation
Bacterial plates were made using 7.54 g Agar and 12.03 g Lysogeny Broth
(LB) in 500mL ddH20 mixed and autoclaved for 50 minutes on the wet setting. The
autoclaved solution was then placed in a water bath and 100mg/mL carbanicillin in
50% EtOH was added before pouring the plates.
Raf PCR Product Cloning
Once PCR product was attained for Raf using graduate student Janet
DeMena’s duodenal cDNA, attempts of cloning Raf’s PCR product were made using a
TOPO TA cloning Kit from QIAGEN. First, a chemical transformation reaction was
set up using 2 µL fresh PCR product, 1 µL provided salt solution, 2 µL provided
sterile water, and 1 µL provided TOPO vector, totaling a 6 µL reaction. The reaction
tube was flicked a few times for mixing and then centrifuged lightly to gather the
solution together before setting for 5 minutes at room temperature and placing on ice.
Then, a One Shot Chemical Transformation took place in which the provided One

21
Shot E-coli ells were thawed on ice before adding 2 µL of the TOPO cloning reaction
and mixing. This newly formed solution was incubated on ice for approximately 20
minutes and then heat shocked for 30 seconds at 42 °C without shaking. 250 µL Soc
medium was added to the cells, the tubes were capped and shaken at 37 °C for one
hour, and then 10 µL and 50 µL of the transformation was added to X-gal and
carbanicillin containing LB plates. These plates were incubated overnight at 37 °C.
Following plate growth, 0.5 mL carbanicillin was added to 500 mL LB Broth
and mixed. 2 mL of this carbanicillin/LB solution were added into 8 different sample
tubes. Clear/white cultures from each bacterial plate were inoculated into the different
sample tubes using yellow-tipped rods before labeling lids on the tubes. It is
important to note that the tubes must NOT be sealed in order to allow for oxygen entry
for optimum culture growth. These tubes were then placed, with the rack, into the
heater/shaker at 37 °C over night. In the first trial it was found that the heater had
been turned off, and so the heater was turned back on the next morning and the tubes
allowed to shake for another 3.5 hours. Once the samples were ready, the solutions
were spun down but no pellets were formed. Therefore, 1 mL from each tube was
taken and put into new media. Furthermore, new cultures were inoculated including a
blue colony as a control. Once more the cultures were allowed to set overnight.
The cloning procedure was repeated again using 4 µL of the old PCR product,
1 µL salt solution, and 1 µL topo vector in attempt to attain further cultures, but no
growth was observed. Therefore, PCR product purification was performed using the
QIAquick PCR Purification Kit. Seventy-five microliters of Buffer PB were added to
15 µL Raf PCR Product and placed into a QIA quick spin column that was added to a
2 mL collection tube. This was centrifuged for 1 minute and the flow through
22
discarded. The sample was then washed using 0.75 mL Buffer PE and centrifuging 1
minute before discarding the remaining flow-through and centrifuging an extra
minute. The QIAquick column was then added to a new 1.5 mL micro centrifuge
tube. In order to elute the DNA, 50 µL Buffer EB was added to the QIAquick
membrane and the sample centrifuged for 1 minute. This purified PCR product was
used for further cloning experiments along with freshly made cDNA from IOWA
poultry RNA samples.
The cDNA from IOWA poultry RNA samples was produced using samples
198 IOWA (heat stress) concentration 879.92 ng/µL and 196 IOWA (normal) 343.82
ng/µL, both of which only 1ug was used for First-Strand Synthesis. In each case, the
RNA sample was added along with 1 µL dNTP mix, 1µL Random hexamers, and
additional ddH2O to create a total of 10 µL samples. These solutions were incubated
at 65 °C for 5 minutes and then placed on ice for a minimum of 1 minute. A 2X
reaction mix was then created using 5 µL 10XRT buffer, 10 µL 25 mM MgCl2, 5 µL
.1M DTT, and 2.5 µL RNaseOUT (40 U/µL). Nine microliters of this 2X reaction
mix was added to each RNA/primer mixture, mixed gently, and collected by
centrifugation before being incubated at room temperature for 2 minutes. Then 1 µL
of SuperScript II RT was added to each tube and the solutions were incubated further
at room temperature for another 10 minutes, then incubated another 50 minutes at 42
°C. The reaction was then terminated at 70 °C for 15 minutes before being chilled on
ice. Finally, the reaction was briefly centrifuged for collection and 1 µL RNase H was
added to each tube. These final solutions were incubated for 20 minutes at 37 °C,
making them ready for use in PCR reactions.

23
Leghorn Male Hepatocarcinoma (LMH) Cell Growth and Splitting
LMH cell growth began by taking one 75 cm2 flask, adding 5 mL attachment
factor (AF) to each, and storing at 4 °C for a minimum of 10 minutes in order to coat
the surface with gelatin for LMH cell surface binding. Some runs of cell growth
proved difficult in maintaining properly functioning attachment factor in each flask, so
it is important to ensure this full incubation time is achieved. The flasks were
removed from the 4 degree Celsius refrigerator and the attachment factor (AF)
removed. Then,10 mL of Waymouth’s Media. complete with 1% FBS or 150 mL
added per container of Waymouth’s was added to each of the flasks and the flasks
were stored at 37 °C, 5% CO2 for 15 minutes. Next, 2.5mL of frozen LMH cells were
taken and poured into the prewar med media of the gelatinated flask and placed in 37
°C, 5% CO2 for storage. In order to maintain the cells, media was changed as needed
every 2-3 days using 10 mL complete Waymouth’s solution. After approximately 1-
1.5 weeks of growth, the LMH cells were split.
In order to split the LMH cells, four new flasks treated with AF had to first be
prepared as previously done to make room for new cell growth. Then, from the flask
containing fully grown LMH cells, the old media was first removed. 5 mL 1X trypsin
was then added and the flask rocked for 1 minute before discarding the trypsin
solution. Again, 5 mL of fresh 1X trypsin was added and the flask kept at 37 °C, 5%
CO2 for 5 minutes before removing from the incubator and rocking to detach all cells.
5 mL of media was then added to the flask and 2.5 mL of the newly formed solution
was taken and added to each of the four newly prepared LMH cell growth flasks.
These flasks were all stored at 37 °C, 5% CO2 and had their media changed as needed
every 2-3 days, followed by cell splitting as needed every week or so. Please note the
extreme importance in ensuring at least two different flasks of Waymouth’s solution

24
are used to avoid complete experiment contamination. Also ensure that gloves are
changed regularly, the hood of use is UV sterilized for a minimum of 15 minutes
before use, and that all things being placed into the hood are sprayed with 70% ethanol
beforehand. Such steps will help reduce risk of contaminating cells.
Other future studies remaining include LMH growth, splitting, and urea
assaying in which baseline urea assays may be taken for various LMH cell colonies
followed by introduction of cloned NAGS (and possibly CPSI depending on transit
peptide existence) and further urea assay analysis. Depending on any expected urea
production increase, a fusion protein experiment could then be carried out to explore
NAGS interaction through the urea cycle as well as CPSI activities. Such research
would certainly provide further information on the evolutionary purposes of urea cycle
maintenance.
Genomicus Gene Search of CPSI and NAGS
Further research using Genomicus v66.01 was performed investigating the
presence of any syntanic relationships surrounding CPSI across similar species as well
as for enzyme NAGS. Knowing that syntanic relationships have tendencies of
conservation across similar species, noting the presence or absence of such
relationships for CPSI would hopefully provide support that we were indeed studying
the proper, existing urea cycle enzyme. Similarly, further study of the NAGS locus
aimed to reveal evolutionary relationships among various species, providing for a
better understanding of the proposed elimination of NAGS from the poultry genome.

25
Chapter 3
GENE EXPRESSION OF UREA CYCLE ENZYMES
Results/Discussion
RPKM studies of urea cycle enzymes
Using the BIGBIRD database to explore the urea cycle enzymes rpkm
values—reads per kilobase of model, or the number of transcripts per million
transcripts of sample per kilobase (14)—it was found that there was zero NAGS
expression, a small amount of CPSI expression in the duodenum and kidney, a very
scarce amount of OTC expression in the liver, a high amount of ASS expression in the
liver, ileum, and kidney, and then a small amount of expression in ARG1 in the liver.
These results can be found in Table 3, which presents the rpkm values for those tissues
representing some of the highest levels of expression. These same tissues, liver,
duodenum, and intestinal, were all selected for use in the PCR reactions of this
experiment.

26
Table 3 Enzyme expression levels as per BigBird database libraries
Enzyme GeneID Chromosome Rpkm animal tissue
CPS1 428994 7 .93 Gallus Liver
OTC 395735 1 0 Gallus Liver
426115 1.54 Gallus Liver
ASS1 417185 17 47.77 Gallus Liver
280726 11 133.328 Gallus Ileum
648.702 Gallus Kidney
ASL1 396498 19 9.51 Gallus Duodenum
ASL2 417545 19 38.56 Gallus Liver
PCR of urea cycle enzymes
Using the purified PCR product along with the newly produced IOWA cDNA
samples, PCR was performed once more on the CPSI, Raf, and BRaf primers, but no
further products were formed. Yet another duodenal RNA was used to produce cDNA
but it too failed to yield any useable PCR products and so a new approach was taken.
In each case, it was clear that the primers were working and present based on
the PCR gels performed. However, upon initial real-time qRT-PCR analysis, the
expression levels seemed to be extremely low. The values attained are all presented in
Table 4, which provides the sample enzyme, number of samples made, number of
samples that yielded detectable results, the average count, standard deviation of counts
attained, and the melting temperature of the primers used. Further qPCR trials also
supported the idea that the enzymes were indeed present, but had extremely low levels
of expression. These results are also provided in the tables below. As a result, it was
expected that any assaying experimentation performed would not yield a significant
result. Therefore, a new approach was taken in which phylogenetic trees were

27
designed to take a closer look at the evolutionary process behind each urea cycle
enzyme.
Table 4 qPCR results for cDNA ROSSDuod [10 ng/µL]
Sample #samples (determined)
Average Count
st.dev count
Tm (primer)
CPSI 3 (0) x x 56.2
OTC 3(2) 3.43477 0.120986 55.8
ARG2 3(1) 24.9068 x 558
ALS2 3(1) 3.34468 x 55.8
ALS1 3(1) 3.88888 x 55.8
ASL1 3(3) 3.082757 0.408014 55.8
ASS1 3(1) 3.3547 0.1372 55.8
Table 5 qPCR results for cDNA N3CELC (normal tissue)
Sample #samples(determined) count st.dev count Tm(primer)
CPS1 3(3) 30.549 0.3501 76.367
ALS2 3(0) x x 56
ASL2 3(1) 30.178 x 62,7
ASL1 3(3) 28.762 0.1546 79.3
ASS1 3(3) 28.977 0.0848 80
Table 6 qPCR results for HS4CELC (heat stress tissue)
Sample #samples(determined) count st.dev count
Tm (primer)
CPS1 3(3) 30.252 0.8279 76.933
ALS2 3(1) 28.796 x 63.167
ASL2 3(1) 30.925 x 62.833
ASL1 3(3) 29.2595 0.023271 80
ASS1 3(3) 29.1922 0.04977 80

28
Table 7 qPCR results for Normal [9.9 ng/µL] (top) and Heat Shock [10.2 ng/µL]
(bottom)
Sample #samples(determined) count st.dev count
Tm (primer)
OTC 3(3) 35.232 0.2477 71.767
ARG2 3(1) 25.2496 x 76.7333
Sample #samples(determined) count st.dev count
Tm (primer)
OTC 3(3) 35.909 0.2591 74.167
ARG2 3(3) 24.3541 0.31555 75.5667
Conclusion
As previously discussed, a series of evolutionary steps allowing poultry to
transfer from aquatic to terrestrial living environments has led to the uricotelic
preference of poultry, rendering the urea cycle inactive. A lack of urea production
would seemingly imply that there is an absence of the necessary mechanisms for urea
production, but studies have shown that all urea cycle enzymes aside from NAGS are
present in the poultry genome. Exploration of the BigBird database RNA libraries
created by the workers of Dr. Schmidt’s lab has further shown a small amount of
activity of CPSI, OTC, ASS and ASL, but not NAG or ARG, supporting the
hypothesis that selection against NAGS led to the inability to activate CPSI and
therefore halted the functioning of the urea cycle. Supporting evidence of the
inactivity of the urea cycle enzymes has also been presented by a few qPCR runs
yielding extremely low expression levels for the urea cycle enzyme primers described.

29
Chapter 4
PROTEIN ALIGNMENT OF HUMAN, RAT, AND CHICKEN CPSI
Results/Discussion
Specific alignment and modeling of this CPSI enzyme revealed an identical
allosteric activator binding site in the rat, human, and chicken protein sequences. The
TRP1410, GLN413, and PHE1445 were also present in all three sequences, indicating
the preservation of the NAG binding site identified in Pekkala’s study (16). This can
be seen in Figure 3 below, with the allosteric site highlighted in green and the three
markers in gray text.
Figure 3 Preservation of the NAG binding site as per Pekkala’s work. Note the
perfect conservation of these residues across Rats (top row), Humans
(middle row), and Poultry (bottom row).
During inspection of the CPSI sequence, it was noted that a transit peptide was
missing when compared to Human and Rat CPSI. This implies that the transit peptide

30
is missing. This transit peptide is essential for CPSI to enter the mitochondria, thus
blocking production of carbamoyl phosphate and eliminating urea production. Figure
4 depicts the missing transit peptide sequence, highlighting the transit peptides of rats
and humans in gray. While it appears that this transit peptide is truly missing, later
studies performed suggest this may also be an error in the sequence provided.
Figure 4 Missing transit peptide in poultry
Conclusion
Further bioinformatics studies exploring the structures of Rat, Human, and
poultry CPSI showed that the NAG binding site was indeed preserved, but also
revealed a potentially missing transit peptide in the CPSI sequence. Without this
transit peptide, CPSI would not be able to enter the mitochondria for activation of the
urea cycle. Still, a quick search of the zebra finch and turkey CPSI sequences shows
the transit peptide is not missing in their sequences, leading to the belief that this
suggested missing transit peptide in poultry CPSI is actually a sequencing error.
This lack of urea cycle functioning coincides with the label of arginine as an
essential amino acid in the poultry diet and further explains the lack of ARG

31
functioning to break down arginine into urea. Time constraints prevented the intended
cloning of NAG and proper CPSI, but future cloning experimentation could provide
significant information on the interactions and functioning on urea cycle enzymes.

32
Chapter 5
PHYLOGENETIC TREE PRODUCTION OF UREA CYCLE ENZYMES
Results/Discussion
Phylogenetic trees for all components of the urea cycle were generated using
the EMBL-EBI-ClustalW2 system. For this analysis we chose representative gene
products from the species available as previously listed in Table 2.
Inactivation of CPSI Enzymatic Activity
If the sole function of the CPSI gene was to encode CPSI protein with
enzymatic activity then it would be predicted that loss of urea cycle functioning, and
thus reduction in enzymatic activity of CPSI, would relax evolutionary constraints of
the gene sequence. Consistent with the natural theory of evolution, the CPSI gene in
birds would then evolve faster than other genes that encode the urea cycle enzymes.
However, inspection of phylogenetic trees indicates that the chicken CPSI is not
evolving at a faster rate than other urea cycle gene products. This suggests that,
despite the loss of activity, the chicken CPSI gene is still under evolutionary
constraint.
One interesting occurrence experienced in the process of producing the
phylogenetic tree of CPSI was the presence of both a large and small subunit of e-coli.
While the small subunit was left out of the tree for sequence-size similarity purposes,
it is important to note that literature has described the presence of two different
subunits interacting with one another in the early forms of CPSI (17). It wasn’t until

33
later down the evolutionary line that these subunits combined into present CPSI forms.
Another interesting observation was made in regards to ASLI and ASLII. Locating
ASLI and II on the evolutionary trees, it was observed that the two different enzymes
were located directly next to each other on the tree for rats, humans, and poultry. This
lack of distance between the enzymes reveals their homologous relationship, showing
that ASLI and II are, indeed, functionally the same. To view and compare these
evolutionary trees, see Appendix B. Also, to view and compare the various distances
involved in each phylogenetic tree, see Appendix C.
Conclusion
In evolutionary terms, observations from phylogenetic trees designed for each
urea cycle enzyme lead to the deduction that urea cycle enzymes have been evolving
together as a whole, experiencing just a few inactivation mutations along the way,
rendering the cycle dysfunctional.

34
Chapter 6
RAF PCR PRODUCT CLONING
Results/Discussion
An effort was made to perform Raf cloning as a means of introducing Raf into
a cell-line of poultry cells to observe any potential interactions of this enzyme with
urea cycle enzymes—CPSI specifically. In order to ensure experimental results were
not affected by the potentially missing transit peptide described earlier, two different
primer sets were created for CPSI. While PCR was performed involving both BRaf
and Raf along with two forms of CPSI primer sets, most attempts yielded zero
product. Figure 5 portrays the one and only PCR result that seemingly had Raf
product. However, upon purification, bacterial plate growth, and the TOPO TA
cloning methods described previously, the cloning process remained unsuccessful.

35
a. b.
Figure 5 PCR gel results for CPSRafPCR 1/10/12 (left) and CPSRafPCR2,3
1/11/12. Figure (a) top to bottom: CPS1a, CPS1b, Raf, B-Raf. Figure b
top to bottom: CPS1a, CPS1b, Raf, B-Raf using 10ng H2CELC; CPS1a,
CPS1b, Raf using D2duod4778, then B-Raf using D14Duod4947, 1kb
DNA ladder. Note in figure (a) the lack of any significant PCR product
compared to the base ladder versus the Raf products shown in Figure (b).
An attempt was made to clone the Raf products but no desirable colonies were
obtained. Furthermore, upon product purification and latter PCR checking, no product
was recovered. This is shown in Figure 6.

36
a. b.
Figure 6 PCR gel results for CPSRafPCR4 1/13/12 (left) RafcDNA198/196
1/26/12. Figure (a) top to bottom: CPSa, CPSb, B-Raf using D14 Duod
4947. Figure (b) top to bottom: Raf from IOWA198 heat-stressed
poultry sample cDNA, Raf from IOWA196 normal cDNA, 1kb DNA
ladder, purified Raf from D2Duod4778. Note the supposed Raf product
from poultry numbers 196 and 198 versus the lack of actual Raf in the
purified product from PCR using D2Duod4778.
The Raf products then obtained using IOWA198 heat-stressed poultry sample
RNA and IOWA196 normal poultry sample RNA were further used in another attempt
at cloning. Once again, no useful cloned colonies were attained. A final attempt was
made to gain purposeful Raf product in which a spread of various poultry tissue RNA
was used but still no product was yielded (Figure 7). Subsequently, due to time
constraint, the decision was made to move on to a different approach of performing
urea assays on LMH cells. While Raf cloning results were unattainable to-date, future
repeat experimentation could lead to potentially valuable information related to Raf-
CPSI interactions.

37
a. b.
Figure 7 PCR gel results for Rafspread 1/31/12 (left) and Rafspread part 2 2/5/12
(right). Figure (a) top to bottom: LMH cDNA combo, 653VLL Ross
w7cDNA, cDNA198, cDNA 196, 1kb ladder. Figure (b) top to bottom:
dilutions of cDNA 4932 starting from 100µL, 9µL, .9µL and then two
wells of 1kb ladder. No useful products were attained for any of the
cDNA types utilized.
Conclusion
Still, curiosity about the interactions between Raf and CPSI and the potentially
alternative function of this urea cycle enzyme existence led to multiple Raf cloning
attempts. While positive results have yet to be attained, the successful Raf cloning
and CPSI-Raf interaction studies could serve extremely useful in future explanations
of urea cycle enzyme maintenance in the poultry genome.

38
Chapter 7
GENOMICUS OF CPSI AND NAGS
Results/Discussion
Genomicus v66.01 was utilized in the investigation of any potential syntanic
relationships involving CPSI among various species. Looking at Figure 8, it is clear
that CPSI (lime green) is well conserved, locked in synteny with its surrounding
region of enzymes, supporting the belief that we are indeed, correct in our hypothesis
that CPSI is real and present in the poultry genome.
Figure 8 Genomicus representation of CPSI in various organisms
Furthermore, the Genomicus study of NAGS (lime green) in Figure 9 showed
how NAGS is conserved all the way to the anole, where NAGS first disappears from

39
the genomic arrangement. Following the evolutionary progression, an increasing
trend of rearrangement and loss of enzyme conservation is seen as each sequence
approaches the poultry genome. This helps support the idea that either NAGS is
actually missing from the poultry genome, or there has been some sequencing error. It
is also important to note that the deletion of the NAGS locus is seen in both lizards
(anole) as well as in birds, proposing that not only are poultry and lizards more closely
related than poultry and humans, but that a deletion must have occurred basal to the
divergence of lizards and birds, resulting in loss of the urea cycle. These conclusions
coincide with the evolutionary diagram shown in Figure 2 of the introduction, which
shows the relations between various organisms and proposed urea cycle deletions
through evolution.
Figure 9 Genomicus representation of NAGS in various organisms

40
Conclusion
Using the Genomicus gene search it appears that the CPSI chromosomal region
is conserved in poultry while the NAGS chromosomal region is not. The CPSI
syntanic relations tend to be conserved across similar species, showing similar regions
having less rearrangement in the genome. However, when looking at NAGs it appears
that the locus has been deleted in both birds and lizards and that regions of the genome
are much more scattered surrounding the areas where NAGS would be in the genome.
This strongly corresponds with the hypothesis that, by selecting against NAG
production, the urea cycle ceased function, enabling the laying of land-based and hard-
shelled eggs.

41
REFERENCES
1. Yuryev, Anton, and Wennogle, Lawrence P. “Novel Raf kinase protein-
protein interactions found by an exhaustive yeast two-hybrid analysis”.
Genomics. 81 (2003), 112-125.
2. Mora, J., et.al. “The Regulation of Urea-Biosynthesis Enzymes in
Vertebrates”. Biochem. J. (1965) 96, 28-35.
3. Shimogiri, Takeshi, et.al. “Assignment of CPSI, OTC, CRYD2, ARG2
and ASS Genes to the Chicken RH Map”. Genet. Sel. Evol. 36 (2004),
593-599.
4. Tamir, Hadassah, and Ratner, S. “A Study of Ornithine, Citrulline and
Arginine Synthesis in Growing Chicks”. Archives of Biochemistry and
Biophysics. 102 (1963), 250-269.
5. Khajali, F., and Wideman, R.F. “Dietary Arginine: Metabolic,
Environmental, Immunological and Physiological Interrelationships”.
World’s Poultry Science Association 2010. World’s Poultry Science
Journal. 66 (Dec. 2010), 751-756.
6. Smith, G.H, and Lewis, D., “Arginine in Poultry Nutrition”. Brit. J. Nutr.
17 (1963), 433-444.
7. Caldovic, Ljubica, and Tuchman, Mendel. “N-Acetylglutamate and its
Changing Role Through Evolution”. Biochem. J. (2003), 279-290.
8. Haskins, Nantaporn, et.al. “Inversion of Allosteric Effect of Arginine on
N-acetyl glutamate Synthase, a Molecular marker for Evolution of
Tetrapods”. BMC Biochemistry. (2008), 9-24.
9. Brown, G.W. and Cohen, P.P. “Comparative Biochemistry of Urea
Synthesis: 3. Activities of Urea-cycle Enzymes in Various Higher and
Lower Vertebrates”. Biochem. J. 75 (1960), 82-91.
10. Klose, A.A., and Almquist, H.J. “The Ability of Citruline to Replace
Arginine in the Diet of the Chick”. Division of Poultry Husbandry,
College of Agriculture, University of California, Berkeley. J. Biol. Chem.
135 (1940), 153-155.

42
11. Tamir, Hadassah, and Ratner, S. “Enzymes of Arginine Metabolism in
Chicks”. Archives of Biochemistry and Biophysics. 102 (1963), 249-258.
12. Tujioka, Kazuyo, et.al. “Role of N-Acetylglutamate Concentration and
Ornithine Transport into Mitochondria in Urea Synthesis of Rats Given
Proteins of Different Quality”. Journal of Agricultural and Food
Chemistry. 50 (2002), 7467-7471.
13. UniProtKB. <www.uniprot.org/help/sequence-alignments> November
2011-April 2012.
14. 18.14.4.3 Definition of RPKM. CLCBio.
<http://www.clcbio.com/manual/genomics/Definition_RPKM.html>
February 2012.
15. ClustalW2-Multiple Sequence Alignment. EMBL-EBI.
<http://www.ebi.ac.uk/Tools/msa/clustalw2/> November 2011-April 2012.
16. Pekkala, et.al. “structural insight on the control of urea synthesis:
identification of the binding site for N-acetyl-L-glutamate, the essential
allosteric activator of mitochondrial carbamoyl phosphate synthetase”.
Biochem J. (2009) 424, 211-220. Great Britain, 2009.
17. Summar, M.L, et.al. “Characterization of Genomic Structure and
Polymorphisms in the Human Carbamyl Phosphate Synthetase I Gene”.
GENE 311 (2003) 51-57.

43
BIBLIOGRAPHY
1. Anderson, Paul M. “Urea and Glutamine Synthesis: Environmental
Influences on Nitrogen Excretion”. Fish Physiology, 20. (2001) Academic
Press. 240-277.
2. Britton, H. G., et al. "A Structure-Reactivity Study of the Binding of
Acetylglutamate to Carbamoyl Phosphate Synthetase I." European journal
of biochemistry / FEBS 188.1 (1990): 47-53. Print.
3. Britton, H. G., and V. Rubio. "Carbamoyl-Phosphate Synthetase I. Kinetics
of Binding and Dissociation of Acetylglutamate and of Activation and
Deactivation." European journal of biochemistry / FEBS 171.3 (1988):
615-22. Print.
4. Caldovic, Ljubica, et.al. “N-acetylglutamate synthase; Structure, Function,
and Defects”. Molecular Genetics and Metabolism, 100. (2010) 513-519.
5. Caldovic, Ljubica, et.al. “Cloning and Expression of the human N-
acetylglutamate Synthase Gene”. Biochemical and Biophysical Research
Communications, 299. (2002) 581-586.
6. “CPSI”. Genetics home Reference. U.S. National Library of Medicine.
May 22, 2011. <http://ghr.nlm.nih.gov/gene=CPS1>
7. Gregory, Ryan T. “Understanding Evolutionary Trees”. Original
Science/Evolution Review. Evo Edu Outreach, 1. (2008) 121-137.
8. Ip, Y.K, et. al. “Five Tropical Air-Breathing Fishes, Six Different
Strategies to Defend against Ammonia Toxicity on Land”. Chicago
Journals. Physiological and Biochemical Zoology, 77. (2004) 768-782.
9. Kothe, M., et al. "Direct Demonstration of Carbamoyl Phosphate
Formation on the C-Terminal Domain of Carbamoyl Phosphate
Synthetase." Protein science : a publication of the Protein Society 14.1
(2005): 37-44. Print.
44
10. Laberge, Tammy; Walsh, Patrick J. “Phylogenetic Aspects of Carbamoyl
Phosphate Synthetase in Lungfish: A Transitional Enzyme in Transitional
Fishes. Comparitive Biochemistry and Physiology, Part D. 6 (2011) 187-
194.
11. Martinez-Ramon, A., et al. "Levels of Carbamoyl Phosphate Synthetase I
in Livers of Young and Old Rats Assessed by Activity and Immunoassays
and by Electron Microscopic Immunogold Procedures." The journal of
histochemistry and cytochemistry : official journal of the Histochemistry
Society 38.3 (1990): 371-6. Print.
12. Nakagawa, T., and L. Guarente. "Urea Cycle Regulation by Mitochondrial
Sirtuin, SIRT5." Aging 1.6 (2009): 578-81. Print.
13. Nakagawa, T., et al. "SIRT5 Deacetylates Carbamoyl Phosphate
Synthetase 1 and Regulates the Urea Cycle." Cell 137.3 (2009): 560-70.
Print.
14. Shigesada, Katysuya and Tatibana, Masamiti Tatibana. “Role of
Acetylglutamate in Ureotelism”. Journal of Biological Chemistry, 246.
(1971) 5588-5595.
15. Takagi, M., et al. "Changes of Activity and mRNA Expression of Urea
Cycle Enzymes in the Liver of Developing Holstein Calves." Journal of
animal science 86.7 (2008): 1526-32. Print.
16. Thoden, J. B., et al. "Long-Range Allosteric Transitions in Carbamoyl
Phosphate Synthetase." Protein science : a publication of the Protein
Society 13.9 (2004): 2398-405. Print.
17. Wen-Hsiung, Li, et.al. “Pseudogenes as a real Paradigm of Neutral
Evolution”. Nature, 292. (1981) 237-239.
18. Gregory, Ryan T. “Understanding Evolutionary Trees”. Evo Edu
Outreach, 1. (2008) 121-137.
45
Appendix A
The Urea Cycle
Figure 10 The Urea Cycle

46
Appendix B
Phylogenetic Tree Images
Figure 11 CPSI

47
Figure 12 OTC

48
Figure 13 ARG2 (normal)

49
Figure 14 ARG2 (agmatase)

50
Figure 15 ASL (normal)
51
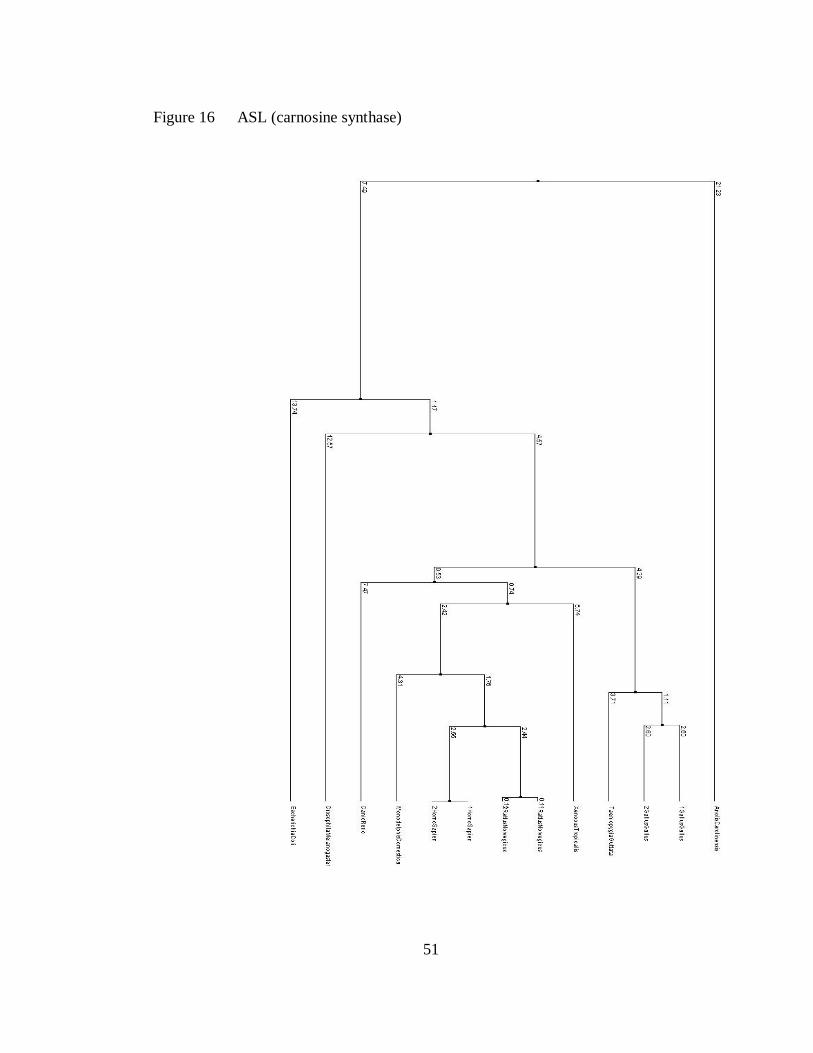
Figure 16 ASL (carnosine synthase)

52
Figure 17 ASSI

53
Appendix C
Phylogenetic Tree Distance Tables
Table 8 CPSI
po
ult
ry
rat
hu
man
op
po
ssu
m
pla
typ
us
zeb
ra f
inch
eco
li
xen
op
us
zeb
ra f
ish
ano
le
dro
sop
hila
Poultry x x x x x x x x x x x
Rat 7.93 x x x x x x x x x x
Human 7.93 1.9 x x x x x x x x x
Opposum 7.93 2.96 2.96 x x x x x x x x
platypus 7.93 2.96 2.96 2.73 x x x x x x x
zebra finch 3.75 7.93 7.93 7.93 7.93 x x x x x x
ecoli 16.93 16.93 16.93 16.93 16.93 16.93 x x x x x
xenopus 8.71 8.71 8.71 8.71 8.71 8.71 16.93 x x x x
zebra fish 9.86 9.86 9.86 9.86 9.86 9.86 16.93 9.86 x x x
anole 8.3 8.3 8.3 8.3 8.3 8.3 16.93 8.71 9.86 x x
drosophila 9.86 9.86 9.86 9.86 9.86 9.86 16.93 9.86 8.26 9.86 x

54
Table 9 OTC
po
ult
ry
rat
hu
man
op
po
ssu
m
pla
typ
us
zeb
ra f
inch
eco
li
xen
op
us
zeb
ra f
ish
ano
le
dro
sop
hila
Poultry x x x x x x x x x x x
Rat 11.79 x x x x x x x x x x
Human 11.79 3.82 x x x x x x x x x
Opposum 11.79 7.54 7.54 x x x x x x x x
platypus 11.79 6.91 6.91 7.54 x x x x x x x
zebra finch - - - - - x x x x x x
ecoli 25.07 25.07 25.07 25.07 25.07 - x x x x x
xenopus 11.79 10.72 10.72 10.72 10.72 - 25.07 x x x x
zebra fish 15.38 15.38 15.38 15.38 15.38 - 25.07 15.38 x x x
anole 12.54 12.54 12.54 12.54 12.54 - 25.07 12.54 15.38 x x
drosophila - - - - - - - - - - x
Table 10 ARG2 (normal)
po
ult
ry
rat
hu
man
op
po
ssu
m
pla
typ
us
zeb
ra f
inch
eco
li
xen
op
us
zeb
ra f
ish
ano
le
dro
soph
ila
Poultry x x x x x x x x x x x
Rat 11.16 x x x x x x x x x x
Human 11.16 8.86 x x x x x x x x x
Opposum 11.16 8.86 7.63 x x x x x x x x
platypus 8.62 11.16 11.16 11.16 x x x x x x x
zebra finch 4.09 11.16 11.16 11.16 8.62 x x x x x x
ecoli - - - - - - x x x x x
xenopus 17.49 17.49 17.49 17.49 17.49 17.49 - x x x x
zebra fish 15.78 15.78 15.78 15.78 15.78 15.78 - 17.49 x x x
anole 8.62 11.16 11.16 15.78 4.36 8.62 - 17.49 15.78 x x
drosophila 25.98 25.98 25.98 25.98 25.98 25.98 25.98 25.98 25.98 25.98 x

55
Table 11 ARG2 (agmatase)
p
ou
ltry
rat
hu
man
op
po
ssu
m
pla
typ
us
zeb
ra f
inch
eco
li
xen
op
us
zeb
ra f
ish
ano
le
dro
soph
ila
Poultry x x x x x x x x x x x
Rat 11.04 x x x x x x x x x x
Human 11.04 8.76 x x x x x x x x x
Opposum 11.04 8.76 7.55 x x x x x x x x
platypus 8.52 11.04 11.04 11.04 x x x x x x x
zebra finch 4.04 15.61 11.04 11.04
x x x x x x
ecoli 27.95 27.95 27.95 27.95 27.95 27.95 x x x x x
xenopus 17.3 17.3 17.3 17.3 17.3 17.3 27.95 x x x x
zebra fish 15.61 15.61 15.61 15.61 15.61 15.61 27.95 17.3 x x x
anole 8.52 11.04 11.04 11.04 4.31 8.52 27.95 17.3 15.61 x x
drosophila 25.7 25.7 25.7 25.7 25.7 25.7 27.95 25.7 25.7 25.7 x
Table 12 ASL (normal)
po
ult
ry
rat
hu
man
op
po
ssu
m
pla
typ
us
zeb
ra
fin
ch
eco
li
xen
op
us
zeb
ra f
ish
ano
le
dro
sop
hila
Poultry 4.75 x x x x x x x x x x
Rat 14.62 0.2 x x x x x x x x x
Human 14.62 4.65 0 x x x x x x x x
Opposum 14.62 7.87 7.87 x x x x x x x x
platypus - - - - x x x x x x x
zebra finch 6.78 14.62 14.62 14.62 - x x x x x x
ecoli 26.09 26.09 26.09 26.09 - 26.09 x x x x x
xenopus 14.62 12.3 12.3 12.3 - 14.62 26.09 x x x x
zebra fish 14.62 13.65 13.65 13.65 - 14.62 26.09 13.65 x x x
anole - - - - - - - - - x x
drosophila 22.95 22.95 22.95 22.95 - 22.95 26.09 22.95 22.95 - x

56
Table 13 ASL (carnosine)
po
ult
ry
rat
hu
man
op
po
ssu
m
pla
typ
us
zeb
ra
fin
ch
eco
li
xen
op
us
zeb
ra f
ish
ano
le
dro
sop
hila
Poultry 2.6 x x x x x x x x x x
Rat 8 0.11 x x x x x x x x x
Human 8 2.55 0 x x x x x x x x
Opposum 8 4.31 4.31 x x x x x x x x
platypus - - - - x x x x x x x
zebra finch 3.71 8 8 8 - x x x x x x
ecoli 13.74 13.74 13.74 13.74 - 13.74 x x x x x
xenopus 8 6.73 6.73 6.73 - 8
x x x x
zebra fish 8 7.47 7.47 7.47 - 8
x x x
anole 21.23 21.23 21.23 21.23 - 21.23 21.23 21.23 21.23 x x
drosophila 12.57 12.57 12.57 12.57 - 12.57 12.57 12.57 12.57 21.23 x
Table 14 ASSI
po
ult
ry
rat
hu
man
op
po
ssu
m
pla
typ
us
zeb
ra
fin
ch
eco
li
xen
op
us
zeb
ra f
ish
ano
le
dro
sop
hila
Poultry x x x x x x x x x x x
Rat 9.61 x x x x x x x x x x
Human 9.61 1.06 x x x x x x x x x
Opposum 9.61 2.75 2.75 x x x x x x x x
platypus - - - - x x x x x x x
zebra finch - - - - - x x x x x x
ecoli 32.34 32.34 32.34 32.34 - - x x x x x
xenopus 9.61 8.65 8.65 8.65 - - 32.34 x x x x
zebra fish 10.49 10.49 10.49 10.49 - - 32.34 10.49 x x x
anole - - - - - - 32.34 - - x x
drosophila 19.54 19.54 19.54 19.54 - - 32.34 19.54 19.54 - x

57
Appendix D
Sequence Accession Numbers
Table 15 Accession Numbers for All Sequences Utilized
Enzyme Symbol Organism Reference
Number
Carbamoyl phosphate Synthase
I
CPSI Gallus gallus F1N9P0
(tree)
113951670
(Raf
experiments)
CPSI Homo sapien P31327
CPSI Rattus norvegicus P07756
Monodelphis domestica F7FS26
Ornithorhynchus anatinus 345306951
Taeniopygia guttata 224056010
Eschericha coli 312944639
Xenopus tropicalis B2GU38
Danio rerio F6PBT6
Anolis carolinenss G1KK90
Drosophila melanogaster 4337094
Ornithine Transcarbamylase OTC Gallus gallus 46048857
Homo sapien P00480
Rattus norvegicus P00481
Monodelphis domestica F6UHY3
Ornithorhynchus anatinus F6QRP1
Taeniopygia guttata -
Eschericha coli 129264
Xenopus tropicalis Q6DJ41
Danio rerio E9QHD9
Anolis carolinenss G1KQ60
Drosophila melanogaster -
Arginosuccinate synthase ASS Gallus gallus 61657937
Homo sapien P00966

58
Rattus norvegicus P09034
Monodelphis domestica F7G4N7
Ornithorhynchus anatinus -
Taeniopygia guttata -
Eschericha coli 170082708
Xenopus tropicalis Q5M8Z6
Danio rerio Q66I24
Anolis carolinenss -
Drosophila melanogaster B3M0W9
Arginosuccinate Lyase I Gallus gallus 45382827
II Gallus gallus 270288808
Homo sapien E7EMI0
Homo sapien P04424
I Rattus norvegicus Q4QRB8
II Rattus norvegicus P20673
Monodelphis domestica 334324759
Ornithorhynchus anatinus -
Taeniopygia guttata 224076287
Eschericha coli 16131798
Xenopus tropicalis A9JTM9
Danio rerio Q7SY44
Carnosine Synthase Anolis carolinenss 327260538
Drosophila melanogaster Q960C6
Arginase Gallus gallus 340523133
Homo sapien P78540
Rattus norvegicus O08701
Monodelphis domestica F6Y7C7
Ornithorhynchus anatinus 345316653
Taeniopygia guttata 224051299
Agmatinase Eschericha coli 209760196
Xenopus tropicalis Q6DIU5
Danio rerio Q6PH54
Anolis carolinenss 327263953
Drosophila melanogaster 10728356
v-Raf murine sarcoma viral
oncogene homolog B1
BRaf Gallus gallus 45384285
v-Raf-1 murine leukemia viral
oncogene homolog 1
Raf1 Gallus gallus 45384313


