Practical Volatility and Correlation Modeling for
Financial Market Risk Management
Torben G. Andersena, Tim Bollerslevb,
Peter F. Christoffersenc and Francis X. Dieboldd
July 22, 2005
Abstract: Current industry practice largely follows one of two restrictive approaches to market
risk management: historical simulation or RiskMetrics. In contrast, exploiting recent
developments in financial econometrics we propose flexible methods which are likely to produce
more accurate assessments of market risk. Clearly, the demands of real-world risk management
in financial institutions – in particular, real-time risk tracking in very high-dimensional situations
– impose strict limits on model complexity. Hence we stress parsimonious models that are easily
estimated, and we discuss a variety of practical approaches for high-dimensional covariance
matrix modeling, along with what we see as some of the pitfalls and problems in current practice.
In so doing we hope to encourage further dialog between the academic and practitioner
communities and to stimulate the development of improved market risk management
technologies that draw on the best of both worlds.
_________________* This paper is prepared for Mark Carey and René Stulz (eds.), Risks of Financial Institutions, University of Chicago
Press for NBER. For helpful comments we would like to thank Ken Abbott, Casper de Vries, Philipp Hartmann, Patricia
Jackson, Jim O'Brien, Hashem Pesaran, and Pedro Santa-Clara. For research support, Andersen, Bollerslev and Diebold
thank the U.S. National Science Foundation, and Christoffersen thanks FQRSC, SSHRC and IFM2.
a Department of Finance, Kellogg School of Management, Northwestern University, Evanston, IL 60208, and NBER
phone: 847-467-1285, e-mail: [email protected]
b Department of Economics, Duke University, Durham, NC 27708, and NBER
phone: 919-660-1846, e-mail: [email protected]
c Faculty of Management, McGill University, Montreal, Quebec, H3A 1G5, and CIRANO
phone: 514-398-2869, e-mail: [email protected]
d Department of Economics, University of Pennsylvania, Philadelphia, PA 19104, and NBER
phone: 215-898-1507, e-mail: [email protected]
Andersen, T.G., Bollerslev, T., Christoffersen, P.F. and Diebold, F.X. (2006),"Practical Volatility and Correlation Modeling for Financial Market Risk Management,"
in M. Carey and R. Stultz (eds.),Risks of Financial Institutions, University of Chicago Press for NBER, 513-548.

About the Authors:
Torben G. Andersen is Nathan and Mary Sharp Distinguished Professor of Finance at the
Kellogg School of Management, Northwestern University, and a Research Associate at the
NBER.
Tim Bollerslev is Juanita and Clifton Kreps Professor of Economics, Duke University, Professor
of Finance at its Fuqua School of Business, and a Research Associate at the NBER.
Peter F. Christoffersen is Associate Professor of Finance at McGill University, and a Research
Fellow at CIRANO and CIREQ.
Francis X. Diebold is W.P. Carey Professor of Economics at the University of Pennsylvania,
Professor of Finance and Statistics at its Wharton School, and a Research Associate at the
NBER.
1. Introduction
It is now widely agreed that financial asset return volatilities and correlations (henceforth
“volatilities”) are time-varying, with persistent dynamics. This is true across assets, asset classes,
time periods, and countries. Moreover, asset return volatilities are central to finance, whether in
asset pricing, portfolio allocation, or market risk measurement. Hence the field of financial
econometrics devotes considerable attention to time-varying volatility and associated tools for its
measurement, modeling and forecasting.
In this chapter we suggest practical applications of recent developments in financial
econometrics dealing with time-varying volatility to the measurement and management of
market risk, stressing parsimonious models that are easily estimated. Our ultimate goal is to
stimulate dialog between the academic and practitioner communities, advancing best-practice
market risk measurement and management technologies by drawing upon the best of both
worlds. Three themes appear repeatedly, and so we highlight them here.
The first is the issue of aggregation level. We consider both aggregated (portfolio level)
and disaggregated (asset level) modeling, emphasizing the related distinction between risk
measurement and risk management, because risk measurement generally requires only a
portfolio-level model, whereas risk management requires an asset-level model. At the asset level,
the issue of dimensionality and dimensionality reduction arises repeatedly, and we devote
considerable attention to methods for tractable modeling of the very high-dimensional covariance
matrices of practical relevance.
The second theme concerns the use of low-frequency versus high-frequency data, and the
associated issue of parametric vs. nonparametric volatility measurement. We treat all cases, but
we emphasize the appeal of volatility measurement using nonparametric methods in conjunction
with high-frequency data, followed by modeling that is intentionally parametric.

2
The third theme relates to the issue of unconditional versus conditional risk measurement.
We argue that, for most financial risk management purposes, the conditional perspective is
exclusively relevant, notwithstanding, for example, the fact that popular approaches based on
historical simulation and extreme-value theory typically adopt an unconditional perspective. We
advocate, moreover, moving beyond a conditional volatility perspective to a full conditional
density perspective, and we discuss methods for constructing and evaluating full conditional
density forecasts.
We proceed systematically in several steps. In section 2, we consider portfolio level
analysis, directly modeling portfolio volatility using historical simulation, exponential
smoothing, and GARCH methods. In section 3, we consider asset level analysis, modeling asset
covariance matrices using exponential smoothing and multivariate GARCH methods, paying
special attention to dimensionality-reduction methods. In section 4, we explore the use of high-
frequency data for improved covariance matrix measurement and modeling, treating realized
variance and covariance, and again discussing procedures for dimensionality reduction. In section
5 we treat the construction of complete conditional density forecasts via simulation methods. We
conclude in section 6.
2. Portfolio Level Analysis: Modeling Portfolio Volatility
Portfolio risk measurement requires only a univariate portfolio-level model (e.g., Benson
and Zangari, 1997). In this section we discuss such univariate portfolio methods. In contrast,
active portfolio risk management, including VaR minimization and sensitivity analysis requires a
multivariate model, as we discuss subsequently in section 3.
In particular, portfolio level analysis is rarely done other than via historical simulation
(defined below). But we will argue that there is no reason why one cannot estimate a
parsimonious dynamic model for portfolio level returns. If interest centers on the distribution of
the portfolio returns, then this distribution can be modeled directly rather than via aggregation
based on a larger and almost inevitably less-well-specified multivariate model.
Berkowitz and O’Brien (2002) find evidence that existing bank risk models perform
poorly and are easily outperformed by a simple univariate GARCH model (defined below). Their
result is remarkable in that they estimate a GARCH model fit to the time series of actual
historical portfolio returns where the underlying asset weights are changing over time. Berkowitz
and O’Brien find that banks’ reported ex-ante Value-at-Risk (VaRs) forecasts are exceeded by
the ex post P/Ls on less than the predicted one percent of days. This apparent finding of risk
underestimation could however simply be due to the reported P/Ls being “dirty” in that they
contain non-risky income from fees, commissions and intraday trading profits.1 More seriously
though, Berkowitz and O’Brien find that the VaR violations which do occur tend to cluster in
time. Episodes such as the Fall 1998 Russia default and LTCM debacle set off a dramatic and
persistent increase in market volatility which bank models appear to largely ignore, or at least
react to with considerable delay. Such VaR violation clustering is evidence of a lack of

3
conditionality in bank VaR systems which in turn is a key theme in our discussion below.2
We first discuss the construction of historical portfolio values, which is a necessary
precursor to any portfolio-level VaR analysis. We then discuss direct computation of portfolio
VaR via historical simulation, exponential smoothing, and GARCH modeling.3
2.1 Constructing Historical Pseudo Portfolio Values
In principle it is easy to construct a time series of historical portfolio returns using current
portfolio holdings and historical asset returns:
. (1)rw,t
' jN
i'1
wi,T
ri,t/ W
)
T Rt, t'1,2, ... ,T
In practice, however, historical prices for the assets held today may not be available. Examples
where difficulties arise include derivatives, individual bonds with various maturities, private
equity, new public companies, merger companies and so on. For these cases “pseudo” historical
prices must be constructed using either pricing models, factor models or some ad hoc
considerations. The current assets without historical prices can for example be matched to
“similar” assets by capitalization, industry, leverage, and duration. Historical pseudo asset prices
and returns can then be constructed using the historical prices on these substitute assets.
2.2 Volatility via Historical Simulation
Banks often rely on VaRs from historical simulations (HS-VaR). In this case the VaR is
calculated as the 100p’th percentile or the (T+1)p’th order statistic of the set of pseudo returns
calculated in (1). We can write
, (2)HS&VaRp
T%1|T / rw((T%1)p)
where is taken from the set of ordered pseudo returns . Ifrw((T%1)p) r
w(1) , r
w(2) , ... ,r
w(T)
(T+1)p is not an integer value then the two adjacent observations can be interpolated to calculate
the VaR.
Historical simulation has some serious problems, which have been well-documented.
Perhaps most importantly, it does not properly incorporate conditionality into the VaR forecast.
The only source of dynamics in the HS-VaR is the fact that the sample window in (1) is updated
over time. However, this source of conditionality is minor in practice.4
Figure 1 illustrates the hidden dangers of HS as discussed by Pritsker (2001). We plot the
daily percentage loss on an S&P500 portfolio along with the 1% HS-VaR calculated from a 250
day moving window. The crash on October 19, 1987 dramatically increased market volatility;
4
however, the HS-VaR barely moves. Only after the second large drop which occurred on October
26 does the HS-VaR increase noticeably.
< Figure 1 about here >
This admittedly extreme example illustrates a key problem with the HS-VaR.
Mechanically, from equation (2) we see that HS-VaR changes significantly only if the
observations around the order statistic change significantly. When using a 250-dayrw((T%1)p)
moving window for a 1% HS-VaR, only the second and third smallest returns will matter for the
calculation. Including a crash in the sample, which now becomes the smallest return, may
therefore not change the HS-VaR very much if the new second smallest return is similar to the
previous one.
Moreover, the lack of a properly-defined conditional model in the HS methodology
implies that it does not allow for the construction of a term structure of VaR. Calculating a 1% 1-
day HS-VaR may be possible on a window of 250 observations, but calculating a 10-day 1%
VaR on 250 daily returns is not. Often the 1-day VaR is simply scaled by the square root of 10,
but this extrapolation is only valid under the assumption of i.i.d. normal daily returns. A
redeeming feature of the daily HS-VaR is exactly that it does not rely on an assumption of
normal returns, and the square root scaling therefore seems curious at best.
In order to further illustrate the lack of conditionality in the HS-VaR method consider
Figure 2. We first simulate daily portfolio returns from a mean-reverting volatility model and
then calculate the nominal 1% HS-VaR on these returns using a moving window of 250
observations. As the true portfolio return distribution is known, the true daily coverage of the
nominal 1% HS-VaR can be calculated using the return generating model. Figure 2 shows the
conditional coverage probability of the 1% HS-VaR over time. Notice from the figure how an
HS-VaR with a nominal coverage probability of 1% can have a true conditional probability as
high as 10%, even though the unconditional coverage is correctly calibrated at 1%. On any given
day the risk manager thinks that there is a 1% chance of getting a return worse than the HS-VaR
but in actuality there may as much as a 10% chance of exceeding the VaR. Figure 2 highlights
the potential benefit of conditional density modeling: The HS-VaR computes an essentially
unconditional VaR which on any given day can be terribly wrong. A conditional density model
will generate a dynamic VaR in an attempt to keep the conditional coverage rate at 1% on any
given day, thus creating a horizontal line in Figure 2.
< Figure 2 about here >
The above discussion also hints at a problem with the VaR risk measures itself. It does
not say anything about how large the expected loss will be on the days where the VaR is
exceeded. Other measures such as expected shortfall do, but VaR has emerged as the industry
risk measurement standard and we will focus on it here. The methods we will suggest below can,
however, equally well be used to calculate expected shortfall and other related risk measures.
5
2.3 Volatility via Exponential Smoothing
Although the HS-VaR methodology discussed above makes no explicit assumptions
about the distributional model generating the returns, the RiskMetrics (RM) filter/model instead
assumes a very tight parametric specification. One can begin to incorporate conditionality via
univariate portfolio-level exponential smoothing of squared portfolio returns, in precise parallel
to the exponential smoothing of individual return squares and cross products that underlies RM.
Still taking the portfolio-level pseudo returns from (1) as the data series of interest we can
define the portfolio-level RM variance as
, (3)σ2
t ' λσ2
t&1 % (1 & λ)r2
w , t&1
where the variance forecast for day t is constructed at the end of day t-1 using the square of the
return observed at the end of day t-1 as well as the variance on day t-1. In practice this recursion
can be initialized by setting the initial equal to the unconditional sample standard deviation,σ2
0
say .σ2
Note that back substitution in (3) yields an expression for the current smoothed value as
an exponentially weighted moving average of past squared returns:
σ2
t ' j4
j'0
njr
2
w, t&1&j ,
where Hence the name “exponential smoothing.”nj' (1&λ) λj .
Following RM, the VaR is simply calculated as
, (4)RM&VaRp
T%1|T / σT%1Φ
&1
p
where Φp-1 denotes the pth quantile in the standard normal distribution. Although the smoothing
parameter λ may in principle be calibrated to best fit the specific historical returns at hand,
following RM it is often simply fixed at 0.94 with daily returns. The implicit assumption of zero
mean and standard normal innovations therefore implies that no parameters need to be estimated.
The conditional variance for the k-day aggregate return in RM is simply
. (5)Var(rw,t%k
% rw,t%k&1
% ... %rw,t%1
*öt) / σ
2
t:t%k|t ' k σ2
t%1
The RM model can thus be thought of as a random walk model in variance. The lack of mean-
reversion in the RM variance model implies that the term structure of volatility is flat. Figure 3
illustrates the difference between the volatility term structure for the random walk RM model
versus a mean-reverting volatility model. Assuming a low current volatility, which is identical

6
across models, the mean-reverting model will display an upward sloping term structure of
volatility whereas the RM model will extrapolate the low current volatility across all horizons.
When taken this literally the RM model does not appear to be a prudent approach to volatility
modeling. The dangers of scaling the daily variance by k, as done in (5), are discussed further in
Diebold, Hickman, Inoue, and Schuermann (1998).
< Figure 3 about here >
2.4 Volatility via GARCH
The implausible temporal aggregation properties of the RM model which we discussed
above motivates us to introduce the general class of GARCH models which imply mean-
reversion and which contain the RM model as a special case.
First we specify the general univariate portfolio return process
. (6)rw,t
' µt% σ
tz
tz
t- i.i.d. E(z
t)'0 Var(z
t)'1
In the following we will assume that the mean is zero which is common in risk management, at
least when short horizons are considered. Although difficult to estimate with much accuracy in
practice, mean-dynamics could in principle easily be incorporated into the models discussed
below.
The simple symmetric GARCH(1,1) model introduced by Bollerslev (1986) is written as
. (7)σ2
t ' ω % αr2
w,t&1 % βσ2
t&1
Extensions to higher order models are straightforward, but for notational simplicity we will
concentrate on the (1,1) case here and throughout the chapter. Repeated substitution in (7)
readily yields,
,σ2
t 'ω
1&β% αj βj&1 r
2
t&j
so that the GARCH(1,1) process implies that current volatility is an exponentially weighted
moving average of past squared returns. Hence the GARCH(1,1) volatility measurement is
seemingly very similar to RM volatility measurement. There are crucial differences, however.
First, GARCH parameters, and hence ultimately GARCH volatility, are estimated using
rigorous statistical methods that facilitate probabilistic inference, in contrast to exponential
smoothing in which the parameter is set in an ad hoc fashion. Typically we estimate the vector of
GARCH parameters θ by maximizing the log likelihood function,

7
. (8)log L (θ ;rw,T
, ..., rw,1
) % & jT
t'1
log σ2
t (θ) & σ&2
t (θ) r2
w,t
Note that the assumption of conditional normality underlying the (quasi) likelihood function in
(8) is merely a matter of convenience. The conditional return distribution will generally be non-
normal, but it does not need to be: quasi MLE still produces consistent and asymptotically
normal parameter estimates. The log-likelihood optimization in (9) can only be done numerically.
However, GARCH models are parsimonious and specified directly in terms of univariate
portfolio returns, so that only a single numerical optimization needs to be performed.5
Second, the covariance stationary GARCH(1,1) process has dynamics that eventually
produce reversion in volatility to a constant long-run value, which enables interesting and
realistic forecasts. This contrasts sharply with the RM exponential smoothing approach. As is
well-known (e.g., Nerlove and Wage, 1964, Theil and Wage, 1964), exponential smoothing is
optimal if and only if squared returns follow a “random walk plus noise” model (a “local level”
model in the terminology of Harvey, 1989), in which case the minimum MSE forecast at any
horizon is simply the current smoothed value. The historical records of volatilities of numerous
assets (not to mention the fact that volatilities are bounded below by zero) suggest, however, that
volatilities are unlikely to follow random walks, and hence that the flat forecast function
associated with exponential smoothing is unrealistic and undesirable for volatility forecasting
purposes.
Let us elaborate. We can rewrite the GARCH(1,1) model in (7) as
, (9)σ2
t ' (1&α&β)σ2 % αr2
w,t&1 % βσ2
t&1
where denotes the long-run, or unconditional daily variance. Thisσ2 / ω/(1 & α & β )
representation shows that the GARCH forecast is constructed as an average of three elements.
Equivalently we can also write the model as
, (10)σ2
t ' σ2 % α (r2
w, t&1 & σ2) % β (σ2
t&1 & σ2)
which explicitly shows how the GARCH(1,1) model forecasts by making adjustments to the
current variance and the influence of the squared return around the long-run, or unconditional
variance. Finally, we can also write
,σ2
t ' σ2% (α%β) (σ2
t&1&σ2) % ασ
2
t&1 (z2
t&1&1)
where the last term on the right-hand-side on average is equal to zero. Hence, this shows how
the GARCH(1,1) forecasts by making adjustments around the long-run variance with variance
persistence governed by (α+β) and the (contemporaneous) volatility-of-volatility linked to the
level of volatility as well as the size of α.

8
The mean-reverting property of GARCH volatility forecasts has important implications
for the volatility term structure. To construct the volatility term structure corresponding to a
GARCH(1,1) model, we need the k-day ahead variance forecast, which is
. (11)σ2
t%k*t ' σ2 % (α % β )k&1 (σ2
t%1 & σ2 )
Assuming that the daily returns are serially uncorrelated, the variance of the k-day cumulative
returns, which we use to calculate the volatility term structure, is then
. (12)σ2
t:t%k|t ' kσ2 % (σ2
t%1 & σ2 ) (1 & (α % β )k ) (1 & α & β )&1
Compare this mean-reverting expression with the RM forecast in (5). In particular, note that the
speed of mean-reversion in the GARCH(1,1) model is governed by α+β. The mean-reverting line
in Figure 3 above is calculated from (12), normalizing by k and taking the square root to display
the graph in daily standard deviation units.
Third, the dynamics associated with the GARCH(1,1) model afford rich and intuitive
interpretations, and they are readily generalized to even richer specifications. To take one
important example, note that the dynamics may be enriched via higher-ordered specifications,
such as GARCH(2,2). Indeed, Engle and Lee (1999) show that the GARCH(2,2) is of particular
interest, because under certain parameter restrictions it implies a component structure obtained
by allowing for time variation in the long-run variance in (10),
, (13)σ2
t ' qt% α (r
2
w, t&1 & qt&1
) % β (σ2
t&1 & qt&1
)
with the long-run component, qt , modeled as a separate autoregressive process,
. (14)qt' ω % ρq
t&1% φ (r
2
w, t&1 & σ2
t&1 )
Many authors, including Gallant, Hsu and Tauchen (1999) and Alizadeh, Brandt and Diebold
(2002) have found evidence of component structure in volatility, suitable generalizations of
which can be shown to approximate long memory (e.g., Andersen and Bollerslev, 1997, and
Barndorff-Nielsen and Shephard, 2001), which is routinely found in asset return volatilities (e.g.,
Bollerslev and Mikkelsen, 1999).
To take a second example of the extensibility of GARCH models, note that all models
considered thus far imply symmetric response to positive vs. negative return shocks. However,
equity markets, and particularly equity indexes, often seem to display a strong asymmetry,
whereby a negative return boosts volatility by more than a positive return of the same absolute
magnitude. The GARCH model is readily generalized to capture this effect. In particular, the
asymmetric GJR GARCH(1,1) model of Glosten, Jagannathan and Runkle (1993) is simply
defined by

9
. (15)σ2
t ' ω % αr2
w, t&1 % γr2
w, t&1 1(rw,t&1
<0) % βσ2
t&1
Asymmetric response in the conventional direction thus occurs when .6γ>0
3. Asset Level Analysis: Modeling Asset Return Covariance Matrices
The discussion above focused on the specification of dynamic volatility models for the
aggregate portfolio return. These methods are well-suited to providing forecasts of portfolio-level
risk measures such as aggregate VaR. However they are less well-suited for providing input into
the active risk management process. If, for example, the risk manager wants to know the
sensitivity of the portfolio VaR to increases in stock market volatility and asset correlations,
which typically occur in times of market stress, then a multivariate model is needed. Active risk
management such as portfolio VaR minimization also requires a multivariate model, which
provides a forecast for the entire covariance matrix.7
Multivariate models are also better suited for calculating sensitivity risk measures to
answer questions such as: “If I add an additional 1,000 shares of IBM to my portfolio, how much
will my VaR increase?” Moreover, bank-wide VaR is made up of many desks with multiple
traders on each desk, and any sub-portfolio analysis is not possible with the aggregate portfolio-
based approach.8
In this section we therefore consider the specification of models for the full N-
dimensional conditional distribution of asset returns. Generalizing the expression in (6), we write
the multivariate model as
, (16)Rt' Ω
1/2
t Zt
Zt- i.i.d. E(Z
t)'0 Var(Z
t)' I
where we have again set the mean to zero and where I denotes the identity matrix. The N×N
matrix can be thought of as the square-root, or Cholesky decomposition, of the covarianceΩ1/2
t
matrix . This section will focus on specifying a dynamic model for this matrix, while sectionΩt
5 will suggest methods for specifying the distribution of the innovation vector Zt .
Constructing positive semidefinite (psd) covariance matrix forecasts, which ensures that
the portfolio variance is always non-negative, presents a key challenge below. The covariance
matrix will have ½N(N+1) distinct elements, but structure needs to be imposed to guarantee psd.
The practical issues involved in estimating the parameters guarding the dynamics for the
½N(N+1) elements are related and equally important. Although much of the academic literature
focuses on relatively small multivariate examples, in this section we will confine attention to
methods that are applicable even with N (relatively) large.
3.1 Covariance Matrices via Exponential Smoothing
The natural analogue to the RM variance dynamics in (3) assumes that the covariance
10
matrix dynamics are driven by the single parameter λ for all variances and covariance in : Ωt
. (17)Ωt' λΩ
t&1% (1 & λ)R
t&1R
)
t&1
The covariance matrix recursion may again be initialized by setting equal to the sampleΩ0
average coverage matrix.
The RM approach is clearly very restrictive, imposing the same degree of smoothness on
all elements of the estimated covariance matrix. Moreover, covariance matrix forecasts generated
by RM are in general suboptimal, for precisely the same reason as with the univariate RM
variance forecasts discussed earlier. If the multivariate RM approach has costs, it also has
benefits. In particular, the simple structure in (17) immediately guarantees that the estimated
covariance matrices are psd, as the outer product of the return vector must be psd unless some
assets are trivial linear combinations of others. Moreover, as long as the initial covariance matrix
is psd (which will necessarily be the case when we set equal to the sample average coverageΩ0
matrix as suggested above, so long as the sample size T is larger than the number of assets N),
RM covariance matrix forecasts will also be psd, because a sum of positive semi-definite
matrices is itself positive semi-definite.
3.2 Covariance Matrices via Multivariate GARCH
Although easily implemented, the RM approach (17) may be much too restrictive in many
cases. Hence we now consider multivariate GARCH models. The most general multivariate
GARCH(1,1) model is
, (18)vech (Ωt) ' vech (C) % Bvech (Ω
t&1) % Avech (R
t&1R
)
t&1)
where the vech (“vector half”) operator converts the unique upper triangular elements of a
symmetric matrix into a ½N(N+1)×1 column vector, and A and B are ½N(N+1)×½N(N+1)
matrices. Notice that in this general specification, each element of Ωt-1 may potentially affect
each element of Ωt , and similarly for the outer product of past returns, producing a serious
“curse-of-dimensionality” problem. In its most general form the GARCH(1,1) model (18) has a
total of 1/2N4 + N3 + N2 + 1/2N = O(N4) parameters. Hence, for example, for N=100 the model
has 51,010,050 parameters! Estimating this many free parameters is obviously infeasible. Note
also that without specifying more structure on the model there is no guarantee of positive
definiteness of the fitted or forecasted covariance matrices.
The dimensionality problem can be alleviated somewhat by replacing the constant term
via “variance targeting” as suggested by Engle and Mezrich (1996). Variance targeting forces the
model-implied unconditional covariance matrix to equal a pre-calculated estimate from the
simple sample average. This in turn avoids the cumbersome nonlinear estimation of the matrix of
constant terms which instead is computed from the other parameters as follows:

11
. (19)vech (C) ' (I & A & B) vech (1
Tj
T
t'1
RtR
)
t )
This is also very useful from a forecasting perspective, as small perturbations in A and B
sometimes result in large changes in the implied unconditional variance to which the long-run
forecasts converge. However, there are still too many parameters to be estimated simultaneously
in A and B in the general multivariate model when N is large.
More severe (and hence less palatable) restrictions may be imposed to achieve additional
parsimony, as for example with the “diagonal GARCH” pameterization proposed by Bollerslev,
Engle and Wooldridge (1988). In a diagonal GARCH model, the matrices A and B have zeros in
all off-diagonal elements, which in turn implies that each element of the covariance matrix
follows a simple dynamic with univariate flavor: conditional variances depend only on own lags
and own lagged squared returns, and conditional covariances depend only on own lags and own
lagged cross products of returns. Even the diagonal GARCH framework, however, results in
parameters to be jointly estimated, which is computationally infeasible in systems ofO(N 2)
medium and large size.
One approach is to move to the most draconian version of the diagonal GARCH model,
in which the matrices B and A are simply scalar matrices. Specifically,
, (20)Ωt' C % β Ω
t&1% α (R
t&1R
)
t&1)
where the value of each diagonal element of B is , and each diagonal element of A is .β α
Rearrangement yields
,Ωt' Ω % β (Ω
t&1& Ω) % α (R
t&1R
)
t&1 & Ω )
which is closely related to the multivariate RM approach, with the important difference that it
introduces, a non-degenerate long-run covariance matrix Ω to which reverts (provided thatΩt
α+β<1). Notice also though that all variance and covariances are assumed to have the same speed
of mean reversion, because of common α and β parameters, which may be overly restrictive.
3.3 Dimensionality Reduction I: Covariance Matrices via Flex-GARCH
Ledoit, Santa-Clara and Wolf (2003) suggest an attractive “Flex-GARCH” method for
reducing the computational burden in the estimation of the diagonal GARCH model without
moving to the scalar version. Intuitively, Flex-GARCH decentralizes the estimation procedure by
estimating N(N+1)/2 bivariate GARCH models with certain parameter constraints, and then
“pasting” them together to form the matrices A, B, and C in (18). Specific transformations of the
parameter matrices from the bivariate models ensure that the resulting conditional covariance
matrix forecast is psd. Flex-GARCH appears to be a viable modeling approach when N is larger
than say five, where estimation of the general diagonal GARCH model becomes intractable.
However, when N is of the order of thirty and above, which is often the case in practical risk
12
management applications, it becomes cumbersome to estimate N(N+1)/2 bivariate models, and
alternative dimensionality reduction methods are necessary. One such method is the dynamic
conditional correlation framework, to which we now turn.
3.4 Dimensionality Reduction II: Covariance Matrices via Dynamic Conditional Correlation
Recall the simple but useful decomposition of the covariance matrix into the correlation
matrix pre- and post-multiplied by the diagonal standard deviation matrix,
. (21)Ωt/ D
tΓ
tD
t
Bollerslev (1990) uses this decomposition, along with an assumption of constant conditional
correlations (Γt = Γ) to develop his Constant Conditional Correlation (CCC) GARCH model. The
assumption of constant conditional correlation, however, is arguably too restrictive over long
time periods.
Engle (2002) generalizes Bollerslev’s (1990) CCC model to obtain a Dynamic
Conditional Correlation (DCC) model. Crucially, he also provides a decentralized estimation
procedure. First, one fits to each asset return an appropriate univariate GARCH model (the
models can differ from asset to asset) and then standardizes the returns by the estimated GARCH
conditional standard deviations. Then one uses the standardized return vector, say ,et/ R
tD
&1
t
to model the correlation dynamics. For instance, a simple scalar diagonal GARCH(1,1)
correlation dynamic would be
, (23)Qt' C % β Q
t&1% α (e
t&1e)
t&1)
with the individual correlations in the Γt matrix defined by the corresponding normalized
elements of Qt,
. (24)ρi, j, t
' qi, j, t
/ ( qi, i, t
qj, j, t
)
The normalization in (24) ensures that all correlation forecasts fall in the [-1;1] interval, while
the simple scalar structure for the dynamics of Qt in (23) ensures that Γt is psd.
If C is pre-estimated by correlation targeting, as discussed earlier, only two parameters
need to be estimated in (23). Estimating variance dynamics asset-by-asset and then assuming a
simple structure for the correlation dynamics thus ensures that the DCC model can be
implemented in large systems: N+1 numerical optimizations must be performed, but each
involves only a few parameters, regardless of the size of N.
Although the DCC model offers a promising framework for exploring correlation
dynamics in large systems, the simple dynamic structure in (23) may be too restrictive for many
applications. For example, volatility and correlation responses may be asymmetric in the signs of

13
past shocks.9 Researchers are therefore currently working to extend the DCC model to more
general dynamic correlation specifications. Relevant work includes Franses and Hafner (2003),
Pelletier (2004), and Cappiello, Engle, and Sheppard (2004).
To convey a feel for the importance of allowing for time-varying conditional correlation,
we show in Figure 4 the bond return correlation between Germany and Japan estimated using a
DCC model allowing for asymmetric correlation responses to positive versus negative returns,
reproduced from Cappiello, Engle, and Sheppard (2004). The conditional correlation clearly
varies a great deal. Note in particular the dramatic change in the conditional correlation around
the time of the Euro’s introduction in 1999. Such large movements in conditional correlation are
not rare, and they underscore the desirability of allowing for different dynamics in volatility
versus correlation.10
< Figure 4 about here >
4. Exploiting High-Frequency Return Data for Improved Covariance Matrix Measurement
Thus far our discussion has implicitly focused on models tailored to capturing the
dynamics in returns by relying only on daily return information. For many assets, however, high-
frequency price data are available and should be useful for the estimation of asset return
variances and covariances. Here we review recent work in this area and speculate on its
usefulness for constructing large-scale models of market risk.
4.1 Realized Variances
Following Andersen, Bollerslev, Diebold and Labys (2003) (henceforth ABDL), define
the realized variance (RV) on day t using returns constructed at the ∆ intra-day frequency as
, (25)σ2
t,∆ / j1/∆
j'1
r2
t&1%j∆,∆
where 1/∆ is, for example, 48 for 30-minute returns in 24-hour markets. Theoretically, letting ∆
go to zero, which implies sampling continuously, we approach the true integrated volatility of
the underlying continuous time process on day t.11
In practice, market microstructure noise will affect the RV estimate when ∆ gets too
small. Prices sampled at 15-30 minute intervals, depending on the market, are therefore often
used. Notice also that, in markets that are not open 24 hours per day, the potential jump from the
closing price on day t-1 to the opening price on day t must be accounted for. This can be done
using the method in Hansen and Lunde (2004). As is the case for the daily GARCH models
considered above, corrections may also have to be made for the fact that days following
weekends and holidays tend to have higher than average volatility.
Although the daily realized variance is just an estimate of the underlying integrated

14
variance and likely measured with some error, it presents an intriguing opportunity: it is
potentially highly accurate, and indeed accurate enough such that we might take the realized daily
variance as an observation of the true daily variance, modeling and forecasting it using standard
ARMA time series tools. Allowing for certain kinds of measurement error can also easily be
done in this framework. The upshot is that if the fundamental frequency of interest is daily, then
using sufficiently high-quality intra-day price data enables the risk manager to treat volatility as
essentially observed. This is vastly different from the GARCH style models discussed above, in
which the daily variance is constructed recursively from past daily returns.
As an example of the direct modeling of realized volatility, one can specify a simple first-
order autoregressive model for the log realized volatility,
, (26)log(σt,∆
) / c % β log(σt&1,∆
) % νt
which can be estimated using simple OLS. The log specification guarantees positivity of
forecasted volatilities and induces (approximate) normality, as demonstrated empirically in
Andersen, Bollerslev, Diebold and Labys (2000, 2001). ABDL show the superior forecasting
properties of RV-based forecasts compared with GARCH forecasts. Rather than relying on a
simple short-memory ARMA model as in (26), they specify a fractionally integrated model to
better account for the apparent long-memory routinely found in volatility dynamics.
Along these lines, Figure 5 shows clear evidence of long-memory in foreign exchange
RVs as evidenced by the sample autocorrelation function for lags of 1 through 100 days. We first
construct the daily RVs from 30-minute FX returns and then calculate the corresponding daily
sample autocorrelations of the RVs. Note that the RV autocorrelations are significantly positive
for all 100 lags when compared with the conventional 95-percent Bartlett confidence bands.
< Figure 5 about here >
The RV forecasts may also be integrated into the standard GARCH modeling framework,
as explored in Engle and Gallo (2004).12 Similarly, rather than relying on GARCH variance
models to standardize returns in the first step of the DCC model, RVs can be used instead. Doing
so would result in a more accurate standardization and would require only a single numerical
optimization step – estimation of correlation dynamics – thereby rendering the computational
burden in DCC nearly negligible.
We next discuss how realized variances and their natural multivariate counterparts,
realized covariances, can be used in a more systematic fashion in risk management.
4.2 Realized Covariances
Generalizing the realized variance idea to the multivariate case, we can define the daily
realized covariance matrix as

15
. (27)Ωt,∆
/ j1/∆
j'1
Rt&1%j∆, ∆
R)
t&1%j∆, ∆
The upshot again is that variances and covariances no longer have to be extracted from a
nonlinear model estimated via treacherous maximum likelihood procedures, as was the case for
the GARCH models above. Using intra-day price observations, we essentially observe the daily
covariances and can model them as if they were observed. ABDL show that, as long as the asset
returns are linearly independent and the number of assets, N, is less than 1/∆, the realized
covariance matrix will be positive definite. However, for a sampling interval of, for example, 30
minutes in 24-hour markets, 1/∆ is 48 and so in large portfolios the condition is likely to be
violated. We return to this important issue at the end of this section.
Microstructure noise may plague realized covariances, just as it may plague realized
variances. Non-synchronous trading, however, creates additional complications in the
multivariate case. These are similar, but potentially more severe, than the non-synchronous
trading issues that arise in the estimation of say, monthly covariances and CAPM betas with non-
synchronous daily data. A possible fix involves inclusion of additional lead and lag terms in the
realized covariance measure (27), along the lines of the Scholes and Williams (1977) beta
correction technique. Work on this is still in its infancy, and we will not discuss it any further
here, but an important recent contribution is Martens (2004).
We now consider various strategies for modeling and forecasting realized covariances,
treating them as directly observable vector time series. These all are quite speculative, as little
work has been done to date in terms of actually assessing the economic value of using realized
covariances for practical risk measurement and management problems.13
Paralleling the tradition of the scalar diagonal GARCH model, directly suggests the
following model
, (28)vech (Ωt,∆
) ' vech (C) % β vech (Ωt&1,∆
) % νt
which requires nothing but simple OLS to implement, while guaranteeing positive definiteness of
the corresponding covariance matrix forecasts for any positive definite matrix C and positive
values of β. This does again however impose a common mean-reversion parameter across
variances and covariances, which may be overly restrictive. Realized covariance versions of the
non-scalar diagonal GARCH model could be developed in a similar manner, keeping in mind the
restrictions required for positive definiteness.
Positive definiteness may also be imposed by modeling the Cholesky decomposition of
the realized covariance matrix rather than the matrix itself, as suggested by ABDL. We have
, (29)Ωt,∆
/ Pt,∆
P)
t,∆
where Pt,∆ is a unique lower triangular matrix. The data vector is then vech(Pt,∆), and we
16
substitute the forecast of vech(Pt+k, ∆ ) back into (29) to construct a forecast of .Ωt%k ,∆
Alternatively, in the tradition of Ledoit and Wolf (2003), one may induce positive
definiteness of high-dimensional realized covariance matrices by shrinking toward the covariance
matrix implied by a single-factor structure, in which the optimal shrinkage parameter is estimated
directly from the data.
We can also use a DCC-type framework for realized correlation modeling. In parallel to
(21) we write
, (30)Ωt,∆
/ Dt,∆Γ
t,∆D
t,∆
where the typical element in the diagonal matrix is the realized standard deviation, and theDt,∆
typical element in is constructed from the elements in asΓt,∆
Ωt,∆
. (31)ρi, j, t,∆
/ σi, j, t,∆
/(σi, i, t,∆
σj, j, t,∆
)
Following the DCC idea, we model the standard deviations asset-by-asset in the first step, and
the correlations in a second step. Keeping a simple structure as in (23), we have
, (32)vech (Qt,∆
) ' vech (C) % βvech (Qt&1,∆
) % νt
where simple OLS again is all that is required for estimation. Once again, a normalization is
needed to ensure that the correlation forecasts fall in the [-1;1] interval. Specifically,
. (33)ρi, j, t,∆
' qi, j, t,∆
/ ( qi, i, t,∆
qj, j, t,∆
)
The advantages of this approach are twofold: first, high-frequency information is used to obtain
more precise forecasts of variances and correlations. Second, numerical optimization is not
needed at all. Long-memory dynamics or regime-switching could, of course, be incorporated as
well.
Although there appear to be several avenues for exploiting intra-day price information in
daily risk management, two key problems remain. First, many assets in typical portfolios are not
liquid enough for intraday information to be available and useful. Second, even in highly-liquid
environments, when N is very large the positive definiteness problem remains. We now explore a
potential solution to these problems.
4.3 Dimensionality Reduction III: (Realized) Covariance Matrices via Mapping to Liquid Base Assets
Multivariate market risk management systems for portfolios of thousands of assets in
many cases work from a set of, say, 30 observed base assets believed to be key drivers of risk.
Such a base asset factor structure is of course more justified for a relatively specialized

17
application such as a U.S. equity portfolio than for a large diversified entity such as a major
international bank. The choice of factors depend on the portfolio at hand but can, for example,
consist of equity market indices, FX rates, benchmark interest rates, and so on, which are
believed to capture the main sources of uncertainty in the portfolio. The assumptions made on the
multivariate distribution of base assets are naturally of crucial importance for the accuracy of the
risk management system.
Note that base assets typically correspond to the most liquid assets in the market. The
upshot here is that we can credibly rely on realized volatility and covariances in this case. Using
the result from ABDL, a base asset system of dimension NF < 1/∆ will ensure that the realized
covariance matrix is psd and therefore useful for forecasting.
The mapping from base assets to the full set of assets is discussed in Jorion (2000). In
particular, the factor model is naturally expressed as14
, (34)Rt' ΒR
F,t% ν
t
where νt denotes the idiosyncratic risk. The factor loadings in the N×NF matrix Β may be
obtained from regression (if data exists), or via pricing model sensitivities (if a pricing model
exists). Otherwise the loadings may be determined by ad hoc considerations such as matching a
security without a well-defined factor loading to another similar security which has a well-
defined factor loading.
We now need a multivariate model for the NF base assets. However, assuming that
, (35)RF, t
' Ω1/2
F, t ZF, t
ZF, t
- i.i.d. E (ZF, t
)'0 Var (ZF, t
)' I
we can use the modeling strategies discussed above to construct the NF×NF realized factor
covariance matrix and the resulting systematic covariance matrix measurements andΩF, t
forecast.
5. Modeling Entire Conditional Return Distributions
Best-practice risk measurement and management often requires knowing the entire
distribution of asset or base asset returns, not just the second moments. Conventional risk
measures such as VaR and expected shortfall, however, capture only limited aspects of the
distribution. They collapse a two-dimensional object, the return distribution function, into a one-
dimensional object, the risk measure. Clearly information is lost in this dimension reduction in
all but certain counterfactual special cases such as the normal distribution with a zero mean,
which only depends on one parameter (the variance).
In this section we explore various approaches to complete the model. Notice that above
we deliberately left the distributional assumption on the standardized returns unspecified. We
18
simply assumed that the standardized returns were i.i.d. We will keep the assumption of i.i.d.
standardized returns below and focus on ways to estimate the constant conditional density. This
is, of course, with some loss of generality as dynamics in moments beyond second-order could be
operative. The empirical evidence for such higher-ordered conditional moment dynamics is,
however, much less conclusive at this stage.
The evidence that daily standardized returns are not normally distributed is, however,
quite conclusive. Although GARCH and other dynamic volatility models do remove some of the
non-normality in the unconditional returns, conditional returns still exhibit non-normal features.
Interestingly, these features vary systematically from market to market. For example, mature FX
market returns are generally strongly conditionally kurtotic, but approximately symmetric.
Meanwhile, most aggregate index equity returns appear to be both conditionally skewed and fat
tailed.
As an example of the latter, we show in Figure 6 the daily QQ plot for S&P500 returns
from January 2, 1990 to December 31, 2002, standardized using the (constant) average daily
volatility across the sample. That is, we plot quantiles of standardized returns against quantiles of
the standard normal distribution. Clearly the daily returns are not unconditionally normally
distributed.
< Figure 6 about here >
Consider now Figure 7 in which the daily returns are instead standardized by the time-
varying volatilities from an asymmetric GJR GARCH(1,1) model. The QQ plot in Figure 7
makes clear that although the GARCH innovations conform more closely to the normal
distribution than do the raw returns, the left tail of the S&P500 returns conforms much less well
to the normal distribution than does the right tail: there are more large innovations than one
would expect under normality.
< Figure 7 about here >
As the VaR itself is a quantile, the QQ plot also gives an assessment of the accuracy of
the normal-GARCH VaR for different coverage rates. Figure 7 suggests that a normal-GARCH
VaR would work well for any coverage rate for a portfolio which is short the S&P500. It may
also work well for a long portfolio but only if the coverage rate is relatively large, say in excess
of 5%.
Consider now instead the distribution of returns standardized by realized volatility. In
contrast to the poor fit in the left tail evident in Figure 7, the distribution in Figure 8 is strikingly
close to normal, as first noticed by Zhou (1996) and Andersen, Bollerslev, Diebold and Labys
(2000). Figures 7 and 8 rely on the same series of daily S&P500 returns but simply use two
different volatility measures to standardize the raw returns. The conditional non-normality of
daily returns has been a key stylized fact in market risk management. Finding a volatility measure

19
which can generate standardized returns that are close to normal is therefore surprising and
noteworthy.
< Figure 8 about here >
Figure 8 and the frequently-found lognormality of realized volatility itself suggest that a
good approximation to the distribution of returns may be obtained using a normal / log-normal
mixture model. In this model, the standardized return is normal and the distribution of realized
volatility at time t conditional on time t-1 information is log-normal. This idea is explored
empirically in ABDL, who find that a log-normal / normal mixture VaR model performs very
well in an application to foreign exchange returns.
The recent empirical results in Andersen, Bollerslev and Diebold (2003) suggest that even
better results may be obtained by separately measuring and modeling the part of the realized
volatility attributable to “jumps” in the price process through so-called realized bipower variation
measures, as formally developed by Barndorff-Nielsen and Shephard (2004). These results have
great potential for application in financial risk management, and their practical implications are
topics of current research.
Although realized volatility measures may be available for highly liquid assets, it is often
not possible to construct realized volatility based portfolio risk measures. We therefore now
survey some of the more conventional methods first for univariate and then for multivariate
models.
5.1 Portfolio Level: Univariate Analytic Methods
Although the normal assumption works well in certain cases, we want to consider
alternatives that allow for fat tails and asymmetry in the conditional distribution, as depicted in
Figure 7. In the case of VaR we are looking for ways to calculate the cut-off in z&1
p
. (36)VaRp
T%1|T / σT%1
z&1
p
Perhaps the most obvious approach is simply to look for a parametric distribution more flexible
than the normal while still tightly parameterized. One such example is the (standardized)
Student’s t distribution suggested by Bollerslev (1987), which relies on only one additional
parameter in generating symmetric fat tails. Recently, generalizations of the Student’s t which
allow for asymmetry have also been suggested, as in Fernandez and Steel (1998) and Hansen
(1994).
Rather than assuming a particular parametric density, one can approximate the quantiles
of non-normal distributions via Cornish-Fisher approximations. Baillie and Bollerslev (1992)
first advocated this approach in the context of GARCH modeling and forecasting. The only
inputs needed are the sample estimates of skewness and kurtosis of the standardized returns.
Extreme value theory provides another approximation alternative, in which the tail(s) of the

20
conditional distribution is estimated using only the extreme observations, as suggested in
Diebold, Schuermann, and Stroughair (1998), Longin (2000) and McNeil and Frey (2000).
A common problem with most GARCH models, regardless of the innovation distribution,
is that the conditional distribution of returns is not preserved under temporal aggregation. Hence
even if the standardized daily returns from a GARCH(1,1) model were normal, the implied
weekly returns will not be. This in turn implies that the term structure of VaR or expected
shortfall needs to be calculated via Monte Carlo simulation, as in, e.g., Guidolin and
Timmermann (2004). But Monte Carlo simulation requires a properly specified probability
distribution which would rule out the Cornish-Fisher and extreme-value-theory approximations.
Heston and Nandi (2000) suggest a specific affine GARCH-normal model, which may
work well for certain portfolios, and which combined with the methods of Albanese, Jackson and
Wiberg (2004) allows for relatively easy calculation of the term structure of VaRs. In general,
however, simulation methods are needed, and we now discuss a viable approach which combines
a parametric volatility model with a data-driven conditional distribution.
5.2 Portfolio Level: Univariate Simulation Methods
Bootstrapping, or Filtered Historical Simulation (FHS), assumes a parametric model for
the second moment dynamics but bootstraps from standardized returns to construct the
distribution. At the portfolio level this is easy to do. Calculate the standardized pseudo portfolio
returns as
, (37)zw,t
' rw,t
/ σt, for t'1,2, ... ,T
using one of the variance models from section 2. For the one-day-ahead VaR, we then simply use
the order statistic for the standardized returns combined with the volatility forecast to construct,
. (38)FHS&VaRp
T%1 / σT%1
zw
((T%1)p)
Multi-day VaR requires simulating paths from the volatility model using the standardized returns
sampled with replacement as innovations. This approach has been suggested by Diebold,
Schuermann and Stroughair (1998), Hull and White (1998) and Barone-Adesi, Bourgoin and
Giannopoulos (1998), who coined the term FHS. Pritsker (2001) also provides evidence on its
effectiveness.
5.3 Asset Level: Multivariate Analytic Methods
Just as a fully specified univariate distribution is needed for risk measurement, so too is a
fully specified multivariate distribution often needed for risk management. For example, a fully
specified multivariate distribution allows for the computation of VaR sensitivities and VaR
minimizing portfolio weights. The cost, of course, is that we must make an assumption about the
21
multivariate (but constant) distribution of Zt in (16).
The results of Andersen, Bollerslev, Diebold and Labys (2000) suggest that, at least in the
FX market, the multivariate distribution of returns standardized by the realized covariance matrix
is again closely approximated by a normal distribution. As long as the realized volatilities are
available, a multivariate version of the log-normal mixture model discussed in connection with
Figure 8 above could therefore be developed.
As noted earlier, however, construction and use of realized covariance matrices may be
problematic in situations when liquidity is not high, in which case traditional parametric models
may be used. As in the univariate case, however, the multivariate normal distribution coupled
with multivariate standardization using covariance matrices estimated from traditional parametric
models, although obviously convenient, does not generally provide an accurate picture of tail
risk.15
A few analytic alternatives to the multivariate normal paradigm do exist, such as the
multivariate Student’s t distribution first considered by Harvey, Ruiz and Sentana (1992), along
with the more recent related work by Glasserman, Heidelberger, and Shahbuddin (2002).
Recently much attention has also been focused on the construction of multivariate densities from
the marginal densities via copulas, as in Jondeau and Rockinger (2004) and Patton (2002),
although the viability of the methods in very high-dimensional systems remains to be established.
Multivariate extreme value theory offers a tool for exploring cross-asset tail
dependencies, which are not captured by standard correlation measures. For example, Longin and
Solnik (2001) define and compute extreme correlations between monthly U.S. index returns and
a number of foreign country indexes. In the case of the bivariate normal distribution, correlations
between extremes taper off to zero as the thresholds defining the extremes get larger in absolute
value. The actual equity data, however, behave quite differently. The correlation between
negative extremes is much larger than the normal distribution would suggest.16 Such strong
correlation between negative extremes is clearly a key risk management concern. Poon,
Rockinger and Tawn (2004) explore the portfolio risk management implications of extremal
dependencies, while Hartmann, Straetmans and de Vries (2004) consider their effect on banking
system stability. Once again, however, it is not yet clear whether such methods will be
operational in large-dimensional systems.
Issues of scalability, as well as cross-sectional and temporal aggregation problems in
parametric approaches, thus once again lead us to consider simulation based solutions.
5.4 Asset Level: Multivariate Simulation Methods
In the general multivariate case, we can in principle use FHS with dynamic correlations,
but a multivariate standardization is needed. Using the Cholesky decomposition, we first create
vectors of standardized returns from (16). We write the standardized returns from an estimated

22
multivariate dynamic covariance matrix as
, (39)Zt' Ω
&1/2
tR
tfor t'1,2, ... ,T
where we calculate from the Cholesky decomposition of the inverse covariance matrixΩ&1/2
t
. Now, resampling with replacement vector-wise from the standardized returns will ensureΩ&1
t
that the marginal distributions as well as particular features of the multivariate distribution, as for
example, the cross-sectional dependencies suggested by Longin and Solnik (2001), will be
preserved in the simulated data.
The dimensionality of the system in (39) may render the necessary multivariate
standardization practically infeasible. However, the same FHS approach can be applied with the
base asset setup in (35), resampling from the factor innovations calculated as
(40)ZF,t
' Ω&1/2
F, tR
F,tfor t'1,2, ... ,T,
where we again use the Cholesky decomposition to build up the distribution of the factor returns.
From (34) we can then construct the corresponding idiosyncratic asset innovations as,
(41)νt' R
t& ΒR
F,tfor t'1,2, ... ,T,
in turn resampling from and to build up the required distribution of the individual assetZt
νt
returns in the base asset model.
Alternatively, if one is willing to assume constant conditional correlations, then the
standardization can simply be done on an individual asset-by-asset basis using the univariate
GARCH volatilities. Resampling vector-wise from the standardized returns will preserve the
cross-sectional dependencies in the historical data.
6. Summary and Directions for Future Research
We have attempted to demonstrate the power and potential of dynamic financial
econometric methods for practical financial risk management, surveying the large literature on
high-frequency volatility measurement and modeling, interpreting and unifying the most
important and intriguing results for practical risk management. The paper complements the more
general and technical survey of volatility and covariance forecasting in Andersen, Bollerslev,
Christoffersen and Diebold (2005).
Our discussion has many implications for practical financial risk management; some
point toward desirable extensions of existing approaches, and some suggest new directions. Key
points include:
(1) Standard “model-free” methods, such as historical simulation, rely on false assumptions of
23
independent returns. Reliable risk measurement requires a conditional density model that
allows for time-varying volatility.
(2) For the purpose of risk measurement, specifying a univariate density model directly on the
portfolio return is likely to be most accurate. RiskMetrics offers one possible approach,
but the temporal aggregation properties – including the volatility term structure – of
RiskMetrics appear to be counter-factual.
(3) GARCH volatility models offer a convenient and parsimonious framework for modeling key
dynamic features of returns, including volatility mean-reversion, long-memory, and
asymmetries.
(4) Although risk measurement can be done from a univariate model for a given set of portfolio
weights, risk management requires a fully specified multivariate density model.
Unfortunately, standard multivariate GARCH models are too heavily parameterized to be
useful in realistic large-scale problems.
(5) Recent advances in multivariate GARCH modeling are likely to be useful for medium-scale
models, but very large scale modeling requires decoupling variance and correlation
dynamics, as in the dynamic conditional correlation model.
(6) Volatility measures based on high-frequency return data hold great promise for practical risk
management. Realized volatility and correlation measures give more accurate forecasts of
future realizations than their conventional competitors. Because high-frequency
information is only available for highly liquid assets, we suggest a base-asset factor
approach.
(7) Risk management requires fully-specified conditional density models, not just conditional
covariance models. Resampling returns standardized by the conditional covariance matrix
presents an attractive strategy for accommodating conditionally non-normal returns.
(8) The near log-normality of realized volatility, together with the near-normality of returns
standardized by realized volatility, holds promise for relatively simple-to-implement log-
normal / normal mixture models in financial risk management.

References
Albanese, C., K. Jackson, and P. Wiberg, 2004, A New Fourier Transform Algorithm for
Value-at-Risk, Quantitative Finance, 4, 328-338.
Alizadeh, S., M. Brandt, and F. Diebold, 2002, Range-Based Estimation of Stochastic Volatility
Models, Journal of Finance, 57, 1047-1091.
Andersen, T. and T. Bollerslev, 1997, Heterogeneous Information Arrivals and Return Volatility
Dynamics: Uncovering the Long Run in High Frequency Returns, Journal of Finance, 52,
975-1005.
Andersen, T.G., T. Bollerslev, P. Christoffersen and F.X. Diebold, 2005, Volatility Forecasting,
in G. Elliott, C. Granger and A. Timmermann (eds.), Handbook of Economic Forecasting.
Amsterdam: North-Holland, forthcoming
Andersen, T.G., T. Bollerslev, and F.X. Diebold, 2003, Some Like it Smooth, and Some Like it
Rough: Untangling Continuous and Jump Components in Measuring, Modeling, and
Forecasting Asset Return Volatility, Manuscript, Northwestern University, Duke
University and University of Pennsylvania.
Andersen, T.G., T. Bollerslev, and F.X. Diebold, 2004, Parametric and Nonparametric Volatility
Measurement, in L.P. Hansen and Y. Ait-Sahalia (eds.), Handbook of Financial
Econometrics. Amsterdam: North-Holland, forthcoming.
Andersen, T.G., T. Bollerslev, F.X. Diebold and H. Ebens, 2001, “The Distribution of Realized
Stock Return Volatility,” Journal of Financial Economics, 61, 43-76.
Andersen, T., T. Bollerslev, F.X. Diebold, and P. Labys, 2000, Exchange Rate Returns
Standardized by Realized Volatility are (Nearly) Gaussian, Multinational Finance
Journal, 4, 159-179.
Andersen, T.G., T. Bollerslev, F.X. Diebold and P. Labys, 2001, “The Distribution of Realized
Exchange Rate Volatility,” Journal of the American Statistical Association, 96, 42-55.
Andersen, T.G., T. Bollerslev, F.X. Diebold, and P. Labys, 2003, Modeling and Forecasting
Realized Volatility, Econometrica , 71, 529-626.
Andersen, T.G., T. Bollerslev, F.X. Diebold and C. Vega, 2004, Real-Time Price Discovery in
Stock, Bond and Foreign Exchange Markets, Manuscript, Northwestern University, Duke
University, University of Pennsylvania, and University of Rochester.
Baillie, R.T. and T. Bollerslev, 1992, Prediction in Dynamic Models with Time-Dependent
Conditional Variances, Journal of Econometrics, 51, 91-113.
Barndorff-Nielsen, O.E. and N. Shephard, 2001, Non-Gaussian Ornstein-Uhlenbeck-Based
Models and Some of Their Uses in Financial Economics (with discussion), Journal of the
Royal Statistical Society B, 63, 167-241.
Barndorff-Nielsen, O. and N. Shephard, 2004, Power and Bipower Variation with Stochastic
Volatility and Jumps, Journal of Financial Econometrics, 2, 1-48.
Barone-Adesi, G., Bourgoin, F. and K. Giannopoulos, 1998, Don’t Look Back, Risk, 11, August,
100-104.
Benson, P. and P. Zangari, 1997, A General Approach to Calculating Var Without Volatilities
and Correlations, RiskMetrics Monitor, 2nd Quarter, 19-23.
Berkowitz, J. and J. O'Brien, 2002, How Accurate are Value-at-Risk Models at Commercial
Banks?, Journal of Finance, 57, 1093-1112.
Bodoukh, J., M. Richardson, and R. Whitelaw, 1998, The Best of Both Worlds, Risk, 11, May,
64-67.
Bollerslev, T., 1986, Generalized Autoregressive Conditional Heteroskedasticity, Journal of
Econometrics, 31, 307-327.
Bollerslev, T., 1987, A Conditionally Heteroskedastic Time Series Model for Speculative Prices
and Rates of Return, Review of Economics and Statistics, 69, 542-547.
Bollerslev, T., R.F. Engle, and J. Wooldridge, 1988, A Capital Asset Pricing Model with
Time-Varying Covariances, Journal of Political Economy, 96, 116-131.
Bollerslev, T. and H.O. Mikkelsen, 1999, Long-Term Equity Anticipation Securities and Stock
Market Volatility Dynamics, Journal of Econometrics, 92, 75-99.
Brandt, M., P. Santa-Clara and R. Valkanov, 2004, Optimal Portfolios with Parametric Weights,
Manuscript, Duke University and UCLA.
Cappiello, L., R.F. Engle and K. Sheppard, 2004, Asymmetric Dynamics in the Correlations of
Global Equity and Bond Returns, Manuscript, New York University.
Christoffersen, P., 2003, Elements of Financial Risk Management. San Diego: Academic Press.
Christoffersen, P., and K. Jacobs, 2004, Which GARCH Model for Option Valuation?
Management Science, 50, 1204-1221.
Diebold, F.X. A. Hickman, A. Inoue, and T. Schuermann, 1998, Converting 1-Day Volatility to
h-Day Volatility: Scaling by Root-h is Worse than You Think, Wharton Financial
Institutions Center, Working Paper 97-34. Published in condensed form as Scale Models,
Risk, 11, 104-107.
Diebold, F.X. and M. Nerlove, 1989, The Dynamics of Exchange Rate Volatility: A Multivariate
Latent-Factor ARCH Model, Journal of Applied Econometrics, 4, 1-22.
Diebold, F.X., T. Schuermann, and J. Stroughair, 1998, Pitfalls and Opportunities in the Use of
Extreme Value Theory in Risk Management, in A.-P. N. Refenes, A.N. Burgess and J.D.
Moody (eds.), Decision Technologies for Computational Finance, 3-12. Amsterdam:
Kluwer Academic Publishers. (Reprinted in Journal of Risk Finance, 1 (Winter 2000),
30-36, and in P. Embrechts (ed.), Extremes and Integrated Risk Management. London:
Risk Publications, 2000.)
Duffie, D. and J. Pan, 1997, An Overview of Value at Risk, Journal of Derivatives, Spring, 7-49.
Engle, R.F., 2001, GARCH 101: The Use of ARCH/GARCH Models in Applied Econometrics,
Journal of Economic Perspectives, 15, 157-168.
Engle, R.F., 2002, Dynamic Conditional Correlation: A Simple Class of Multivariate
Generalized Autoregressive Conditional Heteroskedasticity Models, Journal of Business
and Economic Statistics, 20, 339-350.
Engle, R.F., 2004, Risk and Volatility: Econometric Models and Financial Practice, American
Economic Review, 94, 405-420.
Engle, R.F. and G.M. Gallo, 2004, A Multiple Indicators Model for Volatility Using Intra-Daily
Data, Manuscript, New York University and University of Firenze.
Engle, R.F. and G.G.J. Lee, 1999, A Permanent and Transitory Component Model of Stock
Return Volatility, in R.F. Engle and H. White (eds.), Cointegration, Causality, and
Forecasting: A Festschrift in Honor of Clive W.J. Granger, 475-497. Oxford, UK: Oxford
University Press.
Engle, R.F. and J. Mezrich, 1996, GARCH for Groups, Risk, 8, 36-40.
Fernandez, C. and M.F.J. Steel, 1998, On Bayesian Modeling of Fat Tails and Skewness, Journal
of the American Statistical Association, 93, 359-371.
Fleming, J. C. Kirby, and B. Ostdiek, 2003, The Economic Value of Volatility Timing Using
Realized Volatility, Journal of Financial Economics, 67, 473-509.
Franses, P.H and C. Hafner, 2003, A Generalized Dynamic Conditional Correlation Model for
Many Asset Returns, Manuscript, Erasmus University Rotterdam.
Gallant, A.R., C.T. Hsu, and G.E. Tauchen, 1999, Using Daily Range Data to Calibrate Volatility
Diffusions and Extract the Forward Integrated Variance, Review of Economics and
Statistics, 81, 617-631.
Ghysels, E., P. Santa-Clara and R. Valkanov, 2005, Predicting Volatility: Getting the Most out of
Return Data Sampled at Different Frequencies, Journal of Econometrics, forthcoming.
Glasserman, P., P. Heidelberger, and P. Shahbuddin, 2002, Portfolio Value-at-Risk with
Heavy-tailed Risk Factors, Mathematical Finance, 239–269.
Glosten, L.R., R. Jagannathan, and D. Runkle, 1993, On the Relation Between the Expected
Value and the Volatility of the Nominal Excess Return on Stocks, Journal of Finance, 48,
1779-1801.
Guidolin, M. and A. Timmermann, 2004, Term Structure of Risk under Alternative Econometric
Specifications, Journal of Econometrics, forthcoming.
Hansen, B., 1994, Autoregressive Conditional Density Estimation, International Economic
Review, 35, 705-730.
Hansen, P.R. and A. Lunde, 2004, A Realized Variance for the Whole Day Based on Intermittent
High-Frequency Data, Manuscript, Stanford University.
Hartmann, P., S. Straetmans, and C. de Vries, 2004, Banking System Stability: A Cross-Atlantic
Perspective, forthcoming as a chapter in this volume.
Harvey, A.C., 1989, Forecasting Structural Time Series Models and the Kalman Filter,
Cambridge University Press.
Harvey, A.C., E. Ruiz, and E. Sentana, 1992, Unobserved Component Time Series Models with
ARCH Disturbances, Journal of Econometrics, 52, 129-157.
Heston, S. and S. Nandi, 2000, A Closed-Form GARCH Option Pricing Model, Review of
Financial Studies 13, 585-626.
Hull, J., and A. White, 1998, Incorporating Volatility Updating into the Historical Simulation
Method for VaR, Journal of Risk 1, 5-19.
Jackson, P., D. Maude and W. Perraudin, 1997, Bank Capital and Value at Risk, Journal of
Derivatives, 4, 73-89.
Jondeau, E. and M. Rockinger, 2004, The Copula-GARCH Model of Conditional Dependence:
An International Stock Market Application, Journal of International Money and Finance,
forthcoming.
Jorion, P., 2000, Value-at-Risk. New York: McGraw-Hill.
Ledoit, O., P. Santa-Clara, and M. Wolf, 2003, Flexible Multivariate GARCH Modeling with an
Application to International Stock Markets, Review of Economics and Statistics, 85, 735-
747.
Ledoit, O., and M. Wolf, 2003, Improved Estimation of the Covariance Matrix of Stock Returns
with an Application to Portfolio Selection, Journal of Empirical Finance, 10, 603-621.
Longin, F., 2000, From VaR to Stress Testing: the Extreme Value Approach, Journal of Banking
and Finance, 24, 1097-1130.
Longin, F. and B. Solnik, 2001, Extreme Correlation of International Equity Markets, Journal of
Finance, 56, 649-676.
Manganelli, S., 2004, Asset Allocation by Variance Sensitivity Analysis, Journal of Financial
Econometrics, 2, 370 - 389.
Martens, M., 2004, Estimating Unbiased and Precise Realized Covariances, Manuscript, Erasmus
University Rotterdam.
McNeil, A.J. and R. Frey, 2000, Estimation of Tail-Related Risk Measures for Heteroskedastic
Financial Time Series: An Extreme Value Approach, Journal of Empirical Finance, 7,
271-300.
Nerlove, M. and S. Wage, 1964, On the Optimality of Adaptive Forecasting, Management
Science, 10, 207-229.
Patton, A.J., 2002, Modeling Time-varying Exchange Rate Dependence Using the Conditional
Copula. Working paper, LSE.
Pelletier, D., 2004, Regime Switching for Dynamic Correlations, Journal of Econometrics,
forthcoming.
Pesaran, H., and P. Zaffaroni, 2004, Model Averaging and Value-at-Risk based Evaluation of
Large Multi Asset Volatility Models for Risk Management, Manuscript, University of
Cambridge.
Poon, S.-H., M. Rockinger, and J. Tawn, 2004, Extreme Value Dependence in Financial
Markets: Diagnostics, Models and Financial Implications, Review of Financial Studies,
17, 581-610.
Pritsker, M., 2001, The Hidden Dangers of Historical Simulation, Manuscript, Federal Reserve
Board.

Scholes, M., and J.T. Williams, 1977, Estimating Betas from Nonsynchronous Data, Journal of
Financial Economics, 5, 309-327.
Theil, H., and S. Wage, 1964, Some Observations on Adaptive Forecasting, Management
Science, 10, 198-206.
Zhou, B., 1996, “High-Frequency Data and Volatility in Foreign-exchange Rates, Journal of
Business and Economic Statistics, 14, 45-52.

Figure 1. October 1987: Daily S&P500 Loss and 1% HS-VaR
-15%
-10%
-5%
0%
5%
10%
15%
20%
25%
10/1 10/6 10/11 10/16 10/21 10/26 10/31
Time
1%
VaR
an
d A
ctu
al L
oss
.
Notes to Figure: The thin line with diamonds shows the daily percentage loss on an S&P500
portfolio during October 1987. The thick line with squares shows the daily 1% VaR from
historical simulation using a 250-day window.

Figure 2. True Conditional Coverage of 1% VaR from Historical Simulation
0
0.02
0.04
0.06
0.08
0.1
0 200 400 600 800 1000
Time
Co
nd
itio
nal
Co
ver
age.
Notes to Figure: We simulate returns from a GARCH model with normal innovations, after
which we compute the 1% HS-VaR using a rolling window of 250 observations, and then we
plot the true conditional coverage probability of the HS-VaR, which we calculate using the
GARCH structure. The true conditional coverage probability plotted thus denotes the likelihood
each day of getting a VaR violation when using a misspecified 1% HS-VaR when the returns are
simulated using GARCH.
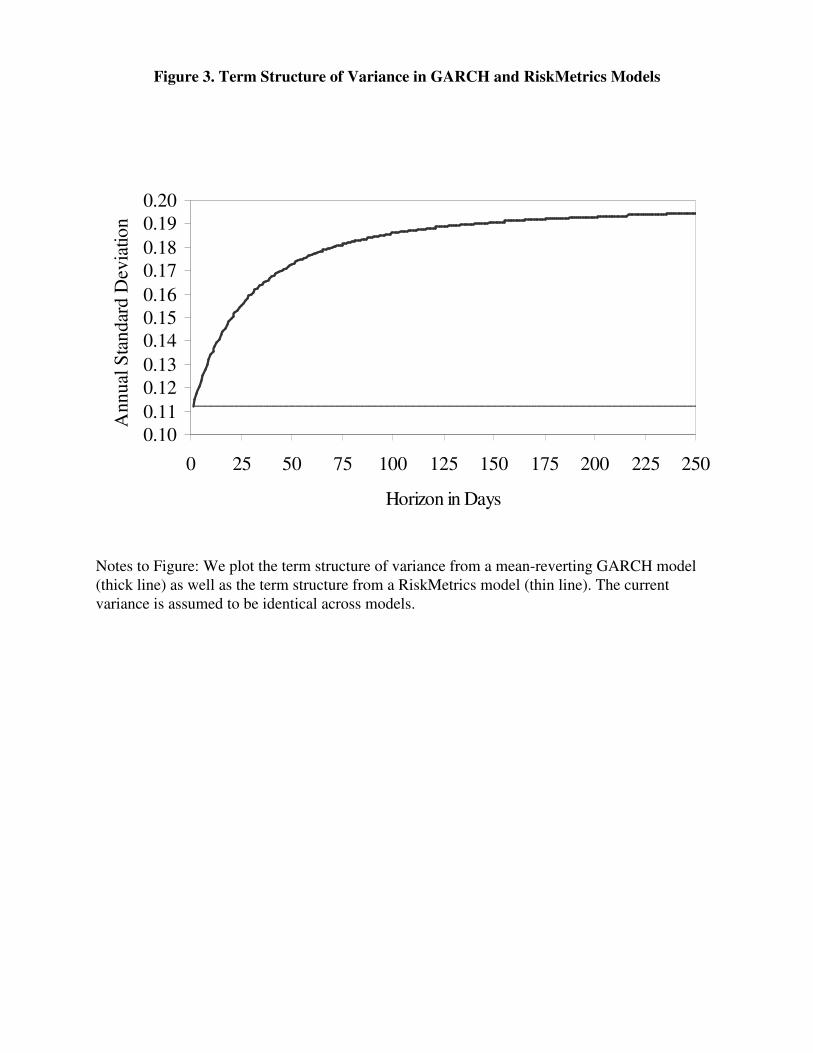
Figure 3. Term Structure of Variance in GARCH and RiskMetrics Models
Notes to Figure: We plot the term structure of variance from a mean-reverting GARCH model
(thick line) as well as the term structure from a RiskMetrics model (thin line). The current
variance is assumed to be identical across models.
0.10
0.11
0.12
0.13
0.14
0.15
0.16
0.17
0.18
0.19
0.20
0 25 50 75 100 125 150 175 200 225 250
Horizon in Days
Ann
ual
Sta
ndar
d D
evia
tio
n
.
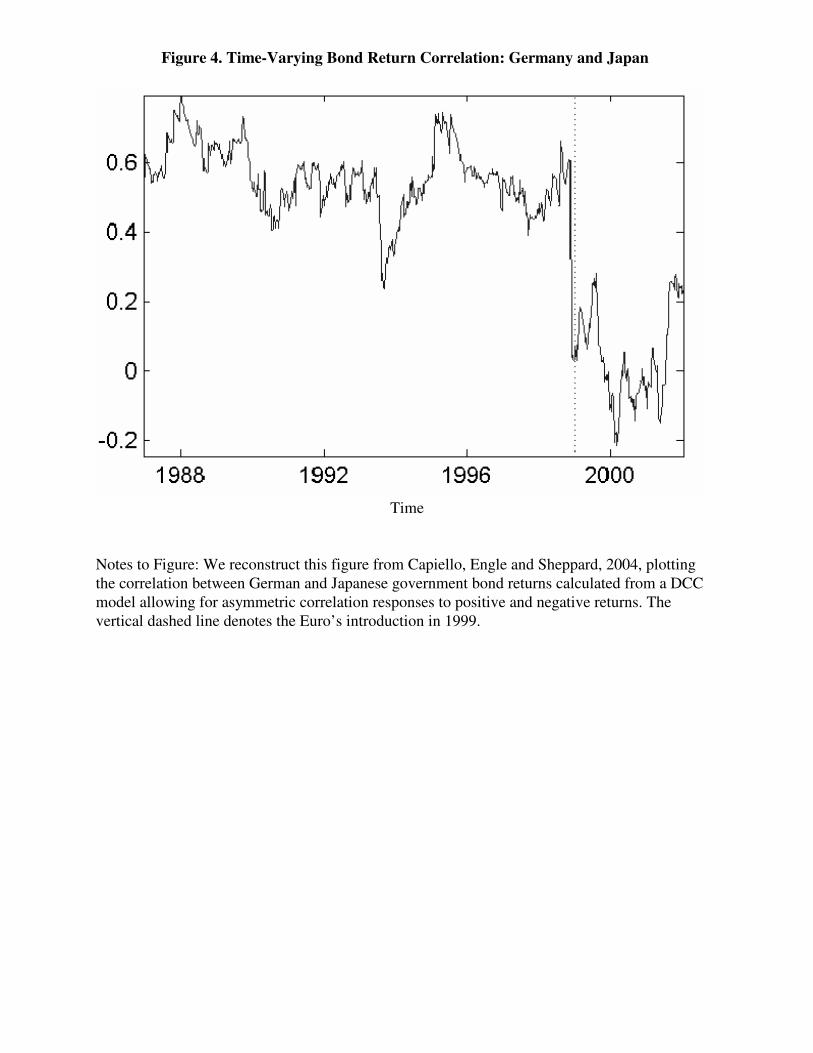
Figure 4. Time-Varying Bond Return Correlation: Germany and Japan
Time
Notes to Figure: We reconstruct this figure from Capiello, Engle and Sheppard, 2004, plotting
the correlation between German and Japanese government bond returns calculated from a DCC
model allowing for asymmetric correlation responses to positive and negative returns. The
vertical dashed line denotes the Euro’s introduction in 1999.

Figure 5. Sample Autocorrelations of Realized Volatility: Three Currencies
Notes to Figure: We plot the sample autocorrelations of daily realized log standard deviations for
three FX rates, together with Bartlett’s +/- 2 standard error bands for the sample autocorrealtions
of white noise. We construct the underlying daily realized variances using 30-minute returns
from December 1, 1986, through December 1, 1996.
-0.1
0.1
0.3
0.5
0.7
0.9
0 20 40 60 80 100
Displacement in Days
Auto
corr
elat
ion.
Yen/DM
Yen/USD
DM/USD
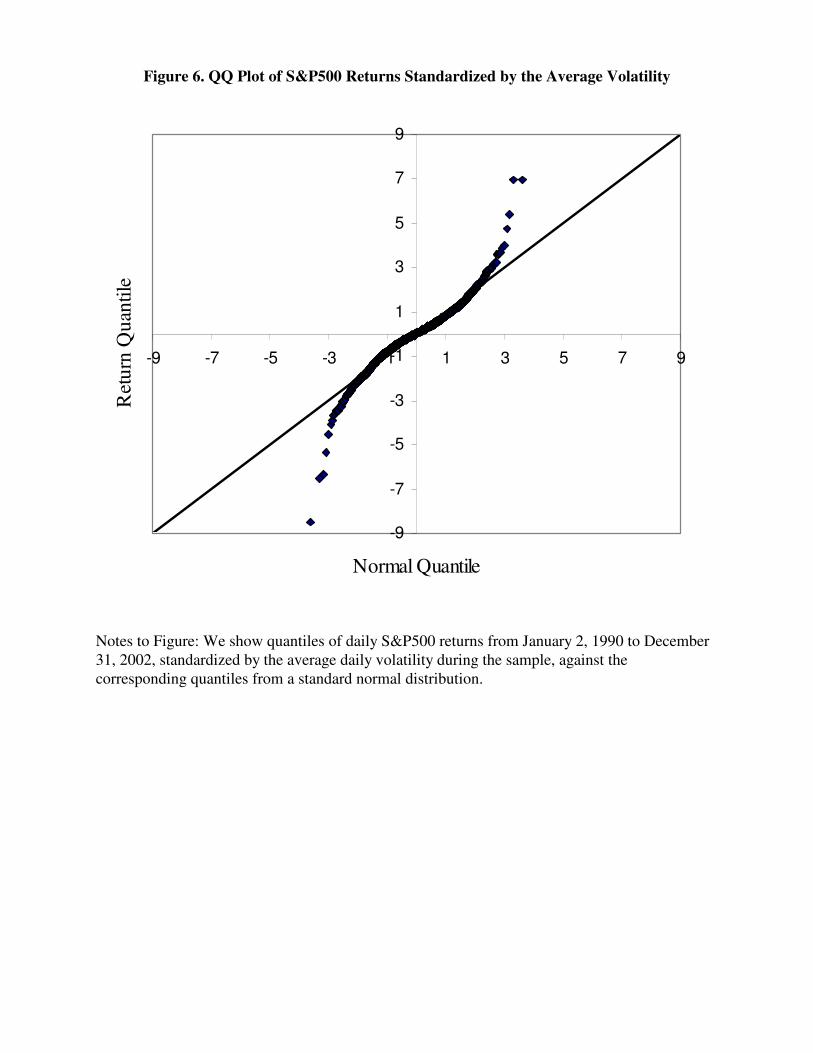
Figure 6. QQ Plot of S&P500 Returns Standardized by the Average Volatility
Notes to Figure: We show quantiles of daily S&P500 returns from January 2, 1990 to December
31, 2002, standardized by the average daily volatility during the sample, against the
corresponding quantiles from a standard normal distribution.
-9
-7
-5
-3
-1
1
3
5
7
9
-9 -7 -5 -3 -1 1 3 5 7 9
Normal Quantile
Ret
urn
Qu
antile
.

Figure 7. QQ Plot of S&P500 Returns Standardized by GARCH Volatility
Notes to Figure: We show quantiles of daily S&P500 returns from January 2, 1990 to December
31, 2002, standardized by volatility from a estimated asymmetric GJR GARCH(1,1) model,
against the corresponding quantiles from a standard normal distribution. The units on each axis
are standard deviations.
-9
-7
-5
-3
-1
1
3
5
7
9
-9 -7 -5 -3 -1 1 3 5 7 9
Normal Quantile
Ret
urn
Qu
anti
le
.

Figure 8. QQ Plot of S&P500 Returns Standardized by Realized Volatility
Notes to Figure: We show quantiles of daily S&P500 returns from January 2, 1990 to December
31, 2002, standardized by realized volatility calculated from 5-minute futures returns, against the
corresponding quantiles from a standard normal distribution. The units on each axis are standard
deviations.
-9
-7
-5
-3
-1
1
3
5
7
9
-9 -7 -5 -3 -1 1 3 5 7 9
Normal Quantile
Ret
urn
Quan
tile
.

1. Although the Basel Accord calls for banks to report 1% VaR’s, for various reasons most banks
tend to actually report more conservative VaR’s. Rather than simply scaling up a 1% VaR based
on some “arbitrary” multiplication factor, the procedures that we discuss below are readily
adapted to achieve any desired, more conservative, VaR.
2. See also Jackson, Maude and Perraudin (1997).
3. Duffie and Pan (1997) provide an earlier incisive discussion of related VaR procedures and
corresponding practical empirical problems.
4. Bodoukh, Richardson, Whitelaw (1998) introduce updating into the historical simulation
method. Note, however, the concerns in Pritsker (2001).
5. This optimization can be performed in a matter of seconds on a standard desktop computer
using standard software such as Excel, as discussed by Christoffersen (2003). For further
discussion of inference in GARCH models, see also Andersen, Bollerslev, Christoffersen and
Diebold (2005).
6. Engle (2001, 2004) demonstrate empirically that allowing for asymmetries in the conditional
variance can materially affect GARCH-based VaR calculations.
7. Brandt, Santa-Clara and Valkanov (2004) provide an alternative and intriguing new approach
for dimension reduction by explicitly parameterizing the portfolio weights as a function of
observable state variables, thereby sidestepping the need to estimate the full covariance matrix.
See also Pesaran and Zaffaroni (2004).
8. See Manganelli (2004) for an interesting new low-dimensional approach to this problem.
9. A related example is the often-found positive relationship between volatility changes and
correlation changes. If present but ignored, this effect can have serious consequences for
portfolio hedging effectiveness.
10. As another example, cross-market stock-bond return correlations are often found to be close
to zero or slightly positive during bad economic times (recessions), but negative in good
economic times (expansions); see, e.g., the discussion in Andersen, Bollerslev, Diebold and Vega
(2004).
11. For a full treatment, see Andersen, Bollerslev and Diebold (2004).
12. Intriguing new procedures for combining high-frequency data and RV type measures with
lower frequency daily returns in volatility forecasting models have also recently been developed
by Ghysels, Santa-Clara and Valkanov (2005).
13. One notable exception is the work of Fleming, Kirby, Oestdiek (2003), which suggests
dramatic improvements vis-a-vis the RM and multivariate GARCH frameworks for standard
mean-variance efficient asset allocation problems.
Endnotes

14. Diebold and Nerlove (1989) construct a multivariate ARCH factor model in which the latent
time-varying volatility factors can be viewed as the base assets.
15. In the multivariate case the normal distribution is even more tempting to use, because it
implies that the aggregate portfolio distribution itself is also normally distributed.
16. In contrast, and interestingly, the correlations of positive extremes appear to approach zero in
accordance with the normal distribution.


