Download - PREDICTIVE MODELS IN LIFE INSURANCE

6/5/2010
Munich Re
1
PREDICTIVE MODELS IN LIFE
INSURANCE
Philip L. Adams, ASA, MAAA
Date: 17 June 2010
Agenda
1. Predictive Models Defined
2. Predictive models past and present
3. Actuarial perspective
4. Application to Life Insurance: ILEC 02-04 and 05-07 data

6/5/2010
Munich Re
2
PREDICTIVE MODELS
WHAT THEY ARE (AND AREN’T)
05/06/2010Title of presentation and name of speaker3
What is predictive modeling?
“Predictive modeling is the use of modern statistical methods to identify and
measure past associations for the sake of inferring associations about the past, the
present and the future. Usually, this is expressed through probabilities, and it has a
very strong Bayesian flavor.”
-Your humble speaker
This sounds a lot like what actuaries have been doing for a century (except for the
“modern statistical methods” part).

6/5/2010
Munich Re
3
What it’s not
05/06/2010 5
Panacea Best thing since sliced
bread
The tool to end all tools
Nuts and Bolts of Predictive Modeling
Data mining: Use statistical methods to find patterns
“Correlation does not imply causation”
…but we often have to assert causation
Some associations cannot be measured using correlation
Correlation is measure of statistical collinearity
Correlation implies dependency, but not conversely
Example: If X is uniform on (-1,1), then X2 is uncorrelated with X
Take action with those patterns
Build a better product or service
Incorporate into risk management
05/06/2010 6

6/5/2010
Munich Re
4
PREDICTIVE MODELS
PAST AND PRESENT
05/06/20107Title of presentation and name of speaker
PREDICTIVE MODELS: The PastHoroscopes

6/5/2010
Munich Re
5
PREDICTIVE MODELS: In FictionThe Witch in Monty Python’s Holy Grail
05/06/2010Title of presentation and name of speaker 9
“Experience” taught
knight that witches
float, so compare
candidate to other
things that float
Peasants’ suggested
comparisons: wood,
very small rocks,
churches, water fowl
Analogous to a
decision tree
PREDICTIVE MODELS: Real Data, Bad AnalysisPirates and Global Warming
05/06/2010Title of presentation and name of speaker 10
Number of
pirates has
decreased since
1860
Globe has
consistently
warmed
Ergo, Somalia is
at the forefront
of the fight
against global
warming

6/5/2010
Munich Re
6
PREDICTIVE MODELS: Dubious conclusions
05/06/2010 11Title of presentation and name of speaker
More pirates!
PREDICTIVE MODELS: The Present
05/06/2010Title of presentation and name of speaker 12
Mortality tables
Lapse tables
Trends
Credit scoring
Underwriting manuals
UCS
Fraud detection

6/5/2010
Munich Re
7
Manual, ad hoc
Inefficient use of data
Inefficient models
Modeler biases strong (often hidden)
…but gets the job done
Formal, statistically sound systems
Extracts a lot of information
Models efficiently capture relationships
Modeler biases must be explicit
…remains mysterious
05/06/2010Title of presentation and name of speaker 13
Comparisons
Life Actuarial Modeling Predictive Modeling
Whitaker-Henderson Graduation
Analysis of A/E ratios
Underwriting rules
Credibility (basic)
Additive models with splines
Regression models with offsets
Decision trees
Credibility (advanced)
05/06/2010Title of presentation and name of speaker 14
Analogues
Life Actuarial Modeling Predictive Modeling

6/5/2010
Munich Re
8
APPLICATIONS TO LIFE INSURANCE
05/06/2010Title of presentation and name of speaker15
Modeling the ILEC 02-04 Data
• Death claims and exposures on fully underwritten lives from 35 companies
collected between 2002 and 2004
• Nearly 700,000 claims overall
• Almost 500,000 in durations 21+
• For this presentation, we confine our attention to a particular subset
• Attained ages 20-84, durations 1-10
• Face amounts at least $10,000 and summarized into two bands
• Left with 37,087 death claims
• We anchor to PPR ultimate model from Edwalds, Craighead, Adams paper

6/5/2010
Munich Re
9
Modeling the ILEC 02-04 Data
Modeling the ILEC 02-04 Data

6/5/2010
Munich Re
10
Modeling the ILEC 02-04 Data
Modeling the ILEC 02-04 Data

6/5/2010
Munich Re
11
Modeling the ILEC 02-04 Data
Modeling with GAMs
05/06/2010 22Title of presentation and name of speaker
Linear Model
• Standard regression model using least squares minimization of some response against some collection of predictor variables
Generalized Linear Model
• Expand universe of response variables to probabilities, counts, etc.
Generalized Additive Model
• Expand universe of predictors to include smooth functions
xy 10
xyg 10
xfyg 0
6/5/2010
Munich Re
12
Modeling with GAMs
Splines underly “smooth functions”
Cubic splines
Penalized splines
Thin-plate regression splines
Tensor product splines
05/06/2010 23Title of presentation and name of speaker
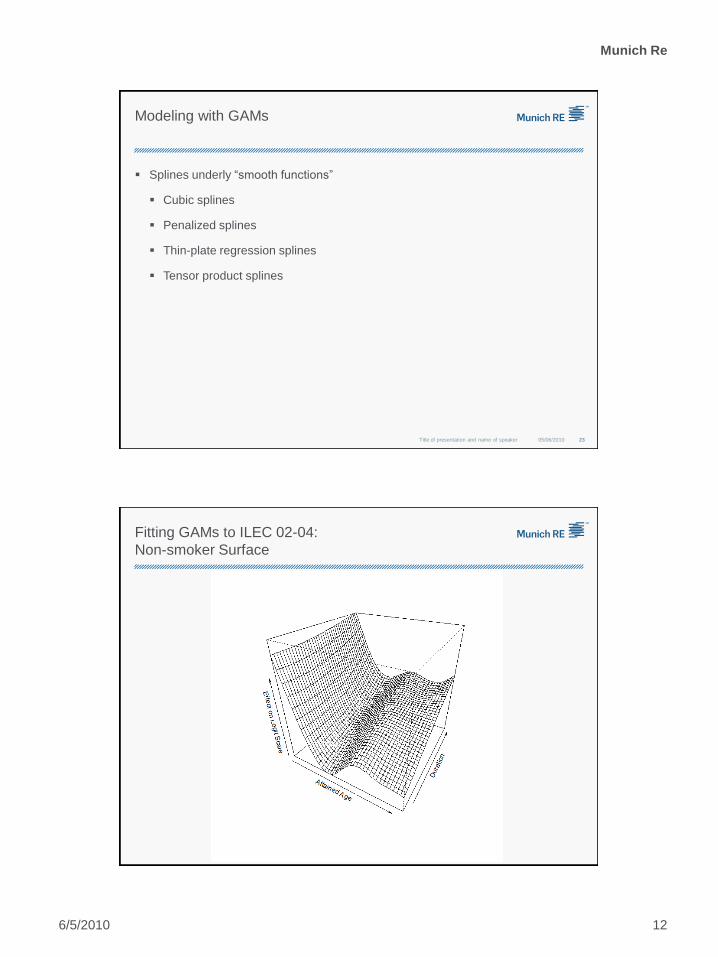
Fitting GAMs to ILEC 02-04:
Non-smoker Surface

6/5/2010
Munich Re
13
Fitting GAMs to ILEC 02-04:
Smoker Surface
Fitting GAMs to ILEC 02-04:
Model Parameters
Parameters (offset from ultimate) Estimate Std. Error p-value e.d.f.
Fixed
Intercept -0.317 0.062 0.00% 1
Males -0.059 0.012 0.00% 1
Face Amounts $50,000+ -0.399 0.012 0.00% 1
Non-smokers -0.298 0.062 0.00% 1
Smokers 0.488 0.065 0.00% 1
Non-smokers in Duration 1 -0.823 0.078 0.00% 1
Non-smokers in Duration 2 -0.199 0.039 0.00% 1
Smokers in Duration 1 0.000 1
Smokers in Duration 2 -0.173 0.055 0.16% 1
SmoothNon-smokers 63 parameters 0.00% 18.06
Smokers 63 parameters 0.00% 9.81

6/5/2010
Munich Re
14
Fitting GAMs to ILEC 02-04:
Smoker Penalty
But can it predict?
Attach to ILEC 05-07 Dataset
Confined to data similar to fitting set
Data summarized, so judgment used for choice of age and duration
Table projected forward to 2008 using 1% per annum flat
Compare to 2008 VBT
Represents actuarial approach
05/06/2010 28Title of presentation and name of speaker

6/5/2010
Munich Re
15
2008 VBT and GAM ComparedGender and Smoker Status
A/E by Count A/E by Amount
Claims 08VBT Primary Predictive Model 08VBT Primary Predictive Model
Female 11,402 110.1% 112.8% 95.4% 105.9%
Non-Smoker 8,812 108.8% 110.1% 95.9% 105.3%
Smoker 2,590 115.1% 123.1% 92.4% 109.9%
Male 20,654 107.8% 106.6% 87.1% 88.2%
Non-Smoker 15,663 106.3% 105.0% 86.4% 86.9%
Smoker 4,991 113.1% 112.0% 92.1% 96.7%
Overall 32,056 108.7% 108.7% 89.2% 92.3%
05/06/2010 29Title of presentation and name of speaker
Bottom line results are comparable.
2008 VBT and GAM ComparedFace Amount Band
05/06/2010 30Title of presentation and name of speaker
A/E by Count A/E by Amount
Claims 08VBT Primary Predictive Model 08VBT Primary Predictive Model
10,000-24,999 4,062 150.7% 121.8% 149.7% 120.5%
25,000-49,999 4,212 135.5% 106.6% 134.9% 106.2%
50,000-99,999 5,531 121.4% 136.6% 120.7% 135.9%
100,000+ 18,251 95.3% 100.6% 87.0% 90.3%
Overall 32,056 108.7% 108.7% 89.2% 92.3%
GAM has better control for face amount variation.

6/5/2010
Munich Re
16
2008 VBT and GAM ComparedAttained Age Slope
05/06/2010 31Title of presentation and name of speaker
2008 VBT and GAM ComparedDuration Slope
05/06/2010 32Title of presentation and name of speaker

6/5/2010
Munich Re
17
References
Edwalds, T., Craighead, S., Adams, P. (2008) “Estimating Mortality Risk Using
Predictive Modeling.” Enterprise Risk Management Symposium.
Lowrie, Walter B. (1982) “An Extension of the Whittaker-Henderson Method of
Graduation,” Transactions of the Society of Actuaries, Vol. 34, pp. 329-372
R Development Core Team (2009). R: A Language and environment for
statistical computing. Vienna, Austria. R Foundation for Statistical Computing
Wood, S. (2006) Generalized Additive Models: An Introduction with R. Chapman
& Hall, London.
Image Credits
• Wikimedia Commons
• Monty Python
• Veganza.com
• Wenger
• CDC
05/06/2010 34Title of presentation and name of speaker


