
1
Predictive Models to Achieve Business Results
Place your image on top of this gray box.
If no graphic i applicable, delete gray box and
notch-out behind gray box, from
the Title Master 19th International Forum on COCOMO and Software Cost Modeling
Cvetan Redzic, Michael Crowley, Nancy Eickelmann, Jongmoon Baik
Motorola, Inc.October 26, 2004

2
Outline
• Overview • Business Goals• Models Used
– COQUALMO
– CoQ-DES
– MotoROI
• Primary Model Inputs– CMM
– Life Cycle Scope
– PCE / PSE
• Results– Cost
– Quality

3
Business Goal – Improved Customer Satisfaction
Must Be
DelightersAttractive
Satisfier Features
Quality
1
2
3
+
-
SW Quality
Type of needs1. Basic Expectations (Must Be)2. Satisfier - Features3. Delighters (Attractive)
Kano Analysis

4
Cause & Effect Diagram
Improved Customer
Satisfaction

5
Integrating Predictive Models
• Models Used– COQUALMO– CoQ-DES– MotoROI

6
COQUALMO

7
Combined COQUALMO Injection Factors
8
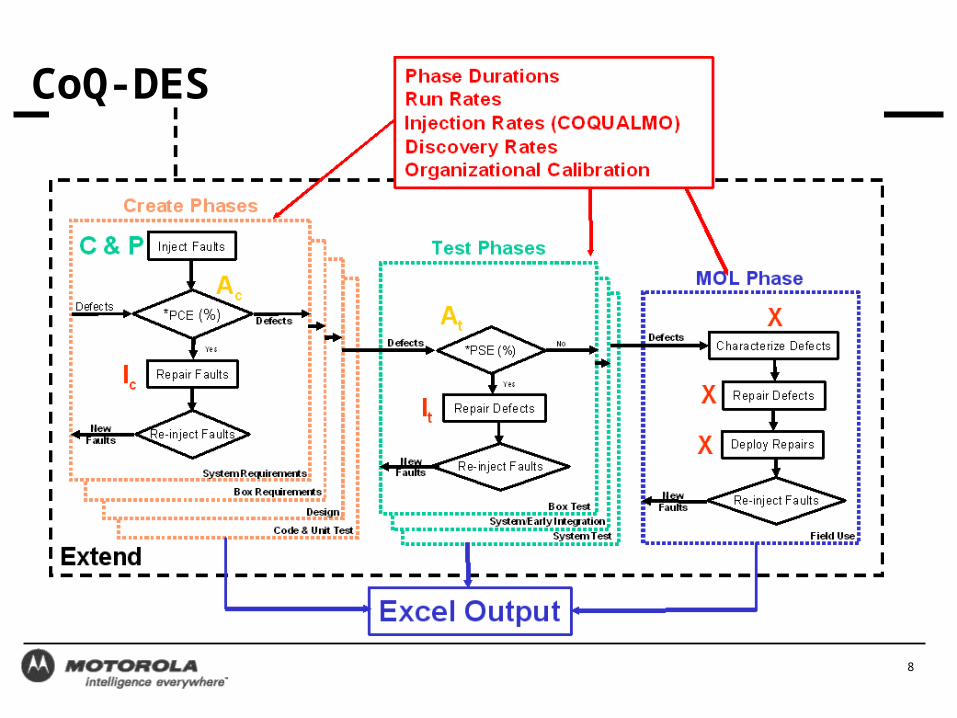
CoQ-DES

9
CoQ-DES Simulation
10
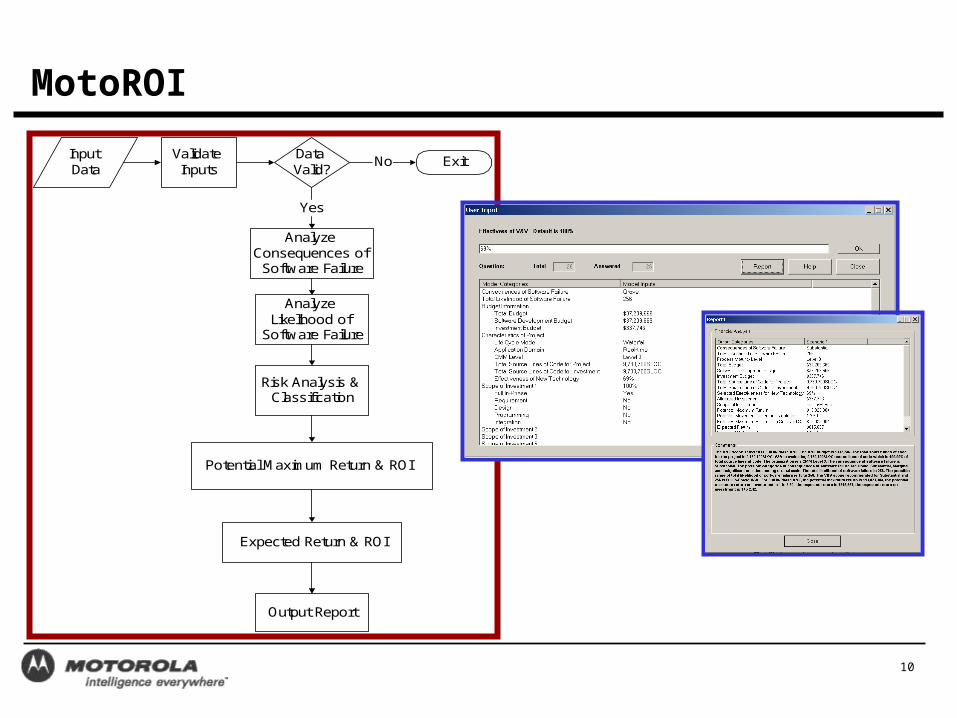
MotoROI
Input Data
Validate Inputs
Data Valid?
ExitNo
Analyze Consequences of Software Failure
Yes
Analyze Likelihood of
Software Failure
Risk Analysis & Classification
Potential Maximum Return & ROI
Expected Return & ROI
Output Report

11
MotoROI - DOORS ROI Analysis
Report 1 Report 2 Report 3 Report 4
CMM Level 5 3 3 3Total SLOC 9,780,700 9,780,700 9,780,700 9,780,700Scope of SLOC 9,780,700 9,780,700 9,780,700 9,780,700Software Budget $37,209,669 $37,209,669 $37,209,669 $37,209,669 Investment Budget $400,000 $400,000 $400,000 $400,000 Investment Effectiveness 50% 100% 75% 50%Allocated investment $400,000 $400,000 $400,000 $400,000 Scope of Investment Requirements Requirements Requirements RequirementsPotential Maximum Return $5,953,547 $13,023,384 $13,023,384 $13,023,384 Potential Maximum Return/Scope $2,232,580 $4,837,257 $4,837,257 $4,837,257 Potential Maximum ROI 1:1.6 1:3.5 1:3.5 1:3.5Expected Return $120,000 $520,000 $390,000 $260,000 Expected ROI 1:0.3 1:1.3 1:0.97 1:0.7% COPQ Savings 2% 4% 3% 2%
DOORS – ROI Analysis

12
Model Integration - Primary Model Inputs
• CMM• Life Cycle• PCE / PSE

13
CMM – Process Maturity
0
10
20
30
40
50
60
Co
st a
s a
Pe
rce
nt o
f D
eve
lop
me
nt
1 2 3 4 5 SEI CMM Level
Prevention Appraisal Int Failure Ext Failure TCoSQ
Knox Theoretical Model of TCOQ
(About 50% at CMM Level 3)
• COQUALMO– PMAT (process
maturity has the greatest +/-impact) on injection rates
• CoQ-DES– Not Used directly but
is inherent in organizational calibration
• MotoROI– Process maturity as
represented by the cost of quality/cost of poor quality financial structure is a primary factor.

14
Life Cycle
Requirement
Design
Code
Implementation Unit Test
Component/Integration Test
System Test
Inspections Testing
• COQUALMO– Req., Des., Imp., and Code
• CoQ-DES– Full Life Cycle
• MotoROI– Full Life Cycle or Individual Phases

15
PCE and PSE
• COQUALMO– PCE and PSE as
evidenced by injection and removal rates
• CoQ-DES– PCE and PSE as
evidenced by injection and removal rates
• MotoROI– PCE for DP or PSE
for technology effectiveness
Phase Containment Effectiveness & Phase Screening Effectiveness

16
Measuring and Monitoring Results
• Quality• Cost

17
Defect Removal in REQ, DESIGN & CODE
REQ DESIGN CODE
COQUALMO Average Edge
Defect Injection in REQ, DESIGN & CODE
REQ DESIGN CODE
COQUALMO Average Edge
Quality - Sources of Variation
For Release with about 100 Delta
KLOC, no significant difference estimates & actuals in DI & DR
For large size Release over 100 Delta KLOC, there is significant difference b/w estimates & actuals in DI & DR for Code
REQ DES CODE
Calculated Chi-Square Value 0.19 0.57 11.97
Chi-Square (2;0.05) 5.99
Significance No No Yes
Actual vs. COQUALMO Estimate

18
Quality - Sigma Level
Sigma Level:Defects per Million
OpportunitiesDPMO = 1M * D/(N*O)D = 2464 HS Faults (from PCE)N = 139,595 Delta LOCDPMO = 1M * 2464/139,595
DPMO = 17651 - 3.61 s
Stable processes
Need Leap improvement: SEI CMM Level 5 TCM
From PCE, SRE & CRUD data
Sigma Level by Release - As Is
GSR4 GSR4.1 GSR5.X GSR6 H2 GSR7 EDGE GSR8
Sig
ma
Leve
l
SL HS Faults SL SRE PRs SL CRUD
What is Sigma Level from release perspective ?
Relatively stable across the releases

19
Quality - SRE Goal Setting

20
Quality: As-Is Process
Defect Injection per KLOC - As Is
REQ IDS HLD LLD CODE
Average LB UB
Cum. Defect Injection by Phase
REQ IDS HLD LLD CODE
Cum. Average LB UB
Defect Removal per KOLC by Phase - As Is
REQ IDS HLD LLD CODE PT FT S T P-R CRUD
Average LB UB
Cum. Defect Removal per KOLC by Phase - As Is
REQ IDS HLD LLD CODE PT FT S T P-R CRUD
Cum. Average LB UB

21
Quality - Rayleigh Model Analysis

22
Quality - Impact of Tactical Changes
Frequency Chart
Certainty is 95.00% from 23 to 26
.000
.007
.014
.021
.028
0
7
14
21
28
22 23 25 26 27
1,000 Trials 998 Displayed
Forecast: CRUDoutcome
Monte-Carlo simulation,to include uncertainty &risks In the expert based opinion

23
Quality - New Process Baseline
Cum. Defect Injection per KLOC by Phase - Should Be
REQ IDS HLD LLD CODE
Cum. Average LB UB
Defect Injection per KLOC by Phase - Should Be
REQ IDS HLD LLD CODE
Average LB UB
Defect Removal per KOLC by Phase - Should Be
REQ IDS HLD LLD CODE PT FT S T P-R CRUD
Average UB LB
Cum. Defect Removal per KOLC by Phase - Should Be
REQ IDS HLD LLD CODE PT FT S T P-R CRUD
Cum. Average LB UB

24
Cost - Vital X Monthly Review Charts
GSR8 Program Review - GSR8
FTE Staff
1 3 5 7 9 11 13 15 17 19 21Jul'03
Sep Nov Jan'04
Mar May Jul Sep Nov Jan'05
Mar May
0
20
40
60
80
100
120
140
ppl
23456868
Cum Eff SLOC
1 3 5 7 9 11 13 15 17 19 21Jul'03
Sep Nov Jan'04
Mar May Jul Sep Nov Jan'05
Mar May
0
50
100
150
200
SLO
C (th
ousands)
23456868
Cum All Defects
1 3 5 7 9 11 13 15 17 19 21Jul'03
Sep Nov Jan'04
Mar May Jul Sep Nov Jan'05
Mar May
0
200
400
600
800
1000
1200
1400
CA
D
234568All Defects
1 3 5 7 9 11 13 15 17 19 21Jul'03
Sep Nov Jan'04
Mar May Jul Sep Nov Jan'05
Mar May
0
50
100
150
200
250
AD
234568
Current Plan Actuals Current Forecast Green Control Bound Yellow Control Bound Project: GSR8
SLIM
25
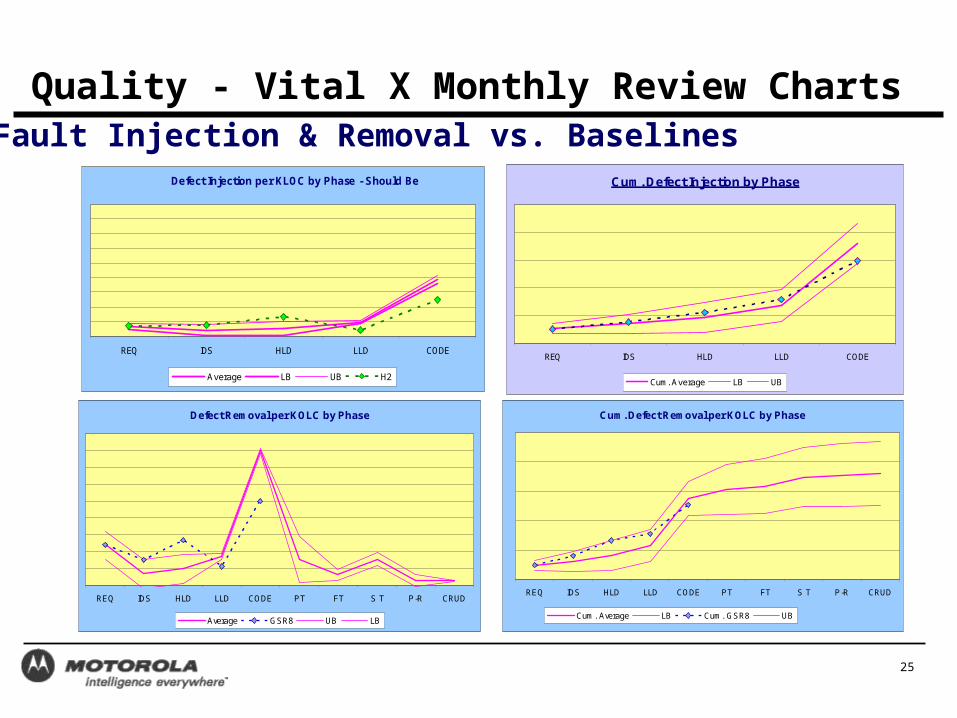
Quality - Vital X Monthly Review ChartsFault Injection & Removal vs. Baselines
Cum. Defect Injection by Phase
REQ IDS HLD LLD CODE
Cum. Average LB UB
Defect Removal per KOLC by Phase
REQ IDS HLD LLD CODE PT FT S T P-R CRUD
Average GSR8 UB LB
Cum. Defect Removal per KOLC by Phase
REQ IDS HLD LLD CODE PT FT S T P-R CRUD
Cum. Average LB Cum. GSR8 UB
Defect Injection per KLOC by Phase - Should Be
REQ IDS HLD LLD CODE
Average LB UB H2

26
Quality - Vital X Monthly Review Charts
SRE
27
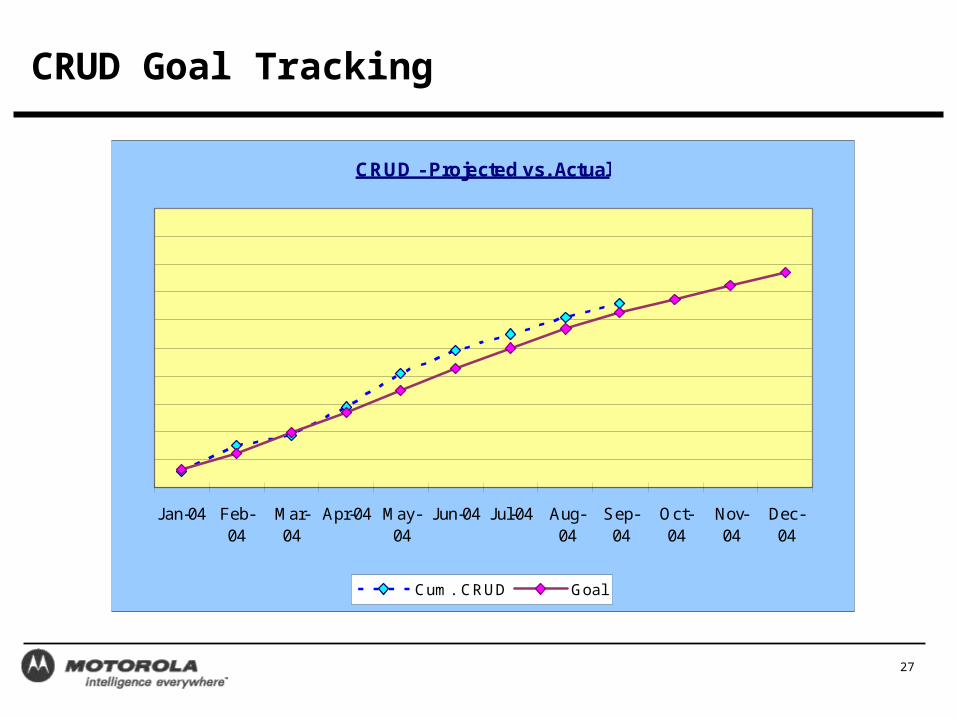
CRUD Goal Tracking
CRUD - Projected vs. Actual
Jan-04 Feb-04
Mar-04
Apr-04 May-04
Jun-04 Jul-04 Aug-04
Sep-04
Oct-04
Nov-04
Dec-04
Cum. CRUD Goal

28
Summary
• Integrating predictive models provides multiple views of project quality, cost and schedule issues.
• More accurate predictions of defect injection are possible
• More accurate predictions of defect removal are possible
• More accurate predictions of overall staffing and project cost are possible


