
Prepared by Facilities Services David Lindemann Board Approved April 23, 2019

MIMS
MILA
VIERA
QUEST
ALLEN
STONE
CREELSABAL
COCOA
GEMINI
TURNER
HOOVER
APOLLO
SATURN
McNAIR
SUNRISE
MANATEE
CENTRAL
BAYSIDE
JOHNSON
SUNTREE
DELAURA
CARROLL
AUDUBON
KENNEDY
MADISON
HOLLAND
RIVIERALOCKMAR
JUPITER
JACKSONCOQUINA
HERITAGE
SHERWOODLONGLEAF
EDGEWOOD
PINEWOOD
WILLIAMS
SURFSIDE
PALM BAY
WESTSIDE
ATLANTIS
OAK PARK
FAIRGLEN
TROPICALGOLFVIEW
ANDERSEN
SEA PARK
COLUMBIA
STEVENSON
FREEDOM 7
SOUTHWEST
DISCOVERY
JEFFERSON
CAMBRIDGE
ASTRONAUT
MELBOURNE
ENDEAVOUR
CAPE VIEW
ROOSEVELT
McAULIFFE
EAU GALLIE
ENTERPRISE
WEST SHORE
TITUSVILLE
PT MALABAR
HARBOR CITY
COCOA BEACH
SPACE COAST
INDIALANTIC
CHALLENGER 7
OCEAN BREEZE
PALM BAY HIGH
WEST MELBOURNE
MEADOWLANE INTER
IMPERIAL ESTATES
CROTON
ROCKLEDGE
SATELLITE
MERRITT ISLAND
UNIVERSITY PARK
1
5
4
2
3
School Board Members of Brevard County
School Districts2018-2019
Cities of Brevard Co.BREVARD COUNTY
CAPE CANAVERAL
COCOA
COCOA BEACH
GRANT VALKARIA
INDIALANTIC
INDIAN HARBOUR BEACH
MALABAR
MELBOURNE
MELBOURNE BEACH
MELBOURNE VILLAGE
PALM BAY
PALM SHORES
ROCKLEDGE
SATELLITE BEACH
TITUSVILLE
WEST MELBOURNE
DISTRICT 2 Ms. Cheryl McDougallMember since 2018321-987-6382321-633-1000 ext 412 (Board Office)FAX: 321-633-3432Contact at: [email protected]
DISTRICT 3 Ms.Tina DescovichChairpersonMember Since 2016321-848-5478 (Cell)321-633-1000 ext. 412 (Board Office)FAX 321-633-3432Contact at: [email protected]
DISTRICT 5 Ms. Katye CampbellMember Since 2018321-271-9946321-633-1000, ext. 412 (Board Office)FAX: 321-633-3432Contact at: [email protected]
DISTRICT 4 Mr. Matt SusinVice ChairmanMember Since 2016321-684-9735321-633-1000 ext. 412 (Board Office)FAX: 321-633-3432Contact at: [email protected]
DISTRICT 1 Ms. Misty Haggard-BelfordMember since 2014321-591-9387321-633-1000 ext. 412 (Board Office)FAX: 321-633-3432Contact at: [email protected]

School Board of Brevard County FY 2019-2020 Student Accommodation Plan
Facilities Services / DGL Board Approved April 23, 2019
School Board Members
DISTRICT 1
Ms. Misty Belford
DISTRICT 2 Ms. Cheryl McDougall
DISTRICT 3
Ms. Tina Descovich, Chair
DISTRICT 4 Mr. Matt Susin, Vice Chair
DISTRICT 5
Ms. Katye Campbell
SUPERINTENDENT OF SCHOOLS Mark W. Mullins, Ed.D.
2700 Judge Fran Jamieson Way
Viera, Florida 32940 Phone (321) 633-1000

School Board of Brevard County FY 2019-2020 Student Accommodation Plan
Facilities Services / DGL Board Approved April 23, 2019
TABLE OF CONTENTS
SECTION 1 OVERVIEW
A. Introduction to the Student Accommodation Plan B. Components of Facilities Planning C. 2019-2020 Student Accommodation Plan Abstract
SECTION 2 BALANCING ENROLLMENT TO CAPACITY
A. Criteria for Educational Location Option (ELO) B. The Requirement to Balance Enrollment to Capacity C. Options for Balancing Enrollment to Capacity
SECTION 3 ACTUAL 2018-19 STUDENT ENROLLMENT AND SCHOOL CAPACITY ANALYSIS
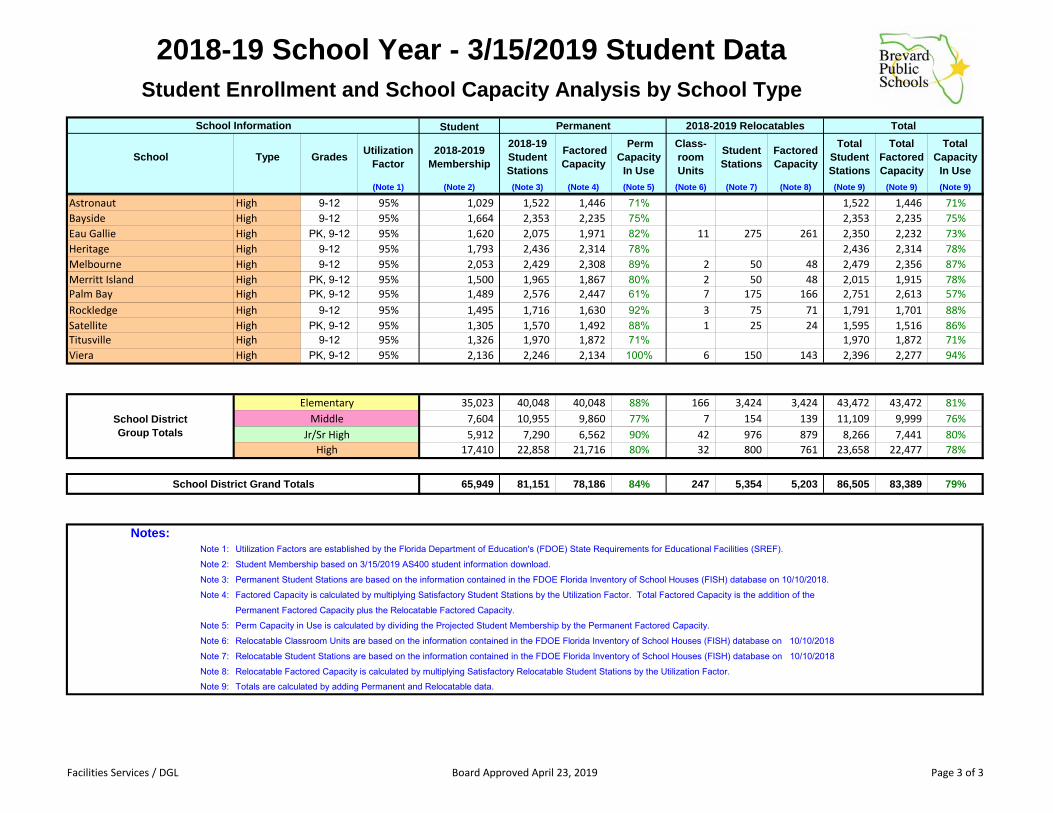
A. 2018-19 School Year – 10/12/2018 Student Data (Official Count) B. 2018-19 School Year – 3/15/2018 Student Data (Reference Only)
SECTION 4 2018-19 STUDENT ENROLLMENT AND ATTENDANCE BOUNDARIES ANALYSIS
A. Overview of Feeder System and From To Analysis B. Feeder System Chart For 2019-2020 School Year Enrollment Projections C. From To Charts
1. Brevard Public Elementary Schools: From To Chart2. Brevard Public Middle Schools: From To Chart3. Brevard Public High Schools: From To Chart4. Brevard Charter Schools: From Analysis
SECTION 5 ENROLLMENT PROJECTIONS AND CAPACITY ANALYSIS
A. School Years 2018-19 to 2023-24 Student Enrollment Projections and School Capacity Analysis B. Projections Accuracy for 2018-19 School Year
SECTION 6 RELOCATABLE CLASSROOM CHANGES PROPOSED FOR 2019-2020
A. Proposed Relocatable Classroom Changes Summer 2019 B. 2019-20 School Year Proposed Relocatable Changes C. Relocatable Inventory School Year 2018-2019

School Board of Brevard County FY 2019-2020 Student Accommodation Plan
Facilities Services / DGL Board Approved April 23, 2019
SECTION 7 ATTENDANCE BOUNDARY CHANGES APPROVED
FOR 2019-2020
A. Attendance Boundary Change Process B. 01-22-2019 School Board Meeting & Public Hearing - Attendance Boundary Changes for the
2019-20 School Year C. 02-12-2019 School Board Meeting & Public Hearing - Attendance Boundary Changes for the
2019-20 School Year D. Approved Attendance Boundary Change Maps
1. Longleaf to Quest Attendance Boundary Changes 2. Hoover to DeLaura Attendance Boundary Changes 3. Pinewood to Mims Attendance Boundary Changes
E. Pinewood Elementary/Mims Elementary Attendance Boundary Change, Affected Students Data and Analysis
SECTION 8 HISTORIC STUDENT ENROLLMENT DATA
A. Actual Student Enrollment for School Years 2005-06 to 2018-19 and Projected Student Enrollment for 2019-20 to 2023-24
B. Total Public School Membership 1960-2018 and Projected Membership Fall 2019-2023 (Chart) C. Enrollment History and Projections For BPS, Charter Schools, and Special Centers (Chart)
SECTION 9 GEOGRAPHIC INFORMATION SYSTEM
ENROLLMENT AND CAPACITY ANALYSIS
A. Geographic Capacity Analysis Overview B. Elementary School Analysis
1. 2018 – 2019 Elementary Student Enrollment and Permanent Capacity Utilization 2. 2018 – 2019 Elementary Student Enrollment and Total Capacity Utilization 3. 2023 – 2024 Elementary Student Enrollment and Permanent Capacity Utilization 4. 2023 – 2024 Elementary Student Enrollment and Total Capacity Utilization
C. Middle School Analysis 1. 2018 – 2019 Middle School Student Enrollment and Permanent Capacity Utilization 2. 2018 – 2019 Middle School Student Enrollment and Total Capacity Utilization 3. 2023 – 2024 Middle School Student Enrollment and Permanent Capacity Utilization 4. 2023 – 2024 Middle School Student Enrollment and Total Capacity Utilization
D. High School Analysis 1. 2018 – 2019 High School Student Enrollment and Permanent Capacity Utilization 2. 2018 – 2019 High School Student Enrollment and Total Capacity Utilization 3. 2023 – 2024 High School Student Enrollment and Permanent Capacity Utilization 4. 2023 – 2024 High School Student Enrollment and Total Capacity Utilization

School Board of Brevard County FY 2019-2020 Student Accommodation Plan
Facilities Services / DGL Board Approved April 23, 2019
SECTION 1
OVERVIEW
A. Introduction to the Student Accommodation Plan B. Components of Facilities Planning C. 2019-2020 Student Accommodation Plan Abstract

School Board of Brevard County FY 2019-2020 Student Accommodation Plan _______________________________________________________________________________________________
_______________________________________________________________________________________________ Facilities Services / DGL Board Approved April 23, 2019
Introduction to the Student Accommodation Plan The Student Accommodation Plan is prepared by the Facilities Services Department every spring and approved by the School Board prior to the summer break. The School Board has adopted this document, which compares projected student enrollment to projected school capacities, as a planning tool for the next school year. After the Student Accommodation Plan is approved, it is implemented throughout the District. The information compiled in this document comes from several different sources. Financial
Services and Facilities Services work together to provide the projected student enrollment for the School District. Facilities Services provides the school capacities, permanent and relocatable, from the Florida Inventory of School Houses (FISH) database. School Principals and Assistant Superintendents of Leading and Learning estimate their need for space to accommodate students based on the school programs and student enrollment projections.
Demographic shifts may cause some schools to exceed their capacity while leaving other schools under-utilized. Brevard Public Schools (BPS) has several options available to balance student populations and more efficiently utilize the existing schools. One of the least disruptive options is to build new capacity, but this is also the most expensive option. On the other end of the spectrum, attendance boundary changes can be very disruptive and represent one of the most controversial strategies for balancing enrollment. Other strategies to accommodate students and provide the necessary educational capacity include options such as “freezing” schools to out-of-area students and capping schools or special programs.
Because attendance boundary changes can be very disruptive to an existing community, this strategy is evolving to be proactive – ahead of residential growth, rather than reactive. This strategic shift aims to adjust boundaries before whole communities are built. Attendance boundary changes can also be generated from the community. In some cases, a boundary line no longer makes logical sense and a change is requested by a neighborhood or community.
School capacities contained in this Student Accommodation Plan are based on the FISH database as of October 10, 2018. The school capacities are then recalculated for projection years to include proposed future capacity changes.

School Board of Brevard County FY 2019-2020 Student Accommodation Plan _______________________________________________________________________________________________
_______________________________________________________________________________________________ Facilities Services / DGL Board Approved April 23, 2019
Components of Facilities Planning
Overview The Facilities Services Planning Department is responsible for ensuring that adequate and appropriate facilities are available for the students, their teachers, administrators and support staff. Planning goals include utilizing existing capacity efficiently, ensuring that there are no schools over capacity, and working with communities to consider neighborhood issues in the planning process. The planning staff forecasts 1-year, 5-year, 10-year and 20-year plans for public school facilities. Some of these forecasts are required by Florida Statute and must be submitted for approval to the Florida Department of Education (FDOE). Others, in particular the Student Accommodation Plan (SAP), are not required by the FDOE but are an integral part of the District’s planning process. A. Educational Plant Survey (EPS) The EPS is a document containing all of the facility improvements (new construction and remodeling/renovation of existing space, and use of relocatable classrooms) that have been approved by the Florida Department of Education (FDOE). It is also the basis of the District’s annual Five Year Facilities Work Plan. The purpose of the EPS is to document the facility needs of the School District on a school-by-school basis and to identify which capital projects may be initiated. By statute, a new EPS supersedes all previous EPS submittals. Recommendations in a previous EPS that have not been implemented are not eligible for the expenditure of capital outlay funds unless recommended in the newest EPS. The EPS must be prepared and submitted for approval every five years at a minimum, but intermediate updates, called “spot surveys” may be submitted at any time in order to obtain FDOE approvals for changes to the plan. Also, an entire new EPS can be submitted rather than a “spot survey.” Brevard County’s active and approved EPS is Number 5 Version 1. The EPS was approved by the School Board on 12/12/2017 and expires on 6/30/2023. It is important to note that facility improvements must be contained in the approved EPS in order to finance the improvement with any “state” funds (Public Education Capital Outlay or PECO, and 1.5-mil local tax dollars). Five Year District Facilities Work Plan The Five Year District Facilities Work Plan, often referred to as the “Five Year Plan”, must be updated and submitted annually to the FDOE for approval by October 1 of each year. This document includes all of the facility improvements (new construction,

School Board of Brevard County FY 2019-2020 Student Accommodation Plan _______________________________________________________________________________________________
_______________________________________________________________________________________________ Facilities Services / DGL Board Approved April 23, 2019
remodeling/renovation of existing space and maintenance) that the District plans to undertake in the next five (5) years, with long range projections for ten (10) years and twenty (20) years. All facility improvements contained in the Five Year Work Plan must be included in the currently-approved EPS in order to finance the improvement with state funds. Improvements funded with locally generated revenue (impact fees, sales tax, local bonds) are not required to be contained in the approved EPS.
B. Student Accommodation Plan The Student Accommodation Plan (SAP) provides detailed data about the school capacities, actual enrollment, and projected enrollment for five (5) years. The information compiled in the preparation of this document comes from several different sources. Facilities Services, in partnership with Financial Services, provides the data related to projected student enrollment for the School District. Facilities Services provides the permanent and relocatable school capacities from the Florida Inventory of School Houses (FISH) Database. School Principals and Assistant Superintendents estimate their need for space to accommodate students based on the programs and membership projections for the following year. C. Student Membership Projections Student membership projections are an essential component of facilities planning. The membership projection process begins in October of each year to develop student projections for the following school year. Financial Services develops student membership projections for the next school year based on trend analyses of cohort survival data and feeder chains. These preliminary projections are modified based on input from the School Principals and Assistant Superintendents, then finalized at an Enrollment Projection Management Conference. The final projections are submitted to the FDOE for budgeting purposes. Facilities Services uses geospatial analysis of the local government development data, birth rate data, mobility rates and matriculation rates to calculate student membership projections for the next ten (10) years. Further analysis takes into account any potential redistricting or students with special consideration from previous redistricting. A five year student enrollment projection is then created by using the Financial Services projections for the next school year, then indexing the Facilities Services projections for the following four years. This unified set of projections is used for all School District purposes (including FDOE reporting and school concurrency).

School Board of Brevard County FY 2019-2020 Student Accommodation Plan _______________________________________________________________________________________________
_______________________________________________________________________________________________ Facilities Services / DGL Board Approved April 23, 2019
These projections may be modified in the spring to reflect any changes due to redistricting, but the total number of students forecast will remain the same since that figure was provided to the FDOE in December to determine the District’s budget for the next fiscal year. D. School Capacity
The determination of school capacity impacts almost every aspect of district operations including:
1. Planning of new schools and additions 2. Renovations and upgrades to existing schools 3. Providing transportation for students 4. Establishing attendance boundaries 5. Allocation of relocatable classrooms 6. Providing classrooms for special programs such as exceptional education classes
(ESE), and magnet programs For Brevard Public Schools, capacity assessments utilize the Florida Inventory of School Houses (FISH), which is based on the Florida Department of Education (FDOE) formulas and allowances. However, other measures relative to capacity play important roles in decisions that affect facility planning. These include Program Capacity, Level of Service (LOS), and legislative directives such as Class Size Reduction. 1. FISH Capacity: The Florida Inventory of School Houses (FISH) is the database used
by the Department of Education for all parcels, buildings, and rooms in Florida public educational facilities. FISH capacity is the number of students that may be housed in a facility at any given time, based upon the number of existing satisfactory student stations. The FISH system includes both permanent and relocatable student stations. When a school is built, its spaces are assigned a design code. Each design code carries either a fixed number of student stations or a number that may vary for common areas, like gymnasiums, depending on the total capacity of the school. Factored Permanent FISH Capacity is the permanent capacity of the school (relocatables not included) multiplied by a “utilization factor” established by the Florida Department of Education’s (FDOE) State Requirements for Educational Facilities (SREF). This reduction is essentially an adjustment for operational realities that prevent all classrooms from being used at the maximum capacity at all times during the day. Brevard Utilization Factors are: Elementary Utilization Factor .................. 1.00 Middle Utilization Factor .......................... 0.90 Jr./Sr. High Utilization Factor ................. 0.90 Senior High Utilization Factor ..................... 0.95

School Board of Brevard County FY 2019-2020 Student Accommodation Plan _______________________________________________________________________________________________
_______________________________________________________________________________________________ Facilities Services / DGL Board Approved April 23, 2019
2. Program Capacity: Program capacity is the “effective capacity” of a school. School
program capacity is smaller than the FISH capacity because some programs will have a maximum number of students that is less than the capacity of the space in which they are held. For example, a 7th grade classroom may have 22 student stations in FISH and a factored capacity of 90%, or 20, but it may be used for an ESE program that is allowed a maximum number of 10 students. Effectively the school’s program capacity is 10 students less than its permanent capacity. If there are only 5 students in the school with that exceptionality, however, utilization of that space would be 23% or 5/22. It simply isn’t possible to fill the space with children who do not have that exceptionality. While program capacity is variable and can change regularly based on the program offerings and use of classrooms, FISH limits the number of “program-related” student stations at a given school, largely based upon total student stations. Currently, more than 20,000 students participate in special, alternative and/or supplemental education programs that are offered by Brevard Public Schools. These programs vary from gifted programs to programs for school-aged teen parents, and are created and terminated at the discretion of the School Board. The number of students in these programs, where the programs are instituted, and how they are integrated within existing spaces are key elements that must be part of the planning process.
3. Level of Service (LOS): Level of Service (LOS) is not a measurement of capacity,
but rather the target utilization of facilities. LOS is a relatively new component in school planning, and is associated with the growth management legislation. The Interlocal Agreement (ILA) for Public School Facility Planning and School Concurrency provides that the School Board and local governments must work cooperatively to ensure that student stations are available for students associated (concurrent) with new residential development. The 2014 ILA established the LOS for the District at 100% of FISH capacity, which is calculated by dividing enrollment by factored FISH total capacity (permanent and relocatable student stations).
School Board of Brevard County FY 2019-2020 Student Accommodation Plan _______________________________________________________________________________________________
_______________________________________________________________________________________________ Facilities Services / DGL Board Approved April 23, 2019
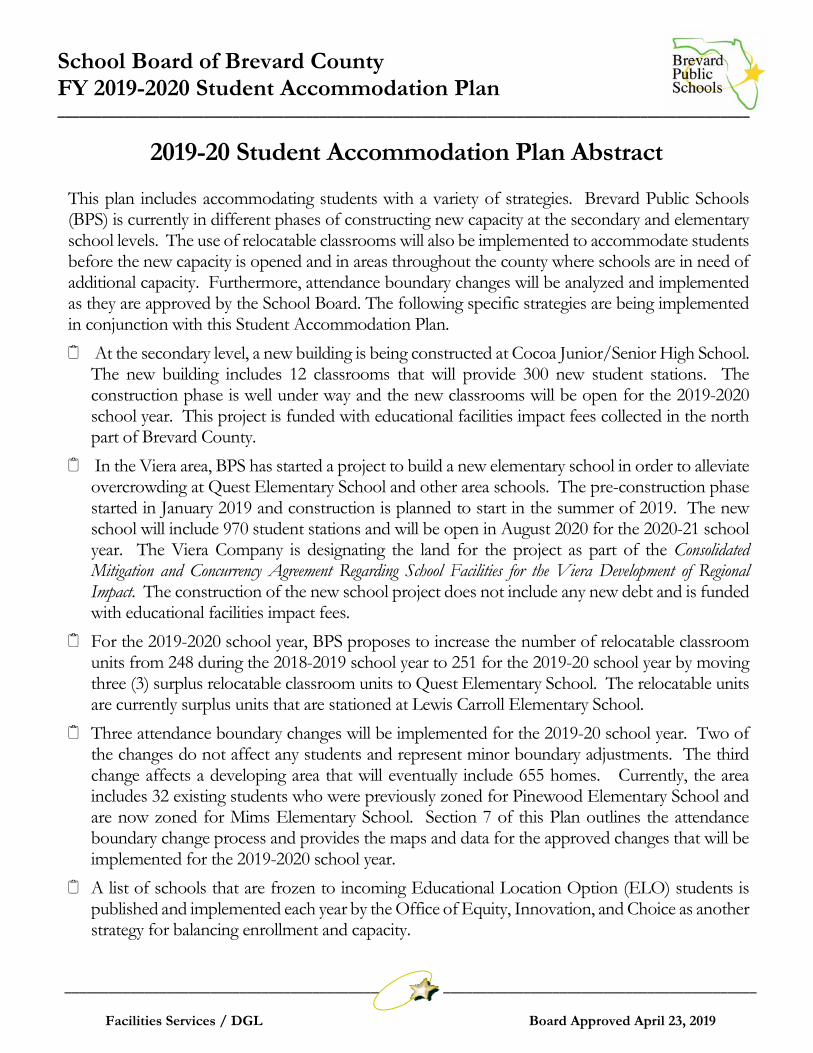
2019-20 Student Accommodation Plan Abstract This plan includes accommodating students with a variety of strategies. Brevard Public Schools (BPS) is currently in different phases of constructing new capacity at the secondary and elementary school levels. The use of relocatable classrooms will also be implemented to accommodate students before the new capacity is opened and in areas throughout the county where schools are in need of additional capacity. Furthermore, attendance boundary changes will be analyzed and implemented as they are approved by the School Board. The following specific strategies are being implemented in conjunction with this Student Accommodation Plan. At the secondary level, a new building is being constructed at Cocoa Junior/Senior High School.
The new building includes 12 classrooms that will provide 300 new student stations. The construction phase is well under way and the new classrooms will be open for the 2019-2020 school year. This project is funded with educational facilities impact fees collected in the north part of Brevard County.
In the Viera area, BPS has started a project to build a new elementary school in order to alleviate overcrowding at Quest Elementary School and other area schools. The pre-construction phase started in January 2019 and construction is planned to start in the summer of 2019. The new school will include 970 student stations and will be open in August 2020 for the 2020-21 school year. The Viera Company is designating the land for the project as part of the Consolidated Mitigation and Concurrency Agreement Regarding School Facilities for the Viera Development of Regional Impact. The construction of the new school project does not include any new debt and is funded with educational facilities impact fees.
For the 2019-2020 school year, BPS proposes to increase the number of relocatable classroom units from 248 during the 2018-2019 school year to 251 for the 2019-20 school year by moving three (3) surplus relocatable classroom units to Quest Elementary School. The relocatable units are currently surplus units that are stationed at Lewis Carroll Elementary School.
Three attendance boundary changes will be implemented for the 2019-20 school year. Two of the changes do not affect any students and represent minor boundary adjustments. The third change affects a developing area that will eventually include 655 homes. Currently, the area includes 32 existing students who were previously zoned for Pinewood Elementary School and are now zoned for Mims Elementary School. Section 7 of this Plan outlines the attendance boundary change process and provides the maps and data for the approved changes that will be implemented for the 2019-2020 school year.
A list of schools that are frozen to incoming Educational Location Option (ELO) students is published and implemented each year by the Office of Equity, Innovation, and Choice as another strategy for balancing enrollment and capacity.

School Board of Brevard County FY 2019-2020 Student Accommodation Plan
Facilities Services / DGL Board Approved April 23, 2019
SECTION 2
BALANCING ENROLLMENT TO CAPACITY
A. Criteria for Educational Location Option (ELO) B. The Requirement to Balance Enrollment to Capacity C. Options for Balancing Enrollment to Capacity

School Board of Brevard County FY 2019-2020 Student Accommodation Plan _______________________________________________________________________________________________
_______________________________________________________________________________________________ Facilities Services / DGL Board Approved April 23, 2019
Criteria for Educational Location Option (ELO) Incoming ELO
2019-2020 Brevard Public Schools Schools Frozen to Incoming Educational Location Option (ELO) Students
Schools Closed to Incoming Educational Location Option Students
Due to Projected Enrollment of 90% or Greater of Total Capacity and Recommendations Pursuant to District Policy 5120
Elementary Schools Secondary Schools Apollo Elementary Atlantis Elementary Challenger 7 Elementary * Indialantic Elementary Manatee Elementary* Pinewood Elementary Roy Allen Elementary Quest Elementary * Suntree Elementary
Melbourne High Viera High
* School projected to be greater than 100% total capacity: Educational Location Option is open to students of school-
based employees.
Note: Parents may not apply through an “Educational Location Option” to a Choice School or Magnet School. Admittance to Choice or Magnet Schools is through the online Educational Program Opportunity application process only.
School Board of Brevard County FY 2019-2020 Student Accommodation Plan _______________________________________________________________________________________________
_______________________________________________________________________________________________ Facilities Services / DGL Board Approved April 23, 2019
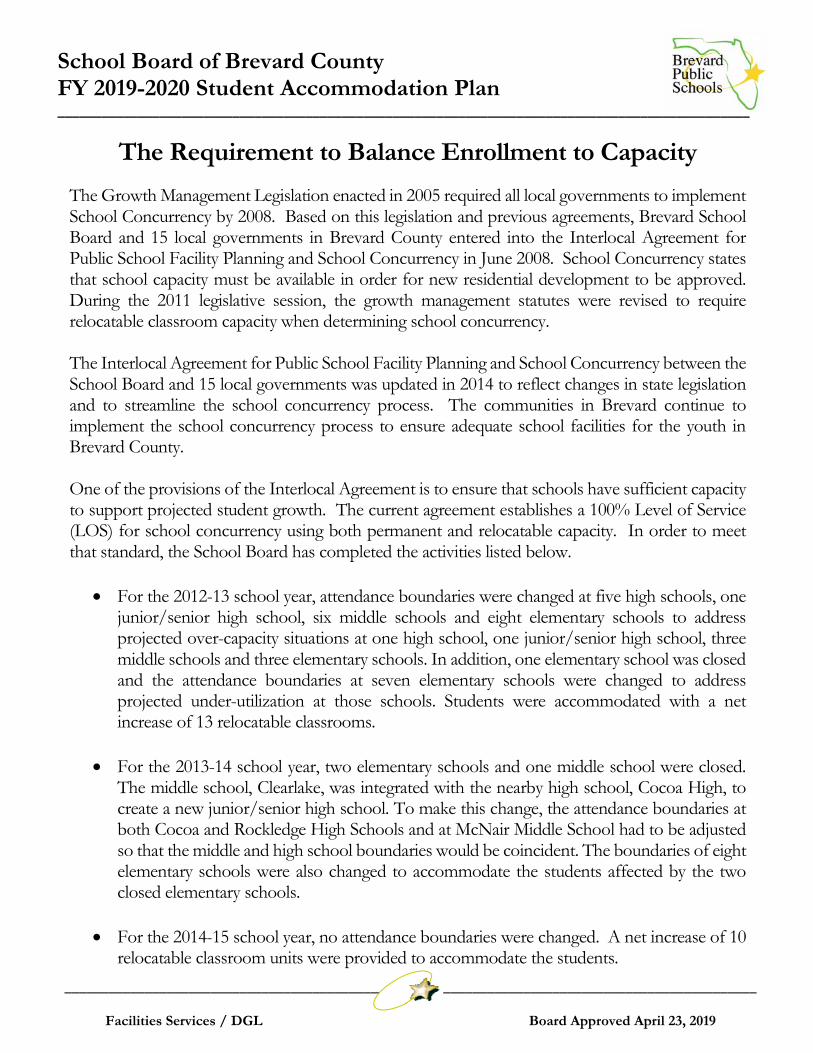
The Requirement to Balance Enrollment to Capacity The Growth Management Legislation enacted in 2005 required all local governments to implement School Concurrency by 2008. Based on this legislation and previous agreements, Brevard School Board and 15 local governments in Brevard County entered into the Interlocal Agreement for Public School Facility Planning and School Concurrency in June 2008. School Concurrency states that school capacity must be available in order for new residential development to be approved. During the 2011 legislative session, the growth management statutes were revised to require relocatable classroom capacity when determining school concurrency. The Interlocal Agreement for Public School Facility Planning and School Concurrency between the School Board and 15 local governments was updated in 2014 to reflect changes in state legislation and to streamline the school concurrency process. The communities in Brevard continue to implement the school concurrency process to ensure adequate school facilities for the youth in Brevard County. One of the provisions of the Interlocal Agreement is to ensure that schools have sufficient capacity to support projected student growth. The current agreement establishes a 100% Level of Service (LOS) for school concurrency using both permanent and relocatable capacity. In order to meet that standard, the School Board has completed the activities listed below.
• For the 2012-13 school year, attendance boundaries were changed at five high schools, one junior/senior high school, six middle schools and eight elementary schools to address projected over-capacity situations at one high school, one junior/senior high school, three middle schools and three elementary schools. In addition, one elementary school was closed and the attendance boundaries at seven elementary schools were changed to address projected under-utilization at those schools. Students were accommodated with a net increase of 13 relocatable classrooms.
• For the 2013-14 school year, two elementary schools and one middle school were closed.
The middle school, Clearlake, was integrated with the nearby high school, Cocoa High, to create a new junior/senior high school. To make this change, the attendance boundaries at both Cocoa and Rockledge High Schools and at McNair Middle School had to be adjusted so that the middle and high school boundaries would be coincident. The boundaries of eight elementary schools were also changed to accommodate the students affected by the two closed elementary schools.
• For the 2014-15 school year, no attendance boundaries were changed. A net increase of 10
relocatable classroom units were provided to accommodate the students.

School Board of Brevard County FY 2019-2020 Student Accommodation Plan _______________________________________________________________________________________________
_______________________________________________________________________________________________ Facilities Services / DGL Board Approved April 23, 2019
• For the 2015-16 school year, no attendance boundaries were changed. Students were
accommodated with a net increase of 7 relocatable classrooms.
• For the 2016-17 school year, no attendance boundaries were changed. Students were accommodated with a net increase of 1 relocatable classroom.
• For the 2017-18 school year, no attendance boundaries were changed. A net increase of 17
relocatable classrooms were provided to accommodate the projected students and program needs.
• For the 2018-19 school year, attendance boundary changes were approved on January 23,
2018 with the understanding that relocatable classrooms could also be used to accommodate students.
• For the 2019-20 school year, attendance boundary changes were approved on January 22,
2019 and February 12, 2019. A net increase of 3 relocatable classrooms is proposed.

School Board of Brevard County FY 2019-2020 Student Accommodation Plan _______________________________________________________________________________________________
_______________________________________________________________________________________________ Facilities Services / DGL Board Approved April 23, 2019
Options for Balancing Enrollment to Capacity At the first signs that schools may reach their maximum capacity, the Facilities Services Department works with the Assistant Superintendent of Leading and Learning to identify and implement any space management approaches that will maximum the school capacity. In some schools, computer labs have been converted to classrooms and then mobile computers are used within any classroom. Other schools have implemented “Art on a Cart” where the art room becomes a permanent classroom and art class moves throughout the school. Once all of the creative and appropriate space management approaches are exhausted, the options in this section are explored.
The options available to the School Board to balance a school’s student enrollment to its capacity vary in cost and disruption. The options include:
1. Construct new capacity. 2. Add relocatable classroom buildings. 3. “Freeze” schools to out-of-area students. 4. Cap Choice and Special programs. 5. Cap enrollment at permanent capacity and bus new students to schools that have available capacity.
(Cap and Bus) 6. Change school attendance boundaries. (Redistricting) 7. Multi-track, year-round school operations. 8. Split sessions (one group of students using a facility in the morning and another group using the
same facility in the afternoon/early evening). 9. Close under-capacity schools to better utilize facilities and resources.
1. Construct New Capacity Adding new capacity is typically the most expensive option. All other options can be implemented solely at the discretion of the School Board. Construction of new capacity with locally generated funds (impact fees, sales tax, etc.) does not require FDOE approval, but constructing new capacity requires approval of the Florida Department of Education (FDOE) if state funds are to be used. 2. Add Relocatable Classrooms The District owns 35 surplus relocatable buildings that are currently suitable for classroom use. These classrooms can be used to mitigate temporary capacity issues and to provide the additional capacity that some special programs require. 3. “Freeze” Schools to Out-Of-Area Students Policy 5120 freezes schools that are over 90% of their total capacity to incoming students. Additionally, schools are frozen when it is in the best interest of the School District due to unusual circumstances.
4. Cap on Choice and Special Programs Policy 7120 caps enrollment in choice and special programs to 100% of the total capacity of the school. 5. Cap Enrollment at Permanent Capacity and Bus New Students to Schools That Have Available Capacity (“Cap and Bus”) This option is sometimes used when an over-capacity situation is believed to be temporary in nature (a new school is under construction, projected declining enrollment at an over capacity school, etc.) or when none of the less disruptive options are feasible.

School Board of Brevard County FY 2019-2020 Student Accommodation Plan _______________________________________________________________________________________________
_______________________________________________________________________________________________ Facilities Services / DGL Board Approved April 23, 2019
6. Change School Attendance Boundaries - Redistricting Redistricting is the process of changing the attendance boundary of a school to move students from an over-crowded school to adjacent schools that have fewer students than capacity. It is typically one of the most challenging responsibilities of a School Board. Traditionally, the School District has used “hard” redistricting to establish an attendance boundary for a new school or to change an attendance boundary for a school that is over capacity. Students within the redistricted area must attend a different school the following year. Typically, rising sixth, eighth, eleventh and twelfth graders are granted special consideration, allowing them to complete their education at their current school. 7. Multi-Track Year-Round School Operations When multi-track year-round school scheduling is implemented, it increases the effective capacity of a school by 33% because the school will be in use during the summer months. There are cost and operational impacts associated with this option. 8. Split Sessions This option involves splitting the student body into two groups. One group attends school from early in the morning to about noon. The other group attends from noon to late in the afternoon. While this option effectively doubles a schools capacity, there is less time for each group than there would be under normal scheduling. 9. School Closing If schools are under-utilized in an area of projected stable or declining enrollment, the School Board may choose to close one or more of those schools if the adjacent schools have sufficient capacity to serve the students from the closed school(s).

School Board of Brevard County FY 2019-2020 Student Accommodation Plan
Facilities Services / DGL Board Approved April 23, 2019
SECTION 3
ACTUAL 2018-19 STUDENT ENROLLMENT AND
SCHOOL CAPACITY ANALYSIS
A. 2018-19 School Year – 10/12/2018 Student Data (Official Count)
B. 2018-19 School Year – 3/15/2018 Student Data (Reference Only)

Facilities Services / DGL Board Approved April 23, 2019 Page 1 of 3
School Information Student Permanent 2018-2019 Relocatables Total
School Type Grades Utilization Factor
2018-2019 Membership
2018-19 Student Stations
Factored Capacity
Perm Capacity
In Use
Class-room Units
Student Stations
Factored Capacity
Total Student Stations
Total Factored Capacity
Total Capacity
In Use(Note 1) (Note 2) (Note 3) (Note 4) (Note 5) (Note 6) (Note 7) (Note 8) (Note 9) (Note 9) (Note 9)
Allen Elementary PK-6 100% 711 663 663 107% 5 88 88 751 751 95%Andersen Elementary K-6 100% 720 840 840 86% 2 44 44 884 884 81%Apollo Elementary K-6 100% 847 902 902 94% 902 902 94%Atlantis Elementary PK-6 100% 713 703 703 101% 2 36 36 739 739 97%Audubon Elementary PK-6 100% 536 761 761 70% 761 761 70%Cambridge Elementary PK-6 100% 661 649 649 102% 6 116 116 765 765 86%Cape View Elementary PK-6 100% 381 548 548 70% 548 548 70%Carroll Elementary K-6 100% 664 751 751 88% 751 751 88%Challenger 7 Elementary PK-6 100% 571 551 551 104% 1 22 22 573 573 100%Columbia Elementary PK-6 100% 478 685 685 70% 3 66 66 751 751 64%Coquina Elementary K-6 100% 515 645 645 80% 3 66 66 711 711 72%Creel Elementary PK-6 100% 845 1,088 1,088 78% 3 66 66 1,154 1,154 73%Croton Elementary PK-6 100% 552 707 707 78% 4 88 88 795 795 69%Discovery Elementary PK-6 100% 644 826 826 78% 7 154 154 980 980 66%Endeavour Elementary PK-6 100% 662 852 852 78% 7 138 138 990 990 67%Enterprise Elementary K-6 100% 599 707 707 85% 1 22 22 729 729 82%Fairglen Elementary PK-6 100% 681 753 753 90% 2 36 36 789 789 86%Freedom 7 Elementary K-6 100% 387 453 453 85% 1 22 22 475 475 82%Gemini Elementary K-6 100% 468 667 667 70% 2 44 44 711 711 66%Golfview Elementary PK-6 100% 555 689 689 81% 4 88 88 777 777 71%Harbor City Elementary PK-6 100% 371 453 453 82% 8 176 176 629 629 59%Holland Elementary PK-6 100% 497 605 605 82% 605 605 82%Imperial Estates Elementary K-6 100% 639 729 729 88% 729 729 88%Indialantic Elementary K-6 100% 740 754 754 98% 2 44 44 798 798 93%Jupiter Elementary PK-6 100% 728 780 780 93% 7 150 150 930 930 78%Lockmar Elementary PK-6 100% 699 892 892 78% 892 892 78%Longleaf Elementary PK-6 100% 647 790 790 82% 790 790 82%Manatee Elementary K-6 100% 949 866 866 110% 5 88 88 954 954 100%McAuliffe Elementary PK-6 100% 777 754 754 103% 8 164 164 918 918 85%Meadowlane Intermediate Elementary 3-6 100% 868 894 894 97% 11 220 220 1,114 1,114 78%Meadowlane Primary Elementary K-6 100% 626 824 824 76% 824 824 76%Mila Elementary PK-6 100% 465 707 707 66% 707 707 66%Mims Elementary PK-6 100% 479 725 725 66% 725 725 66%Oak Park Elementary PK-6 100% 723 906 906 80% 3 62 62 968 968 75%Ocean Breeze Elementary PK-6 100% 532 498 498 107% 8 156 156 654 654 81%
2018-19 School Year - 10/12/2018 Student DataStudent Enrollment and School Capacity Analysis by School Type

Facilities Services / DGL Board Approved April 23, 2019 Page 2 of 3
School Information Student Permanent 2018-2019 Relocatables Total
School Type Grades Utilization Factor
2018-2019 Membership
2018-19 Student Stations
Factored Capacity
Perm Capacity
In Use
Class-room Units
Student Stations
Factored Capacity
Total Student Stations
Total Factored Capacity
Total Capacity
In Use(Note 1) (Note 2) (Note 3) (Note 4) (Note 5) (Note 6) (Note 7) (Note 8) (Note 9) (Note 9) (Note 9)
2018-19 School Year - 10/12/2018 Student DataStudent Enrollment and School Capacity Analysis by School Type
Palm Bay Elementary PK-6 100% 615 829 829 74% 8 176 176 1,005 1,005 61%Pinewood Elementary PK-6 100% 517 485 485 107% 4 84 84 569 569 91%Port Malabar Elementary PK-6 100% 688 768 768 90% 4 84 84 852 852 81%Quest Elementary PK-6 100% 1,089 910 910 120% 7 112 112 1,022 1,022 107%Riviera Elementary PK-6 100% 692 689 689 100% 4 88 88 777 777 89%Roosevelt Elementary K-6 100% 380 599 599 63% 599 599 63%Sabal Elementary PK-6 100% 538 679 679 79% 5 106 106 785 785 69%Saturn Elementary PK-6 100% 853 848 848 101% 6 128 128 976 976 87%Sea Park Elementary PK-6 100% 321 461 461 70% 461 461 70%Sherwood Elementary PK-6 100% 456 609 609 75% 609 609 75%South Lake Elementary K-6 100% 311 481 481 65% 481 481 65%Stevenson Elementary K-6 100% 506 569 569 89% 569 569 89%Sunrise Elementary PK-6 100% 820 895 895 92% 1 18 18 913 913 90%Suntree Elementary K-6 100% 675 689 689 98% 3 66 66 755 755 89%Surfside Elementary K-6 100% 460 421 421 109% 6 120 120 541 541 85%Tropical Elementary K-6 100% 825 910 910 91% 910 910 91%Turner Elementary PK-6 100% 562 830 830 68% 2 44 44 874 874 64%University Park Elementary PK-6 100% 473 679 679 70% 6 132 132 811 811 58%West Melbourne Elementary K-6 100% 553 618 618 90% 618 618 90%Westside Elementary K-6 100% 769 835 835 92% 1 22 22 857 857 90%Williams Elementary PK-6 100% 582 627 627 93% 4 88 88 715 715 81%Central Middle 7-8 90% 1,193 1,694 1,525 78% 1,694 1,525 78%DeLaura Middle 7-8 90% 819 1,043 939 87% 1,043 939 87%Hoover Middle 7-8 90% 506 732 659 77% 732 659 77%Jackson Middle 7-8 90% 548 727 654 84% 727 654 84%Jefferson Middle 7-8 90% 660 949 854 77% 949 854 77%Johnson Middle 7-8 90% 736 1,111 1,000 74% 1,111 1,000 74%Kennedy Middle 7-8 90% 611 749 674 91% 7 154 139 903 813 75%Madison Middle 7-8 90% 492 825 743 66% 825 743 66%McNair Middle 7-8 90% 480 679 611 79% 679 611 79%Southwest Middle 7-8 90% 833 1,308 1,177 71% 1,308 1,177 71%Stone Middle 7-8 90% 791 1,138 1,024 77% 1,138 1,024 77%Cocoa Jr / Sr High PK, 7-12 90% 1,577 1,730 1,557 101% 10 250 225 1,980 1,782 89%Cocoa Beach Jr / Sr High 7-12 90% 1,013 1,253 1,128 90% 15 375 338 1,628 1,466 69%Edgewood Jr / Sr High 7-12 90% 948 1,100 990 96% 6 91 82 1,191 1,072 88%Space Coast Jr / Sr High 7-12 90% 1,586 1,975 1,778 89% 4 88 79 2,063 1,857 85%West Shore Jr / Sr High 7-12 90% 953 1,232 1,109 86% 7 172 155 1,404 1,264 75%

Facilities Services / DGL Board Approved April 23, 2019 Page 3 of 3
School Information Student Permanent 2018-2019 Relocatables Total
School Type Grades Utilization Factor
2018-2019 Membership
2018-19 Student Stations
Factored Capacity
Perm Capacity
In Use
Class-room Units
Student Stations
Factored Capacity
Total Student Stations
Total Factored Capacity
Total Capacity
In Use(Note 1) (Note 2) (Note 3) (Note 4) (Note 5) (Note 6) (Note 7) (Note 8) (Note 9) (Note 9) (Note 9)
2018-19 School Year - 10/12/2018 Student DataStudent Enrollment and School Capacity Analysis by School Type
Astronaut High 9-12 95% 1,076 1,522 1,446 74% 1,522 1,446 74%Bayside High 9-12 95% 1,706 2,353 2,235 76% 2,353 2,235 76%Eau Gallie High PK, 9-12 95% 1,676 2,075 1,971 85% 11 275 261 2,350 2,232 75%Heritage High 9-12 95% 1,831 2,436 2,314 79% 2,436 2,314 79%Melbourne High 9-12 95% 2,113 2,429 2,308 92% 2 50 48 2,479 2,356 90%Merritt Island High PK, 9-12 95% 1,542 1,965 1,867 83% 2 50 48 2,015 1,915 81%Palm Bay High PK, 9-12 95% 1,543 2,576 2,447 63% 7 175 166 2,751 2,613 59%Rockledge High 9-12 95% 1,516 1,716 1,630 93% 3 75 71 1,791 1,701 89%Satellite High PK, 9-12 95% 1,328 1,570 1,492 89% 1 25 24 1,595 1,516 88%Titusville High 9-12 95% 1,381 1,970 1,872 74% 1,970 1,872 74%Viera High PK, 9-12 95% 2,157 2,246 2,134 101% 6 150 143 2,396 2,277 95%
34,615 40,048 40,048 86% 166 3,424 3,424 43,472 43,472 80%7,669 10,955 9,860 78% 7 154 139 11,109 9,999 77%6,077 7,290 6,562 93% 42 976 879 8,266 7,441 82%
17,869 22,858 21,716 82% 32 800 761 23,658 22,477 80%
School District Grand Totals 66,230 81,151 78,186 85% 247 5,354 5,203 86,505 83,389 79%
Notes:Note 1: Utilization Factors are established by the Florida Department of Education's (FDOE) State Requirements for Educational Facilities (SREF).
Note 2: Student Membership based on 10/12/2018 AS400 student information download.
Note 3: Permanent Student Stations are based on the information contained in the FDOE Florida Inventory of School Houses (FISH) database on 10/10/2018.
Note 4: Factored Capacity is calculated by multiplying Satisfactory Student Stations by the Utilization Factor. Total Factored Capacity is the addition of the
Permanent Factored Capacity plus the Relocatable Factored Capacity.
Note 5: Perm Capacity in Use is calculated by dividing the Projected Student Membership by the Permanent Factored Capacity.
Note 6: Relocatable Classroom Units are based on the information contained in the FDOE Florida Inventory of School Houses (FISH) database on 10/10/2018
Note 7: Relocatable Student Stations are based on the information contained in the FDOE Florida Inventory of School Houses (FISH) database on 10/10/2018
Note 8: Relocatable Factored Capacity is calculated by multiplying Satisfactory Relocatable Student Stations by the Utilization Factor.Note 9: Totals are calculated by adding Permanent and Relocatable data.
School District Group Totals
ElementaryMiddle
Jr/Sr HighHigh

Facilities Services / DGL Board Approved April 23, 2019 Page 1 of 3
School Information Student Permanent 2018-2019 Relocatables Total
School Type Grades Utilization Factor
2018-2019 Membership
2018-19 Student Stations
Factored Capacity
Perm Capacity
In Use
Class-room Units
Student Stations
Factored Capacity
Total Student Stations
Total Factored Capacity
Total Capacity
In Use(Note 1) (Note 2) (Note 3) (Note 4) (Note 5) (Note 6) (Note 7) (Note 8) (Note 9) (Note 9) (Note 9)
Allen Elementary PK-6 100% 726 663 663 110% 5 88 88 751 751 97%Andersen Elementary K-6 100% 733 840 840 87% 2 44 44 884 884 83%Apollo Elementary K-6 100% 853 902 902 95% 902 902 95%Atlantis Elementary PK-6 100% 718 703 703 102% 2 36 36 739 739 97%Audubon Elementary PK-6 100% 521 761 761 69% 761 761 69%Cambridge Elementary PK-6 100% 680 649 649 105% 6 116 116 765 765 89%Cape View Elementary PK-6 100% 368 548 548 67% 548 548 67%Carroll Elementary K-6 100% 663 751 751 88% 751 751 88%Challenger 7 Elementary PK-6 100% 580 551 551 105% 1 22 22 573 573 101%Columbia Elementary PK-6 100% 487 685 685 71% 3 66 66 751 751 65%Coquina Elementary K-6 100% 523 645 645 81% 3 66 66 711 711 74%Creel Elementary PK-6 100% 860 1,088 1,088 79% 3 66 66 1,154 1,154 75%Croton Elementary PK-6 100% 543 707 707 77% 4 88 88 795 795 68%Discovery Elementary PK-6 100% 684 826 826 83% 7 154 154 980 980 70%Endeavour Elementary PK-6 100% 646 852 852 76% 7 138 138 990 990 65%Enterprise Elementary K-6 100% 603 707 707 85% 1 22 22 729 729 83%Fairglen Elementary PK-6 100% 667 753 753 89% 2 36 36 789 789 85%Freedom 7 Elementary K-6 100% 376 453 453 83% 1 22 22 475 475 79%Gemini Elementary K-6 100% 471 667 667 71% 2 44 44 711 711 66%Golfview Elementary PK-6 100% 562 689 689 82% 4 88 88 777 777 72%Harbor City Elementary PK-6 100% 382 453 453 84% 8 176 176 629 629 61%Holland Elementary PK-6 100% 505 605 605 84% 605 605 84%Imperial Estates Elementary K-6 100% 634 729 729 87% 729 729 87%Indialantic Elementary K-6 100% 741 754 754 98% 2 44 44 798 798 93%Jupiter Elementary PK-6 100% 755 780 780 97% 7 150 150 930 930 81%Lockmar Elementary PK-6 100% 733 892 892 82% 892 892 82%Longleaf Elementary PK-6 100% 637 790 790 81% 790 790 81%Manatee Elementary K-6 100% 971 866 866 112% 5 88 88 954 954 102%McAuliffe Elementary PK-6 100% 789 754 754 105% 8 164 164 918 918 86%Meadowlane Intermediate Elementary 3-6 100% 893 894 894 100% 11 220 220 1,114 1,114 80%Meadowlane Primary Elementary K-6 100% 649 824 824 79% 824 824 79%Mila Elementary PK-6 100% 476 707 707 67% 707 707 67%Mims Elementary PK-6 100% 488 725 725 67% 725 725 67%Oak Park Elementary PK-6 100% 712 906 906 79% 3 62 62 968 968 74%Ocean Breeze Elementary PK-6 100% 542 498 498 109% 8 156 156 654 654 83%
2018-19 School Year - 3/15/2019 Student DataStudent Enrollment and School Capacity Analysis by School Type

Facilities Services / DGL Board Approved April 23, 2019 Page 2 of 3
School Information Student Permanent 2018-2019 Relocatables Total
School Type Grades Utilization Factor
2018-2019 Membership
2018-19 Student Stations
Factored Capacity
Perm Capacity
In Use
Class-room Units
Student Stations
Factored Capacity
Total Student Stations
Total Factored Capacity
Total Capacity
In Use(Note 1) (Note 2) (Note 3) (Note 4) (Note 5) (Note 6) (Note 7) (Note 8) (Note 9) (Note 9) (Note 9)
2018-19 School Year - 3/15/2019 Student DataStudent Enrollment and School Capacity Analysis by School Type
Palm Bay Elementary PK-6 100% 634 829 829 77% 8 176 176 1,005 1,005 63%Pinewood Elementary PK-6 100% 526 485 485 109% 4 84 84 569 569 92%Port Malabar Elementary PK-6 100% 692 768 768 90% 4 84 84 852 852 81%Quest Elementary PK-6 100% 1,123 910 910 123% 7 112 112 1,022 1,022 110%Riviera Elementary PK-6 100% 690 689 689 100% 4 88 88 777 777 89%Roosevelt Elementary K-6 100% 379 599 599 63% 599 599 63%Sabal Elementary PK-6 100% 566 679 679 83% 5 106 106 785 785 72%Saturn Elementary PK-6 100% 863 848 848 102% 6 128 128 976 976 88%Sea Park Elementary PK-6 100% 333 461 461 72% 461 461 72%Sherwood Elementary PK-6 100% 455 609 609 75% 609 609 75%South Lake Elementary K-6 100% 296 481 481 62% 481 481 62%Stevenson Elementary K-6 100% 505 569 569 89% 569 569 89%Sunrise Elementary PK-6 100% 799 895 895 89% 1 18 18 913 913 88%Suntree Elementary K-6 100% 682 689 689 99% 3 66 66 755 755 90%Surfside Elementary K-6 100% 460 421 421 109% 6 120 120 541 541 85%Tropical Elementary K-6 100% 831 910 910 91% 910 910 91%Turner Elementary PK-6 100% 593 830 830 71% 2 44 44 874 874 68%University Park Elementary PK-6 100% 489 679 679 72% 6 132 132 811 811 60%West Melbourne Elementary K-6 100% 545 618 618 88% 618 618 88%Westside Elementary K-6 100% 784 835 835 94% 1 22 22 857 857 92%Williams Elementary PK-6 100% 607 627 627 97% 4 88 88 715 715 85%Central Middle 7-8 90% 1,162 1,694 1,525 76% 1,694 1,525 76%DeLaura Middle 7-8 90% 812 1,043 939 87% 1,043 939 87%Hoover Middle 7-8 90% 501 732 659 76% 732 659 76%Jackson Middle 7-8 90% 522 727 654 80% 727 654 80%Jefferson Middle 7-8 90% 662 949 854 78% 949 854 78%Johnson Middle 7-8 90% 739 1,111 1,000 74% 1,111 1,000 74%Kennedy Middle 7-8 90% 604 749 674 90% 7 154 139 903 813 74%Madison Middle 7-8 90% 507 825 743 68% 825 743 68%McNair Middle 7-8 90% 483 679 611 79% 679 611 79%Southwest Middle 7-8 90% 831 1,308 1,177 71% 1,308 1,177 71%Stone Middle 7-8 90% 781 1,138 1,024 76% 1,138 1,024 76%Cocoa Jr / Sr High PK, 7-12 90% 1,513 1,730 1,557 97% 10 250 225 1,980 1,782 85%Cocoa Beach Jr / Sr High 7-12 90% 1,001 1,253 1,128 89% 15 375 338 1,628 1,466 68%Edgewood Jr / Sr High 7-12 90% 934 1,100 990 94% 6 91 82 1,191 1,072 87%Space Coast Jr / Sr High 7-12 90% 1,522 1,975 1,778 86% 4 88 79 2,063 1,857 82%West Shore Jr / Sr High 7-12 90% 942 1,232 1,109 85% 7 172 155 1,404 1,264 75%
Facilities Services / DGL Board Approved April 23, 2019 Page 3 of 3
School Information Student Permanent 2018-2019 Relocatables Total
School Type Grades Utilization Factor
2018-2019 Membership
2018-19 Student Stations
Factored Capacity
Perm Capacity
In Use
Class-room Units
Student Stations
Factored Capacity
Total Student Stations
Total Factored Capacity
Total Capacity
In Use(Note 1) (Note 2) (Note 3) (Note 4) (Note 5) (Note 6) (Note 7) (Note 8) (Note 9) (Note 9) (Note 9)
2018-19 School Year - 3/15/2019 Student DataStudent Enrollment and School Capacity Analysis by School Type
Astronaut High 9-12 95% 1,029 1,522 1,446 71% 1,522 1,446 71%Bayside High 9-12 95% 1,664 2,353 2,235 75% 2,353 2,235 75%Eau Gallie High PK, 9-12 95% 1,620 2,075 1,971 82% 11 275 261 2,350 2,232 73%Heritage High 9-12 95% 1,793 2,436 2,314 78% 2,436 2,314 78%Melbourne High 9-12 95% 2,053 2,429 2,308 89% 2 50 48 2,479 2,356 87%Merritt Island High PK, 9-12 95% 1,500 1,965 1,867 80% 2 50 48 2,015 1,915 78%Palm Bay High PK, 9-12 95% 1,489 2,576 2,447 61% 7 175 166 2,751 2,613 57%Rockledge High 9-12 95% 1,495 1,716 1,630 92% 3 75 71 1,791 1,701 88%Satellite High PK, 9-12 95% 1,305 1,570 1,492 88% 1 25 24 1,595 1,516 86%Titusville High 9-12 95% 1,326 1,970 1,872 71% 1,970 1,872 71%Viera High PK, 9-12 95% 2,136 2,246 2,134 100% 6 150 143 2,396 2,277 94%
35,023 40,048 40,048 88% 166 3,424 3,424 43,472 43,472 81%7,604 10,955 9,860 77% 7 154 139 11,109 9,999 76%5,912 7,290 6,562 90% 42 976 879 8,266 7,441 80%
17,410 22,858 21,716 80% 32 800 761 23,658 22,477 78%
School District Grand Totals 65,949 81,151 78,186 84% 247 5,354 5,203 86,505 83,389 79%
Notes:Note 1: Utilization Factors are established by the Florida Department of Education's (FDOE) State Requirements for Educational Facilities (SREF).
Note 2: Student Membership based on 3/15/2019 AS400 student information download.
Note 3: Permanent Student Stations are based on the information contained in the FDOE Florida Inventory of School Houses (FISH) database on 10/10/2018.
Note 4: Factored Capacity is calculated by multiplying Satisfactory Student Stations by the Utilization Factor. Total Factored Capacity is the addition of the
Permanent Factored Capacity plus the Relocatable Factored Capacity.
Note 5: Perm Capacity in Use is calculated by dividing the Projected Student Membership by the Permanent Factored Capacity.
Note 6: Relocatable Classroom Units are based on the information contained in the FDOE Florida Inventory of School Houses (FISH) database on 10/10/2018
Note 7: Relocatable Student Stations are based on the information contained in the FDOE Florida Inventory of School Houses (FISH) database on 10/10/2018
Note 8: Relocatable Factored Capacity is calculated by multiplying Satisfactory Relocatable Student Stations by the Utilization Factor.Note 9: Totals are calculated by adding Permanent and Relocatable data.
School District Group Totals
ElementaryMiddle
Jr/Sr HighHigh

School Board of Brevard County FY 2019-2020 Student Accommodation Plan
Facilities Services / DGL Board Approved April 23, 2019
SECTION 4
2018-19 STUDENT ENROLLMENT AND
ATTENDANCE BOUNDARIES ANALYSIS
A. Overview of Feeder System and From To Analysis B. Feeder System Chart For 2019-2020 School Year Enrollment
Projections C. From To Analysis
1. Brevard Public Elementary Schools: From To Chart 2. Brevard Public Middle Schools: From To Chart 3. Brevard Public High Schools: From To Chart 4. Brevard Charter Schools: From Analysis

School Board of Brevard County FY 2019-2020 Student Accommodation Plan _______________________________________________________________________________________________
_______________________________________________________________________________________________ Facilities Services / DGL Board Approved April 23, 2019
Overview of Feeder System and From/To Analysis By using a Geographic Information System, the Facilities Planning Department can provide detailed analysis of the student enrollment statistics. The BPS Geographic Information System locates every student on the map using their home address and then compares that information to the location of the school boundaries. The Feeder System Chart and the From/To Analysis Charts use this locational information to provide detailed information about the student enrollment statistics. The information contained in this section of the Student Accommodation Plan is used by all of the schools and a range of departments for a variety of applications. Because the secondary schools have more students per grade, the attendance boundaries are not the same as the elementary school boundaries. In many cases, students zoned for the same elementary school are zoned for different middle schools. Likewise, students zoned for the same middle school may be zoned for different high schools. The “feeder schools” are the schools where students come from when they move to the next school level.
Each box on the Feeder System Chart shows the feeder schools that share boundaries with a higher level school. The chart also gives the percentage of the students in each school zone that are zoned for the next level school.
As an example, in the Feeder System chart, there are 3% of the students in the Apollo attendance boundary that are zoned to attend Madison Middle School. The other 97% of the students zoned for Apollo are zoned for Jackson Middle School. At the same time, 100% of the students zoned for Madison Middle School are zoned to attend Astronaut High School.
The From To Charts describe the number of students attending a school in contrast to the number of students who live in each school attendance boundary. Since there are 6 choice schools, 12 public charter schools, and numerous choice programs, a significant number of students do not attend their attendance boundary school. The information about how many students choice TO and how many students choice FROM a particular school is contained in the From To Charts. There are three “From To Charts” that represent each school level – elementary, middle, and
high school. The junior/senior high schools are shown on both the middle and high school charts. A fourth “From Analysis Chart” describes the Charter school students and the attendance boundary school where those students live.
Across the top of each chart is the school that a student is attends and along the left hand side of the chart is the school zone that the student lives in. Each cell in the chart shows the number of students that attend the school listed at the top of the chart and the zoned school along the side of the chart.
The red boxes diagonally across the middle of each chart show the number of students who attend a school and also live in that school zoning.

School Board of Brevard County FY 2019-2020 Student Accommodation Plan _______________________________________________________________________________________________
_______________________________________________________________________________________________ Facilities Services / DGL Board Approved April 23, 2019
The total number of students residing in a school boundary includes students who may or may not attend that school, choice students living in the boundary, and charter school students living in the boundary.
Students that reside within an attendance boundary and attend a different school are shown in the charts as students travelling TO another school, choice school, or charter school. These are the numbers listed in the row of each school excluding those in the red box. Since choice and charter schools do not have attendance boundaries, they do not have any TO students.
Students that do not reside within the attendance boundary of the school they attend are shown in the charts as students travelling FROM another area to attend that school. These are the numbers listed in the columns of each school excluding those in the red box. All of the charter and choice school students are counted as FROM since those schools do not have an attendance boundary.
The net number of students that go TO another school minus the number of students attending a school FROM another boundary gives the net migration of resident students.

Facilities Services / DGL Board Approved April 23, 2019 Page 1 of 1
ASTRONAUT MADISON 100% Apollo 2% VIERA DELAURA 36% Creel 9% PALM BAY STONE 77% Columbia 11%Mims 86% Holland 100% Harbor City 7%
Oak Park 100% Ocean Breeze 46% Meadowlane 9%Pinewood 100% Quest 54% Palm Bay Elem 100%
Roosevelt 21% Port Malabar 89%TITUSVILLE JACKSON 100% Apollo 98% Sea Park 100% Riviera 100%
Coquina 100% Sherwood 31% Sunrise 19%Imperial Estates 100% Suntree 100% Turner 1%
Mims 14% Surfside 100% University Park 80%JOHNSON 15% Creel 91% SOUTHWEST 19% Columbia 89%
SPACE COAST JR/SR HIGH Atlantis 100% Croton 100% Jupiter 36%Challenger 7 100% Harbor City 13% Lockmar 22%
Enterprise 100% Longleaf 100% McAuliffe 30%Sabal 100% Port Malabar 11%
COCOA JR/SR HIGH Cambridge 100% Sherwood 69% Sunrise 81%Endeavour 84% KENNEDY 52% Andersen 100% Turner 99%
Fairglen 100% Golfview 57% Westside 100%Saturn 80% Manatee 91% CENTRAL 5% Discovery 100%
Quest 46% Jupiter 64%MERRITT ISLAND JEFFERSON 100% Audubon 100% Williams 18% Lockmar 78%
Carroll 100% MCNAIR 19% Endeavour 16% McAuliffe 70%Mila 100% Golfview 43% Meadowlane 91%
Tropical 92% Manatee 9% Roy Allen 100%Saturn 20% University Park 10%
ROCKLEDGE KENNEDY 48% Andersen 100% Tropical 8%Golfview 57% Williams 82% HERITAGE CENTRAL 43% Discovery 100%Manatee 91% Jupiter 64%
Quest 46% SATELLITE DELAURA 64% Creel 9% Lockmar 78%Williams 18% Holland 100% McAuliffe 70%
MCNAIR 81% Endeavour 16% Ocean Breeze 46% Meadowlane 91%Golfview 43% Quest 54% Roy Allen 100%Manatee 9% Roosevelt 21% University Park 10%
Saturn 20% Sea Park 100% SOUTHWEST 21% Columbia 89%Tropical 8% Sherwood 31% Jupiter 36%
Williams 82% Suntree 100% Lockmar 22%Surfside 100% McAuliffe 30%
EAU GALLIE JOHNSON 85% Creel 91% HOOVER 14% Gemini 100% Port Malabar 11%Croton 100% Harbor City 80% Sunrise 81%
Harbor City 13% Indialantic 100% Turner 99%Longleaf 100% Ocean Breeze 54% Westside 100%
Sabal 100% University Park 10%Sherwood 69% MELBOURNE HOOVER 77% Gemini 100%
CENTRAL 8% Discovery 100% BAYSIDE SOUTHWEST 60% Columbia 89% Harbor City 80%Jupiter 64% Jupiter 36% Indialantic 100%
Lockmar 78% Lockmar 22% Ocean Breeze 54%McAuliffe 70% McAuliffe 30% University Park 10%
Meadowlane 91% Port Malabar 11% CENTRAL 44% Discovery 100%Roy Allen 100% Sunrise 81% Jupiter 64%
University Park 10% Turner 99% Lockmar 78%HOOVER 9% Gemini 100% Westside 100% McAuliffe 70%
Harbor City 80% STONE 5% Columbia 11% Meadowlane 91%Indialantic 100% Harbor City 7% Roy Allen 100%
Ocean Breeze 54% Meadowlane 9% University Park 10%University Park 10% Palm Bay Elem 100% STONE 18% Columbia 11%
Port Malabar 89% Harbor City 7%Riviera 100% Meadowlane 9%Sunrise 19% Palm Bay Elem 100%
Freedom 7 Elementary Turner 1% Port Malabar 89%Robert Lewis Stevenson Elementary University Park 80% Riviera 100%West Melbourne Elementary Sunrise 19%EDGEWOOD JR/SR HIGH COCOA BEACH JR/SR HIGH Cape View 100% Turner 1%WEST SHORE JR/SR HIGH Roosevelt 79% University Park 80%
Feeder System ChartFor 2019 - 2020 School Year Enrollment Projections
Schools of Choice Outside the Feeder System

Facilities Services / DGLBoard Approved April 23, 2019
Page 1 of 1
Charter
Alle
n
And
erse
n
Apo
llo
Atl
anti
s
Aud
ubon
Cam
brid
ge
Cap
e V
iew
Car
roll
Cha
lleng
er 7
Col
umbi
a
Coq
uina
Cre
el
Cro
ton
Dis
cove
ry
End
eavo
ur
Ent
erpr
ise
Fair
glen
Gem
ini
Gol
fvie
w
Har
bor
Cit
y
Hol
land
Impe
rial
Est
ates
Indi
alan
tic
Jupi
ter
Lock
mar
Long
leaf
Man
atee
McA
ulif
fe
Mea
dow
lane
Pri
mar
y
Mea
dow
lane
In
term
edia
te
Mila
Mim
s
Oak
Par
k
Oce
an B
reez
e
Pal
m B
ay E
l.
Pin
ewoo
d
Por
t Mal
abar
Que
st
Riv
iera
Roo
seve
lt
Saba
l
Satu
rn
Sea
Par
k
Sher
woo
d
Sunr
ise
Sunt
ree
Surf
side
Trop
ical
Turn
er
Uni
vers
ity
Par
k
Wes
tsid
e
Will
iam
s
Free
dom
7
Sout
h La
ke
Stev
enso
n
Wes
t Mel
bour
ne
Cha
rter
Sch
ools
Total Number of Students Resident in Boundary
590 5 10 3 1 1 1 2 2 1 5 4 6 1 1 6 5 1 1 2 1 2 37 46 734593 2 2 1 2 1 15 5 4 4 1 6 5 33 9 5 82 770
755 3 2 7 2 3 2 14 3 20 1 34 3 117 9661 609 2 3 5 24 30 3 3 1 1 5 2 1 14 8 51 7631 436 1 14 1 1 8 1 2 3 4 16 6 94 6 5945 4 5 450 1 4 1 3 1 4 8 1 1 22 10 1 1 20 27 569
8 334 3 1 3 2 28 2 30 23 1 4354 1 516 2 3 1 1 10 1 1 6 9 1 110 10 676
1 10 1 1 497 1 33 3 1 1 2 5 22 578400 1 1 2 7 8 1 3 7 9 1 3 6 14 362 825
47 10 1 2 455 9 2 37 9 3 3 28 2 114 72210 1 1 673 17 3 8 24 1 39 3 2 4 17 3 7 28 10 6 1 12 10 38 918
9 2 36 484 10 7 3 26 3 2 4 9 1 14 3 2 1 5 4 33 6584 3 3 574 2 1 6 18 3 16 10 12 2 3 1 7 1 2 1 1 2 1 4 23 219 919
13 2 4 98 8 9 7 2 561 1 20 42 2 2 1 8 1 37 6 1 9 2 3 174 10131 20 1 7 429 2 3 4 1 1 1 1 1 2 8 9 25 5168 2 10 6 4 8 15 2 26 584 4 1 2 3 4 11 2 3 1 36 23 755
425 4 1 2 3 4351 63 1 3 7 3 1 1 1 429 2 17 1 8 1 4 3 7 11 5 12 2 85 668
11 2 13 5 1 5 301 3 6 1 7 1 2 2 3 1 6 2 4 4 5 1 1 10 33 4302 1 317 1 7 3 7 1 13 3 4 359
10 3 7 1 1 15 4 1 536 1 3 3 1 31 4 124 7453 1 2 17 1 706 3 1 1 1 7 8 7 8 766
4 6 610 32 3 20 6 2 2 1 5 8 2 8 10 7 2 20 351 10991 3 1 2 2 3 546 7 2 3 1 3 1 6 4 12 148 745
4 446 4 1 2 7 5 2 3 1 15 1 1 10 42 5443 3 1 1 1 1 1 841 1 5 1 1 1 1 2 22 22 3 2 171 1084
6 2 3 1 1 2 5 13 641 2 2 1 6 1 1 15 1 1 1 18 155 8781 1 1 1 1 2 2 545 1 2 1 1 1 8 2 1 1 68 153 793
1 3 1 2 1 1 1 1 3 4 1 823 1 1 4 1 4 1 1 1 4 4 111 117 10921 3 1 18 54 1 1 1 1 365 2 2 32 1 2 59 12 556
12 3 1 3 1 2 1 9 372 24 32 1 35 1 62 55911 3 1 3 1 2 8 1 9 624 24 2 136 4 105 934
1 1 14 4 1 1 477 1 4 20 2 41 6 3 5763 1 1 2 1 2 6 2 2 3 503 15 1 4 1 2 1 6 7 11 208 782
2 1 2 1 14 421 1 13 14 4692 6 3 1 2 2 6 7 2 10 578 2 1 12 2 2 4 15 184 841
1 1 1 1 1 1 29 2 1,041 3 13 1 10 48 3 5 204 13654 3 1 3 1 5 1 12 2 3 16 2 9 10 3 569 2 4 2 4 5 4 3 1 1 45 252 967
2 1 3 1 1 2 319 3 3 63 13 2 41315 16 7 1 3 1 2 7 2 3 3 33 4 1 1 3 2 1 456 8 7 5 2 3 1 9 1 25 36 658
12 4 1 29 2 15 2 1 12 10 7 12 3 4 1 1 6 674 5 11 4 3 3 24 85 9311 1 1 1 54 3 1 2 3 248 6 11 2 23 2 2 6 367
11 1 1 6 2 55 1 2 1 4 2 1 7 313 24 1 1 8 1 7 35 4842 2 1 2 2 2 2 4 1 1 683 4 5 147 858
1 1 1 4 2 1 1 570 8 5 39 6331 19 1 1 1 1 389 19 1 3 436
3 20 13 1 1 3 4 18 1 5 2 702 20 56 9 8587 2 7 11 1 14 4 1 2 9 451 9 1 16 261 796
10 1 2 3 1 1 1 14 2 4 14 2 1 1 13 6 4 14 11 2 14 1 3 5 1 1 2 384 1 2 1 50 375 9471 7 2 1 1 4 6 8 5 2 1 2 2 28 3 697 12 320 1102
2 1 1 1 2 5 2 3 2 460 7 70 5561 1 3 1 1 4 1 1 2 3 4 1 1 11 35
670 717 840 684 512 593 352 659 563 444 478 792 531 596 587 563 644 465 509 344 490 619 735 649 690 628 940 741 614 868 431 399 683 521 548 486 654 1,075 622 377 507 782 307 394 769 669 457 818 498 416 748 550 387 311 506 553 5,187 38,172
Students Resident within School Boundary
734 770 966 763 594 569 435 676 578 825 722 918 658 919 1,013 516 755 435 668 430 359 745 766 1,099 745 544 1,084 878 793 1,092 556 559 934 576 782 469 841 1,365 967 413 658 931 367 484 858 633 436 858 796 947 1,102 556 38,137
Resident Students Attending School
590 593 755 609 436 450 334 516 497 400 455 673 484 574 561 429 584 425 429 301 317 536 706 610 546 446 841 641 545 823 365 372 624 477 503 421 578 1041 569 319 456 674 248 313 683 570 389 702 451 384 697 460 - - - - - 27,402
Resident Students Out-of-Area-Out
TO Other Schools144 177 211 154 158 119 101 160 81 425 267 245 174 345 452 87 171 10 239 129 42 209 60 489 199 98 243 237 248 269 191 187 310 99 279 48 263 324 398 94 202 257 119 171 175 63 47 156 345 563 405 96 - - - - - 10,735
-
Total Students Attending School 670 717 840 684 512 593 352 659 563 444 478 792 531 596 587 563 644 465 509 344 490 619 735 649 690 628 940 741 614 868 431 399 683 521 548 486 654 1,075 622 377 507 782 307 394 769 669 457 818 498 416 748 550 387 311 506 553 5,187 38,172
Resident Students Attending School
590 593 755 609 436 450 334 516 497 400 455 673 484 574 561 429 584 425 429 301 317 536 706 610 546 446 841 641 545 823 365 372 624 477 503 421 578 1,041 569 319 456 674 248 313 683 570 389 702 451 384 697 460 - - - - - 27,402
Non-Resident Students Out-of-Area-In
FROM Other Schools80 124 85 75 76 143 18 143 66 44 23 119 47 22 26 134 60 40 80 43 173 83 29 39 144 182 99 100 69 45 66 27 59 44 45 65 76 34 53 58 51 108 59 81 86 99 68 116 47 32 51 90 387 311 506 553 5187 10,770
Net Out-of-Area-In Minus Out-of-Area-Out
(64) (53) (126) (79) (82) 24 (83) (17) (15) (381) (244) (126) (127) (323) (426) 47 (111) 30 (159) (86) 131 (126) (31) (450) (55) 84 (144) (137) (179) (224) (125) (160) (251) (55) (234) 17 (187) (290) (345) (36) (151) (149) (60) (90) (89) 36 21 (40) (298) (531) (354) (6) 387 311 506 553 5187 35
Non-Geocoded(Includes Outside County) - 1 - - - - 1 3 1 - - - 1 - 4 - - - - - - - - - - - - - - 1 - 1 - - - 2 3 - - - - - - - 4 1 - - - - - - - 1 - - 11
35
WilliamsNon-Geocoded (Includes Outside County)
Total Number of Students
Attending School
Quest
MimsOak Park
Ocean BreezePalm Bay El.
PinewoodPort Malabar
NE
TT
OF
RO
M
University Park
RivieraRoosevelt
SabalSaturn
Sea ParkSherwood
SunriseSuntreeSurfsideTropicalTurner
Westside
LongleafManatee
McAuliffeMeadowlane Primary
MilaMeadowlane Intermediate
Lockmar
DiscoveryEndeavourEnterprise
FairglenGemini
GolfviewHarbor City
HollandImperial Estates
IndialanticJupiter
Croton
AndersenApollo
AtlantisAudubon
CambridgeCape View
CarrollChallenger 7
ColumbiaCoquina
Creel
Allen
BREVARD PUBLIC ELEMENTARY SCHOOLS: FROM TO CHARTFall Final Membership Count - October 12, 2018
Students' School of EnrollmentBrevard District Schools Choice Schools
Students' School of Residence

Facilities Services / DGL Board Approved April 23, 2019 Page 1 of 1
Charter
Cen
tral
Del
aura
Hoo
ver
Jack
son
Jeff
erso
n
John
son
Ken
nedy
Mad
ison
McN
air
Sout
hwes
t
Ston
e
Coc
oa J
r/Sr
(7-8
Onl
y)
Coc
oa
Bea
ch
(7-8
Onl
y)
Spac
e C
oast
(7-8
Onl
y)
Edg
ewoo
d(7
-8 O
nly)
Wes
t Sho
re(7
-8 O
nly)
Cha
rter
Sc
hool
s Total Number of Students
Resident in Boundary
1,140 3 5 30 3 22 41 1 2 81 145 14731 752 8 9 7 10 4 1 12 1 28 52 62 9472 22 470 9 8 2 1 98 5 617
521 17 4 2 23 8 73 6481 622 1 11 16 3 24 1 146 3 10 838
2 28 14 2 673 3 12 7 15 18 50 30 85411 1 9 4 519 56 1 15 2 70 9 143 840
22 472 1 1 7 6 34 5432 7 42 287 12 1 3 16 2 49 421
15 3 4 1 798 24 1 18 302 116628 3 5 3 1 13 707 30 189 979
3 1 1 15 1 24 88 539 2 30 35 29 7685 226 1 15 - 247
4 2 1 2 2 1 485 17 25 539Non-Geocoded(Includes Outside County) 2 1 1 1 1 6
1,193 819 506 548 660 736 611 492 480 833 791 560 302 553 362 343 1,097 10,886
Students Resident within School Boundary 1,473 947 617 648 838 854 840 543 421 1,166 979 768 247 539 10,880
Resident Students Attending School 1,140 752 470 521 622 673 519 472 287 798 707 539 226 485 - - - 8,211
Resident Students Out-of-Area-Out
TO Other Schools333 195 147 127 216 181 321 71 134 368 272 229 21 54 - - - 2,669
-
Total Students Attending School 1,193 819 506 548 660 736 611 492 480 833 791 560 302 553 362 343 1,097 10,886
Resident Students Attending School 1,140 752 470 521 622 673 519 472 287 798 707 539 226 485 - - - 8,211
Non-Resident Students Out-of-Area-In
FROM Other Schools53 67 36 27 38 63 92 20 193 35 84 21 76 68 362 343 1097 2,675
Net Out-of-Area-In Minus Out-of-Area-Out (280) (128) (111) (100) (178) (118) (229) (51) 59 (333) (188) (208) 55 14 362 343 1097 6
Non-Geocoded(Includes Outside County) 2 - 1 - - - - 1 - - - 1 - - - - 1 6
Kennedy
BREVARD PUBLIC MIDDLE SCHOOLS: FROM TO CHARTFall Final Membership Count - October 12, 2018
Students' School of Enrollment Brevard District Schools Choice Schools
Students' School of Residence
CentralDelauraHoover
JacksonJeffersonJohnson
NE
T
MadisonMcNair
SouthwestStone
Cocoa Jr/Sr (7-8 Only)Cocoa Beach (7-8 Only)Space Coast (7-8 Only)
Total Number of Students
Attending School
TO
FR
OM

Facilities Services / DGL Board Approved April 23, 2019 Page 1 of 1
Charter
Ast
rona
ut
Bay
side
Eau
Gal
lie
Her
itag
e
Mel
bour
ne
Mer
ritt
Is
land
Pal
m B
ay
Hig
h
Roc
kled
ge
Sate
llite
Titu
svill
e
Vie
ra
Coc
oa
(9-1
2 O
nly)
Coc
oa
Bea
ch
(9-1
2 O
nly)
Spac
e C
oast
(9
-12
Onl
y)
Edg
ewoo
d (9
-12
Onl
y)
Wes
t Sho
re
(9-1
2 O
nly)
Cha
rter
Sc
hool
s Total Number of Students
Resident in Boundary
975 3 1 120 4 7 7 11171,407 6 103 21 44 2 1 28 106 1718
2 1,524 4 49 3 15 3 39 28 26 4 96 7 1800121 15 1,583 42 61 1 2 2 1 24 84 1936
1 13 38 24 1,897 1 51 3 79 9 1 8 1 5 254 15 24001 1,398 22 7 5 56 1 260 1750
156 17 114 78 1,339 1 7 5 3 55 85 18601 3 2 2 24 2 1,253 6 78 37 11 4 70 2 1495
20 13 5 2 6 1,135 16 1 35 6 81 1 132185 1 2 4 1 1,218 1 4 3 33 15 1367
2 29 9 9 4 73 41 1 1,968 3 35 107 70 2 23532 55 126 7 14 929 8 51 69 1261
1 15 2 2 1 2 2 524 18 56710 12 16 1 27 3 12 2 934 24 1041
2 5 1 3 1 2 2 1 17
1,076 1,706 1,653 1,831 2,113 1,524 1,518 1,516 1,315 1,376 2,139 996 711 1,033 586 610 300 22,003
Students Resident within School Boundary 1,117 1,718 1,800 1,936 2,400 1,750 1,860 1,495 1,321 1,367 2,353 1,261 567 1,041 21,986
Resident Students Attending School 975 1,407 1,524 1,583 1,897 1,398 1,339 1,253 1,135 1,218 1,968 929 524 934 - - - 18,084
Resident Students Out-of-Area-Out
TO Other Schools142 311 276 353 503 352 521 242 186 149 385 332 43 107 - - - 3,902
-
Total Students Attending School 1,076 1,706 1,653 1,831 2,113 1,524 1,518 1,516 1,315 1,376 2,139 996 711 1,033 586 610 300 22,003
Resident Students Attending School 975 1,407 1,524 1,583 1,897 1,398 1,339 1,253 1,135 1,218 1,968 929 524 934 - - - 18,084
Non-Resident Students Out-of-Area-In
FROM Other Schools101 299 129 248 216 126 179 263 180 158 171 67 187 99 586 610 300 3,919
Net Out-of-Area-In Minus Out-of-Area-Out (41) (12) (147) (105) (287) (226) (342) 21 (6) 9 (214) (265) 144 (8) 586 610 300 17
Non-Geocoded(Includes Outside County) 5 - 1 - - - 3 1 2 - - - 2 1 - - 17 N
ET
RockledgeSatellite
TitusvilleViera
Cocoa (9-12 Only)Cocoa Beach (9-12 Only)Space Coast (9-12 Only)
Non-Geocoded (Includes Outside County)Total Number
of StudentsAttending School
TO
FR
OM
Palm Bay High
BREVARD PUBLIC HIGH SCHOOLS: FROM TO CHARTFall Final Membership Count - October 12, 2018
Students' School of Enrollment Brevard District Schools Choice Schools
Students' School of Residence
AstronautBayside
Eau GallieHeritage
MelbourneMerritt Island

Facilities Services / DGL Board Approved April 23, 2019 Page 1 of 1
Stud
ent
Mem
bers
hip
Stud
ents
R
esid
ing
in
Bou
ndar
y
Em
ma
Jew
el
Imag
ine
Scho
ols
Lega
cy C
hart
er
Ody
ssey
Cha
rter
Sc
h
Ody
ssey
Pre
p.
Pal
m B
ay
Aca
dem
y
Pin
eapp
le C
ove
Pin
eapp
l e C
ove
at W
est
Mel
bour
ne
Roy
al P
alm
C
hart
er
Scul
ptor
Cha
rter
Sc
hl
Vie
ra C
hart
er
W M
elbr
ne E
d H
oriz
on C
hrt
Total Charter Students FROM District School
Boundary
Percentage of Resident Students Attending
Charter Schools
Roy Allen 670 734 5 2 6 19 6 8 46 6.3%Andersen 717 770 4 2 4 72 82 10.6%
Apollo 840 966 1 43 2 71 117 12.1%Atlantis 684 763 8 40 3 51 6.7%
Audubon 512 594 4 1 1 6 1.0%Cambridge 593 569 20 1 2 4 27 4.7%Cape View 352 435 1 1 0.2%
Carroll 659 676 4 1 3 2 10 1.5%Challenger 7 563 578 1 4 17 22 3.8%
Columbia 444 825 5 146 85 16 41 14 54 1 362 43.9%Coquina 478 722 2 51 1 60 114 15.8%
Creel 792 918 5 2 2 3 1 4 14 7 38 4.1%Croton 531 658 2 2 4 1 2 2 7 8 5 33 5.0%
Discovery 596 919 1 23 65 20 16 37 39 12 2 4 219 23.8%Endeavour 587 1,013 163 1 1 2 7 174 17.2%Enterprise 563 516 1 3 20 1 25 4.8%
Fairglen 644 755 3 4 6 10 23 3.0%Gemini 465 435 2 1 3 0.7%
Golfview 509 668 32 53 85 12.7%Harbor City 344 430 13 2 2 4 2 2 1 1 6 33 7.7%
Holland 490 359 1 1 1 1 4 1.1%Imperial Estates 619 745 1 30 90 3 124 16.6%
Indialantic 735 766 2 1 2 1 1 1 8 1.0%Jupiter 649 1,099 29 3 121 56 26 58 31 22 2 3 351 31.9%
Lockmar 690 745 12 27 19 13 33 31 4 9 148 19.9%Longleaf 628 544 1 3 38 42 7.7%Manatee 940 1,084 170 1 171 15.8%
McAuliffe 741 878 12 44 19 10 37 24 6 2 1 155 17.7%Meadowlane Primary 614 793 17 3 15 9 92 1 16 153 19.3%
Meadowlane Intermediate 868 1,092 10 1 4 12 12 63 2 3 10 117 10.7%Mila 431 556 11 1 12 2.2%
Mims 399 559 1 32 28 1 62 11.1%Oak Park 683 934 48 57 105 11.2%
Ocean Breeze 521 576 1 1 1 3 0.5%Palm Bay Elem 548 782 2 19 31 19 108 6 13 9 1 208 26.6%
Pinewood 486 469 4 10 14 3.0%Port Malabar 654 841 19 49 21 27 32 10 22 2 2 184 21.9%
Quest 1,075 1,365 1 1 3 1 2 196 204 14.9%Riviera 622 967 1 85 1 27 28 39 17 19 27 2 6 252 26.1%
Roosevelt 377 413 1 1 2 0.5%Sabal 507 658 3 1 3 8 12 9 36 5.5%
Saturn 782 931 50 2 8 25 85 9.1%Sea Park 307 367 1 5 6 1.6%
Sherwood 394 484 1 3 1 21 9 35 7.2%Sunrise 769 858 4 48 19 3 40 15 17 1 147 17.1%Suntree 669 633 1 1 37 39 6.2%Surfside 457 436 3 3 0.7%Tropical 818 858 1 1 6 1 9 1.0%
Turner 498 796 15 109 46 18 30 12 31 261 32.8%University Park 416 947 2 150 19 13 120 6 35 4 5 21 375 39.6%
Westside 748 1,102 4 121 42 5 87 28 31 2 320 29.0%Williams 550 556 1 1 1 67 70 12.6%
Not Geo-Located 35 2 2 3 1 1 2 11
31,228 38,172 306 438 234 826 405 448 465 474 254 422 791 124 5,187 13.6%
Central 1,193 1,473 77 12 42 13 1 145 9.8%DeLaura 819 947 1 61 62 6.5%
Hoover 506 617 2 1 1 1 5 0.8%Jackson 548 648 1 71 1 73 11.3%
Jefferson 660 838 7 1 2 10 1.2%Johnson 736 854 5 1 2 1 21 30 3.5%Kennedy 611 840 1 1 141 143 17.0%Madison 492 543 34 34 6.3%McNair 480 421 20 29 49 11.6%
Southwest 833 1,166 185 29 42 44 2 302 25.9%Stone 791 979 82 69 16 22 189 19.3%Cocoa 1,556 2,029 23 3 3 29 1.4%
Cocoa Beach 1,013 814 - 0.0%Space Coast 1,586 1,580 1 23 1 25 1.6%
Astronaut 1,076 1,117 - 0.0%Bayside 1,706 1,718 100 6 106 6.2%
Eau Gallie 1,653 1,800 3 4 7 0.4%Heritage 1,831 1,936 76 8 84 4.3%
Melbourne 2,113 2,400 8 7 15 0.6%Merritt Island 1,524 1,750 - 0.0%
Palm Bay 1,518 1,860 77 8 85 4.6%Rockledge 1,516 1,495 - 0.0%
Satellite 1,315 1,321 1 1 0.1%Titusville 1,376 1,367 - 0.0%
Viera 2,139 2,353 2 - 0.0%Not Geo-Located 23 1 1
29,591 32,889 52 - - 621 - 112 137 - 81 131 263 - 1,397 4.2%
60,819 71,061 358 438 234 1,447 405 560 602 474 335 553 1,054 124 6,584 9.3%
Total Number of K-6 Elementary Students Attending School
Total Number of K-12 Students Attending School
BREVARD CHARTER SCHOOLS: FROM ANALYSISFall Final Membership Count - October 12, 2018
Students' School of EnrollmentCharter Schools
Students' School of Residence
Ele
men
tary
Sch
ools
Mid
dle
Scho
ols
Jr/S
r H
igh
Hig
h Sc
hool
s
Total Number of Secondary Students Attending School

School Board of Brevard County FY 2019-2020 Student Accommodation Plan
Facilities Services / DGL Board Approved April 23, 2019
SECTION 5
ENROLLMENT PROJECTIONS AND SCHOOL
CAPACITY ANALYSIS
A. School Years 2018-19 to 2023-24 Student Enrollment Projections and School Capacity Analysis
B. Projections Accuracy for 2018-19 School Year

Facilities Services / DGL Board Approved April 23, 2019 Page 1 of 3
Projected Capacity in Use
School Information Total Capacity Current
YearCurrent
Year
School Type GradesUtilization
Factor
2018-19 Student Stations
2018-19 Factored Capacity
2018-19 Actual
2019-20 2020-21 2021-22 2022-23 2023-24 2018-19 Actual
2019-20 2020-21 2021-22 2022-23 2023-24
(Note 1) (Note 2) (Note 3)
New Viera Elementary 2020 Elementary PK-6 100% * 970 970 513 639 788 788 53% 66% 81% 81%Allen Elementary PK-6 100% 751 751 711 717 703 725 716 703 95% 96% 94% 97% 95% 94%Andersen Elementary K-6 100% 884 884 720 706 696 686 699 706 81% 80% 79% 78% 79% 80%Apollo Elementary K-6 100% 902 902 847 861 872 895 901 905 94% 96% 97% 99% 100% 100%Atlantis Elementary PK-6 100% 739 739 713 693 668 669 658 641 97% 94% 90% 91% 89% 87%Audubon Elementary PK-6 100% 761 761 536 538 490 485 476 483 70% 71% 64% 64% 63% 64%Cambridge Elementary PK-6 100% 765 765 661 659 641 624 616 623 86% 86% 84% 82% 81% 81%Cape View Elementary PK-6 100% 548 548 381 368 348 328 320 327 70% 67% 64% 60% 58% 60%Carroll Elementary K-6 100% 751 751 664 661 637 597 595 581 88% 88% 85% 80% 79% 77%Challenger 7 Elementary PK-6 100% 573 573 571 577 541 526 518 502 100% 101% 94% 92% 90% 88%Columbia Elementary PK-6 100% 751 751 478 449 439 446 447 437 64% 60% 59% 59% 60% 58%Coquina Elementary K-6 100% 711 711 515 462 427 404 374 357 72% 65% 60% 57% 53% 50%Creel Elementary PK-6 100% 1,154 1,154 845 853 855 876 919 932 73% 74% 74% 76% 80% 81%Croton Elementary PK-6 100% 795 795 552 538 559 621 626 621 69% 68% 70% 78% 79% 78%Discovery Elementary PK-6 100% 980 980 644 606 587 577 592 592 66% 62% 60% 59% 60% 60%Endeavour Elementary PK-6 100% 990 990 662 649 619 590 569 573 67% 66% 63% 60% 58% 58%Enterprise Elementary K-6 100% 729 729 599 620 605 615 632 643 82% 85% 83% 84% 87% 88%Fairglen Elementary PK-6 100% 789 789 681 675 680 705 732 745 86% 86% 86% 89% 93% 94%Freedom 7 Elementary K-6 100% 475 475 387 414 414 414 414 414 82% 87% 87% 87% 87% 87%Gemini Elementary K-6 100% 711 711 468 467 451 430 417 418 66% 66% 63% 61% 59% 59%Golfview Elementary PK-6 100% 777 777 555 517 521 510 512 503 71% 67% 67% 66% 66% 65%Harbor City Elementary PK-6 100% 629 629 371 365 347 345 366 362 59% 58% 55% 55% 58% 58%Holland Elementary PK-6 100% 605 605 497 510 510 507 509 511 82% 84% 84% 84% 84% 85%Imperial Estates Elementary K-6 100% 729 729 639 630 636 636 629 611 88% 86% 87% 87% 86% 84%Indialantic Elementary K-6 100% 798 798 740 737 741 740 750 765 93% 92% 93% 93% 94% 96%Jupiter Elementary PK-6 100% 930 930 728 686 749 795 828 856 78% 74% 81% 86% 89% 92%Lockmar Elementary PK-6 100% 892 892 699 674 659 655 684 677 78% 76% 74% 73% 77% 76%Longleaf Elementary PK-6 100% 790 790 647 646 618 605 591 588 82% 82% 78% 77% 75% 74%Manatee Elementary K-6 100% 954 954 949 950 805 801 803 782 100% 100% 84% 84% 84% 82%McAuliffe Elementary PK-6 100% 918 918 777 763 685 655 604 598 85% 83% 75% 71% 66% 65%Meadowlane Intermediate Elementary 3-6 100% 1,114 1,114 868 847 851 886 943 978 78% 76% 76% 80% 85% 88%Meadowlane Primary Elementary K-6 100% 824 824 626 637 668 682 702 704 76% 77% 81% 83% 85% 85%Mila Elementary PK-6 100% 707 707 465 449 442 447 447 483 66% 64% 63% 63% 63% 68%Mims Elementary PK-6 100% 725 725 479 472 450 458 485 478 66% 65% 62% 63% 67% 66%Oak Park Elementary PK-6 100% 968 968 723 675 658 637 629 622 75% 70% 68% 66% 65% 64%Ocean Breeze Elementary PK-6 100% 654 654 532 524 511 497 490 490 81% 80% 78% 76% 75% 75%
School Years 2018-19 to 2023-24Student Enrollment Projections and
School Capacity Analysis (Total Factored Capacity)School Information and Capacity Projected Student Membership
(Note 4) (Note 5)

Facilities Services / DGL Board Approved April 23, 2019 Page 2 of 3
Projected Capacity in Use
School Information Total Capacity Current
YearCurrent
Year
School Type GradesUtilization
Factor
2018-19 Student Stations
2018-19 Factored Capacity
2018-19 Actual
2019-20 2020-21 2021-22 2022-23 2023-24 2018-19 Actual
2019-20 2020-21 2021-22 2022-23 2023-24
(Note 1) (Note 2) (Note 3)
School Years 2018-19 to 2023-24Student Enrollment Projections and
School Capacity Analysis (Total Factored Capacity)School Information and Capacity Projected Student Membership
(Note 4) (Note 5)
Palm Bay Elementary PK-6 100% 1,005 1,005 615 607 622 598 649 683 61% 60% 62% 60% 65% 68%Pinewood Elementary PK-6 100% 569 569 517 506 506 512 518 530 91% 89% 89% 90% 91% 93%Port Malabar Elementary PK-6 100% 852 852 688 682 632 607 613 604 81% 80% 74% 71% 72% 71%Quest Elementary PK-6 100% 1,022 1,022 1,089 1,144 970 947 875 874 107% 112% 95% 93% 86% 86%Riviera Elementary PK-6 100% 777 777 692 687 771 847 852 844 89% 88% 99% 109% 110% 109%Roosevelt Elementary K-6 100% 599 599 380 360 338 331 324 322 63% 60% 56% 55% 54% 54%Sabal Elementary PK-6 100% 785 785 538 533 516 507 494 485 69% 68% 66% 65% 63% 62%Saturn Elementary PK-6 100% 976 976 853 877 894 933 987 1,070 87% 90% 92% 96% 101% 110%Sea Park Elementary PK-6 100% 461 461 321 333 301 302 335 350 70% 72% 65% 66% 73% 76%Sherwood Elementary PK-6 100% 609 609 456 442 426 410 407 423 75% 73% 70% 67% 67% 70%South Lake Elementary K-6 100% 481 481 311 348 348 348 348 348 65% 72% 72% 72% 72% 72%Stevenson Elementary K-6 100% 569 569 506 509 509 509 509 509 89% 90% 90% 90% 90% 90%Sunrise Elementary PK-6 100% 913 913 820 800 803 844 883 914 90% 88% 88% 92% 97% 100%Suntree Elementary K-6 100% 755 755 675 655 556 515 498 517 89% 87% 74% 68% 66% 69%Surfside Elementary K-6 100% 541 541 460 456 442 421 420 392 85% 84% 82% 78% 78% 73%Tropical Elementary K-6 100% 910 910 825 821 826 829 813 832 91% 90% 91% 91% 89% 91%Turner Elementary PK-6 100% 874 874 562 519 521 509 502 516 64% 59% 60% 58% 57% 59%University Park Elementary PK-6 100% 811 811 473 489 566 672 721 703 58% 60% 70% 83% 89% 87%West Melbourne Elementary K-6 100% 618 618 553 552 552 552 552 552 90% 89% 89% 89% 89% 89%Westside Elementary K-6 100% 857 857 769 724 733 737 829 892 90% 85% 86% 86% 97% 104%Williams Elementary PK-6 100% 715 715 582 568 524 530 521 508 81% 79% 73% 74% 73% 71%Central Middle 7-8 90% 1,694 1,525 1,193 1,195 1,269 1,230 1,195 1,207 78% 78% 83% 81% 78% 79%DeLaura Middle 7-8 90% 1,043 939 819 828 833 860 874 832 87% 88% 89% 92% 93% 89%Hoover Middle 7-8 90% 732 659 506 500 512 512 502 494 77% 76% 78% 78% 76% 75%Jackson Middle 7-8 90% 727 654 548 548 604 637 664 698 84% 84% 92% 97% 102% 107%Jefferson Middle 7-8 90% 949 854 660 662 631 595 573 530 77% 78% 74% 70% 67% 62%Johnson Middle 7-8 90% 1,111 1,000 736 746 816 797 764 761 74% 75% 82% 80% 76% 76%Kennedy Middle 7-8 90% 903 813 611 621 675 688 739 717 75% 76% 83% 85% 91% 88%Madison Middle 7-8 90% 825 743 492 496 491 465 455 475 66% 67% 66% 63% 61% 64%McNair Middle 7-8 90% 679 611 480 565 539 528 552 569 79% 93% 88% 86% 90% 93%Southwest Middle 7-8 90% 1,308 1,177 833 838 944 957 930 929 71% 71% 80% 81% 79% 79%Stone Middle 7-8 90% 1,138 1,024 791 824 961 1,041 975 985 77% 81% 94% 102% 95% 96%Cocoa Jr / Sr High PK, 7-12 90% ** 2,280 2,052 1,577 1,582 1,670 1,762 1,882 1,929 89% 77% 81% 86% 92% 94%Cocoa Beach Jr / Sr High 7-12 90% 1,628 1,465 1,013 1,007 977 975 950 924 69% 69% 67% 67% 65% 63%Edgewood Jr / Sr High 7-12 90% 1,191 1,072 948 950 950 950 950 950 88% 89% 89% 89% 89% 89%Space Coast Jr / Sr High 7-12 90% 2,063 1,857 1,586 1,590 1,588 1,556 1,513 1,507 85% 86% 86% 84% 82% 81%West Shore Jr / Sr High 7-12 90% 1,404 1,264 953 956 956 956 956 956 75% 76% 76% 76% 76% 76%

Facilities Services / DGL Board Approved April 23, 2019 Page 3 of 3
Projected Capacity in Use
School Information Total Capacity Current
YearCurrent
Year
School Type GradesUtilization
Factor
2018-19 Student Stations
2018-19 Factored Capacity
2018-19 Actual
2019-20 2020-21 2021-22 2022-23 2023-24 2018-19 Actual
2019-20 2020-21 2021-22 2022-23 2023-24
(Note 1) (Note 2) (Note 3)
School Years 2018-19 to 2023-24Student Enrollment Projections and
School Capacity Analysis (Total Factored Capacity)School Information and Capacity Projected Student Membership
(Note 4) (Note 5)
Astronaut High 9-12 95% 1,522 1,446 1,076 1,081 1,101 1,144 1,176 1,189 74% 75% 76% 79% 81% 82%Bayside High 9-12 95% 2,353 2,235 1,706 1,650 1,691 1,790 1,901 2,009 76% 74% 76% 80% 85% 90%Eau Gallie High PK, 9-12 95% 2,350 2,233 1,676 1,687 1,693 1,770 1,809 1,832 75% 76% 76% 79% 81% 82%Heritage High 9-12 95% 2,436 2,314 1,831 1,807 1,856 1,966 2,041 2,059 79% 78% 80% 85% 88% 89%Melbourne High 9-12 95% 2,479 2,355 2,113 2,134 2,198 2,353 2,455 2,476 90% 91% 93% 100% 104% 105%Merritt Island High PK, 9-12 95% 2,015 1,914 1,542 1,555 1,571 1,577 1,598 1,583 81% 81% 82% 82% 84% 83%Palm Bay High PK, 9-12 95% 2,751 2,613 1,543 1,583 1,706 1,796 2,011 2,134 59% 61% 65% 69% 77% 82%Rockledge High 9-12 95% 1,791 1,701 1,516 1,520 1,541 1,583 1,599 1,657 89% 89% 91% 93% 94% 97%Satellite High PK, 9-12 95% 1,595 1,515 1,328 1,345 1,371 1,383 1,387 1,392 88% 89% 91% 91% 92% 92%Titusville High 9-12 95% 1,970 1,872 1,381 1,343 1,411 1,456 1,590 1,677 74% 72% 75% 78% 85% 90%Viera High PK, 9-12 95% 2,396 2,276 2,157 2,195 2,263 2,445 2,605 2,662 95% 96% 99% 107% 115% 117%
Elementary 44,442 44,442 34,615 34,207 33,952 34,168 34,631 34,867 80% 79% 76% 77% 78% 79%Middle 11,109 9,999 7,669 7,823 8,275 8,310 8,223 8,197 77% 78% 83% 83% 82% 82%
Jr / Sr High 8,566 7,710 6,077 6,085 6,141 6,199 6,251 6,266 82% 79% 80% 80% 81% 81%High 23,658 22,474 17,869 17,900 18,402 19,263 20,172 20,670 80% 80% 82% 86% 90% 92%
School District Grand Totals 87,775 84,625 66,230 66,015 66,770 67,940 69,277 70,000 79% 79% 79% 80% 82% 83%
Notes:Note 1: Utilization Factors are established by the Florida Department of Education's (FDOE) State Requirements for Educational Facilities (SREF).Note 2: Permanent Student Stations for 2018-19 are based on the information contained in the FDOE Florida Inventory of School Houses (FISH) database on 10/10/2018.
Two Exceptions to Note 2 are listed below:* The New Viera Elementary School capacity becomes available for the 2020-21 school year.
** An addition at Cocoa Jr/Sr High school adds 300 student stations for the 2019-2020 school year.Note 3: Factored Capacity is calculated by multiplying Satisfactory Student Stations by the Utilization Factor. Total Factored Capacity is the addition of the
Permanent Factored Capacity plus the Relocatable Factored Capacity. Note 4: Projected Student Membership figures based on Finance 2019-20 Budget Projections combined with Growth Management Projections for 2020-21 to 2022-23.Note 5: Projected Capacity in Use is calculated by dividing the Projected Student Membership by the 2018-19 Total Factored Capacity (See Note 2 exceptions).
School District Group Totals

Facilities Services / DGL Board Approved April 23, 2019 Page 1 of 3
School Information Student Projections for 2017
School Type GradesUtilization
Factor2018-2019
Membership2017
Projection2016
Projection2015
Projection2014
Projection2013
Projection2017
Projection2016
Projection2015
Projection2014
Projection2013
Projection
(Note 1) (Note 2) Year 1 Year 2 Year 3 Year 4 Year 5
Allen Elementary PK-6 100% 711 685 667 611 633 580 -3.66% -6.19% -14.06% -10.97% -18.42%Andersen Elementary K-6 100% 720 753 715 731 766 722 4.58% -0.69% 1.53% 6.39% 0.28%Apollo Elementary K-6 100% 847 841 815 882 770 888 -0.71% -3.78% 4.13% -9.09% 4.84%Atlantis Elementary PK-6 100% 713 718 694 567 561 581 0.70% -2.66% -20.48% -21.32% -18.51%Audubon Elementary PK-6 100% 536 554 583 634 637 999 3.36% 8.77% 18.28% 18.84% 86.38%Cambridge Elementary PK-6 100% 661 670 674 673 602 754 1.36% 1.97% 1.82% -8.93% 14.07%Cape View Elementary PK-6 100% 381 381 421 438 479 393 0.00% 10.50% 14.96% 25.72% 3.15%Carroll Elementary K-6 100% 664 662 629 639 620 574 -0.30% -5.27% -3.77% -6.63% -13.55%Challenger 7 Elementary PK-6 100% 571 578 554 482 457 540 1.23% -2.98% -15.59% -19.96% -5.43%Columbia Elementary PK-6 100% 478 467 538 544 518 468 -2.30% 12.55% 13.81% 8.37% -2.09%Coquina Elementary K-6 100% 515 543 543 607 575 743 5.44% 5.44% 17.86% 11.65% 44.27%Creel Elementary PK-6 100% 845 906 973 1012 1006 999 7.22% 15.15% 19.76% 19.05% 18.22%Croton Elementary PK-6 100% 552 553 644 707 646 742 0.18% 16.67% 28.08% 17.03% 34.42%Discovery Elementary PK-6 100% 644 694 619 594 675 732 7.76% -3.88% -7.76% 4.81% 13.66%Endeavour Elementary PK-6 100% 662 739 941 892 915 762 11.63% 42.15% 34.74% 38.22% 15.11%Enterprise Elementary K-6 100% 599 585 499 441 439 482 -2.34% -16.69% -26.38% -26.71% -19.53%Fairglen Elementary PK-6 100% 681 716 755 661 660 618 5.14% 10.87% -2.94% -3.08% -9.25%Freedom 7 Elementary K-6 100% 387 414 414 414 414 414 6.98% 6.98% 6.98% 6.98% 6.98%Gemini Elementary K-6 100% 468 438 407 431 432 390 -6.41% -13.03% -7.91% -7.69% -16.67%Golfview Elementary PK-6 100% 555 570 650 642 701 705 2.70% 17.12% 15.68% 26.31% 27.03%Harbor City Elementary PK-6 100% 371 386 411 418 383 444 4.04% 10.78% 12.67% 3.23% 19.68%Holland Elementary PK-6 100% 497 485 462 431 465 464 -2.41% -7.04% -13.28% -6.44% -6.64%Imperial Estates Elementary K-6 100% 639 638 678 725 638 678 -0.16% 6.10% 13.46% -0.16% 6.10%Indialantic Elementary K-6 100% 740 764 735 733 731 750 3.24% -0.68% -0.95% -1.22% 1.35%Jupiter Elementary PK-6 100% 728 681 808 877 922 697 -6.46% 10.99% 20.47% 26.65% -4.26%Lockmar Elementary PK-6 100% 699 699 743 690 769 812 0.00% 6.29% -1.29% 10.01% 16.17%Longleaf Elementary PK-6 100% 647 657 721 633 533 582 1.55% 11.44% -2.16% -17.62% -10.05%Manatee Elementary K-6 100% 949 923 943 833 848 774 -2.74% -0.63% -12.22% -10.64% -18.44%McAuliffe Elementary PK-6 100% 777 753 800 787 735 835 -3.09% 2.96% 1.29% -5.41% 7.46%Meadowlane Intermediate Elementary 3-6 100% 868 853 1017 1041 1048 1090 -1.73% 17.17% 19.93% 20.74% 25.58%Meadowlane Primary Elementary K-6 100% 626 638 827 703 666 752 1.92% 32.11% 12.30% 6.39% 20.13%Mila Elementary PK-6 100% 465 489 554 520 497 449 5.16% 19.14% 11.83% 6.88% -3.44%Mims Elementary PK-6 100% 479 399 520 563 522 783 -16.70% 8.56% 17.54% 8.98% 63.47%Oak Park Elementary PK-6 100% 723 775 966 866 787 742 7.19% 33.61% 19.78% 8.85% 2.63%Ocean Breeze Elementary PK-6 100% 532 513 509 566 562 541 -3.57% -4.32% 6.39% 5.64% 1.69%
Projections Accuracy for 2018-19 School Year 2018-19 Student Enrollment and 2018-19 Projections by Year
Projections Accuracy = Projected-Actual/Actual (Note 3)

Facilities Services / DGL Board Approved April 23, 2019 Page 2 of 3
School Information Student Projections for 2017
School Type GradesUtilization
Factor2018-2019
Membership2017
Projection2016
Projection2015
Projection2014
Projection2013
Projection2017
Projection2016
Projection2015
Projection2014
Projection2013
Projection
(Note 1) (Note 2) Year 1 Year 2 Year 3 Year 4 Year 5
Projections Accuracy for 2018-19 School Year 2018-19 Student Enrollment and 2018-19 Projections by Year
Projections Accuracy = Projected-Actual/Actual (Note 3)
Palm Bay Elementary PK-6 100% 615 604 822 803 889 876 -1.79% 33.66% 30.57% 44.55% 42.44%Pinewood Elementary PK-6 100% 517 496 576 560 436 405 -4.06% 11.41% 8.32% -15.67% -21.66%Port Malabar Elementary PK-6 100% 688 680 780 767 815 792 -1.16% 13.37% 11.48% 18.46% 15.12%Quest Elementary PK-6 100% 1,089 1075 1059 1121 871 630 -1.29% -2.75% 2.94% -20.02% -42.15%Riviera Elementary PK-6 100% 692 646 735 833 782 894 -6.65% 6.21% 20.38% 13.01% 29.19%Roosevelt Elementary K-6 100% 380 393 361 433 371 460 3.42% -5.00% 13.95% -2.37% 21.05%Sabal Elementary PK-6 100% 538 535 554 606 575 619 -0.56% 2.97% 12.64% 6.88% 15.06%Saturn Elementary PK-6 100% 853 869 747 762 741 685 1.88% -12.43% -10.67% -13.13% -19.70%Sea Park Elementary PK-6 100% 321 318 306 333 365 417 -0.93% -4.67% 3.74% 13.71% 29.91%Sherwood Elementary PK-6 100% 456 442 482 530 586 570 -3.07% 5.70% 16.23% 28.51% 25.00%South Lake Ancillary K-6 100% 311 300 0 0 0 0 -3.54% -100.00% -100.00% -100.00% -100.00%Stevenson Elementary K-6 100% 506 508 508 490 490 486 0.40% 0.40% -3.16% -3.16% -3.95%Sunrise Elementary PK-6 100% 820 813 849 872 872 690 -0.85% 3.54% 6.34% 6.34% -15.85%Suntree Elementary K-6 100% 675 696 619 595 584 607 3.11% -8.30% -11.85% -13.48% -10.07%Surfside Elementary K-6 100% 460 465 469 467 427 376 1.09% 1.96% 1.52% -7.17% -18.26%Tropical Elementary K-6 100% 825 798 815 747 755 682 -3.27% -1.21% -9.45% -8.48% -17.33%Turner Elementary PK-6 100% 562 563 655 683 860 765 0.18% 16.55% 21.53% 53.02% 36.12%University Park Elementary PK-6 100% 473 451 653 777 666 660 -4.65% 38.05% 64.27% 40.80% 39.53%West Melbourne Elementary K-6 100% 553 552 552 552 552 552 -0.18% -0.18% -0.18% -0.18% -0.18%Westside Elementary K-6 100% 769 625 723 609 843 802 -18.73% -5.98% -20.81% 9.62% 4.29%Williams Elementary PK-6 100% 582 546 592 537 486 534 -6.19% 1.72% -7.73% -16.49% -8.25%Central Middle 7-8 90% 1,193 1186 1213 1184 1302 1150 -0.59% 1.68% -0.75% 9.14% -3.60%DeLaura Middle 7-8 90% 819 870 740 767 779 647 6.23% -9.65% -6.35% -4.88% -21.00%Hoover Middle 7-8 90% 506 479 460 539 584 517 -5.34% -9.09% 6.52% 15.42% 2.17%Jackson Middle 7-8 90% 548 540 613 611 625 600 -1.46% 11.86% 11.50% 14.05% 9.49%Jefferson Middle 7-8 90% 660 644 669 660 610 617 -2.42% 1.36% 0.00% -7.58% -6.52%Johnson Middle 7-8 90% 736 788 802 818 844 834 7.07% 8.97% 11.14% 14.67% 13.32%Kennedy Middle 7-8 90% 611 651 645 664 714 556 6.55% 5.56% 8.67% 16.86% -9.00%Madison Middle 7-8 90% 492 472 480 501 520 493 -4.07% -2.44% 1.83% 5.69% 0.20%McNair Middle 7-8 90% 480 419 443 504 551 481 -12.71% -7.71% 5.00% 14.79% 0.21%Southwest Middle 7-8 90% 833 824 895 835 981 907 -1.08% 7.44% 0.24% 17.77% 8.88%Stone Middle 7-8 90% 791 827 841 979 900 840 4.55% 6.32% 23.77% 13.78% 6.19%Cocoa Jr / Sr High PK, 7-12 90% 1,577 1639 1724 1724 1995 1610 3.93% 9.32% 9.32% 26.51% 2.09%Cocoa Beach Jr / Sr High 7-12 90% 1,013 982 976 1085 1120 1060 -3.06% -3.65% 7.11% 10.56% 4.64%Edgewood Jr / Sr High 7-12 90% 948 950 950 950 950 949 0.21% 0.21% 0.21% 0.21% 0.11%Space Coast Jr / Sr High 7-12 90% 1,586 1597 1485 1450 1407 1179 0.69% -6.37% -8.58% -11.29% -25.66%West Shore Jr / Sr High 7-12 90% 953 956 956 956 962 956 0.31% 0.31% 0.31% 0.94% 0.31%

Facilities Services / DGL Board Approved April 23, 2019 Page 3 of 3
School Information Student Projections for 2017
School Type GradesUtilization
Factor2018-2019
Membership2017
Projection2016
Projection2015
Projection2014
Projection2013
Projection2017
Projection2016
Projection2015
Projection2014
Projection2013
Projection
(Note 1) (Note 2) Year 1 Year 2 Year 3 Year 4 Year 5
Projections Accuracy for 2018-19 School Year 2018-19 Student Enrollment and 2018-19 Projections by Year
Projections Accuracy = Projected-Actual/Actual (Note 3)
Astronaut High 9-12 95% 1,076 1056 1125 1035 938 1025 -1.86% 4.55% -3.81% -12.83% -4.74%Bayside High 9-12 95% 1,706 1686 1733 1649 1346 1509 -1.17% 1.58% -3.34% -21.10% -11.55%Eau Gallie High PK, 9-12 95% 1,676 1678 1693 1745 1854 1574 0.12% 1.01% 4.12% 10.62% -6.09%Heritage High 9-12 95% 1,831 1721 1778 1819 1669 1760 -6.01% -2.89% -0.66% -8.85% -3.88%Melbourne High 9-12 95% 2,113 2189 2374 2263 2266 2085 3.60% 12.35% 7.10% 7.24% -1.33%Merritt Island High PK, 9-12 95% 1,542 1532 1516 1508 1562 1379 -0.65% -1.69% -2.20% 1.30% -10.57%Palm Bay High PK, 9-12 95% 1,543 1629 1659 1727 1558 1368 5.57% 7.52% 11.92% 0.97% -11.34%Rockledge High 9-12 95% 1,516 1532 1515 1630 1648 1191 1.06% -0.07% 7.52% 8.71% -21.44%Satellite High PK, 9-12 95% 1,328 1329 1345 1316 1305 1211 0.08% 1.28% -0.90% -1.73% -8.81%Titusville High 9-12 95% 1,381 1470 1437 1443 1491 1271 6.44% 4.06% 4.49% 7.97% -7.97%Viera High PK, 9-12 95% 2,157 2181 2188 2205 2023 1761 1.11% 1.44% 2.23% -6.21% -18.36%
34,615 34,495 36,286 36,065 35,578 35,981 -0.35% 4.83% 4.19% 2.78% 3.95%7,669 7,700 7,801 8,062 8,410 7,642 0.40% 1.72% 5.12% 9.66% -0.35%6,077 6,124 6,091 6,165 6,434 5,754 0.77% 0.23% 1.45% 5.87% -5.32%
17,869 18,003 18,363 18,340 17,660 16,134 0.75% 2.76% 2.64% -1.17% -9.71%
School District Grand Totals 66,230 66,322 68,541 68,632 68,082 65,511 0.14% 3.49% 3.63% 2.80% -1.09%
Notes:Note 1: Utilization Factors are established by the Florida Department of Education's (FDOE) State Requirements for Educational Facilities (SREF).
Note 2: Student Membership based on Final Fall Membership Count (10/13/17)
Note 3: Percentage refers to the projected enrollment minus the actual enrollment numbers. Negative percentages indicate the projection was
below the actual enrollment and positive percentages indicate that the projection was above the actual enrollment.
***Projections accuracy is significantly affected by Attendance Boundary Changes and Grandfathering, Charter School
expansion and contraction, BPS schools opening and closing, and the location decisions for Choice and Magnet Programs.
-5% to 5%-10% to -5% and 5% to 10%
-20% to -10% and 10% to 20%-100% to -20% and 20% to 100%
GreenYellowOrange
Red
School District Group Totals
ElementaryMiddle
Jr/Sr HighHigh

School Board of Brevard County FY 2019-2020 Student Accommodation Plan
Facilities Services / DGL Board Approved April 23, 2019
SECTION 6
RELOCATABLE CLASSROOM CHANGES
PROPOSED FOR 2019-2020
A. Proposed Relocatable Classroom Changes Summer 2019 B. 2019-20 School Year Proposed Relocatable Changes C. Relocatable Inventory School Year 2018-2019

School Board of Brevard County FY 2019-2020 Student Accommodation Plan _______________________________________________________________________________________________
_______________________________________________________________________________________________ Facilities Services / DGL Board Approved April 23, 2019
Proposed Relocatable Classroom Changes Summer 2019 Elementary New Relocatables to be moved to:
• Quest – 3 new relocatable classrooms – 3 moved from Lewis Carroll Total New Elementary = 3 Secondary No Relocatable Classroom Changes

Facilities Services / DGL Board Approved April 23, 2019 Page 1 of 3
School Information Student 2019 - 2020 Relocatables
School TypeUtilization
Factor
2019 - 2020 Projected
Membership
2018-2019 Student Stations
Factored Capacity
Perm Capacity
In Use
Class-room Units
Student Stations
Factored Capacity
Total Capacity
in Use
Class-room Units
Student Stations
Factored Capacity
Class-room Units
Student Stations
Factored Capacity
Total Student Stations
Total Factored Capacity
Total Capacity
In Use(Note 1) (Note 2) (Note 3) (Note 4) (Note 5) (Note 6) (Note 7) (Note 8) (Note 9) (Note 6) (Note 7) (Note 8) (Note 9)
Allen Elementary 100% 717 663 663 108% 5 88 88 96% 5 88 88 751 751 96%Andersen Elementary 100% 706 840 840 84% 2 44 44 80% 2 44 44 884 884 80%Apollo Elementary 100% 861 902 902 96% 96% 902 902 96%Atlantis Elementary 100% 693 703 703 99% 2 44 44 93% 2 44 44 747 747 93%Audubon Elementary 100% 538 761 761 71% 71% 761 761 71%Cambridge Elementary 100% 659 649 649 102% 6 116 116 86% 6 116 116 765 765 86%Cape View Elementary 100% 368 548 548 67% 67% 548 548 67%Carroll Elementary 100% 661 751 751 88% 88% 751 751 88%Challenger 7 Elementary 100% 577 551 551 105% 1 22 22 101% 1 22 22 573 573 101%Columbia Elementary 100% 449 685 685 66% 3 66 66 60% 3 66 66 751 751 60%Coquina Elementary 100% 462 627 627 74% 3 66 66 67% 3 66 66 693 693 67%Creel Elementary 100% 853 1,088 1,088 78% 3 66 66 74% 3 66 66 1,154 1,154 74%Croton Elementary 100% 538 707 707 76% 4 88 88 68% 4 88 88 795 795 68%Discovery Elementary 100% 606 826 826 73% 7 154 154 62% 7 154 154 980 980 62%Endeavour Elementary 100% 649 852 852 76% 7 138 138 66% 7 138 138 990 990 66%Enterprise Elementary 100% 620 707 707 88% 1 22 22 85% 1 22 22 729 729 85%Fairglen Elementary 100% 675 753 753 90% 2 44 44 85% 2 44 44 797 797 85%Freedom 7 Elementary 100% 414 453 453 91% 1 22 22 87% 1 22 22 475 475 87%Gemini Elementary 100% 467 667 667 70% 2 44 44 66% 2 44 44 711 711 66%Golfview Elementary 100% 517 689 689 75% 4 88 88 67% 4 88 88 777 777 67%Harbor City Elementary 100% 365 453 453 81% 8 176 176 58% 8 176 176 629 629 58%Holland Elementary 100% 510 605 605 84% 84% 605 605 84%Imperial Estates Elementary 100% 630 729 729 86% 86% 729 729 86%Indialantic Elementary 100% 737 754 754 98% 2 44 44 92% 2 44 44 798 798 92%Jupiter Elementary 100% 686 780 780 88% 7 150 150 74% 7 150 150 930 930 74%Lockmar Elementary 100% 674 892 892 76% 76% 892 892 76%Longleaf Elementary 100% 646 790 790 82% 82% 790 790 82%Manatee Elementary 100% 950 866 866 110% 5 88 88 100% 5 88 88 954 954 100%McAuliffe Elementary 100% 763 754 754 101% 8 164 164 83% 8 164 164 918 918 83%Meadowlane Intermediate Elementary 100% 847 894 894 95% 11 220 220 76% 11 220 220 1,114 1,114 76%Meadowlane Primary Elementary 100% 637 824 824 77% 77% 824 824 77%Mila Elementary 100% 449 707 707 64% 64% 707 707 64%Mims Elementary 100% 472 725 725 65% 65% 725 725 65%Oak Park Elementary 100% 675 906 906 75% 3 66 66 69% 3 66 66 972 972 69%Ocean Breeze Elementary 100% 524 498 498 105% 8 156 156 80% 8 156 156 654 654 80%
2019-20 School Year Proposed Relocatable ChangesEnrollment Projections and Proposed School Capacities
Permanent 2018 - 2019 Relocatables Relocatable Changes 2019 - 2020 Totals (Note 10)

Facilities Services / DGL Board Approved April 23, 2019 Page 2 of 3
School Information Student 2019 - 2020 Relocatables
School TypeUtilization
Factor
2019 - 2020 Projected
Membership
2018-2019 Student Stations
Factored Capacity
Perm Capacity
In Use
Class-room Units
Student Stations
Factored Capacity
Total Capacity
in Use
Class-room Units
Student Stations
Factored Capacity
Class-room Units
Student Stations
Factored Capacity
Total Student Stations
Total Factored Capacity
Total Capacity
In Use(Note 1) (Note 2) (Note 3) (Note 4) (Note 5) (Note 6) (Note 7) (Note 8) (Note 9) (Note 6) (Note 7) (Note 8) (Note 9)
2019-20 School Year Proposed Relocatable ChangesEnrollment Projections and Proposed School Capacities
Permanent 2018 - 2019 Relocatables Relocatable Changes 2019 - 2020 Totals (Note 10)
Palm Bay Elementary 100% 607 829 829 73% 8 176 176 60% 8 176 176 1,005 1,005 60%Pinewood Elementary 100% 506 485 485 104% 4 88 88 88% 4 88 88 573 573 88%Port Malabar Elementary 100% 682 768 768 89% 4 84 84 80% 4 84 84 852 852 80%Quest Elementary 100% 1,144 910 910 126% 7 128 128 110% 3 66 66 10 194 194 1,104 1,104 104%Riviera Elementary 100% 687 689 689 100% 4 88 88 88% 4 88 88 777 777 88%Roosevelt Elementary 100% 360 599 599 60% 60% 599 599 60%Sabal Elementary 100% 533 679 679 79% 5 106 106 68% 5 106 106 785 785 68%Saturn Elementary 100% 877 848 848 103% 6 128 128 90% 6 128 128 976 976 90%Sea Park Elementary 100% 333 461 461 72% 72% 461 461 72%Sherwood Elementary 100% 442 609 609 73% 73% 609 609 73%South Lake Elementary 100% 348 529 529 66% 66% 529 529 66%Stevenson Elementary 100% 509 569 569 90% 90% 569 569 90%Sunrise Elementary 100% 800 895 895 89% 1 22 22 87% 1 22 22 917 917 87%Suntree Elementary 100% 655 689 689 95% 3 66 66 87% 3 66 66 755 755 87%Surfside Elementary 100% 456 421 421 108% 6 128 128 83% 6 128 128 549 549 83%Tropical Elementary 100% 821 910 910 90% 90% 910 910 90%Turner Elementary 100% 519 830 830 63% 2 44 44 59% 2 44 44 874 874 59%University Park Elementary 100% 489 679 679 72% 6 132 132 60% 6 132 132 811 811 60%West Melbourne Elementary 100% 552 618 618 89% 89% 618 618 89%Westside Elementary 100% 724 835 835 87% 1 22 22 85% 1 22 22 857 857 85%Williams Elementary 100% 568 627 627 91% 4 88 88 79% 4 88 88 715 715 79%Central Middle 90% 1,195 1,694 1,525 78% 78% 1,694 1,525 78%DeLaura Middle 90% 828 1,046 941 88% 88% 1,046 941 88%Hoover Middle 90% 500 732 659 76% 76% 732 659 76%Jackson Middle 90% 548 727 654 84% 84% 727 654 84%Jefferson Middle 90% 662 949 854 78% 78% 949 854 78%Johnson Middle 90% 746 1,111 1,000 75% 75% 1,111 1,000 75%Kennedy Middle 90% 621 749 674 92% 7 154 139 76% 7 154 139 903 813 76%Madison Middle 90% 496 825 743 67% 67% 825 743 67%McNair Middle 90% 565 679 611 93% 93% 679 611 93%Southwest Middle 90% 838 1,308 1,177 71% 71% 1,308 1,177 71%Stone Middle 90% 824 1,126 1,013 81% 81% 1,126 1,013 81%Cocoa Jr / Sr High 90% 1,582 1,730 1,557 102% 10 250 225 89% 10 250 225 1,980 1,782 89%Cocoa Beach Jr / Sr High 90% 1,007 1,253 1,128 89% 15 375 338 69% 15 375 338 1,628 1,466 69%Edgewood Jr / Sr High 90% 950 1,100 990 96% 6 91 82 89% 6 91 82 1,191 1,072 89%Space Coast Jr / Sr High 90% 1,590 1,975 1,778 89% 4 38 34 88% 4 38 34 2,013 1,812 88%West Shore Jr / Sr High 90% 956 1,232 1,109 86% 7 172 155 76% 7 172 155 1,404 1,264 76%

Facilities Services / DGL Board Approved April 23, 2019 Page 3 of 3
School Information Student 2019 - 2020 Relocatables
School TypeUtilization
Factor
2019 - 2020 Projected
Membership
2018-2019 Student Stations
Factored Capacity
Perm Capacity
In Use
Class-room Units
Student Stations
Factored Capacity
Total Capacity
in Use
Class-room Units
Student Stations
Factored Capacity
Class-room Units
Student Stations
Factored Capacity
Total Student Stations
Total Factored Capacity
Total Capacity
In Use(Note 1) (Note 2) (Note 3) (Note 4) (Note 5) (Note 6) (Note 7) (Note 8) (Note 9) (Note 6) (Note 7) (Note 8) (Note 9)
2019-20 School Year Proposed Relocatable ChangesEnrollment Projections and Proposed School Capacities
Permanent 2018 - 2019 Relocatables Relocatable Changes 2019 - 2020 Totals (Note 10)
Astronaut High 95% 1,081 1,522 1,446 75% 75% 1,522 1,446 75%Bayside High 95% 1,650 2,353 2,235 74% 74% 2,353 2,235 74%Eau Gallie High 95% 1,687 2,050 1,948 87% 11 275 261 76% 11 275 261 2,325 2,209 76%Heritage High 95% 1,807 2,436 2,314 78% 78% 2,436 2,314 78%Melbourne High 95% 2,134 2,429 2,308 93% 2 50 48 91% 2 50 48 2,479 2,356 91%Merritt Island High 95% 1,555 1,965 1,867 83% 2 50 48 81% 2 50 48 2,015 1,915 81%Palm Bay High 95% 1,583 2,576 2,447 65% 7 175 166 61% 7 175 166 2,751 2,613 61%Rockledge High 95% 1,520 1,703 1,618 94% 3 75 71 90% 3 75 71 1,778 1,689 90%Satellite High 95% 1,345 1,570 1,492 90% 1 25 24 89% 1 25 24 1,595 1,516 89%Titusville High 95% 1,343 1,970 1,872 72% 72% 1,970 1,872 72%Viera High 95% 2,195 2,246 2,134 103% 6 150 143 96% 6 150 143 2,396 2,277 96%
34,207 40,078 40,078 85% 166 3,476 3,476 79% 3 66 66 169 3,542 3,542 43,620 43,620 78%7,823 10,946 9,851 79% 7 154 139 78% - - - 7 154 139 11,100 9,990 78%6,085 7,290 6,562 93% 42 926 834 82% - - - 42 926 834 8,216 7,396 82%
17,900 22,820 21,681 83% 32 800 761 80% - - - 32 800 761 23,620 22,442 80%
School District Grand Totals 66,015 81,134 78,172 84% 247 5,356 5,210 79% 3 66 66 250 5,422 5,276 86,556 83,448 79%
Notes:Note 1: Utilization Factors are established by the Florida Department of Education's (FDOE) State Requirements for Educational Facilities (SREF).Note 2: Projected Student Membership figures based on Finance 2019-20 Budget ProjectionsNote 3: Permanent Student Stations are based on the information contained in the FDOE Florida Inventory of School Houses (FISH) database on 10/10/2018Note 4: Factored Capacity is calculated by multiplying Satisfactory Student Stations by the Utilization Factor. Total Factored Capacity is the addition of the
Permanent Factored Capacity plus the Relocatable Factored Capacity. Note 5: Perm Capacity in Use is calculated by dividing the Projected Student Membership by the Permanent Factored Capacity.Note 6: Relocatable Classroom Units are based on the information contained in the FDOE Florida Inventory of School Houses (FISH) database on 10/10/2018 plus
the projected relocatable classroom changes for School Year 2019-2020 (shown in red).Note 7: Relocatable Student Stations are based on the information contained in the FDOE Florida Inventory of School Houses (FISH) database on 10/10/2018 plus
the projected relocatable classroom changes for School Year 2019-2020 (shown in red).Note 8: Relocatable Factored Capacity is calculated by multiplying Satisfactory Relocatable Student Stations by the Utilization Factor.Note 9: Total Capacity in Use is calculated by dividing the Projected Student Membership by the sum of Permanent Factored Capacity and Relocatable Factored Capacity.
Note 10: Totals are calculated by adding Permanent and proposed 2019-2020 Relocatable data.
School District Group Totals
ElementaryMiddle
Jr/Sr HighHigh

Relocatable Inventory School Year 2018-2019
FISH MSID School Current Total
Bath Room Port
Non-Class room
Class room Surplus Store DCR 1 2 3 4 5 6 7 8 9 10 11 12 13 14 15 16 17 18 19 20 21 22 23 24 25 26 27 28 29 30
52 3101 Allen Elementary 6 5 1 T321 T324 T208 T215 T400 T40227 1141 Andersen Elementary 2 2 N129 N2234 0061 Apollo Elementary
12 0161 Astronaut High School 4 1 3 B008 N901 N917 T02815 0201 Atlantis Elementary 2 2 T220 T22758 4051 Audubon Elmentary
108 2211 Bayside High 7 5 2 T312 T315 T318 T420 T422 N943 N16618 1041 Cambridge Elementary 7 1 6 T256 T100 T101 T102 T103 T240 T24365 5031 Cape View Elementary61 4121 Carroll, Lewis Elementary 4 4 T267 T269 T270 T272
110 3021 Central Middle14 0191 Challenger 7 Elementary 1 1 T34862 5011 Cocoa Beach Jr./Sr. High 19 1 15 1 2 B053 N172 T202 T277 T284 T299 T301 T303 T304 T305 T306 T308 T310 T443 T444 T445 N123 N099 N10625 1121 Cocoa High School 12 11 1 T347 T260 T261 T331 T333 T336 T340 T345 T360 T435 T441 N21038 2131 Columbia Elementary 3 3 T353 T356 T4056 0091 Coquina Elementary 3 3 T207 T235 T209
75 6141 Creel Elementary 3 3 T440 T456 T45751 3091 Croton Elementary 4 4 T278 T409 T410 T43367 6012 DeLaura Middle39 2151 Discovery Elementary 9 1 7 1 B006 T307 T309 T311 T327 T329 T330 T411 T41243 3011 Eau Gallie High School 14 1 11 2 B007 T287 T289 T291 T293 T296 T298 T300 T450 T451 T454 T452 N066 N95055 4021 Edgewood Jr./Sr. High 6 6 T271 T273 T276 T464 T465 T46619 1051 Endeavour Elementary 9 2 7 T205 T257 T018 T204 T206 T211 T213 T275 T40190 0301 Enterprise Elementary 2 1 1 T259 T25822 1091 Fairglen Elementary 2 2 T222 T22564 5021 Freedom 7 Elementary 1 1 T24974 6101 Gemini Elementary 3 2 1 T325 T328 T01520 1071 Golfview Elementary 5 4 1 T114 T413 T414 T425 N24048 3061 Harbor City Elementary 8 8 N902 T109 T117 T118 T119 T285 T458 T459
125 2311 Heritage High68 6013 Holland Elementary73 6082 Hoover Middle 1 1 B00311 0151 Imperial Estates Elem72 6081 Indialantic Elementary 3 2 1 T111 T274 T04010 0141 Jackson Middle60 4111 Jefferson Middle45 3031 Johnson Middle 4 1 2 1 T294 N078 T283 T29242 2191 Jupiter Elementary 7 7 N014 N015 N033 N047 N079 N205 T21023 1101 Kennedy Middle 7 7 T110 T280 T313 T419 T424 T428 T43035 2111 Lockmar Elementary
107 3131 Longleaf Elementary3 0052 Madison Middle
112 1161 Manatee Elementary 7 5 2 T203 T265 T266 T322 T442 T302 T43440 2161 McAuliffe Elementary 8 8 N915 T021 T023 T339 T341 T344 T460 T46221 1081 McNair Middle Magnet
105 2041 Meadowlane Elementary120 2031 Meadowlane Intermediate Elem 12 1 11 B004 T236 T238 T241 T242 T245 T244 T247 T250 T253 T334 T40828 2011 Melbourne High 3 2 1 N124 T453 T45554 4011 Merritt Island High 6 2 1 3 T426 T429 T427 N072 N216 T04456 4031 Mila Elementary7 0101 Mims Elementary2 0051 Oak Park Elementary 4 3 1 T200 T201 T231 N247
71 6071 Ocean Breeze Elementary 9 8 1 N057 T246 T251 T279 T281 T286 T288 T290 N05334 2081 Palm Bay Elementary 9 8 1 T104 T105 T316 T416 T418 T423 T438 T463 N11329 2021 Palm Bay High 24 4 7 5 8 S210 S211 S212 S213 S200 S201 S202 S203 S204 S205 S206 S207 S208 S209 N068 N254 N942 N945 S111 S113 S115 S117 S119 T03413 0181 Pinewood Elementary 4 4 T343 T346 T228 T23032 2061 Port Malabar Elementary 4 4 N224 T335 T337 T342
114 3151 Quest Elementary 7 7 T295 T297 T431 T218 T226 T229 T23341 2171 Riviera Elementary 4 4 T106 T107 T317 T42116 1011 Rockledge High 3 3 N165 N168 N24163 5012 Roosevelt School49 3071 Sabal Elementary 5 5 N074 N939 T268 T323 T33866 6011 Satellite High 4 1 2 1 B052 T115 T116 T24826 1131 Saturn Elementary 8 1 6 1 T254 N204 T262 T263 T264 T415 T432 N20169 6051 Sea Park Elementary46 3041 Sherwood Elementary9 0121 South Lake Elementary
37 2122 Southwest Middle 4 4 T349 T351 T404 T407106 0302 Space Coast Jr./Sr. High 8 1 4 3 B051 T214 T216 T217 T219 T212 T223 T224

Relocatable Inventory School Year 2018-2019
FISH MSID School Current Total
Bath Room Port
Non-Class room
Class room Surplus Store DCR 1 2 3 4 5 6 7 8 9 10 11 12 13 14 15 16 17 18 19 20 21 22 23 24 25 26 27 28 29 30
87 4071 Stevenson Elementary33 2071 Stone Middle
116 2221 Sunrise Elementary 1 1 T46153 3121 Suntree Elementary 4 1 3 T326 T357 T436 B00570 6061 Surfside Elementary 6 6 N203 T282 T437 T314 T112 T1131 0011 Titusville High 2 2 N038 N045
57 4041 Tropical Elementary36 2121 Turner Elementary 2 2 T354 T35531 2051 University Park Elem 6 6 T320 T350 T352 T358 T403 T406
115 1171 Viera High 6 6 T232 T234 T239 T252 T255 T23730 2042 West Melbourne Elementary44 3141 West Shore Jr./Sr. High 11 2 7 2 B001 B948 N016 T319 T439 T446 T447 T448 T449 N028 N156
109 2212 Westside Elementary 1 1 T108111 1151 Williams Elementary 9 4 5 N056 N163 N181 N245 N073 N102 N128 N152 N155
SCHOOL TOTALS 339 11 11 248 35 32 2
84 9380 520 COMPOUND 11 1 5 5 B002 N094 N503 N905 N910 TT52 N211 N911 N930 N946 N94717 1031 Clearlake 8 1016 Cuyler
89 9860 ESF59 4101 Gardendale
123 0011 Gibson Field 1 1 N02983 9562 Plant Ops and Maint 15 13 2 N050 N134 N176 N193 N199 N213 N242 N505 N908 N912 N918 N927 T020 N130 T01382 1011 McLarty Stadium 3 3 N151 N179 N25947 9344 Mid-South Area Support 1 1 T001
113 9343 Manatee Bus85 9342 Melbourne Bus Compound78 9341 North Area Transportation 6 6 N007 N036 N185 N907 N909 N940
118 9344 Old Creel Bus 2 2 N248 T0175 0072 Riverview
88 9345 Satellite Bus Compound 4 4 N141 N184 N515 N95350 3081 South Pine Grove 1 1 T221
117 9662 West Melbourne Maint 6 6 LL01 N065 N167 N916 N936 T007119 2042 Westside Bus Compound 2 2 N920 N92376 0081 Whispering Hills
NON-SCHOOL TOTALS 52 1 43 1 0 0 7
GRAND TOTALS 391 12 54 249 35 32 9 0 Classroom Rated 0 Non-Classroom 0 Surplus Locked in Place 0 Board Approved DCR
0 Storage B Restroom B Surplus Restroom 0 DCR'ed /OUT OF FISH/Awaiting Removal
OWNED UNITSBlake Stinson N = 20x36 (720 gsf/ 683 nsf) TYPE VI (Standard) LL = 20x36 (720 gsf/ 683 nsf) TYPE VI (Mansard Roofs/ SBBC Built)Updated 2019-03-18 T = 13x50 (750 gsf/ 620 nsf) TYPE VI (Have Axles) S = 24x36 State Plans (846 gsf/ 788 nsf) TYPE IV
T100 = 24x36 (846 gsf/ 782 nsf) TYPE IV (Purchased 2002 - 2003) S200 = 24x36 Stackables (846 gsf/ 788 nsf) TYPE IV (Purchased 2006) T200-500 = 24x36 (846 gsf/ 788 nsf) TYPE IV (Purchased 2003 - 2006) B = Bathroom Units TYPE IV (Purchased 2006)

School Board of Brevard County FY 2019-2020 Student Accommodation Plan
Facilities Services / DGL Board Approved April 23, 2019
SECTION 7
ATTENDANCE BOUNDARY CHANGES
APPROVED FOR 2019-2020
A. Attendance Boundary Change Process B. 01-22-2019 School Board Meeting & Public Hearing –
Attendance Boundary Changes for the 2019-20 School Year C. 02-12-2019 School Board Meeting & Public Hearing –
Attendance Boundary Changes for the 2019-20 School Year D. Approved Attendance Boundary Change Maps
1. Longleaf to Quest Attendance Boundary Changes 2. Hoover to DeLaura Attendance Boundary Changes 3. Pinewood to Mims Attendance Boundary Changes
E. Pinewood Elementary/Mims Elementary Attendance Boundary Change, Affected Students Data and Analysis
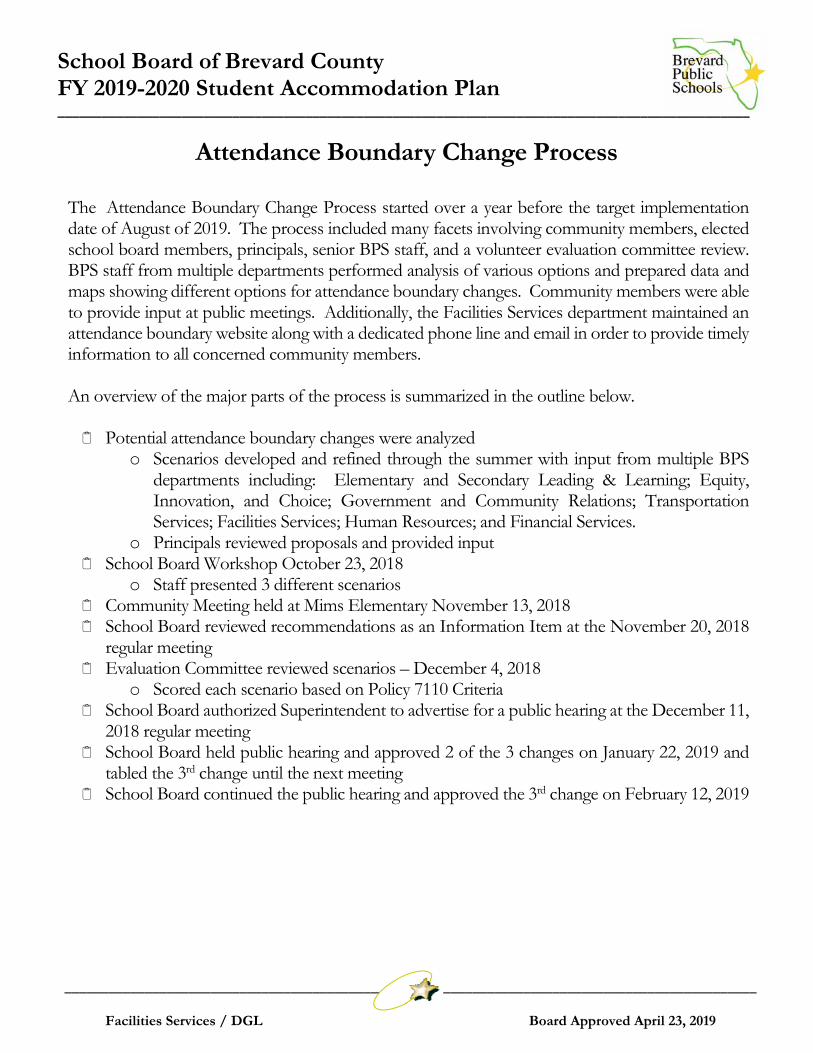
School Board of Brevard County FY 2019-2020 Student Accommodation Plan _______________________________________________________________________________________________
_______________________________________________________________________________________________ Facilities Services / DGL Board Approved April 23, 2019
Attendance Boundary Change Process
The Attendance Boundary Change Process started over a year before the target implementation date of August of 2019. The process included many facets involving community members, elected school board members, principals, senior BPS staff, and a volunteer evaluation committee review. BPS staff from multiple departments performed analysis of various options and prepared data and maps showing different options for attendance boundary changes. Community members were able to provide input at public meetings. Additionally, the Facilities Services department maintained an attendance boundary website along with a dedicated phone line and email in order to provide timely information to all concerned community members. An overview of the major parts of the process is summarized in the outline below. Potential attendance boundary changes were analyzed
o Scenarios developed and refined through the summer with input from multiple BPS departments including: Elementary and Secondary Leading & Learning; Equity, Innovation, and Choice; Government and Community Relations; Transportation Services; Facilities Services; Human Resources; and Financial Services.
o Principals reviewed proposals and provided input School Board Workshop October 23, 2018
o Staff presented 3 different scenarios Community Meeting held at Mims Elementary November 13, 2018 School Board reviewed recommendations as an Information Item at the November 20, 2018
regular meeting Evaluation Committee reviewed scenarios – December 4, 2018
o Scored each scenario based on Policy 7110 Criteria School Board authorized Superintendent to advertise for a public hearing at the December 11,
2018 regular meeting School Board held public hearing and approved 2 of the 3 changes on January 22, 2019 and
tabled the 3rd change until the next meeting School Board continued the public hearing and approved the 3rd change on February 12, 2019

3/15/2019 eagendatoc.brevardschools.org/01-22-2019 School Board Meeting & Public Hearing on Tuesday, January 22, 2019/3D4FD84C-AC19-47…
http://eagendatoc.brevardschools.org/01-22-2019%20School%20Board%20Meeting%20&%20Public%20Hearing%20on%20Tuesday,%20January%2… 1/2
01-22-2019 School Board Meeting & Public Hearing
Agenda Item #46 Title
Public Hearing - Attendance Boundary Changes for the 2019-20 School Year
Discussion
Three proposed attendance boundary changes were discussed at the School BoardWorkshop on October 23, 2018, as indicated on the attached maps. A summaryof the proposals was given as an Information Item at the November 20, 2018School Board Meeting.
Additionally, at the November 20, 2018 School Board Meeting, an EvaluationCommittee was appointed to review the proposed attendance boundary changes. The Evaluation Committee met on December 4, 2018 and scored the proposalsbased on the Administrative Procedure for Policy 7110 StudentAccommodation. The Evaluation Committee scoring summary was provided tothe Board at the December 11, 2018 School Board Meeting and the School Boardauthorized the Superintendent to advertise the public hearing regarding theproposed attendance boundary changes.
The proposals are as follows:
Quest Elementary and Longleaf Elementary: When this boundary wasoriginally drawn, there were no existing homes or single family lots in the area.Now that there have been approved subdivisions, the attendance boundary is nolonger logical. The proposed change moves the boundary a short distance alongan existing canal. No students are currently affected by this proposal.
DeLaura Middle School and Hoover Middle School: The current boundarydivides a dead end street. Homes at the southern end of the street are currentlyzoned for Hoover, but must drive through the DeLaura-zoned part of the street inorder to travel to Hoover Middle. The proposed change eliminates this situation.One student lives in this area and is currently attending DeLaura Middle School.
Mims Elementary and Pinewood Elementary: The goal of this proposal is tobalance the current and future enrollment at Mims Elementary and PinewoodElementary. The proposal moves 28 students from Pinewood Elementary to MimsElementary who are bused past Mims to Pinewood. The boundary change alsoincludes an area that is developing and could include almost 600 homes in thefuture. An attendance boundary change community meeting was held at MimsElementary School on November 13, 2018. Six parents participated and wereconcerned how the change would affect their children. A request was made toallow their children to stay in Pinewood if they provided their own transportation.
In addition to the attendance boundary changes, staff recommends specialconsideration to allow rising 5th and 6th graders affected by the Pinewood toMims attendance boundary change to remain at Pinewood Elementary.
Recommendation
Hold a public hearing and approve the proposed attendance boundary changes forthe 2019-2020 school year:
Quest Elementary and Longleaf ElementaryDeLaura Middle and Hoover Middle SchoolMims Elementary and Pinewood Elementary
Approve special consideration to allow rising 5th and 6th graders affected by theMims and Pinewood Elementary attendance boundary change to remain atPinewood Elementary (no transportation provided by BPS).

3/15/2019 eagendatoc.brevardschools.org/01-22-2019 School Board Meeting & Public Hearing on Tuesday, January 22, 2019/3D4FD84C-AC19-47…
http://eagendatoc.brevardschools.org/01-22-2019%20School%20Board%20Meeting%20&%20Public%20Hearing%20on%20Tuesday,%20January%2… 2/2
Meeting Date(s)
Information - 11/20/2018 Action - 12/11/2018
Public Hearing - 1/22/2019
Authority for Action F.S. 1001.42
Involves Expenditure of Funds Directly in the Classroom
No
Source of Funding Agenda Item will not Require the Expenditure of Funds
FY Amount Budgeted Fund Cost Center Project Function Object Program
Legal Counsel Review
No
Contact David Lindemann, Manager Facilities Planning & Intergovernmental Coordination
633-1000 ext. 463
Attachment: Evaluation Committee Scoring Matrix Summary 2018.pdf
Attachment: October 23 2018 Capacity Workshop Presentation.pdf Attachment: Community Meeting Summary and Correspondence.pdf
Attachment: Attendance Boundary Change Maps.pdf Attachment: Attendance Boundary Change Admin Procedure Supporting Policy
7110.pdf

4/3/2019 eagendatoc.brevardschools.org/02-12-2019 School Board Meeting on Tuesday, February 12, 2019/2A64C209-601B-4FF6-93FE-394BE5A…
eagendatoc.brevardschools.org/02-12-2019 School Board Meeting on Tuesday, February 12, 2019/2A64C209-601B-4FF6-93FE-394BE5A6B065-649… 1/1
02-12-2019 School Board Meeting
Agenda Item #35 Title
Public Hearing - Attendance Boundary Changes for the 2019-2020 School Year
Discussion The School Board tabled the public hearing regarding the proposed attendance
boundary changes affecting Pinewood Elementary and Mims Elementary at theJanuary 22, 2019 public hearing. As of January 22, 2019, there are 32 students within the area affected by theproposed attendance boundary change. Data regarding the number of students ineach grade is attached.
Recommendation
Continue the public hearing and approve the proposed attendance boundarychange for the 2019-2020 school year affecting Mims Elementary and PinewoodElementary. Approve special consideration to allow rising 5th and 6th graders affected by theMims and Pinewood Elementary attendance boundary change to remain atPinewood Elementary (no transportation provided by BPS). Meeting Date(s)
Public Hearing - 1/22/2019 Public Hearing - 2/12/2019
Authority for Action F.S. 1001.42
Involves Expenditure of Funds Directly in the Classroom
No
Source of Funding Agenda Item will not Require the Expenditure of Funds
FY Amount Budgeted Fund Cost Center Project Function Object Program
Legal Counsel Review
No
Contact David Lindemann, Manager Facilities Planning & Intergovernmental Coordination
633-1000 ext. 463
Attachment: Pinewood Mims Boundary Change Student Analysis.pdf
Attachment: Community Meeting Summary and Correspondence.pdf Attachment: Attendance Boundary Change Admin Procedure Supporting Policy
7110.pdf Attachment: Pinewood to Mims Attendance Boundary Change Map.pdf
Attachment: Pinewood Mims Evaluation Committee Scoring Matrix Summary2018.pdf
Attachment: Pinewood Mims excerpt - October 23 2018 Capacity WorkshopPresentation.pdf

Quest
Longleaf
Suntree
QUEST
±0 0.35 0.7 1.05 1.40.175Miles
Facilities ServicesPlanning and Project Management
Map by Blake StinsonNovember 2018
Longleaf to QuestAttendance Boundary Changes

Hoover
DeLaura
±0 0.025 0.05 0.075 0.10.0125Miles
Hoover to DeLauraAttendance Boundary Changes
Facilities ServicesPlanning and Project Management
Map by David LindemannNovember 2018

¹º
¹º
MIMS
PINEWOOD
Sources: Esri, HERE, DeLorme, USGS, Intermap, INCREMENT P, NRCan, Esri Japan, METI, Esri China (Hong Kong), Esri Korea, Esri (Thailand), MapmyIndia, NGCC, © OpenStreetMap contributors,and the GIS User Community ±
Pinewood to MimsAttendance Boundary Changes
Facilities ServicesPlanning and Project Management
Map by Blake StinsonNovember 2018
0 0.5 10.25 Miles

Pinewood Elementary/Mims Elementary Attendance Boundary Change
Affected Students Data and Analysis
As of January 22, 2019 there are 32 students within the area proposed for the attendance boundary change. The breakdown by grade is as follows:
Grade Number of Students Kindergarten 6
First 6 Second 4 Third 3
Fourth 4 Fifth 6 Sixth 3
Total 32
• 32 students live at 26 different addresses. All students at the same address are assumed to belong to a family, so 26 families are assumed.
o 1 out of 5 families does not have a student above grade 3.
o We do not have data about children under 5 who are not in school. Families may have additional children that have not entered school yet.
• If we eliminate current 4th 5th, and 6th graders (6th graders go to middle school and 4th and 5th graders are given special consideration to stay at Pinewood without transportation):
o 19 current students would be required to change schools.
• If school age siblings of 4th, 5th and 6th graders were also given special consideration to stay at Pinewood without transportation:
o 15 current students would be required to change schools.
• There are 5 families with more than one school age child in this area. This is the student grade breakdown for the five families:
Family Grades Alpha 3rd, 4th Beta 1st, 5th
Gamma 1st, 3rd Delta 5th, 6th
Epsilon 1st, 6th

School Board of Brevard County FY 2019-2020 Student Accommodation Plan
Facilities Services / DGL Board Approved April 23, 2019
SECTION 8
HISTORIC STUDENT ENROLLMENT DATA
A. Actual Student Enrollment for School Years 2005-06 to 2018-19
and Projected Student Enrollment for 2019-20 to 2023-24 B. Total Public School Membership 1960-2018 and Projected
Membership Fall 2019-2023 (Chart) C. Enrollment History and Projections For BPS, Charter Schools, and
Special Centers (Chart)

Facilities Services / DGL Board Approved April 23, 2019 Page 1 of 4
School 2005 2006 2007 2008 2009 2010 2011 2012 2013 2014 2015 2016 2017 2018 2019 2020 2021 2022 2023
New Viera Elementary 2020 513 639 788 788Allen 775 819 768 706 665 545 504 577 595 623 605 632 670 711 717 703 725 716 703Andersen 638 638 640 696 717 756 738 771 751 714 705 701 736 720 706 696 686 699 706Apollo 852 730 722 711 761 746 733 710 803 766 857 815 877 847 861 872 895 901 905Atlantis 816 778 765 762 687 639 640 614 568 618 582 648 693 713 693 668 669 658 641Audubon 672 657 635 574 475 496 532 473 670 646 644 599 566 536 538 490 485 476 483Cambridge 612 570 502 510 536 543 564 583 620 637 666 640 686 661 659 641 624 616 623Cape View 363 369 376 363 361 387 370 379 372 382 426 426 381 381 368 348 328 320 327Carroll 915 886 845 789 742 670 675 657 633 620 638 660 652 664 661 637 597 595 581Challenger 7 549 525 494 496 489 483 500 486 508 480 514 525 572 571 577 541 526 518 502Columbia 620 581 553 601 550 610 705 693 615 570 577 544 514 478 449 439 446 447 437Coquina 459 449 439 405 431 468 520 555 570 569 553 523 598 515 462 427 404 374 357Creel 989 873 819 760 759 930 900 946 941 972 931 940 888 845 853 855 876 919 932Croton 588 568 537 515 516 585 597 629 676 653 665 615 579 552 538 559 621 626 621Discovery 965 960 1,031 998 939 719 744 689 720 709 634 625 572 644 606 587 577 592 592Endeavour 531 554 551 588 581 747 798 843 816 808 836 890 821 662 649 619 590 569 573Enterprise 897 867 904 831 769 680 675 607 569 539 539 543 569 599 620 605 615 632 643Fairglen 818 769 716 714 732 694 667 679 714 689 691 703 699 681 675 680 705 732 745Freedom 7 425 420 412 414 413 403 414 410 404 407 413 409 408 387 414 414 414 414 414Gemini 602 593 588 607 631 610 564 536 510 503 483 451 430 468 467 451 430 417 418Golfview 584 607 635 634 630 653 661 640 648 675 647 619 589 555 517 521 510 512 503Harbor City 463 415 465 430 471 437 441 440 451 400 434 401 392 371 365 347 345 366 362Holland 424 415 418 416 378 413 420 394 415 427 432 466 485 497 510 510 507 509 511Imperial Estates 613 668 682 646 653 680 630 641 652 664 650 718 687 639 630 636 636 629 611Indialantic 818 785 764 745 779 755 725 744 756 762 753 751 746 740 737 741 740 750 765Jupiter 791 792 851 824 806 719 793 843 795 844 810 793 755 728 686 749 795 828 856Lockmar 759 746 713 748 787 695 734 781 770 786 721 728 743 699 674 659 655 684 677Longleaf 749 683 696 686 705 737 708 654 609 599 631 683 613 647 646 618 605 591 588Manatee 826 832 827 967 1,018 874 911 940 850 836 846 864 914 949 950 805 801 803 782McAuliffe 878 917 920 913 824 762 763 780 769 741 744 786 794 777 763 685 655 604 598Meadowlane Intermediate 519 505 540 973 1,076 900 890 929 1,003 1,010 1,002 868 847 851 886 943 978Meadowlane Primary 961 975 694 700 741 752 778 737 779 780 740 748 749 626 637 668 682 702 704Mila 407 403 365 384 420 512 516 517 481 496 495 534 494 465 449 442 447 447 483Mims 615 576 531 522 489 468 448 479 602 582 517 485 510 479 472 450 458 485 478Oak Park 764 744 750 705 664 646 609 686 825 847 856 922 896 723 675 658 637 629 622Ocean Breeze 622 571 561 547 536 555 560 545 531 510 532 519 527 532 524 511 497 490 490Palm Bay 689 706 716 696 702 803 816 848 850 859 815 799 632 615 607 622 598 649 683Pinewood 413 433 421 430 405 400 353 379 431 442 479 530 505 517 506 506 512 518 530Port Malabar 773 769 742 743 715 655 687 752 755 772 761 741 729 688 682 632 607 613 604Quest 646 740 858 855 849 857 842 861 711 774 848 900 1,000 1,089 1,144 970 947 875 874Riviera 631 626 564 587 575 644 709 758 727 715 690 647 681 692 687 771 847 852 844Roosevelt 517 514 462 408 413 443 439 414 409 371 375 359 390 380 360 338 331 324 322Sabal 574 571 573 587 573 602 580 601 609 585 565 550 544 538 533 516 507 494 485Saturn 767 731 740 702 736 792 797 829 738 748 785 763 764 853 877 894 933 987 1070Sea Park 353 293 301 300 305 310 354 393 321 343 330 339 317 321 333 301 302 335 350Sherwood 698 667 638 608 594 524 515 515 530 544 518 485 460 456 442 426 410 407 423South Lake Education Center 499 471 454 472 406 388 399 507 311 348 348 348 348 348Stevenson 259 261 427 449 464 480 484 489 485 483 489 484 495 506 509 509 509 509 509Sunrise 550 726 770 846 748 777 756 727 846 844 841 839 820 800 803 844 883 914
Historic and Projected Student Enrollment Data
Actual Membership for Fall of Year Projected Student Membership
Actual Student Enrollment for School Years 2005-06 to 2018-19 (Based on Mid-Oct. Count)Projected Student Enrollment for 2019-20 to 2023-24

Facilities Services / DGL Board Approved April 23, 2019 Page 2 of 4
School 2005 2006 2007 2008 2009 2010 2011 2012 2013 2014 2015 2016 2017 2018 2019 2020 2021 2022 2023
Historic and Projected Student Enrollment Data
Actual Membership for Fall of Year Projected Student Membership
Actual Student Enrollment for School Years 2005-06 to 2018-19 (Based on Mid-Oct. Count)Projected Student Enrollment for 2019-20 to 2023-24
Suntree 862 815 806 828 827 679 697 644 622 629 649 657 686 675 655 556 515 498 517Surfside 463 419 403 398 437 400 391 383 389 418 449 475 455 460 456 442 421 420 392Tropical 857 819 760 740 712 690 668 643 674 736 766 787 797 825 821 826 829 813 832Turner 745 693 765 734 696 664 741 772 715 760 689 631 611 562 519 521 509 502 516University Park 559 597 553 565 517 518 585 628 675 634 617 546 514 473 489 566 672 721 703West Melbourne 415 411 414 414 414 431 447 545 551 547 551 550 550 553 552 552 552 552 552Westside 1,245 773 825 844 839 779 821 756 803 769 700 712 733 769 724 733 737 829 892Williams 805 805 812 805 796 583 602 603 552 538 559 581 564 582 568 524 530 521 508Central 1,234 1,172 1,003 966 969 1,096 1,270 1,263 1,278 1,237 1,142 1,098 1,121 1,193 1,195 1,269 1,230 1,195 1207DeLaura 761 703 689 711 667 651 706 803 741 699 686 703 801 819 828 833 860 874 832Hoover 512 481 467 449 438 519 543 568 554 564 507 509 533 506 500 512 512 502 494Jackson 643 686 656 590 636 632 623 568 538 595 578 584 548 548 548 604 637 664 698Jefferson 734 712 699 689 673 685 643 623 643 651 615 606 629 660 662 631 595 573 530Johnson 1,011 1,012 962 946 894 860 836 794 796 787 785 791 803 736 746 816 797 764 761Kennedy 644 626 636 677 712 740 718 643 614 608 608 632 682 611 621 675 688 739 717Madison 688 665 660 586 579 548 484 497 514 470 438 444 460 492 496 491 465 455 475McNair 447 490 572 510 471 488 558 563 494 457 472 456 386 480 565 539 528 552 569Southwest 1,439 1,463 1,428 1,372 1,352 1,016 1,023 993 966 905 882 880 842 833 838 944 957 930 929Stone 726 683 665 665 662 754 774 802 816 784 836 839 822 791 824 961 1,041 975 985Cocoa 1,317 1,272 1,193 1,114 1,029 970 960 966 1,458 1,531 1,498 1,572 1,599 1,577 1,582 1,670 1,762 1,882 1929Cocoa Beach 1,543 1,551 1,528 1,470 1,402 1,383 1,389 1,246 1,164 1,127 1,102 1,064 1,004 1,013 1,007 977 975 950 924Edgewood 807 952 946 943 948 944 942 930 940 941 949 948 943 948 950 950 950 950 950Space Coast 2,171 2,168 2,161 1,962 1,833 1,742 1,650 1,552 1,498 1,528 1,474 1,519 1,597 1,586 1,590 1,588 1,556 1,513 1507West Shore 955 940 955 961 967 961 964 955 961 957 957 955 955 953 956 956 956 956 956Astronaut 1,482 1,404 1,382 1,309 1,228 1,153 1,171 1,128 1,144 1,137 1,108 1,132 1,070 1,076 1,081 1,101 1,144 1,176 1189Bayside 2,380 2,580 2,752 2,760 2,195 1,930 1,665 1,606 1,628 1,643 1,687 1,712 1,718 1,706 1,650 1,691 1,790 1,901 2009Eau Gallie 2,390 2,081 1,953 1,736 1,694 1,654 1,599 1,675 1,682 1,714 1,713 1,672 1,657 1,676 1,687 1,693 1,770 1,809 1832Heritage 932 1,327 1,759 1,797 1,795 1,825 1,851 1,855 1,778 1,831 1,807 1,856 1,966 2,041 2059Melbourne 2,291 2,342 2,274 2,190 1,981 1,997 1,967 1,945 2,013 2,131 2,227 2,304 2,217 2,113 2,134 2,198 2,353 2,455 2476Merritt Island 1,697 1,590 1,569 1,545 1,505 1,483 1,508 1,501 1,499 1,594 1,545 1,574 1,569 1,542 1,555 1,571 1,577 1,598 1583Palm Bay 2,621 2,577 2,529 2,324 2,108 1,893 1,739 1,587 1,555 1,599 1,570 1,637 1,587 1,543 1,583 1,706 1,796 2,011 2134Rockledge 1,786 1,559 1,421 1,238 1,204 1,242 1,269 1,377 1,372 1,374 1,447 1,460 1,537 1,516 1,520 1,541 1,583 1,599 1657Satellite 2,057 1,669 1,450 1,259 1,200 1,165 1,169 1,272 1,290 1,319 1,345 1,356 1,336 1,328 1,345 1,371 1,383 1,387 1392Titusville 1,591 1,567 1,482 1,398 1,425 1,391 1,386 1,282 1,322 1,326 1,393 1,394 1,412 1,381 1,343 1,411 1,456 1,590 1677Viera 918 1,424 1,941 2,026 2,117 2,237 2,022 1,976 2,032 2,002 2,117 2,109 2,157 2,195 2,263 2,445 2,605 2662
37,269 36,420 36,605 36,274 35,868 35,482 36,063 36,126 35,152 35,296 35,249 35,293 35,073 34,615 34,207 33,952 34,168 34,631 34,8679,336 9,127 8,855 8,610 8,458 8,385 8,600 8,587 7,954 7,757 7,549 7,542 7,627 7,669 7,823 8,275 8,310 8,223 8,1975,476 5,611 5,590 5,336 5,150 5,030 4,945 4,683 6,021 6,084 5,980 6,058 6,098 6,077 6,085 6,141 6,199 6,251 6,266
19,612 19,559 19,429 18,814 18,527 18,322 18,429 18,158 17,276 17,694 17,888 18,213 17,990 17,869 17,900 18,402 19,263 20,172 20,670
School District Grand Totals 71,693 70,717 70,479 69,034 68,003 67,219 68,037 67,554 66,403 66,831 66,666 67,106 66,788 66,230 66,015 66,770 67,940 69,277 70,000
Traditional School Totals 71,693 70,717 70,479 69,034 68,003 67,219 68,037 67,554 66,403 66,831 66,666 67,106 66,788 66,230 66,015 66,770 67,940 69,277 70,000 Year-to-Year Change (976) (238) (1,445) (1,031) (784) 818 (483) (1,151) 428 (165) 440 (318) (876) (215) 755 1,170 1,337 723Percentage Change -0.08% -1.36% -0.34% -2.05% -1.49% 1.22% -0.71% -1.70% 0.64% -0.25% 0.66% -0.47% -1.31% -0.32% 1.14% 1.77% 2.00% 1.06%
School District Group Totals

Facilities Services / DGL Board Approved April 23, 2019 Page 3 of 4
School 2005 2006 2007 2008 2009 2010 2011 2012 2013 2014 2015 2016 2017 2018 2019 2020 2021 2022 2023
Historic and Projected Student Enrollment Data
Actual Membership for Fall of Year Projected Student Membership
Actual Student Enrollment for School Years 2005-06 to 2018-19 (Based on Mid-Oct. Count)Projected Student Enrollment for 2019-20 to 2023-24
Special Schools and CentersNORTH/CENTRAL ALC 66 52 33 47 66 43 34 54 57 69 44 47 48 54 53 53 53 53 53SOUTH ALC 121 103 97 77 91 70 61 61 60 65 44 34 54 70 63 63 63 63 63NORTH ALC 45 43 32 41 31 31 40 32BREVARD COUNTY JAIL 6 5 5 8 9 5 9 7 7 7 7 7
BREVARD VIRTUAL INSTRUCTION 41 100 132 148 131 128 121 140 139 166 175 175 175 175 175
CENTER FOR DRUG FREE LIVING 21 19 29 27 30 30 27 26 25 28 30 30 31 30 30 30 30 30 30CROSSWINDS 12 17 9 13 11 6 8DETENTION CENTER 65 43 59 44 35 24 28 13 29 37 40 50 29 29 30 30 30 30 30DEVEREUX HOSPITAL 35 51 37 29 39 40 39 36 43 63 40 56 59 54 58 58 58 58 58DISTRICT MIGRANT 2 2
FIELDSTON PREPARATORY SCHL 85 69 62 59 71 73 76 62 57 106 109 107 106 111 115 115 115 115 115FRANCIS WALKER HALFWAY HOUSE 21 24 30 28 30 29 28 18 20 27 18INFANTS & TODDLERS 155 166 252 369 493 427 368 290 228 273 257 187 191 221 224 224 224 224 224HORACE MANN ACADEMY 161 126 119 117 114 112 131 119 111HOME EDUCATION 48 27 28 51 39 50 29 60 58 73 112 134 141 141 141 141 141 141 141MCKAY SCHOLARSHIPS 501 544 751 848 895 993 1,081 1,237 1,293 1,310 1,385 1,417 1,351 1,247 1,312 1,312 1,312 1,312 1,312OUTWARD BOUND 20 13 20 11 14 21 15 18 8 13 11 5 13 17 16 16 16 16 16PROJECT SEARCH 27 28 19 42 41 43 43 37 39 39 39 39 39RIVERDALE COUNTRY SCHL 149 161 144 119 116 120 116 115 105 141 112 111 87 74 69 69 69 69 69RIVERVIEW SCHOOL 66 110 133 132 128SPACE COAST MARINE 31 33 34 37 33 33 33 20SOUTH AREA HEAD START 33 33 33 32 32 34 32 34 34 34 34 34MELBOURNE CENTER FOR PERSONAL GROWTH 26 28 29 29 32 32 32 32 32 32 32
Totals: Special Schools and Centers
1,538 1,493 1,736 1,917 2,149 2,202 2,273 2,442 2,418 2,574 2,565 2,559 2,363 2,324 2,398 2,398 2,398 2,398 2,398
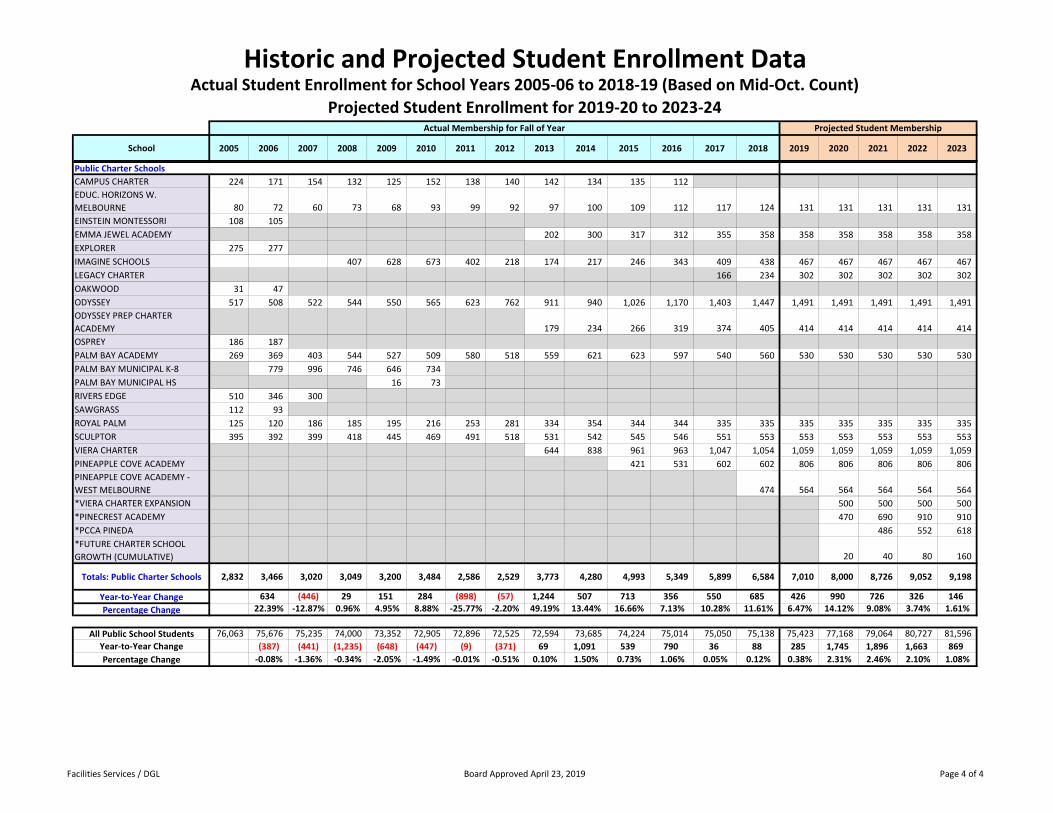
Facilities Services / DGL Board Approved April 23, 2019 Page 4 of 4
School 2005 2006 2007 2008 2009 2010 2011 2012 2013 2014 2015 2016 2017 2018 2019 2020 2021 2022 2023
Historic and Projected Student Enrollment Data
Actual Membership for Fall of Year Projected Student Membership
Actual Student Enrollment for School Years 2005-06 to 2018-19 (Based on Mid-Oct. Count)Projected Student Enrollment for 2019-20 to 2023-24
Public Charter SchoolsCAMPUS CHARTER 224 171 154 132 125 152 138 140 142 134 135 112EDUC. HORIZONS W. MELBOURNE 80 72 60 73 68 93 99 92 97 100 109 112 117 124 131 131 131 131 131EINSTEIN MONTESSORI 108 105EMMA JEWEL ACADEMY 202 300 317 312 355 358 358 358 358 358 358EXPLORER 275 277IMAGINE SCHOOLS 407 628 673 402 218 174 217 246 343 409 438 467 467 467 467 467LEGACY CHARTER 166 234 302 302 302 302 302OAKWOOD 31 47ODYSSEY 517 508 522 544 550 565 623 762 911 940 1,026 1,170 1,403 1,447 1,491 1,491 1,491 1,491 1,491ODYSSEY PREP CHARTER ACADEMY 179 234 266 319 374 405 414 414 414 414 414OSPREY 186 187PALM BAY ACADEMY 269 369 403 544 527 509 580 518 559 621 623 597 540 560 530 530 530 530 530PALM BAY MUNICIPAL K-8 779 996 746 646 734PALM BAY MUNICIPAL HS 16 73RIVERS EDGE 510 346 300SAWGRASS 112 93ROYAL PALM 125 120 186 185 195 216 253 281 334 354 344 344 335 335 335 335 335 335 335SCULPTOR 395 392 399 418 445 469 491 518 531 542 545 546 551 553 553 553 553 553 553VIERA CHARTER 644 838 961 963 1,047 1,054 1,059 1,059 1,059 1,059 1,059PINEAPPLE COVE ACADEMY 421 531 602 602 806 806 806 806 806PINEAPPLE COVE ACADEMY -WEST MELBOURNE 474 564 564 564 564 564*VIERA CHARTER EXPANSION 500 500 500 500*PINECREST ACADEMY 470 690 910 910*PCCA PINEDA 486 552 618*FUTURE CHARTER SCHOOL GROWTH (CUMULATIVE) 20 40 80 160
Totals: Public Charter Schools 2,832 3,466 3,020 3,049 3,200 3,484 2,586 2,529 3,773 4,280 4,993 5,349 5,899 6,584 7,010 8,000 8,726 9,052 9,198
Year-to-Year Change 634 (446) 29 151 284 (898) (57) 1,244 507 713 356 550 685 426 990 726 326 146Percentage Change 22.39% -12.87% 0.96% 4.95% 8.88% -25.77% -2.20% 49.19% 13.44% 16.66% 7.13% 10.28% 11.61% 6.47% 14.12% 9.08% 3.74% 1.61%
All Public School Students 76,063 75,676 75,235 74,000 73,352 72,905 72,896 72,525 72,594 73,685 74,224 75,014 75,050 75,138 75,423 77,168 79,064 80,727 81,596 Year-to-Year Change (387) (441) (1,235) (648) (447) (9) (371) 69 1,091 539 790 36 88 285 1,745 1,896 1,663 869Percentage Change -0.08% -1.36% -0.34% -2.05% -1.49% -0.01% -0.51% 0.10% 1.50% 0.73% 1.06% 0.05% 0.12% 0.38% 2.31% 2.46% 2.10% 1.08%

Facilities Services/DGL Board Approved April 23, 2019 1 of 1
0
5000
10000
15000
20000
25000
30000
35000
40000
45000
50000
55000
60000
65000
70000
75000
80000
85000
1960
1961
1962
1963
1964
1965
1966
1967
1968
1969
1970
1971
1972
1973
1974
1975
1976
1977
1978
1979
1980
1981
1982
1983
1984
1985
1986
1987
1988
1989
1990
1991
1992
1993
1994
1995
1996
1997
1998
1999
2000
2001
2002
2003
2004
2005
2006
2007
2008
2009
2010
2011
2012
2013
2014
2015
2016
2017
2018
2019
2020
2021
2022
2023
Total Public School Membership 1960-2018Projected Membership Fall 2019-2023
Total Enrollment Projected Enrollment

Facilities Services/DGL Board Approved April 23, 2019 1 of 1
0
10000
20000
30000
40000
50000
60000
70000
80000
2012 2013 2014 2015 2016 2017 2018 2019 2020 2021 2022 2023
2529 37
73
4280
4993
5349
5996
6584
6755
5
6640
3
6683
1
6666
6
6710
6
6669
0
6623
0
2442
2418
2574
2565
2559
2363
2324
7010 8000
8726
9052
9198
6601
5
6677
0
6794
0
6927
7
7000
0
2398
2361
2398
2398
2398
Enrollment History and Projections ForBPS, Charter Schools, and Special Centers
Charter Enrollment
BPS Enrollment
Special Centers Enrollment
Charter Projections
BPS Projections
Special Centers Projections

School Board of Brevard County FY 2019-2020 Student Accommodation Plan
Facilities Services / DGL Board Approved April 23, 2019
SECTION 9
GEOGRAPHIC INFORMATION SYSTEM
ENROLLMENT AND CAPACITY ANALYSIS
A. Geographic Capacity Analysis Overview B. Elementary School Analysis
1. 2018 – 2019 Elementary Student Enrollment and Permanent Capacity Utilization 2. 2018 – 2019 Elementary Student Enrollment and Total Capacity Utilization 3. 2023 – 2024 Elementary Student Enrollment and Permanent Capacity Utilization 4. 2023 – 2024 Elementary Student Enrollment and Total Capacity Utilization
C. Middle School Analysis 1. 2018 – 2019 Middle School Student Enrollment and Permanent Capacity Utilization 2. 2018 – 2019 Middle School Student Enrollment and Total Capacity Utilization 3. 2023 – 2024 Middle School Student Enrollment and Permanent Capacity Utilization 4. 2023 – 2024 Middle School Student Enrollment and Total Capacity Utilization
D. High School Analysis 1. 2018 – 2019 High School Student Enrollment and Permanent Capacity Utilization 2. 2018 – 2019 High School Student Enrollment and Total Capacity Utilization 3. 2023 – 2024 High School Student Enrollment and Permanent Capacity Utilization 4. 2023 – 2024 High School Student Enrollment and Total Capacity Utilization

School Board of Brevard County FY 2019-2020 Student Accommodation Plan _______________________________________________________________________________________________
_______________________________________________________________________________________________ Facilities Services / DGL Board Approved April 23, 2019
Geographic Capacity Analysis Overview
The Brevard County School District includes 83 schools within a geographic region that extends about 70 miles from north to south. Many schools are located on the barrier islands and are accessible to the mainland by several major causeways. Because of this geography, locational analysis is an important consideration in the facilities planning process. The picture shown on this page provides a general overview of the Brevard County geography and the locations of the district owned elementary and secondary schools. Section 9 of this 2019-2020 Student Accommodation Plan is a map series that depicts the capacity utilization of Brevard Public Schools. The maps are organized around three variables:
• School Level - Elementary, Middle, and High ** Please note that the junior/senior high schools
are shown on both the middle school and high school maps because they have concurrent middle school and high school attendance boundaries.
• Year of Student Enrollment Statistics School Year 2018-19 - Actual Enrollment School Year 2023-24 - Projected Enrollment
• Capacity Type Total Factored Capacity – School capacity
including relocatable classrooms Permanent Factored Capacity – School capacity
in permanent buildings only
The map series looks at each school level by year and provides a visual narrative of numerical values representing total factored capacity utilization versus the permanent factored capacity utilization. A detailed account of the calculations can be found in Section 3 and Section 5 of this report. These choropleth maps display the school attendance boundaries with a color in relation to the range of utilization rates. The red areas have the highest utilization rates while the green areas have the lowest utilization rates. Comparing the total capacity maps with the permanent capacity maps shows whether or not a particular school is already using relocatable capacity. A school without any relocatable classrooms will have the same utilization rate for total and permanent capacity and each map will show the same color.

Sunrise
Westside
Sabal
Allen
Pinewood
Fairglen
Quest
Manatee
Mims
Jupiter
Oak Park
Meadowlanes
Apollo
Saturn
Longleaf
Carroll
Imperial Estates
Port Malabar
Discovery
Enterprise
Turner
Riviera
Williams
Golfview
Andersen
Atlantis
Gemini
Creel
Mila
Tropical
Suntree
Harbor City
Palm Bay
Lockmar
Roosevelt
Columbia
Coquina
Audubon
University Park
Cape View
Indialantic
McAuliffe
Cambridge
Sherwood
Croton
Endeavour
Ocean Breeze
Challenger 7
Surfside
Holland
Sea Park
±
LEGENDPermanent CapacityUtilization
less than 70%
70% to 79%
80% to 89%
90% to 99%
100% or more
0 8 164 Miles
2018 - 2019 Elementary Student EnrollmentPermanent Capacity Utilization
Facilities ServicesPlanning and Project Management
Map by David LindemannApril 2019
Based on Actual EnrollmentOctober 12, 2018

Sunrise
Westside
Sabal
Allen
Pinewood
Fairglen
Quest
Manatee
Mims
Jupiter
Oak Park
Meadowlanes
Apollo
Saturn
Longleaf
Carroll
Imperial Estates
Port Malabar
Discovery
Enterprise
Turner
Riviera
Williams
Golfview
Andersen
Atlantis
Gemini
Creel
Mila
Tropical
Suntree
Harbor City
Palm Bay
Lockmar
Roosevelt
Columbia
Coquina
Audubon
University Park
Cape View
Indialantic
McAuliffe
Cambridge
Sherwood
Croton
Endeavour
Ocean Breeze
Challenger 7
Surfside
Holland
Sea Park
±
LEGENDTotal Capacity Utilization
less than 70%
70% to 79%
80% to 89%
90% to 99%
100% or more
0 8 164 Miles
2018 - 2019 Elementary Student EnrollmentTotal Capacity Utilization
Facilities ServicesPlanning and Project Management
Map by Blake StinsonApril 2019
Based on Actual EnrollmentOctober 12, 2018

Sunrise
Westside
Sabal
Allen
Pinewood
Fairglen
Quest
Manatee
Mims
Jupiter
Oak Park
Meadowlanes
Apollo
Saturn
Longleaf
Carroll
Imperial Estates
Port Malabar
Discovery
Enterprise
Turner
Riviera
Williams
Golfview
Andersen
Atlantis
Gemini
Creel
Mila
Tropical
Suntree
Harbor City
Palm Bay
Lockmar
Roosevelt
Columbia
Coquina
Audubon
University Park
Cape View
Indialantic
McAuliffe
Cambridge
Sherwood
Croton
Endeavour
Ocean Breeze
Challenger 7
Surfside
Holland
Sea Park
±
LEGENDPermanent CapacityUtilization
less than 70%
70% to 79%
80% to 89%
90% to 99%
100% or more
0 8 164 Miles
2023 - 2024 Elementary Student EnrollmentPermanent Capacity Utilization
Facilities ServicesPlanning and Project Management
Map by Blake StinsonApril 2019
Based on 2023-24 Projected Enrollmentand 2018-19 School Capacities

Sunrise
Westside
Sabal
Allen
Pinewood
Fairglen
Quest
Manatee
Mims
Jupiter
Oak Park
Meadowlanes
Apollo
Saturn
Longleaf
Carroll
Imperial Estates
Port Malabar
Discovery
Enterprise
Turner
Riviera
Williams
Golfview
Andersen
Atlantis
Gemini
Creel
Mila
Tropical
Suntree
Harbor City
Palm Bay
Lockmar
Roosevelt
Columbia
Coquina
Audubon
University Park
Cape View
Indialantic
McAuliffe
Cambridge
Sherwood
Croton
Endeavour
Ocean Breeze
Challenger 7
Surfside
Holland
Sea Park
±
LEGENDTotal Capacity Utilization
less than 70%
70% to 79%
80% to 89%
90% to 99%
100% or more
0 8 164 Miles
2023 - 2024 Elementary Student EnrollmentTotal Capacity Utilization
Facilities ServicesPlanning and Project Management
Map by Blake StinsonApril 2019
Based on 2023-24 Projected Enrollmentand 2018-19 School Capacities

Southwest
Central
Madison
Stone
Johnson
Cocoa
Kennedy
Jackson
DeLaura
McNair
Jefferson
Space Coast
Hoover
Cocoa Beach
±
LEGENDPermanent CapacityUtilization
less than 70%
70% to 79%
80% to 89%
90% to 99%
100% or more
0 8 164 Miles
2018 - 2019 Middle School Student EnrollmentPermanent Capacity Utilization
Facilities ServicesPlanning and Project Management
Map by David LindemannApril 2019
Based on Actual EnrollmentOctober 12, 2018

Southwest
Central
Madison
Stone
Johnson
Cocoa
Kennedy
Jackson
DeLaura
McNair
Jefferson
Space Coast
Hoover
Cocoa Beach
±
LEGENDTotal Capacity Utilization
less than 70%
70% to 79%
80% to 89%
90% to 99%
100% or more
0 8 164 Miles
2018 - 2019 Middle School Student EnrollmentTotal Capacity Utilization
Facilities ServicesPlanning and Project Management
Map by Blake StinsonApril 2019
Based on Actual EnrollmentOctober 12, 2018

Southwest
Central
Madison
Stone
Johnson
Cocoa
Kennedy
Jackson
DeLaura
McNair
Jefferson
Space Coast
Hoover
Cocoa Beach
±
LEGENDPermanent CapacityUtilization
less than 70%
70% to 79%
80% to 89%
90% to 99%
100% or more
0 8 164 Miles
2023 - 2024 Middle School Student EnrollmentPermanent Capacity Utilization
Facilities ServicesPlanning and Project Management
Map by Blake StinsonApril 2019
Based on 2023-24 Projected Enrollmentand 2018-19 School Capacities

Southwest
Central
Madison
Stone
Johnson
Cocoa
Kennedy
Jackson
DeLaura
McNair
Jefferson
Space Coast
Hoover
Cocoa Beach
±
LEGENDTotal Capacity Utilization
less than 70%
70% to 79%
80% to 89%
90% to 99%
100% or more
0 8 164 Miles
2023 - 2024 Middle School Student EnrollmentTotal Capacity Utilization
Facilities ServicesPlanning and Project Management
Map by Blake StinsonApril 2019
Based on 2023-24 Projected Enrollmentand 2018-19 School Capacities

Bayside
Viera
Astronaut
Heritage
Cocoa
Eau Gallie
Titusville
Palm Bay
Rockledge
Melbourne
Space Coast
Merritt Island
Satellite
Cocoa Beach
±
LEGENDPermanent CapacityUtilization
less than 70%
70% to 79%
80% to 89%
90% to 99%
100% or more
0 8 164 Miles
2018 - 2019 High School Student EnrollmentPermanent Capacity Utilization
Facilities ServicesPlanning and Project Management
Map by Blake StinsonApril 2019
Based on Actual EnrollmentOctober 12, 2018

Bayside
Viera
Astronaut
Heritage
Cocoa
Eau Gallie
Titusville
Palm Bay
Rockledge
Melbourne
Space Coast
Merritt Island
Satellite
Cocoa Beach
±
LEGENDTotal Capacity Utilization
less than 70%
70% to 79%
80% to 89%
90% to 99%
100% or more
0 8 164 Miles
2018 - 2019 High School Student EnrollmentTotal Capacity Utilization
Facilities ServicesPlanning and Project Management
Map by Blake StinsonApril 2019
Based on Actual EnrollmentOctober 12, 2018

Bayside
Viera
Astronaut
Heritage
Cocoa
Eau Gallie
Titusville
Palm Bay
Rockledge
Melbourne
Space Coast
Merritt Island
Satellite
Cocoa Beach
±
LEGENDPermanent CapacityUtilization
less than 70%
70% to 79%
80% to 89%
90% to 99%
100% or more
0 8 164 Miles
2023 - 2024 High School Student EnrollmentPermanent Capacity Utilization
Facilities ServicesPlanning and Project Management
Map by Blake StinsonApril 2019
Based on 2023-24 Projected Enrollmentand 2018-19 School Capacities

Bayside
Viera
Astronaut
Heritage
Cocoa
Eau Gallie
Titusville
Palm Bay
Rockledge
Melbourne
Space Coast
Merritt Island
Satellite
Cocoa Beach
±
LEGENDTotal Capacity Utilization
less than 70%
70% to 79%
80% to 89%
90% to 99%
100% or more
0 8 164 Miles
2023 - 2024 High School Student EnrollmentTotal Capacity Utilization
Facilities ServicesPlanning and Project Management
Map by Blake StinsonApril 2019
Based on 2023-24 Projected Enrollmentand 2018-19 School Capacities

School Board of Brevard County FY 2019-2020 Student Accommodation Plan _______________________________________________________________________________________________
_______________________________________________________________________________________________ Facilities Services / DGL Board Approved April 23, 2019
If you have any questions about this report or would
like any additional information, please contact:

NON-DISCRIMINATION NOTICE
The School Board of Brevard County, Florida prohibits discrimination on the basis of race, color, national origin, sex (including sexual orientation,
transgender status, or gender identity), disability (including HIV, AIDS, or sickle cell trait), pregnancy, marital status, age (except as authorized by law),
religion, military status, ancestry, or genetic information or any other factor protected under applicable federal, state, or local law, or local law in its
educational programs, services or activities, or in its hiring or employment practices. The School Board of Brevard County is in compliance with the
Americans with Disabilities Act of 1990 (ADA) and the Amendment Act of 2008 (ADAA), the Florida Education Equity Act of 1984, Age Discrimination
Act of 1967 and Section 504 of the Rehabilitation Act of 1973, Civil Rights Act of 1964 including: Title II, Title VI, and Title VII, United Stated Education
Amendments of 1972 - Title IX, Age Discrimination in Employment Act (ADEA), Individuals with Disabilities Act (IDEA), and the Boy Scouts of America
Equal Access Act.
Students, parents, or the public with inquiries regarding this non-discrimination policy are encouraged to review Board Policy 2260.01 - Nondiscrimination
Grievance Procedure and Board Policy 5517 - Harassment. Students, parents, or the public with questions or wish to file a grievance may contact their
school administrator directly or if there is an issue in doing this, you may contact:
Student Equity Coordinator
Ms. Stephanie Archer
Asst. Supt. Equity, Innovation, and
Choice
2700 Judge Fran Jamieson Way
Melbourne, FL 32940
(321) 633-1000, Ext. 500
Exceptional Education/504
Coordinator
Dr. Patricia Fontan
Director, Exceptional Student
Education
2700 Judge Fran Jamieson Way
Melbourne, FL 32940
(321) 633-1000, Ext. 500
Title IX
Mr. Bill Macheras
Asst. Dir., Athletics and Activities
2700 Judge Fran Jamieson Way
Melbourne, FL 32940
(321)633-1000, Ext. 500
Employees or job applicants with inquiries regarding this non-discrimination policy are encouraged to review Board Policy 3122 - Equal Employment
Opportunity and 3362 - Anti-Harassment. Employees or job applicants with questions or wish to file a grievance may contact their school/department
administrator or if there is an issue in doing this, you may contact:
Employee/Job Applicant Equity Coordinator
Mr. Rivers Lewis
Director, Human Resources and Labor Relations
2700 Judge Fran Jamieson Way
Melbourne, FL 32940
(321) 633-1000, Ext. 500
Reasonable accommodations are available for persons with disabilities to complete the application and/or interview process. Applicants/Individuals
with disabilities requesting accommodations under the Americans with Disabilities Act (ADA) may contact the Employee/Job Applicant Equity
Coordinator for assistance. All policies and procedures of the School Board of Brevard County as indicated above can be located on the World Wide Web
at the following web address: http://www.neola.com/brevardco-fl/. This Publication or portions of this publication can be made available to persons
with disabilities in a variety of formats, including large print, braille or audiotape. Telephone or written request should include your name, address, and
telephone number. Requests should be made to Kim Parker, Exceptional Education Projects, (321) 633-1000, ext. 535, at least two (2) weeks prior to the
time you need the publication.


