Download - Preservice Teachers' Development and Implementation of Science Performance Assessment Tasks
JUDITH A. MORRISON�, AMY ROTH McDUFFIE and VALARIE L. AKERSON
PRESERVICE TEACHERS’ DEVELOPMENT ANDIMPLEMENTATION OF SCIENCE PERFORMANCE ASSESSMENT
TASKS
ABSTRACT. Preservice teachers in a science methods course were provided instructionon performance assessment, then guided through a design and implementation process ofperformance assessment tasks. We assessed the effect of designing and implementing aperformance assessment task on preservice teachers’ understanding of standards-based as-sessment. The findings show that these preservice teachers improved in their understandingof assessment as a formative process as well as their science content understanding of thetopic addressed in their designed task. We found that preservice teachers need to experi-ment with performance assessment tasks in an authentic context in order to understand thefull potential and value of the task.
KEY WORDS: field-based experience, performance assessment, science methods, stand-ards-based assessment
The research project described in this paper explored how a field-basedproject involving preservice teachers’ development and implementationof science performance assessment tasks in K-8 classrooms affected thepreservice teachers’ understanding of standards-based assessment and in-struction. Preservice teachers in a science methods course were providedinstruction on performance assessment, then guided through a design andimplementation process of performance assessment tasks.
Performance Assessment
Science reform efforts (American Association for the Advancement ofScience (AAAS), 1993; National Research Council (NRC), 1996) havecalled for students becoming more involved in their own learning basedon the philosophy that student understanding is facilitated by active in-volvement. The science reforms have required that students be assessed ontheir scientific reasoning and understanding rather than only their discretescientific knowledge. This type of assessment, often termed performanceassessment, may be problematic to define. According to Champagne andKouba (2000), alternative definitions for the term performance assessmentare abundant. They state that performance assessment involves data suchas student writing being analyzed “not only on the scientific accuracy
� Author for correspondence.
International Journal of Science and Mathematics Education (2005) 3: 379–406© National Science Council, Taiwan 2005
380 J.A. MORRISON ET AL.
of the writing but also on the quality of the reasoning” (p. 226). Sten-mark’s (1991) definition of performance assessment provides a descrip-tion of the type of assessment recommended by the NRC (1996) “Perfor-mance assessment . . . involves presenting students with a . . . task, project,or investigation, then observing, interviewing, and looking at their prod-ucts to assess what they actually know” (p. 13). According to Shavelson,Baxter & Pine (1992), performance assessment is characterized by stu-dents performing concrete, meaningful tasks scored on the reasonable-ness of the procedure not simply on achieving the correct answer. Us-ing students’ performances to assess understanding of concepts in sciencehas been recommended by Shymansky, Chidsey, Henriquez, Enger, Yore,Wolfe & Jorgenson (1997). Well-designed assessment tasks not only as-sess student understanding but teach concepts and require students to ex-plain and communicate their solutions (Darling-Hammond & Falk, 1997;Shepard, 2000). Performance assessment is well-suited to this purpose be-cause of its focus on the application of knowledge in an authentic contextfor an authentic purpose. According to Shepard, Flexer, Hiebert, Marion,Mayfield & Weston (1996), performance assessment is advantageous be-cause it provides the opportunity to examine the process as well as theproduct and represents a full range of learning outcomes by assessingstudents’ writing, products, and behavior. Performance assessment allowsteachers to assess higher order thinking skills and deeper understandings(Firestone, Mayrowetz & Fairman, 1998). Kelly & Kahle (1999) foundthat science students who took performance assessment tests were betterable to explain their reasoning and conceptions than students who tooktraditional tests, leading to the conclusion that they had stronger under-standings as a result of working through the performance task.
The instructional benefits of using performance assessment strategiesseem to be established but it is not clear that teachers can easily or quicklylearn to implement these strategies in practice. When Firestone et al. (1998)studied the instructional strategies of teachers who were required to useperformance assessment in their instruction to prepare students for statetests, they saw little change in the teachers’ instructional strategies. Fire-stone et al. (1998) identified two major barriers to change: a lack of sophis-ticated content knowledge necessary for implementation of performanceassessment and a lack of rich tasks and problems in the curricular materialsnecessary to support this approach to instruction. To effectively implementperformance assessment, Firestone et al. (1998) concluded teachers needsubstantive training opportunities (not just new policies requiring the newassessment approaches) and new curricular materials aligned with perfor-
SCIENCE PERFORMANCE ASSESSMENT TASKS 381
mance assessment strategies and a standards-based vision for teaching andlearning.
In accordance with Firestone et al.’s (1998) research, Borko, Mayfield,Marion, Flexer & Cumbro (1997) found that for teachers to effectively useand realize the benefits of performance assessment approaches, they needsubstantive and sustained professional development. Borko et al.(1997) also indicated that time was a major obstacle to implementing per-formance assessment approaches. Specifically, teachers were found to needtime to plan for implementation of new strategies, employ more complexscoring rubrics, administer the assessment tasks, record observations ofstudents, and interview students before, during, and after the performanceassessment. All of the findings establishing that time is necessary for teach-ers to learn to use and to actually implement performance assessment tasksare germane to our study in which we attempted to inform preserviceteachers about performance assessment in one semester.
Field Experiences
Educational researchers and students bound for a teaching career agreethat there is a need for more direct, specific, and practical experiences inclassrooms prior to student teaching (Anderson & Mitchener, 1994; NRC,1996). Field experiences early in the teacher training have a lasting effect.Schoon & Sandoval (1997) indicate that more “real-world” opportunitiesfor preservice teachers to practice their skills will help them gain necessaryskills faster. Borko et al. (1997) emphasized the importance of situatingpreservice teacher learning in classroom practice for professional growth.They found that a key component of their program was their teachers’ability to experiment with and implement the ideas of professional devel-opment workshops in their own classroom practice and then to reflect othese efforts in follow-up workshops.
Putnam & Borko (2000) argue that for teachers to construct newknowledge about their practice, the learning needs to be situated in au-thentic contexts. First, learning needs to be situated in authentic activ-ities in classrooms to support a transfer to practice. Preservice teachersneed a combination of university learning for theoretical foundations andschool-based learning for a situated perspective. Second, preservice andinservice teachers should participate in discourse communities as part oflearning and enculturation in the profession. Preservice teachers, in partic-ular, need to learn about and contribute to a community’s way of thinking(Putnam & Borko, 2000).
Spector (1999) recommends having preservice teachers work with in-service teachers to help them better apply newly learned teaching and
382 J.A. MORRISON ET AL.
assessment strategies. This finding is in line with Dickinson, Burns, Hagen& Locker’s (1997) finding that important changes in science teaching cantake place with the support of an enthusiastic peer.
As well as providing valuable experiences for preservice teachers, field-based experiences can be beneficial for the inservice teachers who areinvolved in mentoring the preservice teachers. The inservice teachers havethe opportunity to be exposed to new strategies and techniques, share theirown strategies and techniques, and collaborate in the evaluation of stu-dent work. Learning experiences for both preservice and inservice teachersmust include inquiries into the difficulties and questions teachers regu-larly face (NRC, 1996). It is essential that teachers, both preservice andinservice, have opportunities to observe, practice, and evaluate appropriateassessment tasks.
METHODS
This study was interpretive in nature (Strauss & Corbin, 1990); qualitativemeasures were used to examine perspectives and meanings that preserviceteachers formed about teaching and learning. We defined two researchquestions for this study: (1) When instruction on and use of performanceassessment is emphasized in a science methods course, and the task isimplemented in a field-based situation, what is the nature of preserviceteachers’ learning and development toward standards-based assessmentstrategies? (2) What was the efficacy of the project in providing meaningfulfield-based learning?
Participants
Participants included 25 preservice teachers enrolled in an elementary sci-ence methods course at a mid-sized Northwestern University. The studentswere working on a Bachelors degree in elementary education (including anendorsement to teach grades K-8). This group of preservice teachers wascomprised of 5 males and 20 females; the students ranged in age from 19to 55 with the average age being 32. The participants entered the sciencemethods course with a variety of background knowledge about science.The most common profile was that of students having had two sciencelab courses during their two years in a community college. Prior to theelementary science methods course, the preservice teachers had been en-rolled in an assessment course where they were introduced to performanceassessment as an alternative assessment strategy. They were not asked touse or create performance assessment tasks in this assessment course, they
SCIENCE PERFORMANCE ASSESSMENT TASKS 383
were simply provided with the definition that a performance assessmenttask requires students to demonstrate their knowledge in some way.
Context
The science methods course was a three-credit, one-semester course.Classes were held weekly in 3 hour blocks throughout the semester. Themajority of the preservice teachers enrolled in the science methods coursewere concurrently enrolled in a math methods course. Throughout bothcourses performance assessment instruction was coordinated (i.e., taskscould combine math and science content, instruction was not duplicatedfrom one course to the other, and course assignments were similar). Thescience methods course aimed to help preservice teachers develop(a) a theoretical framework for teaching science at the elementary level,(b) a repertoire of methods for teaching science, (c) favorable attitudestoward science and science teaching, and (d) deeper understanding of aspecific science content area.
Performance assessment activities spanned the semester with the majorevents as follows: introductory performance assessment workshop heldduring regular class meeting (week 3); performance assessment topics se-lected and researched (weeks 3–5); proposal for task and written reviews ofresearch-based journal articles on topic submitted (week 5); oral and writ-ten feedback on proposals provided by instructor, and mentors assigned(week 6); preservice teachers and mentors met during class time to plantask (week 7); draft of task submitted to instructor and mentors (week 8);tasks revised and then implemented in mentor teachers’ classrooms (weeks9–12); reports containing analysis, findings, and reflections on students’work on the task submitted to instructor (week 13); lesson plan based onperformance assessment findings submitted (week 14). For a full descrip-tion of the performance assessment project assignments, see Appendix A.More detailed information on the assignments have been provided in anearlier published work (Roth McDuffie, Akerson & Morrison, 2003).
Introductory Assessment Workshop. The workshop was conducted dur-ing the regular methods class meeting time for a three hour period.A collaborative team (made up of expert middle school teachers and math-ematics and science methods instructors) planned and facilitated the work-shop with team members leading different parts of the workshop. It wasconducted to (a) briefly discuss general assessment issues, (b) providean overview of the standards-based assessment program in WashingtonState (e.g., see Washington Commission on Student Learning, 1998), and
384 J.A. MORRISON ET AL.
(c) introduce the preservice teachers to performance assessment issues andstrategies.
To introduce the preservice teachers to performance assessment weasked them to work in groups on a sample performance assessment taskthat was written and field-tested as part of an assessment program in Wash-ington State. This mathematical task was chosen due to time limitations;we purposefully chose a task that could be previewed in a short periodof time. The task required the preservice teachers to design a cereal boxthat would reduce the amount of cardboard needed and still maintain aspecific volume, and then to write a letter to the cereal company describingand defending their design. While we only provided approximately twentyminutes for the preservice teachers to work on the task, they had enoughtime to identify key issues of the task and key components of task-design.Next, we discussed some of the features of the task (e.g., an open-endedquestion; the descriptive and persuasive writing component; the multi-ple entry points and various solution methods possible in performing thetask, etc.). Although the main concepts addressed in this sample task weremathematical, the task contained the general features of a performance as-sessment task such as requiring generation of information, discriminationbetween relevant and irrelevant information, requiring a written product,and an explanation of work. After a brief discussion of the task, we gave thegroups scoring rubrics and samples of students’ work on the task at variousperformance levels. Using the scoring rubrics, the groups assigned scoresto their sample students’ work. Following this group work, we discussedthe scoring process, the rubrics, and the task as a class.
Next, we worked to formalize their knowledge of performance assess-ment by discussing defining characteristics of performance assessment,advantages, and limitations. We concluded the workshop with an intro-duction of the planning guide and provided an hour for preservice teachersto generate ideas for and obtain feedback on their performance assessmentprojects while the expert teachers were available to answer questions.
Researching Topics and Generating a Plan for the Task. The preserviceteachers worked individually to generate performance task ideas that re-lated to their science content area of study. The performance assessmenttask was related to earlier student interview and lesson plan assignmentscentered on the same science content. The preservice teachers selected arange of grade levels for which they would be most interested in designingand implementing a performance assessment task. Preservice teachers thenhad the option of working individually or in groups of two to three on theproject. See Appendix A for the description of the project assignments.
SCIENCE PERFORMANCE ASSESSMENT TASKS 385
The preservice teachers submitted planning guides that outlined themajor features of their tasks. An important part of this planning guide wasaligning the task with standards for learning. Because the Washington StateEssential Academic Learning Requirments [EALRs] (Washington Com-mission on Student Learning, 1998) were emphasized in this course, ourstudents identified appropriate EALRs for their task. These state learn-ing standards are derived from and consistent with the National ScienceEducation Standards (NRC, 1996).
From this point, the preservice teachers continued developing their tasksoutside of class time. While many groups created original tasks, the preser-vice teachers were permitted to use outside resources (e.g., activity books,journal articles) for ideas for their task. Even in the cases when an outsidesource was used, significant work was required to develop the problem intoa performance assessment task and meet the assignment requirements.
Matching Mentors and Preservice Teachers. Using the information pro-vided in the preservice teachers’ planning guides, we matched each pre-service-teacher to a mentor inservice teacher. This matching was donebased on the topic, skills, abilities, and level of thinking required for theperformance assessment task and the knowledge and grade level of thementor teachers’ students. After the preservice/inservice teams were as-signed, they met on their own after contacting one another by phone oremail. Mentors were sometimes assigned more than one preserviceteacher.
After the mentor teachers had been assigned to groups of preserviceteachers, the mentors attended one hour of a methods class. The preserviceteachers brought their planning guides and drafts of their performanceassessment tasks to this meeting. During this hour, the mentor teachersmet with each of their preservice teachers to discuss their ideas and plansfor the performance assessment tasks. Additionally, other members of theplanning team (authors) were available to assist groups in designing theirtasks.
Submitting the First Draft and Field-Testing the Task. On the eighth weekof the semester, the groups submitted their first drafts of their performanceassessment tasks to their science methods professor and to their mentorteacher. Within a week, both parties provided written feedback and com-ments for the preservice teachers to consider before administering theirtasks to students. Each group then arranged a time to field-test their tasksin their mentor’s classroom. The tasks were designed to be completed inone to three 50 minute class periods.
386 J.A. MORRISON ET AL.
Analyzing Results and Reporting on the Task. Following the field-test,the preservice teacher groups scored the students’ work and analyzed se-lected students’ work in greater depth. Finally, they prepared a writtenreport of their findings and their reflections on the performance assessmentprocess and project.
Data Sources
To examine participants’ understandings and beliefs about standards-basedinstruction and assessment (research question one) data sources includedan open-ended pre and post questionnaire (see Appendix B) in conjunc-tion with a semi-structured pre and post interview. This questionnaire wasadapted from Peterson, Fennema, Carpenter & Loef’s (1989) pedagogicalbeliefs and knowledge questionnaire with items added for performanceassessment. The questions specific to teaching science and performanceassessment in science were the questions analyzed for this paper. The ques-tionnaire was given to all preservice teachers enrolled in the methods classat the beginning and the end of the course. Due to some absences duringadministration of the questionnaires, a total of 25 preservice teachers com-pleted both the pre and post questionnaire. To establish validity and gaingreater depth in the responses through additional probing, the questionsasked in the 45 minute, semi-structured interviews were the same as thoseon the questionnaire (see Appendix B). Students were asked to volunteerto be interviewed twice, at the beginning and end of the semester, weinterviewed seven volunteers for both interviews. Other data sources in-cluded written assignments from all project activities and video recordingsof methods class discussions on performance assessment.
To investigate the efficacy of the project in providing meaningful field-based learning (research question two) data sources included: archivedemail correspondences among instructors, preservice teachers, and men-tors, field notes from project planners, and written assignments.
Data Analysis
All data was analyzed by analytic induction (Bogdan & Biklen, 1992). Pat-terns of similarities and differences in perspectives and approaches andany changes in these perspectives for each of the research questions weresought. Categories created included the preservice teachers’ assessmentof student understanding, analysis and interpretation of students’ thinkingand understandings, and implementation of tasks (strategies for planning,set-up, facilitating, closing). Another category involved factors affectingthe preservice teachers’ development (working with a mentor, being in aclassroom, experimenting with new approaches). These categories were
SCIENCE PERFORMANCE ASSESSMENT TASKS 387
used to code and index participants’ questionnaire and interview responses,assignments, and written reflections. As patterns were identified, categorieswere added and/or reduced as the data indicated.
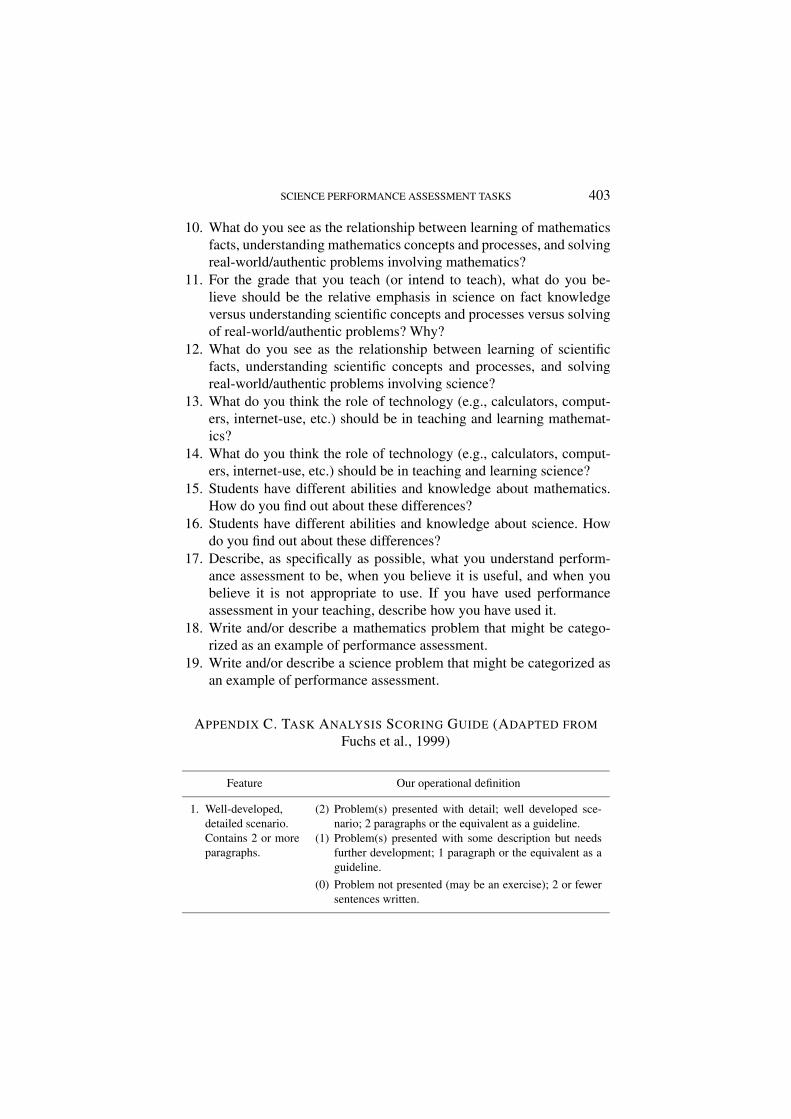
We developed a task-coding scheme (adapted from Fuchs, Fuchs,Karns, Hamlett & Katzaroff, 1999) to analyze the performance assessmenttasks and items on the questionnaire/interviews associated with perfor-mance assessment in science (see Appendix C). Although the original task-coding scheme was predominantly designed for math, the scheme used wasappropriate for science due to the focus on standards-based characteristics.These were characteristics such as requiring students to engage in well-developed, open-ended, authentic investigations, to obtain and evaluatescientific information, explain their work, and communicate their resultsin ways such as producing a written product or using tables, graphs, orcharts.
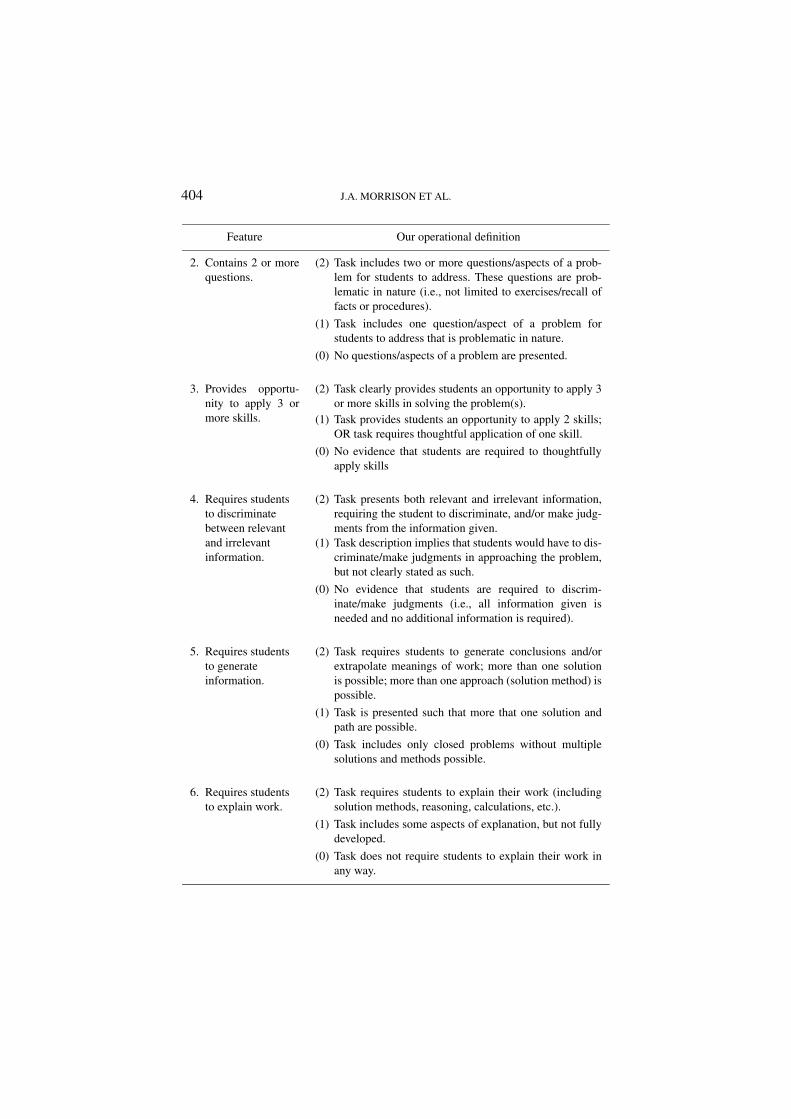
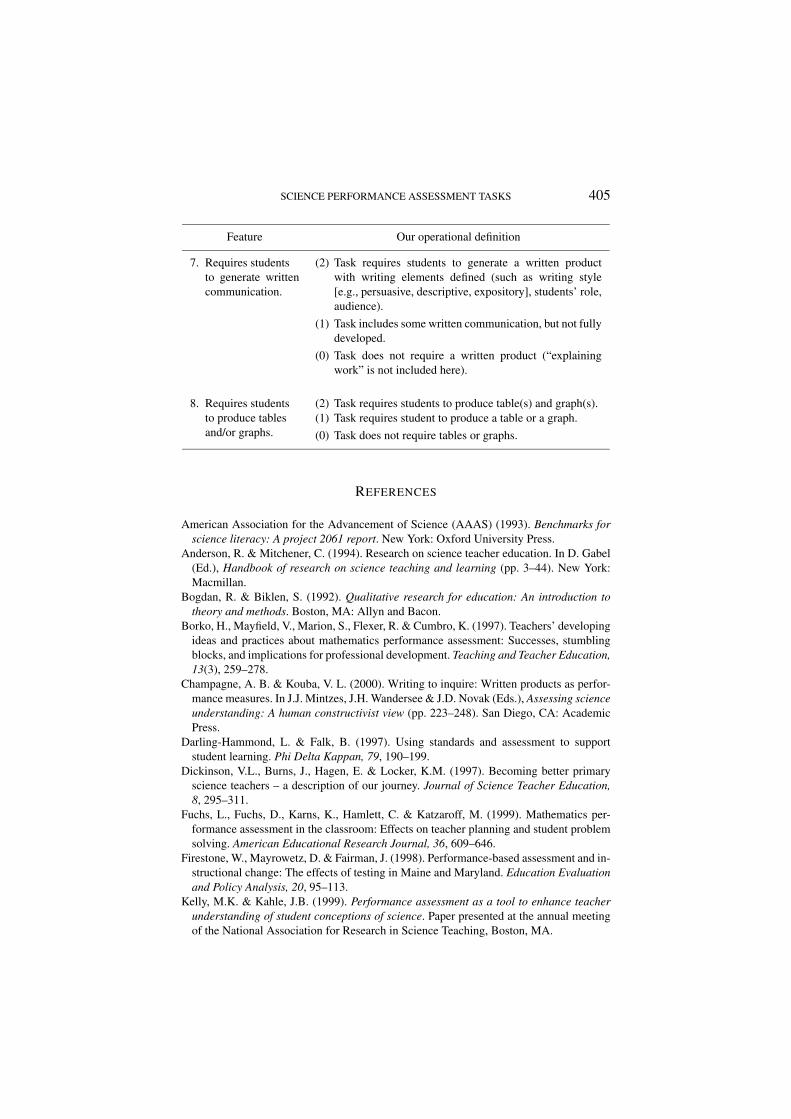
We analyzed tasks for eight features including whether the preserviceteachers: (1) wrote detailed, in depth scenarios, containing two or moreparagraphs; (2) wrote two or more questions; (3) required students to use3 or more skills; (4) required students to discriminate between relevantand irrelevant information; (5) required students to generate information;(6) required students to explain work; (7) required students to create awritten product; and (8) required students to produce tables and/or graphs.See Appendix C for operational definitions of each of the above features.These definitions were provided to the preservice teachers as they beganto plan their performance assessment project.
Each feature was coded for: strong presence (2); some presence (1); orabsence (0) of the feature. The number of preservice teachers who scoredat each of the levels (0, 1, or 2) was determined for each feature on pre andpost questionnaires and interviews.
Examples of scored features are provided below. The inter-rater relia-bility for this coding process was addressed through the following process.First, the two raters met to discuss and standardize the codes and clarify thedescriptions for each score on each feature. After reaching an agreementon how each score should be assigned for each feature, the raters indepen-dently coded the data. Following this independent scoring, the raters metto check how their scores matched; when scores differed, discussion washeld until an agreement was found on the score to be awarded.
In order to score at the highest level (2) on any of the features, thepreservice teachers’ explanation of a performance assessment task neededto contain everything listed in the description. For example, the followingperformance assessment task description was given a score of 2 for the
388 J.A. MORRISON ET AL.
features: Contains 2 or more questions, Provides opportunity to apply 3 ormore skills, and Requires student to generate information:
∗Give students a table of cities and elevations, rainfall, weather.∗Give students a table of plants and trees with information.∗Have students locate two cities which could grow certain plants and reason out whydifferent plants could not grow there. (Matthew, prequestionnaire)
The performance assessment task descriptions were scored with a 1or a 0 if the preservice teacher included only parts of the feature or didnot address the feature. For example, the following task description wasscored with 1 for each of the features: Well-developed, detailed scenario,Contains 2 or more paragraphs, Provides opportunity to apply 3 or moreskills, Requires students to discriminate between relevant and irrelevantinformation, and Requires students to generate written communication:
My question is “Are these rocks sedimentary?” The class has studied igneous, sedimentary,and metamorphxc rocks and the students will perform tasks on the rocks to determine theircarbonate content. (Casey, post-interview)
In order to get a picture of how the scores of the preservice teachersdemonstrated achievement of the feature on the post questionnaire andthe post interview, we identified which of the eight features showed morethan 50% of the respondents scoring at a level one (some presence) orlevel two (strong presence) in the post questionnaire or post interview. Itwas evident that some of the participants’ scores did not change from preto post questionnaire or interview. Since establishing the attainment of ascore demonstrating some or strong presence of the feature was our goal,we looked at the final number of responses at one or two rather than anoverall change. We also looked at the features where more than 50% of thepreservice teachers scored a zero (no presence) on the post questionnaireor post interview. Establishing the number of the participants that werenot able to demonstrate some or strong presence of these features wasimportant in our analysis of the preservice teachers’ understanding of thespecific features of performance assessment tasks.
RESULTS
Both the strengths and weaknesses of the project were evaluated. In exam-ining the data we investigated first whether the project positively affectedteachers’ understanding of performance assessment. Second, we soughtto understand the role of the field-based implementation of the tasks insupporting the teachers’ learning.
SCIENCE PERFORMANCE ASSESSMENT TASKS 389
Understanding of Performance Assessment
We wanted to establish that preservice teachers developed their under-standing of performance assessment. Prior to intervention, the preserviceteachers had very little understanding of performance assessment as in-dicated by low scores on the questionnaires and interviews. Initially, ex-amples given by preservice teachers included very few of the componentsnecessary to a performance assessment task. Their examples tended to beshort, required single answers, and did not provide opportunities for theirstudents to generate ideas. Additionally, few of the preservice teacherssaid they would require students to generate information or discriminatebetween relevant and irrelevant information when doing a performanceassessment task. Their ideas of performance assessment were not couchedin an authentic task. Representative quotes from the pre-questionnaires andpreinterviews illustrate how preservice teachers initially described a sci-ence performance assessment task. The representative quotes below showthat most of the preservice teachers considered performance assessmentto be either an opportunity for students to describe their knowledge of ascientific concept or conduct an experiment.
What is the boiling point of water? What is the purpose of the ozone layer? These questionscould gage (sic) the calaber (sic) of each student and areas of efficiency. (Beth)
Have the children write/describe how a tree gets energy. (Matthew)
Allowing students to perform an experiment while you watch. (Sarah)
Describe a cummulis (sic) cloud. (Ben)
A test asking for Newton’s 3 laws and examples to see if students know and understandthem. (Tiffany)
After demonstrating a chemical reaction using two elements, have student take the sametwo elements and see if they obtain the same results. (Michael)
When the preservice teachers were asked in their post interviews orquestionnaires to describe an example of a science problem that mightbe categorized as an example of performance assessment, their answersdemonstrated that they had improved in their ideas of what constitutes aperformance assessment task. The preservice teachers also exhibited anincreased attention to the science content being addressed. The majorityof the descriptions of performance assessment tasks provided in the postinterviews or questionnaires were similar to the tasks designed by the pre-service teachers, demonstrating that designing the performance assessmenttasks provided a powerful referent for making sense of performance as-sessment. In the representative quotes provided below, two examples werefrom a designed task, two were not.
390 J.A. MORRISON ET AL.
Produce a brochure for a nature walk which describes at least three different species likelyto be encountered in the given habitat. Describe the species’ appearance, life cycle, nutri-tional needs, etc. Produce a product scored against a rubric, and conveying topics whichstudents have some exposure to already. (MaryBeth)
You have built a scale model of our solar system. You have worked with proportions tobuild this model for both size of planets and sun, and the distances of the planets. It is nowyour job to write a proposal to the museum and to address their question of whether or notthis model is realistic to put in a museum? Why or why not? If not, what suggestions canyou give to the museum to make the exhibit fit? (Matthew, similar to designed task)
Four years ago the Department of Ecology reported that 15 different species of birds livedin Columbia Park. This year that number has dropped to only 11 species. It is your jobto go to Columbia Park (class field trip) and collect water samples, leaf samples, and oilsamples in order to find out why the number may have dropped. Provide an explanation ofwhy you think the number may have dropped with the following details: (1) the pH of thewater, (2) pH of the soil, (3) observations of leaves, (4) any other observations. (Tiffany)
Have the students simulate an oil spill and create waves and wind. Then after they recordhow the oil spread after each simulation (oil, wind) have them write in their journal whatimpact an oil spill has on the real world. (Wendy, similar to designed task)
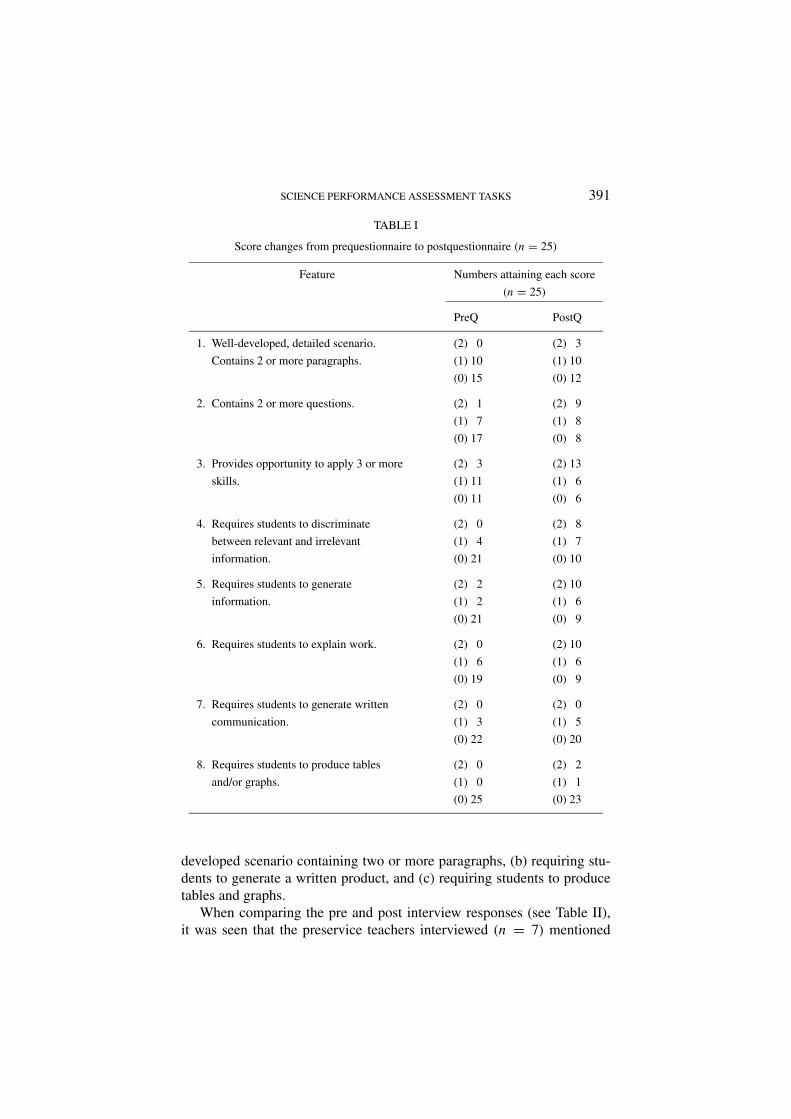
The preservice teachers’ responses on the pre and post questionnaires(n = 25) were analyzed to assess any improvement in discussion of fea-tures of performance assessment tasks (see Table I). Every feature, exceptthe last two (requiring students to generate written communication andto produce tables and/or graphs), was scored with either some presence(1) or strong presence (2) by at least 50% of the preservice teachers onthe post questionnaires. Each of these features showed an improvementfrom less than 50% on the prequestionnaire except feature three (providesopportunity to apply three or more skills). But in this instance, the scoreson feature three moved most noticeably from a score of one to scoring atlevel two.
On the post questionnaire, there were three features on which more than50% of the preservice teachers scored at the lowest level, (0, no presence)compared to the responses on the prequestionnaire where 7 out of the 8features had at least 50% of the responses at the zero level. The threefeatures where preservice teachers did not show a movement from scoringat zero to scoring a one or two were features 1, 7, and 8.
The five features where the preservice teachers demonstrated improve-ment from the pre to postquestionnaire were designing a performance task:(a) containing two or more questions, (b) providing students the opportu-nity to apply three or more skills, (c) requiring students to discriminatebetween relevant and irrelevant information, (d) requiring students to gen-erate information, and (e) requiring students to explain their work. Thefeatures showing little improvement were (a) designing a detailed, well
SCIENCE PERFORMANCE ASSESSMENT TASKS 391
TABLE I
Score changes from prequestionnaire to postquestionnaire (n = 25)
Feature Numbers attaining each score
(n = 25)
PreQ PostQ
1. Well-developed, detailed scenario. (2) 0 (2) 3
Contains 2 or more paragraphs. (1) 10 (1) 10
(0) 15 (0) 12
2. Contains 2 or more questions. (2) 1 (2) 9
(1) 7 (1) 8
(0) 17 (0) 8
3. Provides opportunity to apply 3 or more (2) 3 (2) 13
skills. (1) 11 (1) 6
(0) 11 (0) 6
4. Requires students to discriminate (2) 0 (2) 8
between relevant and irrelevant (1) 4 (1) 7
information. (0) 21 (0) 10
5. Requires students to generate (2) 2 (2) 10
information. (1) 2 (1) 6
(0) 21 (0) 9
6. Requires students to explain work. (2) 0 (2) 10
(1) 6 (1) 6
(0) 19 (0) 9
7. Requires students to generate written (2) 0 (2) 0
communication. (1) 3 (1) 5
(0) 22 (0) 20
8. Requires students to produce tables (2) 0 (2) 2
and/or graphs. (1) 0 (1) 1
(0) 25 (0) 23
developed scenario containing two or more paragraphs, (b) requiring stu-dents to generate a written product, and (c) requiring students to producetables and graphs.
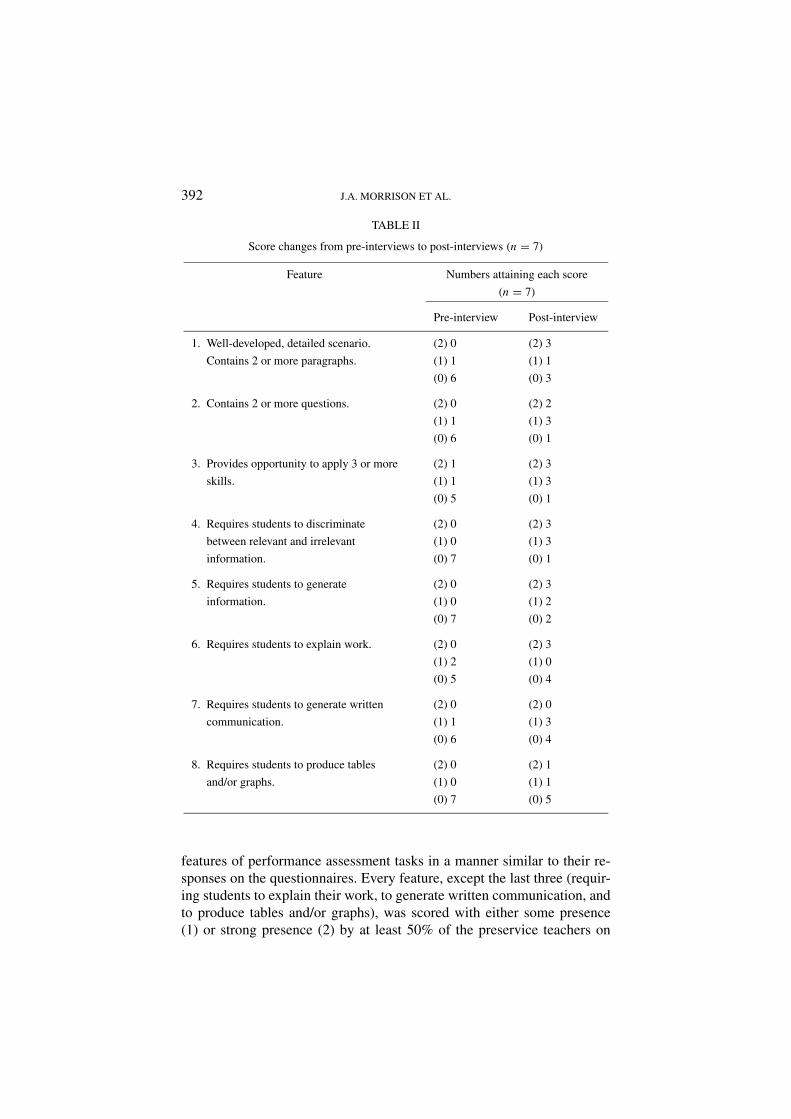
When comparing the pre and post interview responses (see Table II),it was seen that the preservice teachers interviewed (n = 7) mentioned
392 J.A. MORRISON ET AL.
TABLE II
Score changes from pre-interviews to post-interviews (n = 7)
Feature Numbers attaining each score
(n = 7)
Pre-interview Post-interview
1. Well-developed, detailed scenario. (2) 0 (2) 3
Contains 2 or more paragraphs. (1) 1 (1) 1
(0) 6 (0) 3
2. Contains 2 or more questions. (2) 0 (2) 2
(1) 1 (1) 3
(0) 6 (0) 1
3. Provides opportunity to apply 3 or more (2) 1 (2) 3
skills. (1) 1 (1) 3
(0) 5 (0) 1
4. Requires students to discriminate (2) 0 (2) 3
between relevant and irrelevant (1) 0 (1) 3
information. (0) 7 (0) 1
5. Requires students to generate (2) 0 (2) 3
information. (1) 0 (1) 2
(0) 7 (0) 2
6. Requires students to explain work. (2) 0 (2) 3
(1) 2 (1) 0
(0) 5 (0) 4
7. Requires students to generate written (2) 0 (2) 0
communication. (1) 1 (1) 3
(0) 6 (0) 4
8. Requires students to produce tables (2) 0 (2) 1
and/or graphs. (1) 0 (1) 1
(0) 7 (0) 5
features of performance assessment tasks in a manner similar to their re-sponses on the questionnaires. Every feature, except the last three (requir-ing students to explain their work, to generate written communication, andto produce tables and/or graphs), was scored with either some presence(1) or strong presence (2) by at least 50% of the preservice teachers on
SCIENCE PERFORMANCE ASSESSMENT TASKS 393
the post interviews. Each of these features showed an improvement fromless than 50% on the preinterview responses. Preservice teachers demon-strated the most improvement in the categories of (a) designing a detailed,well-developed scenario with two or more paragraphs, (b) designing a taskcontaining two or more questions, (c) providing students the opportunity toapply three or more skills, (d) requiring students to discriminate betweenrelevant and irrelevant information, and (e) requiring students to generateinformation. On the preinterviews, at least 50% of the preservice teachersscored zero on every feature; on the post interviews, fewer than 50% scoredat the zero level for each feature except 6, 7, and 8. Two of these features(7 and 8) were similar to those where little improvement was seen on thequestionnaire responses: requiring students to generate a written product,and requiring students to produce tables and graphs. For feature number 6,it may be that preservice teachers did not mention that they would requirestudents to explain their work because they felt that it was not importantenough to mention in the interview as it was assumed to be an inherentcomponent of performance assessment tasks.
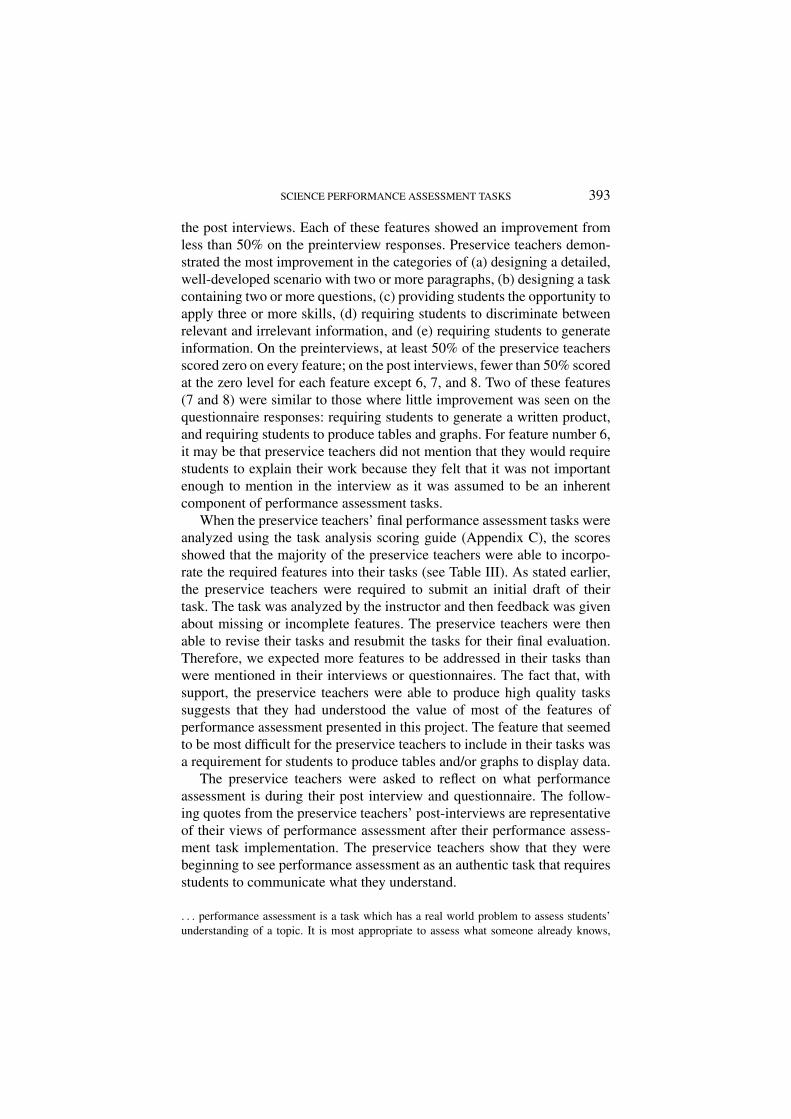
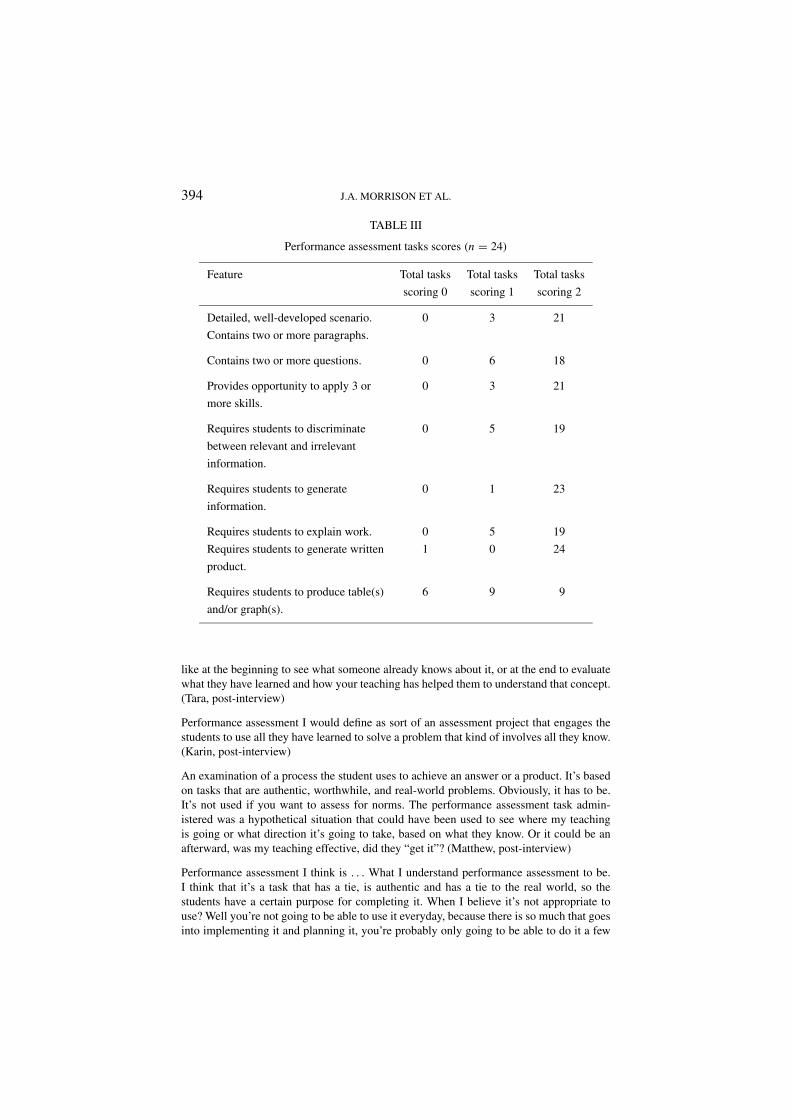
When the preservice teachers’ final performance assessment tasks wereanalyzed using the task analysis scoring guide (Appendix C), the scoresshowed that the majority of the preservice teachers were able to incorpo-rate the required features into their tasks (see Table III). As stated earlier,the preservice teachers were required to submit an initial draft of theirtask. The task was analyzed by the instructor and then feedback was givenabout missing or incomplete features. The preservice teachers were thenable to revise their tasks and resubmit the tasks for their final evaluation.Therefore, we expected more features to be addressed in their tasks thanwere mentioned in their interviews or questionnaires. The fact that, withsupport, the preservice teachers were able to produce high quality taskssuggests that they had understood the value of most of the features ofperformance assessment presented in this project. The feature that seemedto be most difficult for the preservice teachers to include in their tasks wasa requirement for students to produce tables and/or graphs to display data.
The preservice teachers were asked to reflect on what performanceassessment is during their post interview and questionnaire. The follow-ing quotes from the preservice teachers’ post-interviews are representativeof their views of performance assessment after their performance assess-ment task implementation. The preservice teachers show that they werebeginning to see performance assessment as an authentic task that requiresstudents to communicate what they understand.
. . . performance assessment is a task which has a real world problem to assess students’understanding of a topic. It is most appropriate to assess what someone already knows,
394 J.A. MORRISON ET AL.
TABLE III
Performance assessment tasks scores (n = 24)
Feature Total tasks Total tasks Total tasks
scoring 0 scoring 1 scoring 2
Detailed, well-developed scenario. 0 3 21
Contains two or more paragraphs.
Contains two or more questions. 0 6 18
Provides opportunity to apply 3 or 0 3 21
more skills.
Requires students to discriminate 0 5 19
between relevant and irrelevant
information.
Requires students to generate 0 1 23
information.
Requires students to explain work. 0 5 19
Requires students to generate written 1 0 24
product.
Requires students to produce table(s) 6 9 9
and/or graph(s).
like at the beginning to see what someone already knows about it, or at the end to evaluatewhat they have learned and how your teaching has helped them to understand that concept.(Tara, post-interview)
Performance assessment I would define as sort of an assessment project that engages thestudents to use all they have learned to solve a problem that kind of involves all they know.(Karin, post-interview)
An examination of a process the student uses to achieve an answer or a product. It’s basedon tasks that are authentic, worthwhile, and real-world problems. Obviously, it has to be.It’s not used if you want to assess for norms. The performance assessment task admin-istered was a hypothetical situation that could have been used to see where my teachingis going or what direction it’s going to take, based on what they know. Or it could be anafterward, was my teaching effective, did they “get it”? (Matthew, post-interview)
Performance assessment I think is . . . What I understand performance assessment to be.I think that it’s a task that has a tie, is authentic and has a tie to the real world, so thestudents have a certain purpose for completing it. When I believe it’s not appropriate touse? Well you’re not going to be able to use it everyday, because there is so much that goesinto implementing it and planning it, you’re probably only going to be able to do it a few
SCIENCE PERFORMANCE ASSESSMENT TASKS 395
times a year. But it is a chance for you to develop a concept a little more broadly to see ifstudents understand it, the concept . . . (Kathryn, post-interview)
The preservice teachers began to develop understandings for standards-based assessment and instruction. As seen in the quotes provided earlierin this paper, when preservice teachers were asked at the beginning ofthe semester about assessment and instruction, they viewed assessment asasking questions to solicit students’ knowledge of science concepts. Bythe end of the semester, data indicated that preservice teachers changedtheir views of assessment to seeing it as part of learning and necessary toinform instructional decisions. Through their experience implementing thetasks, many participants reflected on the value of listening to and observingchildren in teaching and learning. The following quote is representative ofthe preservice teachers after the implementation of the tasks.
[Performance assessment] engages the students in real-world problems, requires them tothink critically, and allows the teacher to assess by observation. . . . As I circulated through-out the room listening to students, making mental notes about what was going well andwhat changes need to be made, it was obvious that the students were using their priorknowledge . . . (Dora, reflections in final report)
We also found that the project activities facilitated preservice teach-ers’ development in gaining skills for analyzing and interpreting children’sthinking and work, as evidenced in their written projects.
Although the [second group’s] worksheets were not . . . complete . . . , [they] added newinsights to the final group discussion by introducing conjectures to the problem . . . Theyexhibited a higher level of reasoning. . . . They argued various points and brought up ideasthat even [we] had not considered. Their inferences and thought processes led others toquestion their own conclusions. (Karen, analysis of student work in final report)
The preservice teachers moved from seeing science as simply doing hands-on activities to being immersed in real-world problems, collecting valuabledata, reasoning, and making inferences.
Importance of the Field Experience
From the preservice teachers’ responses in their final report, it was clearthat the majority regarded the chance to actually be in the classroom work-ing with real students as a major benefit of this project. They said thatthey learned much more about instruction, especially assessment, by im-plementation of the task in a real classroom with real students than if theyhad just written the tasks to turn in to their instructor. The experience ofcollaborating with mentor teachers was also mentioned by many of thepreservice teachers as a benefit of the project. From working with theirmentors, they were able to gain insights into the students and classrooms
396 J.A. MORRISON ET AL.
where they would be presenting the performance assessment prior to theactual implementation.
Field Experience. The feedback from the preservice teachers was pos-itive regarding their time in the classroom. They recognized that throughimplementing the performance assessment task in the classroom, they wereable to find out where their task needed improvement and also what as-pects were successful as designed. The following quotes from the preser-vice teachers’ written reflection on the project are representative of thecomments provided about the field experience.
The project was a great learning experience for me. I found out that a topic can and willexpand unless the teacher keeps a close focus . . . Another learning experience for me wasthe value of a clear Rubric which the student could look at in advance so they could keepthemselves on track during the project and also know what would be required on theirsummative assessment. (Will, final reflections)
Overall, I think that this task went wonderful (sic), and is a really good activity for bothmath and science. The students were very excited and really had a good time. I do believehowever, the next time I use this I will let the students go all the problem solving insteadof teaching them how to do everything. I will be in the room for support and to answerquestions. I believe that is how students have fun and learn the most. Give them a taskto do what they can do and ask questions from both me and the teacher. (Maria, finalreflections)
Working with Mentor Teachers. The preservice teachers were encour-aged to develop a relationship with their assigned mentors and asked tocommunicate with them as often as possible. The feedback from the pre-service teachers was mixed as to the communication they had with theirmentor teachers. Some of the preservice teachers felt that the commu-nication was fine and others felt the mentor teachers could have donemore.
Most of the challenges facing the project stemmed from situating thepreservice teachers in the classrooms. Placements with mentors who hadbackgrounds in performance assessment and were implementing standards-based approaches were difficult to find, and in the cases where the mentorswere not skilled in these areas, the preservice teachers’ experiences wereoften frustrating and less rewarding. The general comment from the pre-service teachers was that the mentors did not give in depth constructivefeedback on the performance assessment task when asked. The mentorsseemed to feel more comfortable simply stating that the implementationhad “gone well” or commenting on the preservice teachers’ classroommanagement skills. While the situated nature of the assignment was an im-
SCIENCE PERFORMANCE ASSESSMENT TASKS 397
portant feature, it needed to be carefully orchestrated through collaborationamong all participants, and such orchestration was difficult.
CONCLUSIONS
Understanding of Performance Assessment
With deliberate instruction on development of performance assessmenttasks and detailed attention to the implementation of this task in a class-room, we were able to see the beginnings of an understanding of standards-based instruction and assessment in this group of preservice teachers.Following the design and implementation of their task, the preserviceteachers’ understanding of performance assessment improved greatly.Analysis of the data show that the preservice teachers did come to un-derstand assessment as a formative process; they also constructed ideasof what performance assessment is, when it is useful, and when it is notappropriate. As recommended by the NRC (1996), the preservice teachersdesigned assessments that had explicitly stated purposes in which studentswere given adequate opportunities to demonstrate their achievements. Thepreservice teachers in this study came to see that authentic assessmentis truly what captivates students’ interest. As recommended by the NRC(1996), the preservice teachers designed tasks requiring “students to applyscientific knowledge and reasoning to situations similar to those they willencounter in the world outside the classroom as well as to situations thatapproximate how scientists do their work” (p. 78).
When asked, either on the questionnaires or in the interviews, aboutthe features of a performance assessment task after direct instruction onperformance assessment and the development and implementation of atask, the preservice teachers showed improvement in all features. Someof the features showed more consistent improvement than others, the fourfeatures showing the strongest improvement were designing a task (a) con-taining two or more questions, (b) providing the opportunity to apply threeor more skills, (c) requiring students to discriminate between relevant andirrelevant information, and (d) requiring students to generate information.Inclusion of these features demonstrates that the preservice teachers wereable to describe tasks and recognize the importance of requiring studentsto attend to more than one area of information, use multiple skills, andproduce some type of informational product. Improvement in these areaswas possibly due to the preservice teachers’ comfort and skill with thesefeatures from previous experience. These features could also be the most
398 J.A. MORRISON ET AL.
easily incorporated into a task or more integral to the actual design of atask than those features where less improvement was seen.
Less improvement was seen in the other four features (a) designing adetailed, well developed scenario, (b) requiring students to explaining theirwork, (c) requiring students to generate a written product, and (c) requiringstudents to produce tables and graphs. This may be due to these featuresbeing more foreign to the preservice teachers than other features. For thefirst feature, it may be that the lack of observed improvement was due tothe fact that the responses requested on the interviews and questionnaireswere not conducive to mentioning a well-developed, detailed scenario. Thepresence of well-developed, detailed scenarios may only be seen in theactual tasks themselves, which is what was seen in the preservice teachers’designed tasks. It may be that in describing science or math performanceassessment tasks, the preservice teachers were not thinking along the linesof writing. They may have been preoccupied with their struggle to incor-porate science concepts and not been able to extend their task design toinclude a focus on students’ writing, requiring students to generate a writ-ten product. It is certainly plausible that the inclusion of writing as a focusin a performance assessment task may happen after the initial introductionof using this form of assessment. Possibly, these preservice teachers werenot able to incorporate all identified aspects of performance assessmentduring their first experience.
The preservice teachers involved in this project were able to demon-strate use of all but one of the required features of a performance assess-ment tasks when they designed their own tasks for use in the classroom.Certainly, they had an assignment protocol to use when designing theirtasks but they were able to demonstrate understanding of the featuresthrough competent incorporation. With appropriate support and scaffold-ing, preservice teachers were able to design tasks incorporating the re-quired components. We view this as a successful assignment and a steptowards understanding performance assessment.
The single element that was not consistently incorporated by the pre-service teachers was the requirement for students doing the task to displaydata using graphs or tables. Due to an inability of the preservice teachersto use tables and graphs to display data themselves, this feature of a perfor-mance task may have remained less accessible to the preservice teachers.This is consistent with Firestone et al.’s (1998) discussion of the need forteachers to have a sophisticated content knowledge in order to implementperformance assessment. Possibly a lack of science content knowledgeleft the preservice teachers with little experience using tables or graphsto display data. We have seen that preservice teachers often have a difficult
SCIENCE PERFORMANCE ASSESSMENT TASKS 399
time understanding and/or generating graphs themselves and may simplynot want to take on the use of tables or graphs with their own students.
As stated by Borko et al. (1997), teachers need substantive and sus-tained professional development on performance assessment. The preser-vice teachers possibly did not have long enough or in depth enough expo-sure to the four features on which they demonstrated less improvement. Itis certainly possible that these preservice teachers needed to take on perfor-mance assessment incrementally rather than being asked to address all theidentified features at once. Also, as Firestone et al. (1998) concluded, richtasks are needed as models for teachers learning about performance as-sessment, the preservice teachers may have benefited from more exposureto exemplary tasks during their instruction on performance assessment.
The preservice teachers demonstrated more content understanding inthe postinterviews and questionnaires and their written performance as-sessment tasks than was seen in their preinterviews and questionnaires. Af-ter selecting a science topic, these preservice teachers researched their con-tent, discussed students’ learning of this content with the mentor teacher,were involved in the classroom with teaching and assessing the topic,and then analyzed students’ performance assessment task data. An advan-tage of this performance assessment project was that preservice teachersincreased their content understanding on their chosen science topic.
Importance of the Field Experience
It was clear from the preservice teachers’ quotes that the situated natureof the project was an important factor in their learning about assessment.Much of the learning stemmed from the preservice teachers knowing theywere going to be implementing their tasks (motivating quality work morethan a semester grade in a course), observing and interacting with childrendoing science, and then analyzing and reflecting on problems experiencedin instruction. While the preservice teachers had earlier analyzed children’swork as part of the methods course, it was not as meaningful as beingimmersed in the classroom environment.
The preservice teachers were able to improve in their understandingof performance assessment due to their field experiences. As Schoon &Sandoval (1997) indicate, being involved in field experiences where theycan practice new skills allows preservice teachers to gain necessary skillssooner than simply discussing or reading about these skills in their meth-ods classrooms. Putnam and Borko (2000) maintain that learning needsto be situated in an authentic context in order for new knowledge to beconstructed, for a transfer from classroom to practice to occur. Our find-ings align with those of Borko et al. (1997) that the preservice teachers
400 J.A. MORRISON ET AL.
needed to experiment with the performance assessment tasks in an authen-tic context in order to understanding the full potential and value of thetask. We feel that this could not have occurred without the valuable men-torship provided by the inservice teachers. As recommended by Spector(1999), the preservice teachers were able to implement their performanceassessment tasks successfully with the help of mentor teachers. We felt thatimplementing the designed task in an authentic context and reflecting onthat experience allowed the preservice teachers to gain essential insightsinto teaching and learning.
IMPLICATIONS
Teachers are at the center of reform for teaching and learning in science. Assuch, we need to find effective ways to facilitate preservice teachers’ devel-opment toward standards-based approaches. This study described and ana-lyzed one approach to help preservice teachers build these understandings.To effectively situate learning in classrooms, all participants (preserviceteachers, mentors, and teacher educators) needed to collaborate in thought-fully planning for, orchestrating, and then analyzing their shared teachingand learning experiences. Significant and deliberate efforts were needed,but even with these efforts, we only saw the beginnings of a foundation be-ing constructed. These findings for preservice teachers are consistent withwhat others (e.g., Borko et al., 1997) have found for inservice teacher de-velopment: while professional development focusing on performance as-sessment is worthwhile in moving toward standards-based practices, suchefforts are challenging to implement and are just a beginning to changingteachers’ beliefs and practices.
APPENDIX A. PERFORMANCE ASSESSMENT PROJECT
The project will be completed in three parts, with separate due dates foreach part (indicated on your syllabus). The project may be done in pairs orindividually. The relative point value of each part is given below.
Part I: Planning the Task
A. Background Research. Gain an understanding of the teaching andlearning issues associated with your topic. Each person must reviewa minimum of two journal articles (quality, peer-reviewed journals)addressing your topic. While you may gain access to journal articles
SCIENCE PERFORMANCE ASSESSMENT TASKS 401
through the library’s web site, these should not be articles from Internetsites. Each article review should be about 1 page. (6 points.)
B. Planning Guide. Complete the Performance assessment planning guideas a first step in writing your task. Submit one guide for your group.(4 points.)
Part II: The Task
Include a brief overview of the task, and a copy of the original task/resourcefrom which your task is based. Include a table showing alignment betweentask items and the state standards (EALRs) or NSES/NCTM Standards.Include any special instructions for administering the task and a list ofmaterials needed. Include a copy of the task as it will be administeredto students. Include rubrics for scoring the task. Submit one per group.(10 points.)
Part III: The Final Report of Findings
A. Analysis of Students’ Work and Understandings. Include your origi-nal task and rubrics with instructor (and mentor teacher) commentsfrom Part II. Include samples of the scored student work, and youranalysis of the students’ understandings based on their performance onthe task. Each person must submit an analysis of at least 3 students’work (preferably a high, medium, and low scoring project). If you areworking with a partner, each person should select different students.(5 points.)
B. Reflections, Implications, and Suggestions for Improving the Task. In-clude your reflections on the assessment process, such as whether youbelieve the task was an effective assessment strategy and why or whynot, whether it assessed important math or science concepts and/orprocesses, and whether and how you had to intervene to clarify anyproblems students may have had when engaged in the task. Makerecommendations for revising the task. Each person must submit thissection. (5 points.)
APPENDIX B. PEDAGOGICAL BELIEFS QUESTIONNAIRE/INTERVIEW
QUESTIONS (ADAPTED FROM Peterson et al., 1989)
1. (A) Describe, as specifically as you can, a lesson in which you in-troduce a new mathematics topic to your class. We are interested inthe way you organize and present the mathematics content, as well as
402 J.A. MORRISON ET AL.
the specific teaching methods and strategies that you use. Preserviceteachers: imagine a lesson and describe it (if you have not had expe-rience teaching a new mathematics topic). Inservice teachers: recalla particular lesson and describe it. (B) How does your introductorylesson differ from a typical lesson on a mathematics topic?
2. (A) Describe, as specifically as you can, a lesson in which you intro-duce a new science topic to your class. We are interested in the wayyou organize and present the science content, as well as the specificteaching methods and strategies that you use. Preservice teachers:imagine a lesson and describe it (if you have not had experience teach-ing a new science topic). Inservice teachers: recall a particular lessonand describe it. (B) How does your introductory lesson differ from atypical lesson on a science topic?
3. Describe, as specifically as you can, a lesson in which you includeelements of the Nature of Science. We are interested in the way youorganize and present the philosophy, as well as the specific teachingmethods and strategies that you use. State specifically the elementsyou included. Preservice teachers: imagine a lesson and describe it(if you have not had experience teaching science). Inservice teachers:recall a particular lesson and describe it.
4. Describe, as specifically as you can, a lesson in which you includewriting in mathematics and/or science activities. We are interested inthe role of writing in the lesson and the type of writing expected, aswell as teaching methods and strategies that you use with writing.Preservice teachers: imagine a lesson and describe it (if you havenot had experience teaching a new mathematics and/or science topic).Inservice teachers: recall a particular lesson and describe it.
5. What do you think the role of the teacher should be in teaching prob-lem solving and reasoning to students?
6. What do you think the role of the learner should be in a lesson involv-ing problem solving and reasoning?
7. Are there certain kinds of knowledge and/or skills in mathematics thatyou believe all students should have? If so, what are they?
8. Are there certain kinds of knowledge and/or skills in science that youbelieve all students should have? If so, what are they?
9. For the grade that you teach (or intend to teach), what do you be-lieve should be the relative emphasis in mathematics on fact knowl-edge versus understanding topics and processes versus solving of real-world/authentic problems? Why?
SCIENCE PERFORMANCE ASSESSMENT TASKS 403
10. What do you see as the relationship between learning of mathematicsfacts, understanding mathematics concepts and processes, and solvingreal-world/authentic problems involving mathematics?
11. For the grade that you teach (or intend to teach), what do you be-lieve should be the relative emphasis in science on fact knowledgeversus understanding scientific concepts and processes versus solvingof real-world/authentic problems? Why?
12. What do you see as the relationship between learning of scientificfacts, understanding scientific concepts and processes, and solvingreal-world/authentic problems involving science?
13. What do you think the role of technology (e.g., calculators, comput-ers, internet-use, etc.) should be in teaching and learning mathemat-ics?
14. What do you think the role of technology (e.g., calculators, comput-ers, internet-use, etc.) should be in teaching and learning science?
15. Students have different abilities and knowledge about mathematics.How do you find out about these differences?
16. Students have different abilities and knowledge about science. Howdo you find out about these differences?
17. Describe, as specifically as possible, what you understand perform-ance assessment to be, when you believe it is useful, and when youbelieve it is not appropriate to use. If you have used performanceassessment in your teaching, describe how you have used it.
18. Write and/or describe a mathematics problem that might be catego-rized as an example of performance assessment.
19. Write and/or describe a science problem that might be categorized asan example of performance assessment.
APPENDIX C. TASK ANALYSIS SCORING GUIDE (ADAPTED FROM
Fuchs et al., 1999)
Feature Our operational definition
1. Well-developed,detailed scenario.Contains 2 or moreparagraphs.
(2) Problem(s) presented with detail; well developed sce-nario; 2 paragraphs or the equivalent as a guideline.
(1) Problem(s) presented with some description but needsfurther development; 1 paragraph or the equivalent as aguideline.
(0) Problem not presented (may be an exercise); 2 or fewersentences written.
404 J.A. MORRISON ET AL.
Feature Our operational definition
2. Contains 2 or morequestions.
(2) Task includes two or more questions/aspects of a prob-lem for students to address. These questions are prob-lematic in nature (i.e., not limited to exercises/recall offacts or procedures).
(1) Task includes one question/aspect of a problem forstudents to address that is problematic in nature.
(0) No questions/aspects of a problem are presented.
3. Provides opportu-nity to apply 3 ormore skills.
(2) Task clearly provides students an opportunity to apply 3or more skills in solving the problem(s).
(1) Task provides students an opportunity to apply 2 skills;OR task requires thoughtful application of one skill.
(0) No evidence that students are required to thoughtfullyapply skills
4. Requires studentsto discriminatebetween relevantand irrelevantinformation.
(2) Task presents both relevant and irrelevant information,requiring the student to discriminate, and/or make judg-ments from the information given.
(1) Task description implies that students would have to dis-criminate/make judgments in approaching the problem,but not clearly stated as such.
(0) No evidence that students are required to discrim-inate/make judgments (i.e., all information given isneeded and no additional information is required).
5. Requires studentsto generateinformation.
(2) Task requires students to generate conclusions and/orextrapolate meanings of work; more than one solutionis possible; more than one approach (solution method) ispossible.
(1) Task is presented such that more that one solution andpath are possible.
(0) Task includes only closed problems without multiplesolutions and methods possible.
6. Requires studentsto explain work.
(2) Task requires students to explain their work (includingsolution methods, reasoning, calculations, etc.).
(1) Task includes some aspects of explanation, but not fullydeveloped.
(0) Task does not require students to explain their work inany way.
SCIENCE PERFORMANCE ASSESSMENT TASKS 405
Feature Our operational definition
7. Requires studentsto generate writtencommunication.
(2) Task requires students to generate a written productwith writing elements defined (such as writing style[e.g., persuasive, descriptive, expository], students’ role,audience).
(1) Task includes some written communication, but not fullydeveloped.
(0) Task does not require a written product (“explainingwork” is not included here).
8. Requires studentsto produce tablesand/or graphs.
(2) Task requires students to produce table(s) and graph(s).(1) Task requires student to produce a table or a graph.
(0) Task does not require tables or graphs.
REFERENCES
American Association for the Advancement of Science (AAAS) (1993). Benchmarks forscience literacy: A project 2061 report. New York: Oxford University Press.
Anderson, R. & Mitchener, C. (1994). Research on science teacher education. In D. Gabel(Ed.), Handbook of research on science teaching and learning (pp. 3–44). New York:Macmillan.
Bogdan, R. & Biklen, S. (1992). Qualitative research for education: An introduction totheory and methods. Boston, MA: Allyn and Bacon.
Borko, H., Mayfield, V., Marion, S., Flexer, R. & Cumbro, K. (1997). Teachers’ developingideas and practices about mathematics performance assessment: Successes, stumblingblocks, and implications for professional development. Teaching and Teacher Education,13(3), 259–278.
Champagne, A. B. & Kouba, V. L. (2000). Writing to inquire: Written products as perfor-mance measures. In J.J. Mintzes, J.H. Wandersee & J.D. Novak (Eds.), Assessing scienceunderstanding: A human constructivist view (pp. 223–248). San Diego, CA: AcademicPress.
Darling-Hammond, L. & Falk, B. (1997). Using standards and assessment to supportstudent learning. Phi Delta Kappan, 79, 190–199.
Dickinson, V.L., Burns, J., Hagen, E. & Locker, K.M. (1997). Becoming better primaryscience teachers – a description of our journey. Journal of Science Teacher Education,8, 295–311.
Fuchs, L., Fuchs, D., Karns, K., Hamlett, C. & Katzaroff, M. (1999). Mathematics per-formance assessment in the classroom: Effects on teacher planning and student problemsolving. American Educational Research Journal, 36, 609–646.
Firestone, W., Mayrowetz, D. & Fairman, J. (1998). Performance-based assessment and in-structional change: The effects of testing in Maine and Maryland. Education Evaluationand Policy Analysis, 20, 95–113.
Kelly, M.K. & Kahle, J.B. (1999). Performance assessment as a tool to enhance teacherunderstanding of student conceptions of science. Paper presented at the annual meetingof the National Association for Research in Science Teaching, Boston, MA.
406 J.A. MORRISON ET AL.
McTiighe, J. (1999). Performance task blueprint. In Washington State Office of Superin-tendent of Public Instruction (Ed.), Second performance assessment summer workshopmanual (p. 39). Seattle, WA: Office of the Superintendent of Public Instruction.
Miles, M. & Huberman, A. (1994). Qualitative data analysis. Thousand Oaks, CA: Sage.National Research Council (NRC) (1996). National science education standards. Wash-
ington, DC: National Academic Press.Peterson, P., Fennema, E., Carpenter, T. & Loef, M. (1989). Teachers pedagogical content
beliefs in mathematics. Cognition and Instruction, 6(1), 1–40.Putnam, R. & Borko, H. (2000). What do new views of knowledge and thinking have to
say about research on teacher learning? Educational Researcher, 29, 4–15.Roth McDuffie, A., Akerson, V. & Morrison, J. (2003). Designing and implementing mean-
ingful field-based assessment methods for mathematics methods courses: A theoreticalframework and program description. The Mathematics Educator, 13(1), 22–32.
Schoon, K.J. & Sandoval, P.A. (1997). The seamless field experience model for secondaryscience teacher preparation. Journal of Science Teacher Education, 8(2), 127–140.
Shavelson, R.J., Baxter, G.P. & Pine, J. (1992). Performance assessments; political rhetoricand measurement reality. Educational Researcher, 22–27.
Shepard, L. (2000). The role of assessment in a learning culture. Educational Researcher,29(7), 4–14.
Shepard, L., Flexer, R., Hiebert, E., Marion, S., Mayfield, V. & Weston, T. (1996). Ef-fects of introducing classroom performance assessment on student learning. EducationalMeasurement: Issues and Practices, 15, 7–18.
Shymansky, J.A., Chidsey, J.L., Henriquesz, L., Enger, S., Yore, L.D., Wolfe, E.W. & Jor-genson, M. (1997). Performance assessment in science as a tool to enhance the pictureof student learning. School Science and Mathematics, 97, 172–183.
Spector, B.S. (1999). Bridging the gap between preservice and inservice science andmathematics teacher education. Paper presented at the annual meeting of the NationalAssociation for Research in Science Teaching, Boston, MA.
Stenmark, J. (1991). Mathematics assessment: Myths, models, good questions, andpractical suggestions. Reston, VA: National Council of Teachers of Mathematics.
Strauss, A. & Corbin, J. (1990). The basics of qualitative research: Grounded theoryprocedures and techniques. Newbury Park, CA: Sage.
Washington Commission on Student Learning (1998). Essential academic learning re-quirements. WA: Olympia.
Judith A. Morrison and Amy Roth McDuffieDepartment of Teaching and Learning,Washington State University,2710 University Drive,Richland, WA 99352,U.S.A.E-mail: [email protected]
Valarie L. AkersonIndiana University,201 North Rose,Bloomington, IN 47405-1005,U.S.A.


