Presynaptic Protein Interactions that Regulate Synaptic Strength at Crayfish Neuromuscular Junctions
by
Rene Christopher Prashad
A thesis submitted in conformity with the requirements for the degree of Doctor of Philosophy
Department of Physiology University of Toronto
© Copyright by Rene Christopher Prashad, 2012
ii
Presynaptic Protein Interactions that Regulate Synaptic Strength
at Crayfish Neuromuscular Junctions
Rene C. Prashad
Doctoral of Philosophy
Department of Physiology University of Toronto
2012
Abstract
Synapses vary widely in the probability of transmitter release. For instance, in response to an
action potential the phasic synapses of the crayfish have a 100-1000-fold higher release
probability than tonic synapses. The difference in release probability is attributed to differences
in the exocytotic machinery such as the degree of “zippering” of the trans-SNARE (Soluble N-
ethylmaleimide-sensitive factor Attachment protein REceptor) complex. I used physiological and
molecular approaches to determine if the zippered state of SNAREs associated with synaptic
vesicles and the interaction between the SNARE complex and Complexin influence the
probability of release at the synapse.
I used three Botulinum neurotoxins which bind and cleave at different sites on VAMP to
determine whether these sites were occluded by SNARE interaction (zippering) or open to
proteolytic attack. Under low stimulation conditions, the light-chain fragment of botulinum B
(BoNT/B-LC) but not BoNT/D-LC or tetanus neurotoxin (TeNT-LC) cleaved VAMP and
inhibited evoked release at both phasic and tonic synapses. In addition, a peptide based on the C-
terminal half of crayfish VAMP’s SNARE motif (Vc peptide) designed to interfere with SNARE
complex zippering at the C-terminal end inhibited release at both synapses. The susceptibility of
iii
VAMP to only BoNT/B-LC and interference by the Vc peptide indicated that SNARE complexes
at both phasic and tonic synapses were partially zippered only at the N-terminal end with the C-
terminal end exposed under resting conditions.
I used a peptide containing part of the crayfish Complexin central α-helix domain to interfere
with the interaction between Complexin and the SNARE complex. The peptide enhanced phasic
evoked release and inhibited tonic evoked release under low stimulation but attenuated release at
both synapses under intense stimulation. Therefore, Complexin appeared to exhibit a dual
function under low synaptic activity but only promoted release under high synaptic activity.
The results showed that the zippered state of the SNARE complex does not determine initial
release probability as a similar zippered SNARE complex structure under resting conditions is
common to both phasic and tonic synapses. However, Complexin may have a role in influencing
the initial release probability of a synapse. Therefore, the interaction between the SNARE
complex and Complexin is important for release but other factors contribute more significantly to
synaptic strength.
iv
Acknowledgments
On the path of completing my thesis, there are a number of people I had the pleasure of
meeting along the way that I owe many thanks for their help.
First, I would like to thank my supervisor, Dr. Milton Charlton, for everything that he has
done to make this thesis possible. Through his mentorship, I was given the opportunity to explore
my research potential with the freedom to expand my creativity and curiosity, and test my own,
and often wild, ideas. All of this has helped in my transformation from a naïve graduate student
to a research scientist. It was a privilege to be under the guidance of someone of his calibre and I
am honoured to be his last graduate student.
I would like to thank my Ph.D supervisory committee members (Dr. Shuzo Sugita, Dr.
Zhong-Ping Feng, and Dr. Lu-Yang Wang) for their insightful discussions and guidance over the
years that helped to shape this thesis. I am also grateful to Dr. Elise Stanley for her comments
and suggestions as a member of my Final Supervisory Committee, and to my Final Defense
Committee (Dr. A. Joffre Mercier, Dr. Peter Carlen, Dr. Melanie Woodin, Dr. Shuzo Sugita, Dr.
Zhengping Jia, and Dr. Tomáš Paus) for devoting their time to see me through the final stage of
my graduate study.
Many thanks go to the members of the Charlton lab (Dr. Lorelei Silverman-Gavrila, Dr.
Alex Smith, and Dr. Jeffrey Dason) for their advice, guidance, and friendship over the years, and
special thanks to the late Dr. Guotang Wang for introducing me to various molecular biology
techniques. He was a great teacher and friend who will be greatly missed. I am also thankful for
the work by Hui Zhang for her help with the cloning and sequencing experiments. I am also
grateful for the assistance provided by Dr. Zhong-Ping Feng and her lab members, especially Dr.
Kwokyin Hui and Qing Li, with the cloning and sequencing of crayfish VAMP and Complexin.
In addition, I would like to thank Dr. Masami Takahashi for the Syntaxin 6D2 clone antibody,
Dr. Clifford C. Shone for the VAMP antibody, Dr. J. Troy Littleton for the Drosophila
Complexin antibody, and Dr. Andrew Christie for the shrimp Complexin sequences.
Finally, special thanks to my entire family, especially my parents and sister, Nina, for
their kind support and guidance.

v
Table of Contents
ABSTRACT .................................................................................................................... II
ACKNOWLEDGMENTS................................................................................................ IV
TABLE OF CONTENTS ................................................................................................. V
LIST OF TABLES........................................................................................................ XIII
LIST OF FIGURES ......................................................................................................XIV
LIST OF APPENDICES................................................................................................XX
LIST OF APPENDIX FIGURES...................................................................................XXI
ABBREVIATIONS ......................................................................................................XXII
1 INTRODUCTION...................................................................................................1
1.1 Neuronal communication.................................................................................................... 1
1.1.1 Calcium and exocytosis .......................................................................................... 1
1.1.2 Vesicle pools ........................................................................................................... 5
1.1.3 Modes of vesicle fusion: Full collapse fusion vs. kiss-and-run .............................. 7
1.2 Exocytotic machinery ....................................................................................................... 11
1.2.1 SNARE proteins.................................................................................................... 11
1.2.2 The SNARE complex ........................................................................................... 13
1.2.2.1 Structure ................................................................................................. 13
1.2.2.2 SNARE complex assembly .................................................................... 17
vi
1.2.2.2.1 Zippering hypothesis ............................................................ 19
1.2.2.3 Is a single trans-SNARE complex sufficient for fusion? ....................... 22
1.2.3 The importance of SNAREs in exocytosis as demonstrated by various
experimental tools................................................................................................. 23
1.2.3.1 Clostridial neurotoxins ........................................................................... 24
1.2.3.2 Interfering peptides................................................................................. 25
1.2.3.3 Genetic manipulations ............................................................................ 25
1.2.4 Post-docking role of the trans-SNARE complex.................................................. 26
1.2.5 SNARE-associated proteins.................................................................................. 27
1.2.5.1 Synaptotagmin-1..................................................................................... 29
1.2.5.2 Complexin .............................................................................................. 31
1.2.5.3 Proposed mechanism of vesicle docking and fusion .............................. 36
1.3 Clostridial neurotoxins ..................................................................................................... 38
1.3.1 Mechanism of action............................................................................................. 40
1.3.1.1 Syntaxin is the target of BoNT/C1 ......................................................... 41
1.3.1.2 SNAP-25 is the target of BoNT/A/E/C1 ................................................ 41
1.3.1.3 VAMP is the target of TeNT and BoNT/B/D/F/G ................................. 43
1.3.1.4 Neurotoxin-resistant SNAREs................................................................ 43
1.3.2 The effect of Clostridial neurotoxins on exocytosis............................................. 44
1.4 Model systems for the study of synaptic strength............................................................. 46
1.4.1 Phasic and tonic axons of the crayfish walking leg extensor muscle ................... 47

vii
1.4.1.1 Morphological differences between the phasic and tonic axons ............ 48
1.4.1.2 Physiological differences between the phasic and tonic axons .............. 48
1.4.1.3 What is responsible for synaptic differentiation between the phasic
and tonic axons? ..................................................................................... 52
1.5 Outline of thesis ................................................................................................................ 53
1.5.1 Objectives ............................................................................................................. 53
1.5.2 Hypotheses............................................................................................................ 54
2 MATERIALS AND METHODS............................................................................55
2.1 Animals ............................................................................................................................. 55
2.2 Saline solution................................................................................................................... 55
2.3 Crayfish dissection for electrophysiology and immunocytochemistry............................. 55
2.4 Immunocytochemistry ...................................................................................................... 56
2.4.1 Laser confocal imaging......................................................................................... 58
2.5 SDS-PAGE and Western blotting..................................................................................... 58
2.5.1 Solutions ............................................................................................................... 58
2.5.2 Protein extraction .................................................................................................. 58
2.5.3 SDS-PAGE ........................................................................................................... 60
2.5.4 Transfer ................................................................................................................. 60
2.5.5 Immunostaining .................................................................................................... 63
2.6 Electrophysiology ............................................................................................................. 63
2.6.1 Setup for intracellular recordings.......................................................................... 63
viii
2.6.2 Recording phasic and tonic EPSPs ....................................................................... 65
2.6.3 Pressure injection .................................................................................................. 67
2.6.4 Recording phasic and tonic axon action potentials............................................... 67
2.6.5 Measuring phasic and tonic EPSP peak amplitude............................................... 69
2.7 Statistical analysis............................................................................................................. 69
2.8 Cloning and sequencing crayfish VAMP ......................................................................... 71
2.8.1 Cloning and sequencing the SNARE motif of crayfish VAMP ........................... 71
2.8.1.1 RNA extraction and cDNA synthesis..................................................... 71
2.8.1.2 Polymerase chain reaction (PCR)........................................................... 71
2.8.1.3 Ligation of the VAMP PCR product to a TA vector.............................. 73
2.8.1.4 Transformation of bacteria cells ............................................................. 73
2.8.1.5 Selecting and growing bacterial colonies ............................................... 74
2.8.1.6 Extracting recombinant TA vectors from bacterial cells........................ 74
2.8.1.7 Verification of the VAMP PCR product from the extracted
recombinant TA vectors ......................................................................... 74
2.8.1.8 Sequencing recombinant TA vectors with the VAMP PCR product ..... 75
2.8.2 Sequencing full-length crayfish VAMP................................................................ 75
2.8.2.1 5’ RACE ................................................................................................. 79
2.8.2.2 3’-RACE................................................................................................. 79
2.8.2.3 Sequencing the 5’ and 3’ RACE products.............................................. 80
2.8.2.4 VAMP peptide synthesis ........................................................................ 82
ix
2.9 Cloning and sequencing partial crayfish Complexin ........................................................ 84
2.9.1 Polymerase Chain Reaction (PCR)....................................................................... 84
2.9.2 Ligation and transformation.................................................................................. 85
2.9.3 Sequencing............................................................................................................ 85
2.9.4 Complexin central α-helix peptide design and synthesis...................................... 85
3 CLOSTRIDIAL NEUROTOXINS REVEAL A COMMON PARTIALLY ZIPPERED
STATE OF THE SNARE COMPLEX AT BOTH PHASIC AND TONIC
SYNAPSES.........................................................................................................88
3.1 Crayfish neuronal VAMP is cleaved by Clostridial neurotoxins in-vitro ........................ 90
3.2 Using Clostridial neurotoxins to determine the zippered state of the SNARE complex.. 93
3.2.1 Neurotoxin preparation for pressure injection ...................................................... 93
3.2.2 Immunocytochemistry procedure following neurotoxin injection experiments ... 94
3.2.3 The SNARE complex is partially zippered at rest at both phasic and tonic
synapses ................................................................................................................ 94
3.2.3.1 Effects of TeNT-LC and BoNT/D-LC under low stimulation ............... 95
3.2.3.2 Effects of BoNT/B-LC under low stimulation ....................................... 95
3.2.3.3 Summary of the effects of TeNT-LC and BoNT/B/D-LC under low
stimulation ............................................................................................ 117
3.2.4 Crayfish neuronal VAMP is susceptible to cleavage by TeNT-LC and
BoNT/B/D-LC under intense stimulation........................................................... 118
3.2.5 Clostridial neurotoxins reveal that the zippered state of the SNARE complex
does not determine synaptic strength.................................................................. 121
x
4 THE INHIBITORY EFFECT OF THE CRAYFISH VAMP C-TERMINAL PEPTIDE
INDICATES THAT SNARE COMPLEXES ARE PARTIALLY ZIPPERED AT
PHASIC AND TONIC SYNAPSES ...................................................................130
4.1 Sequence of crayfish full-length neuronal VAMP and interfering Vc peptide .............. 134
4.2 The effects of crayfish VAMP Vc peptide on neurotransmitter release ......................... 137
4.2.1 VAMP peptide preparation for pressure injection .............................................. 137
4.2.2 VAMP Vc peptide inhibits phasic and tonic release under low stimulation ...... 137
4.2.3 The inhibitory effect of the VAMP peptide is accelerated under intense
stimulation at phasic and tonic synapses ............................................................ 145
4.2.4 Summary of VAMP Vc peptide experiments ..................................................... 146
5 COMPLEXIN CONTRIBUTES TO SYNAPTIC STRENGTH AT PHASIC AND
TONIC SYNAPSES...........................................................................................148
5.1 Complexin is present in crayfish nervous tissue............................................................. 149
5.1.1 Immunocytochemistry ........................................................................................ 149
5.1.2 SDS-PAGE and Western blot ............................................................................. 152
5.2 Sequence of partial crayfish Complexin and interfering Complexin peptide................. 154
5.3 The Complexin central α-helix peptide differentially affects phasic and tonic evoked
release ............................................................................................................................. 156
5.3.1 Complexin peptide preparation for pressure injection........................................ 156
5.3.2 Complexin peptide has opposing effects on phasic versus tonic release under
low stimulation.................................................................................................... 156
5.3.3 Complexin peptide attenuates release at phasic and tonic synapses under
intense stimulation .............................................................................................. 163
xi
5.3.4 Summary of the effects of the Complexin peptide ............................................. 165
6 DISCUSSION....................................................................................................167
6.1 Partially zippered SNARE complexes at phasic and tonic synapses .............................. 167
6.1.1 The use of Clostridial neurotoxins to determine the zippered state of the
SNARE complex................................................................................................. 168
6.1.2 The use of VAMP Vc peptide to determine the zippered state of the SNARE
complex............................................................................................................... 169
6.1.3 The effects of neurotoxins and VAMP Vc peptide during intense stimulation.. 171
6.1.4 Are partially zippered SNARE complexes a trait of all chemical synapses? ..... 172
6.1.4.1 Degrees of SNARE zippering .............................................................. 173
6.1.5 Partially zippered cis-SNARE complexes are present at phasic and tonic
synapses .............................................................................................................. 175
6.1.6 Post-priming role of the partially zippered trans-SNARE complex................... 176
6.1.7 The function of the partially zippered trans-SNARE complex .......................... 178
6.2 Complexin influences release probability....................................................................... 179
6.2.1 Does the presence of multiple Complexin isoforms or difference in
concentration contribute to the different effects of the Complexin peptide?...... 180
6.2.2 Difference in the phosphorylation state of Complexin at phasic and tonic
synapses .............................................................................................................. 182
6.2.3 The effect of Complexin on evoked release: Release probability and Ca2+-
sensitivity ............................................................................................................ 183
6.2.3.1 Ca2+ sensitivity of release: Interaction between Complexin and
Synaptotagmin-1................................................................................... 185
xii
6.2.4 The role of Complexin in vesicle priming and maintenance of the RRP ........... 186
6.2.5 Does Complexin synchronize vesicle fusion? .................................................... 188
6.2.6 Role of Complexin in short-term plasticity ........................................................ 189
6.2.7 Summary of the role of Complexin at phasic and tonic synapses ...................... 191
6.3 Proposed role of SNARE zippering and Complexin during exocytosis at crayfish
phasic and tonic synapses ............................................................................................... 192
6.4 Other factors that are responsible for the difference in release probability between
phasic and tonic synapses ............................................................................................... 193
6.5 Methodological considerations ....................................................................................... 197
6.6 Future directions ............................................................................................................. 199
6.6.1 SNARE zippering ............................................................................................... 199
6.6.2 Complexin........................................................................................................... 200
6.6.3 Other experiments or techniques ........................................................................ 201
6.7 Summary ......................................................................................................................... 201
REFERENCES ............................................................................................................202
xiii
List of Tables
Table 1. List of proteins that interact with the SNAREs and their effects on exocytosis............. 28
Table 2. Comparison of morphological properties between phasic and tonic terminals. ............. 50
Table 3. Solutions used for SDS-PAGE and Western blotting..................................................... 59
xiv
List of Figures
Figure 1. Synaptic vesicle cycle...................................................................................................... 3
Figure 2. Microdomain and nanodomain models at the synapse.................................................... 4
Figure 3. Vesicle pools in the nerve terminal. ................................................................................ 6
Figure 4. Modes of synaptic vesicle fusion. ................................................................................. 10
Figure 5. Domain structure of the three neuronal SNARE proteins. ............................................ 14
Figure 6. Structure of the SNARE complex. ................................................................................ 16
Figure 7. cis- and trans- SNARE complexes................................................................................ 18
Figure 8. Different zippered states of the trans-SNARE complex. .............................................. 21
Figure 9. Domain structure of Synaptotagmin-1. ......................................................................... 30
Figure 10. Structure of mammalian Complexin. .......................................................................... 32
Figure 11. Proposed mechanism of vesicle docking and fusion. .................................................. 37
Figure 12. Domain structure of the Clostridial holotoxin. ........................................................... 39
Figure 13. Clostridial neurotoxins’ binding and cleavage sites on SNAREs............................... 42
Figure 14. Protection of SNAREs from Clostridial neurotoxins by the SNARE complex. ......... 45
Figure 15. Phasic and tonic terminals that innervate the crayfish walking leg extensor muscle.. 49
Figure 16. Phasic and tonic responses from the crayfish leg extensor muscle. ............................ 51
Figure 17. Dissected crayfish walking leg. ................................................................................... 57
Figure 18. Bio-Rad Mini PROTEAN III gel electrophoresis unit used for SDS-PAGE. ............. 61
Figure 19. Bio-Rad Mini PROTEAN III Trans-Blot system used for protein transfer. ............... 62
xv
Figure 20. Recording EPSPs from the crayfish leg extensor muscle. .......................................... 64
Figure 21. Stimulation of the crayfish leg extensor phasic and tonic axons................................. 66
Figure 22. Phasic EPSP and action potential. ............................................................................... 68
Figure 23. Tonic EPSPs and action potentials. ............................................................................. 70
Figure 24. The crayfish VAMP SNARE motif nucleotide and amino acid sequences. ............... 76
Figure 25. Comparison of crayfish VAMP SNARE motif amino acid sequence with VAMP-1
and VAMP-2 isoforms from other species. .................................................................................. 77
Figure 26. Full-length crayfish VAMP sequence. ........................................................................ 81
Figure 27. Crayfish VAMP Vc and scrambled Vc peptide sequences. ........................................ 83
Figure 28. Partial crayfish Complexin nucleotide and amino acid sequences representing the
central α-helix domain. ................................................................................................................. 86
Figure 29. The synthesized crayfish Complexin central α-helix domain peptide and scrambled
peptide sequences.......................................................................................................................... 87
Figure 30. Using VAMP-specific Clostridial neurotoxins to determine the zippered state of the
SNARE complex under resting conditions. .................................................................................. 89
Figure 31. Western blot of crayfish CNS protein sample incubated with inactive and active
neurotoxins and stained for neuronal VAMP. .............................................................................. 92
Figure 32. Timeline of physiological recordings (phasic and tonic) for neurotoxin injection
experiments. .................................................................................................................................. 97
Figure 33. Phasic and tonic EPSP traces for neurotoxin experiments under the low stimulation
paradigm at specific time points. .................................................................................................. 98
Figure 34. Phasic EPSP traces for neurotoxin experiments under the intense stimulation
paradigm at specific time points. .................................................................................................. 99
xvi
Figure 35. Tonic EPSP traces for neurotoxin experiments under the intense stimulation paradigm
at specific time points. ................................................................................................................ 100
Figure 36. The effect of TeNT-LC on the evoked phasic response under low and intense
stimulation................................................................................................................................... 101
Figure 37. The effect of TeNT-LC on the evoked tonic response under low and intense
stimulation................................................................................................................................... 102
Figure 38. The effect of BoNT/D-LC on the evoked phasic response under low and intense
stimulation................................................................................................................................... 103
Figure 39. The effect of BoNT/D-LC on the evoked tonic response under low and intense
stimulation................................................................................................................................... 104
Figure 40. Summary of the effect of TeNT-LC and BoNT/B/D-LC on the evoked phasic
response under the low and intense stimulation protocols.......................................................... 105
Figure 41. Summary of the effect of TeNT-LC and BoNT/B/D-LC on the evoked tonic response
under the low and intense stimulation protocols......................................................................... 106
Figure 42. Immunoreactivity of VAMP and Synapsin in crayfish leg extensor phasic terminals
under the low stimulation paradigm following the injection of active or inactive TeNT-LC in the
phasic axon.................................................................................................................................. 107
Figure 43. Immunoreactivity of VAMP and Synapsin in crayfish leg extensor tonic terminals
under the low stimulation paradigm following the injection of active or inactive TeNT-LC in the
tonic axon.................................................................................................................................... 108
Figure 44. Immunoreactivity of VAMP and Synapsin in crayfish leg extensor phasic terminals
under the low stimulation paradigm following the injection of active or inactive BoNT/D-LC in
the phasic axon............................................................................................................................ 109
Figure 45. Immunoreactivity of VAMP and Synapsin in crayfish leg extensor tonic terminals
under the low stimulation paradigm following the injection of active or inactive BoNT/D-LC in
the tonic axon. ............................................................................................................................. 110
xvii
Figure 46. Amplitude of action potentials recorded from the phasic axon before and after
injection of inactive and active neurotoxins for the low stimulation experiments. .................... 111
Figure 47. Amplitude of action potentials recorded from the tonic axon before and after injection
of inactive and active neurotoxins for the low stimulation experiments. ................................... 112
Figure 48. The effect of BoNT/B-LC on the evoked phasic response under low and intense
stimulation................................................................................................................................... 113
Figure 49. The effect of BoNT/B-LC on the evoked tonic response under low and intense
stimulation................................................................................................................................... 114
Figure 50. Immunoreactivity of VAMP and Synapsin in crayfish leg extensor phasic terminals
under the low stimulation paradigm following the injection of active or inactive BoNT/B-LC in
the phasic axon............................................................................................................................ 115
Figure 51. Immunoreactivity of VAMP and Synapsin in crayfish leg extensor tonic terminals
under the low stimulation paradigm following the injection of active or inactive BoNT/B-LC in
the tonic axon. ............................................................................................................................. 116
Figure 52. Immunoreactivity of VAMP and Synapsin in crayfish leg extensor phasic terminals
under the intense stimulation paradigm following the injection of active or inactive TeNT-LC in
the phasic axon............................................................................................................................ 122
Figure 53. Immunoreactivity of VAMP and Synapsin in crayfish leg extensor tonic terminals
under the intense stimulation paradigm following the injection of active or inactive TeNT-LC in
the tonic axon. ............................................................................................................................. 123
Figure 54. Immunoreactivity of VAMP and Synapsin in crayfish leg extensor phasic terminals
under the intense stimulation paradigm following the injection of active or inactive BoNT/D-LC
in the phasic axon........................................................................................................................ 124
Figure 55. Immunoreactivity of VAMP and Synapsin in crayfish leg extensor tonic terminals
under the intense stimulation paradigm following the injection of active or inactive BoNT/D-LC
in the tonic axon.......................................................................................................................... 125
xviii
Figure 56. Immunoreactivity of VAMP and Synapsin in crayfish leg extensor phasic terminals
under the intense stimulation paradigm following the injection of active or inactive BoNT/B-LC
in the phasic axon........................................................................................................................ 126
Figure 57. Immunoreactivity of VAMP and Synapsin in crayfish leg extensor tonic terminals
under the intense stimulation paradigm following the injection of active or inactive BoNT/B-LC
in the tonic axon.......................................................................................................................... 127
Figure 58. Amplitude of action potentials recorded from the phasic axon before and after
injection of inactive and active neurotoxins for the intense stimulation experiments. ............... 128
Figure 59. Amplitude of action potentials recorded from the tonic axon before and after injection
of inactive and active neurotoxins for the intense stimulation experiments. .............................. 129
Figure 60. Using VAMP Vc peptide to determine the zippered state of the SNARE complex
under resting conditions. ............................................................................................................. 132
Figure 61. Comparison of full-length crayfish VAMP amino acid sequence with VAMP-1 and
VAMP-2 isoforms from other species. ....................................................................................... 135
Figure 62. Timeline of physiological recordings (phasic and tonic) for VAMP peptide and
Complexin peptide injection experiments. ................................................................................. 139
Figure 63. Phasic EPSP traces for the VAMP peptide experiments at specific time points....... 140
Figure 64. Tonic EPSP traces for the VAMP peptide experiments at specific time points........ 141
Figure 65. The effect of crayfish VAMP Vc peptide on the evoked tonic response under low and
intense stimulation. ..................................................................................................................... 142
Figure 66. The effect of crayfish VAMP Vc peptide on the evoked phasic response under low
and intense stimulation. .............................................................................................................. 143
Figure 67. Summary of the effect of crayfish VAMP Vc peptide on the evoked phasic and tonic
responses under the low and intense stimulation protocols. ....................................................... 144
xix
Figure 68. Amplitude of action potentials recorded from the phasic and tonic axons before and
after injection for VAMP Vc peptide experiments. .................................................................... 147
Figure 69. Immunocytochemistry reveals the presence of Complexin in phasic and tonic axonal
terminals of the crayfish leg extensor muscle............................................................................. 151
Figure 70. Western blot reveals Complexin in crayfish nervous tissue...................................... 153
Figure 71. Comparison of the partial crayfish Complexin amino acid sequence with Complexin
from other species. ...................................................................................................................... 155
Figure 72. Phasic EPSP traces for the Complexin peptide experiments at specific time points. 158
Figure 73. Tonic EPSP traces for the Complexin peptide experiments at specific time points. 159
Figure 74. The effects of crayfish Complexin central α-helix peptide on the evoked phasic
response under low and intense stimulation. .............................................................................. 160
Figure 75. The effects of crayfish Complexin central α-helix peptide on the evoked tonic
response under low and intense stimulation. .............................................................................. 161
Figure 76. Summary of the effects of crayfish Complexin central α-helix peptide on the evoked
phasic and tonic responses under the low and intense stimulation protocols. ............................ 162
Figure 77. Amplitude of action potentials recorded from the phasic and tonic axons before and
after injection for Complexin peptide experiments. ................................................................... 164
Figure 78. Partially zippered trans-SNARE complex at phasic and tonic synapses under resting
conditions. ................................................................................................................................... 170
Figure 79. Simplified pathway of exocytosis from docking to fusion at crayfish phasic and tonic
synapses in response to a single action potential. ....................................................................... 194
xx
List of Appendices
APPENDIX 1: STIMULATION-INDEPENDENT DEPRESSION OF THE CRAYFISH
PHASIC EVOKED RESPONSE...................................................................................229
APPENDIX 2: INTENSE STIMULATION OF THE PHASIC AND TONIC AXONS AND POST-TETANIC POTENTIATION ...............................................................................232
APPENDIX 3: INJECTION OF COMPLEXIN ANTIBODY INTO THE PHASIC AND
TONIC AXONS AND ITS EFFECTS ON THE PROBABILITY OF EVOKED RELEASE
.....................................................................................................................................238
xxi
List of Appendix Figures
Figure A1. Stimulation-independent depression of the evoked phasic response........................ 230
Figure A2. The effects of okadaic acid and FK506 on the stimulation-independent depression of
the evoked phasic response. ........................................................................................................ 231
Figure A3. Phasic evoked response during intense stimulation. ................................................ 233
Figure A4. Tonic evoked response during intense stimulation................................................... 234
Figure A5. Post-tetanic potentiation of the phasic evoked response. ......................................... 235
Figure A6. Post-tetanic potentiation of the tonic evoked response. ........................................... 236
Figure A7. The induction of phasic post-tetanic potentiation is Ca2+-dependent....................... 237
Figure A8. Injection of Drosophila Complexin antibody into the phasic axon enhances phasic
release in the first trial experiment.............................................................................................. 242
Figure A9. Injection of Drosophila Complexin antibody into the tonic axon decreases tonic
release in the first trial experiment.............................................................................................. 243
Figure A10. Injection of Drosophila Complexin antibody into the phasic axon had no effect on
phasic release in the second trial experiment.............................................................................. 244
Figure A11. Injection of Drosophila Complexin antibody into the tonic axon had no effect on
tonic release in the second trial experiment. ............................................................................... 245
Figure A12. Immunocytochemistry showing Complexin staining in phasic and tonic axonal
terminals of the crayfish walking leg extensor muscle. .............................................................. 246
xxii
Abbreviations
AP action potential
ATP adenosine tri-phosphate
BoNT Botulinum neurotoxin (holotoxin)
BoNT-LC Botulinum neurotoxin light-chain
BSA bovine serum albumin
Ca2+ calcium ion
[Ca2+]i intracellular calcium concentration
[Ca2+]o extracellular calcium concentration
CAPS calcium-dependent activator protein of secretion
cDNA complementary deoxyribose nucleic acid
cis-(SNARE) complex Soluble N-ethylmaleimide-sensitive factor Attachment REceptor
protein complex on a single membrane
CK2 casein kinase 2
CNS central nervous system
CODEHOP COnsensus-DEgenerate Hybrid Oligonucleotide Primers
CSP cysteine string protein
dH2O distilled water
DNA deoxyribose nucleic acid
DTT dithiothreitol
EDTA ethylenediaminetetraacetic acid
EPSP excitatory postsynaptic potential
ER endoplasmic reticulum
HeLa cells Henrietta Lacks immortal human cell line
HEPES N-[2-Hydroxyethyl] piperazine-N’-[2-ethanesulfonic acid]
HRP horseradish peroxidase
kB Boltzmann constant
KLH keyhole limpet hemocyanin
LB medium Luria-Bertani medium
Mg2+ magnesium ion
xxiii
MMLV moloney murine leukemia virus
mRNA messenger ribonucleic acid
NMJ neuromuscular junction
NSF N-ethylmaleimide-sensitive factor protein
NT neurotransmitter
PBS phosphate buffered solution
PBS-T phosphate buffered solution with 0.1% (v/v) Triton X-100
PCR polymerase chain-reaction
PKA protein kinase A
PPF paired-pulse facilitation
PTP post-tetanic potentiation
Q-SNARE Syntaxin or SNAP-25 (zero layer glutamine residue)
RACE rapid amplification of cDNA ends
RNA ribonucleic acid
RP reserved pool
RRP ready-releasable pool
R-SNARE Vesicle-Associated Membrane Protein (VAMP) (zero layer
arginine residue)
SDS sodium dodecyl sulphate
SDS-PAGE sodium dodecyl sulphate - polyacrylamide gel electrophoresis
S.E.M. standard error of the mean
SNAP Soluble N-ethylmaleimide-sensitive factor (NSF) Attachment
Protein
SNAP-25 synaptosome-associated protein of 25kD
SNARE Soluble N-ethylmaleimide-sensitive factor Attachment REceptor
protein
STD short-term depression
STF short-term facilitation
STP short-term plasticity
SV2 synaptic vesicle protein 2
Syt1 Synaptotagmin-1 (vesicle protein; calcium sensor)
T absolute temperature (Kelvin)
xxiv
TAE tris-acetate ethylenediaminetetraacetic acid
TBS tris buffered saline
TBS-T tris buffered saline with 0.1% (v/v) Tween-20
t-complex t-heterodimer complex consisting of 1:1 Syntaxin and SNAP-25
TeNT Tetanus neurotoxin (holotoxin)
TeNT-LC Tetanus neurotoxin light-chain
t-liposome liposome with Syntaxin and/or SNAP-25 attached to the membrane
Tm primer melting temperature
trans-(SNARE) complex Soluble N-ethylmaleimide-sensitive factor Attachment REceptor
protein complex spanning two opposing membranes (fusogenic)
t-SNARE Syntaxin or SNAP-25
VAMP Vesicle-Associated Membrane Protein (also known as
Synaptobrevin)
Vc C-terminal half of VAMP’s SNARE motif
Vcyt cytoplasmic region of VAMP
Vn N-terminal half of VAMP’s SNARE motif
v-liposome liposome with VAMP attached to the membrane
v-SNARE Vesicle-Associated Membrane Protein (VAMP)
1
Chapter 1: Introduction
1 Introduction
1.1 Neuronal communication
The synapse is a highly specialized structure that represents the fundamental unit of the
nervous system that allows communication between neuronal cells. There are two modes of
synaptic transmission: electrical and chemical. Electrical synapses were first identified in
crayfish (Furshpan and Potter, 1959) and permit the movement of current from one neuron to
another through a connecting pore structure known as a gap junction (reviewed in Söhl et al.,
2005). Chemical synaptic transmission represents the dominant form of neuronal communication
in the nervous system and involves the release of neurotransmitters (NTs) from a presynaptic cell
that activate receptors and elicit a response in a postsynaptic cell (Lin and Scheller, 2000;
Lisman et al., 2007). This thesis will focus on chemical synaptic transmission.
The release of NTs at a chemical synapse is dependent on the influx of calcium ions
(Ca2+) into the presynaptic terminal. Early classical works showed that Ca2+ was necessary and
sufficient for evoked release at the frog neuromuscular junctions (NMJs) (Katz and Miledi,
1965) and at the squid giant synapse (Katz and Miledi, 1967). Interestingly, under resting
conditions, spontaneous miniature potentials (minis) were observed (del Castillo and Katz, 1954;
Fatt and Katz, 1952; Katz and Miledi, 1965, 1969) but their amplitude was unaffected by Ca2+ as
initially shown by Fatt and Katz (1952). This finding led to the theory of the quantal nature of
release in which an evoked response is an integer multiple of minis (quanta), and therefore, a
mini represents the unitary (quantum) release of NT at the synapse (initially reviewed in Katz,
1971). The quantal nature of release was attributed to the fusion of synaptic vesicles with the
plasma membrane (Heuser and Reese, 1981; Heuser et al., 1979); the amount of NT in a single
synaptic vesicle defines a quantum.
1.1.1 Calcium and exocytosis
The release of NTs as a consequence of synaptic vesicle fusion occurs by a highly
regulated process known as exocytosis. Prior to the influx of Ca2+, a series of sequential events
(vesicle transport, tethering, docking, and priming) occurs that involves specific protein
interactions such that vesicles attain fusion-competence in which they will fuse in response to
2
Ca2+ (see Figure 1). In the last step of exocytosis, the fusion of vesicles occurs at specialized,
electron dense regions of the presynaptic cell plasma membrane known as active zones (Dreyer
et al., 1973; Harlow et al., 2001; Ko, 1984). Active zones are strategically positioned in direct
opposition to postsynaptic NT receptors (i.e. frog NMJs, Robitaille et al., 1990), which allows
NTs to traverse the synaptic cleft quickly to reach their target and elicit a rapid response in the
postsynaptic cell. Therefore, the depolarization of the nerve terminal will trigger the opening of
voltage-gated Ca2+ channels and permit the influx of Ca2+ inside the terminal that then triggers
vesicle fusion at the active zones. This represents a synchronized form of fusion where many
vesicles fuse at once and release a large amount of NT to elicit a postsynaptic response. For a
more detailed account of the events of exocytosis, see reviews by Jahn and Südhof (1999),
Lisman et al. (2007), and Südhof (2004).
Voltage clamp in the presynaptic terminal of the squid giant synapse showed that the
release of NTs and the corresponding postsynaptic response occurs very quickly following the
peak of Ca2+ influx (~200µsec) (Augustine et al., 1985; Llinás et al., 1981, 1982). Since Ca2+
diffuses slowly in the cytoplasm, this indicated that Ca2+ channels and transmitter release sites
must be very close together. A similar conclusion was reached with the use of Ca2+ chelators
with different reaction rates (Adler et al., 1991). Synaptic vesicles must be in close proximity to
Ca2+ channels at active zones such that vesicles could fuse quickly in response to Ca2+. This led
to the microdomain theory by Llinás et al. (1992) that stated: at each active zone, synaptic
vesicles and the Ca2+ sensor are in close association with Ca2+ channels such that the Ca2+ sensor
can detect the local influx of Ca2+ and rapidly trigger vesicle fusion (Figure 2A). Work by Llinás
et al. (1992) showed that the local [Ca2+] at the microdomain at the squid giant synapse is 200-
300µM and was later shown to be 25µM at the calyx of Held by Schneggenburger and Neher
(2000). These findings show that synaptic output may be a consequence of the local [Ca2+] at the
microdomain. At least in the calyx of Held, the microdomain matures into a nanodomain in
which there is a tighter spatial coupling between the vesicle and Ca2+ channels such that fewer
channels are required for vesicle fusion (Figure 2B) (Fedchyshyn and Wang, 2005). This
indicates that Ca2+-dependent exocytosis becomes more efficient during development.
3
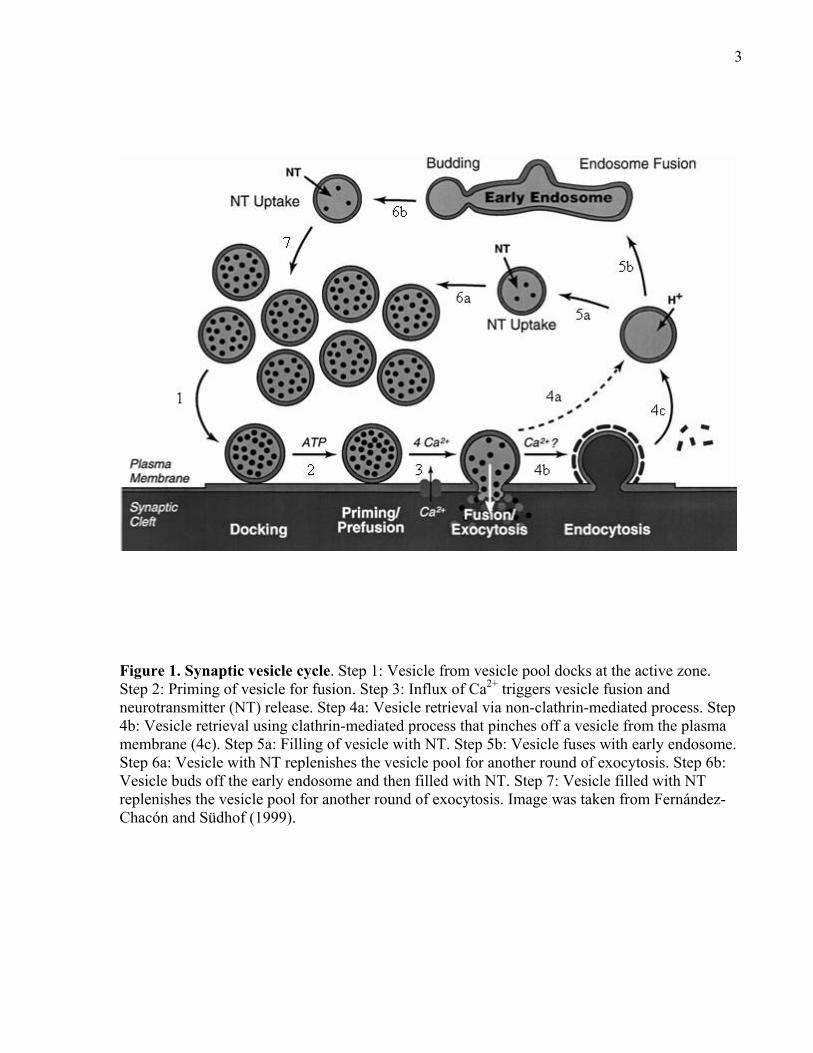
Figure 1. Synaptic vesicle cycle. Step 1: Vesicle from vesicle pool docks at the active zone. Step 2: Priming of vesicle for fusion. Step 3: Influx of Ca2+ triggers vesicle fusion and neurotransmitter (NT) release. Step 4a: Vesicle retrieval via non-clathrin-mediated process. Step 4b: Vesicle retrieval using clathrin-mediated process that pinches off a vesicle from the plasma membrane (4c). Step 5a: Filling of vesicle with NT. Step 5b: Vesicle fuses with early endosome. Step 6a: Vesicle with NT replenishes the vesicle pool for another round of exocytosis. Step 6b: Vesicle buds off the early endosome and then filled with NT. Step 7: Vesicle filled with NT replenishes the vesicle pool for another round of exocytosis. Image was taken from Fernández-Chacón and Südhof (1999).
4
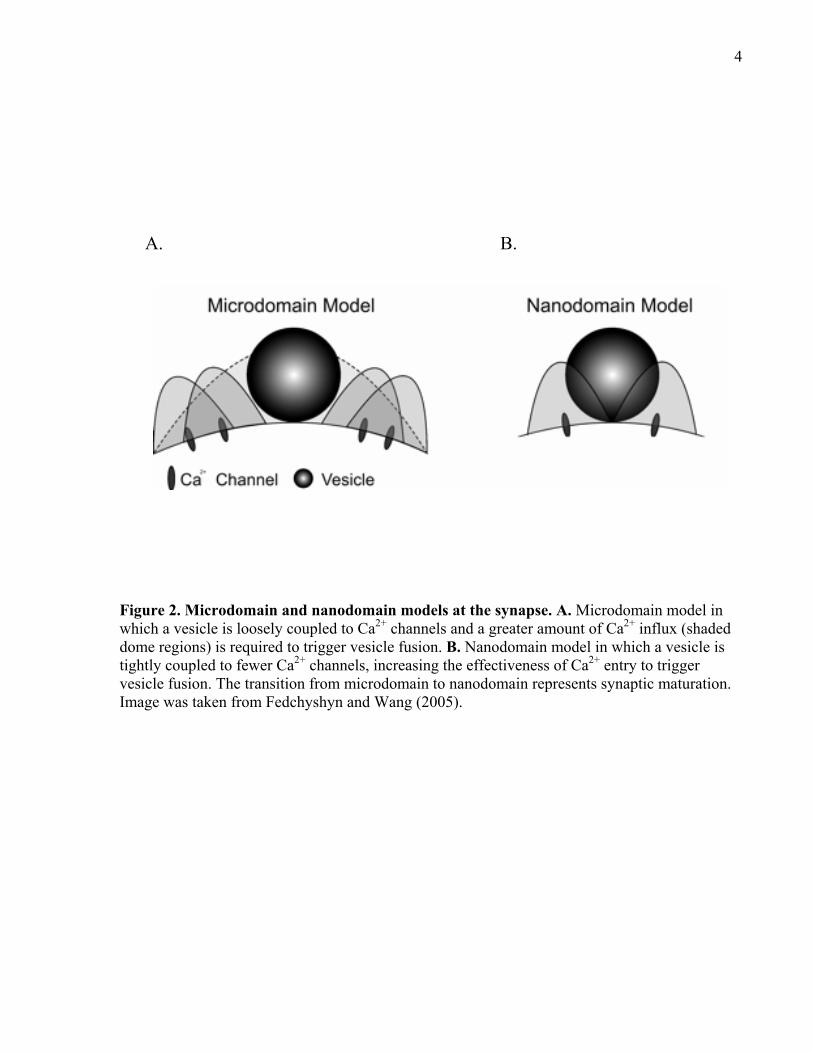
Figure 2. Microdomain and nanodomain models at the synapse. A. Microdomain model in which a vesicle is loosely coupled to Ca2+ channels and a greater amount of Ca2+ influx (shaded dome regions) is required to trigger vesicle fusion. B. Nanodomain model in which a vesicle is tightly coupled to fewer Ca2+ channels, increasing the effectiveness of Ca2+ entry to trigger vesicle fusion. The transition from microdomain to nanodomain represents synaptic maturation. Image was taken from Fedchyshyn and Wang (2005).
A. B.
5
1.1.2 Vesicle pools
A typical presynaptic terminal has many more vesicles than those at active zones. Many
of the vesicles can be several microns away from an active zone. The combination of
physiological and morphological analyses has identified at least three primary vesicle pools at
the synapse (see Figure 3; reviewed in Denker and Rizzoli, 2010). The first pool is the ready
releasable pool (RRP), which is defined as vesicles which are docked at the active zone and are
the first to undergo fusion in response to Ca2+ influx. The second is the recycling pool, which are
vesicles that are initially retrieved (endocytosed) from the plasma membrane and are reused
during moderate stimulation. Finally, the third pool is the reserved pool (RP), which is usually
furthest away from the active zone and remains dormant until recruited by intense, high
frequency stimulation. Evidence for the existence of different vesicle pools primarily involves
using high frequency (unphysiological) stimulation, in which the RP often remains unused, as
seen at mammalian synapses (Harata et al., 2001; Opazo et al., 2010; Wyatt and Balice-Gordon,
2008). However, at other synapses such as the Drosophila NMJs (Akbergenova and
Bykhovskaia, 2007, 2009; Denker et al., 2009) and frog NMJs (Richards et al., 2000), almost the
entire vesicle pool is depleted, suggesting that there is only one vesicle pool. Interestingly, when
a lower (physiological) frequency of stimulation is applied at Drosophila and frog NMJs, the
existence of different vesicle pools is now evident, in which most of the reserved pool is unused
(Kuromi and Kidokoro, 1998, 2000; Richards et al., 2003). This suggests that each vesicle pool
is sensitive to different types of stimulation and the sensitivities are not the same across different
types of synapses. There is evidence showing that the recycling and reserved pools intermix and
over time a vesicle in the recycled pool “matures” and becomes part of the reserved pool as
defined by its decreased mobility (Gaffield et al., 2006; reviewed in Denker and Rizzoli, 2010).
Most studies have defined a docked vesicle as one being no more than 50nm away from
the active zone membrane, based on electron micrograph images (Schikorski and Stevens, 1997,
2001; reviewed in Lin and Scheller, 2000). However, not all docked vesicles are considered
ready releasable (Denker et al., 2009; Millar et al., 2002; Rizzoli and Betz, 2004) and therefore,
docking can be defined in two different ways: (1) Morphologically docked vesicles are those
within a certain distance (≤ 50nm) from the plasma membrane; and (2) Biochemically docked
vesicles are those involved in a series of protein interactions that physically links the vesicle with
6
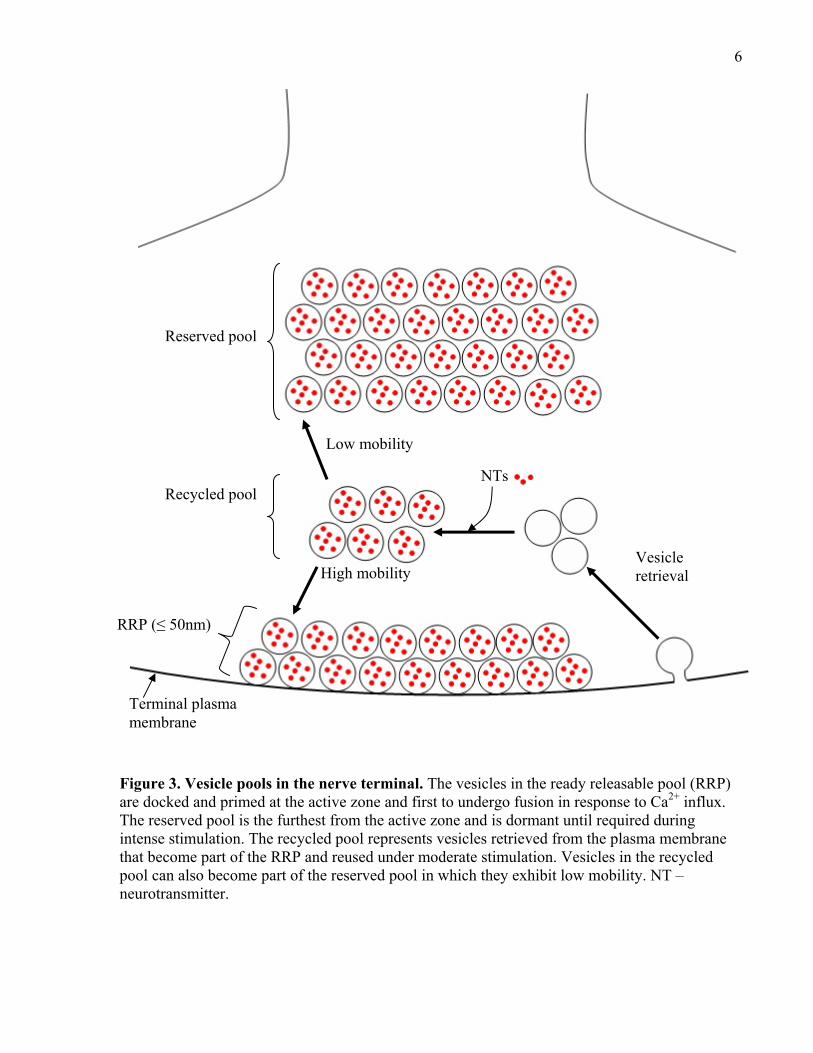
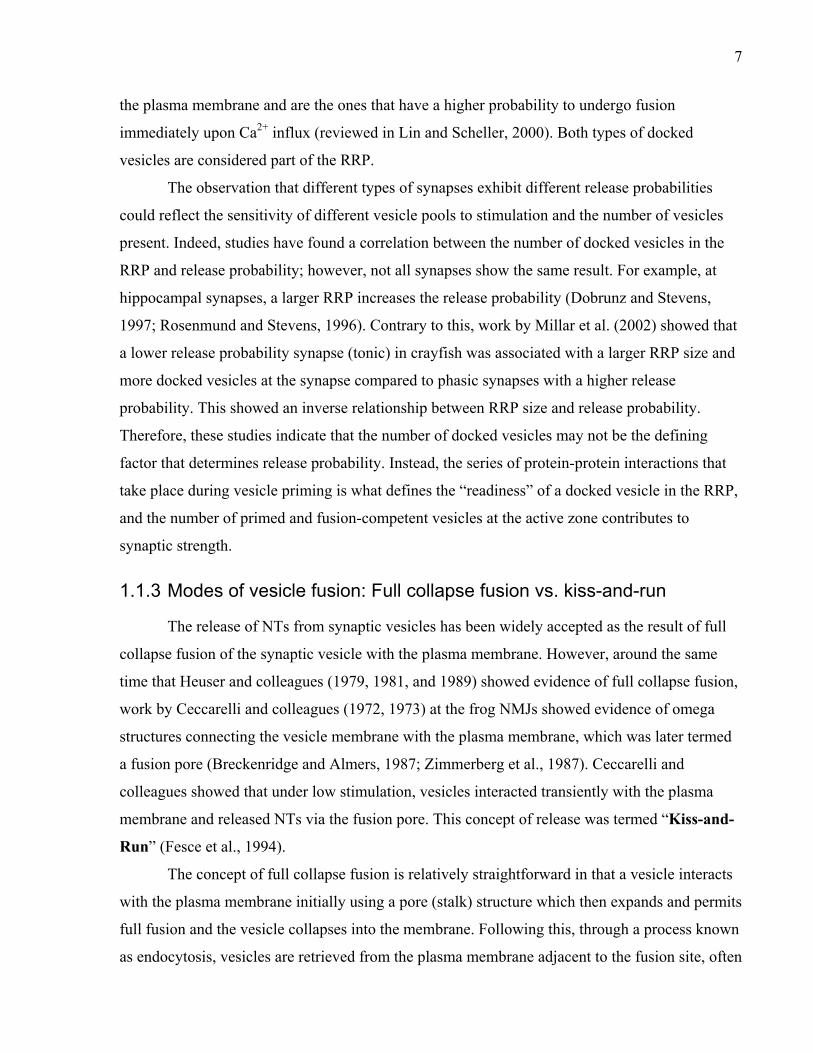
Figure 3. Vesicle pools in the nerve terminal. The vesicles in the ready releasable pool (RRP) are docked and primed at the active zone and first to undergo fusion in response to Ca2+ influx. The reserved pool is the furthest from the active zone and is dormant until required during intense stimulation. The recycled pool represents vesicles retrieved from the plasma membrane that become part of the RRP and reused under moderate stimulation. Vesicles in the recycled pool can also become part of the reserved pool in which they exhibit low mobility. NT – neurotransmitter.
Reserved pool
Recycled pool
RRP (≤ 50nm)
Low mobility
High mobility Vesicle retrieval
NTs
Terminal plasma membrane
7
the plasma membrane and are the ones that have a higher probability to undergo fusion
immediately upon Ca2+ influx (reviewed in Lin and Scheller, 2000). Both types of docked
vesicles are considered part of the RRP.
The observation that different types of synapses exhibit different release probabilities
could reflect the sensitivity of different vesicle pools to stimulation and the number of vesicles
present. Indeed, studies have found a correlation between the number of docked vesicles in the
RRP and release probability; however, not all synapses show the same result. For example, at
hippocampal synapses, a larger RRP increases the release probability (Dobrunz and Stevens,
1997; Rosenmund and Stevens, 1996). Contrary to this, work by Millar et al. (2002) showed that
a lower release probability synapse (tonic) in crayfish was associated with a larger RRP size and
more docked vesicles at the synapse compared to phasic synapses with a higher release
probability. This showed an inverse relationship between RRP size and release probability.
Therefore, these studies indicate that the number of docked vesicles may not be the defining
factor that determines release probability. Instead, the series of protein-protein interactions that
take place during vesicle priming is what defines the “readiness” of a docked vesicle in the RRP,
and the number of primed and fusion-competent vesicles at the active zone contributes to
synaptic strength.
1.1.3 Modes of vesicle fusion: Full collapse fusion vs. kiss-and-run
The release of NTs from synaptic vesicles has been widely accepted as the result of full
collapse fusion of the synaptic vesicle with the plasma membrane. However, around the same
time that Heuser and colleagues (1979, 1981, and 1989) showed evidence of full collapse fusion,
work by Ceccarelli and colleagues (1972, 1973) at the frog NMJs showed evidence of omega
structures connecting the vesicle membrane with the plasma membrane, which was later termed
a fusion pore (Breckenridge and Almers, 1987; Zimmerberg et al., 1987). Ceccarelli and
colleagues showed that under low stimulation, vesicles interacted transiently with the plasma
membrane and released NTs via the fusion pore. This concept of release was termed “Kiss-and-
Run” (Fesce et al., 1994).
The concept of full collapse fusion is relatively straightforward in that a vesicle interacts
with the plasma membrane initially using a pore (stalk) structure which then expands and permits
full fusion and the vesicle collapses into the membrane. Following this, through a process known
as endocytosis, vesicles are retrieved from the plasma membrane adjacent to the fusion site, often
8
via a clathrin-mediated process (see Figure 4A; reviewed in Lin and Scheller, 2000; Neher and
Sakaba, 2008; Rizzoli and Jahn, 2007). On the other hand, kiss-and-run initially involves the
vesicle associating with the plasma membrane via the fusion pore (“kiss”) and then NTs are
released through the pore without the vesicle undergoing full fusion. This is followed by the
closing of the fusion pore, which causes the vesicle to detach from the membrane (“run”) and
recycle back into the vesicle pool for another round of exocytosis (see Figure 4B; reviewed in
Fernández-Peruchena et al., 2005; He and Wu, 2007; Rizzoli and Jahn, 2007). There is clear
evidence to show that full collapse fusion exists at synapses in neuronal and endocrine cells (i.e.
Koenig and Ikeda, 1989; Llobet et al., 2003; Matteoli et al., 1992; Sara et al., 2005); however,
there is still controversy regarding the existence of kiss-and-run in these cell types (reviewed in
He and Wu, 2007; Rizzoli and Jahn, 2007).
Three primary electrophysiological and optical methods used to show evidence of kiss-
and-run at the synapse are membrane capacitance measurements, amperometric recordings
and fluorescent vesicle dyes (FM dyes). When vesicles fuse with the cell membrane, extra
membrane is added and the total membrane capacitance increases. Rapid capacitance decay
indicating rapid endocytosis via a non-clathrin-mediated process and capacitance “flickering”,
representing opening and closing of the fusion pore, are observed. Amperometric recordings
measure the charge required to reduce or oxidize NT molecules that are released. These
recordings show the presence of a pre-spike “foot”, which represents the release of a small
amount of NT through the fusion pore and precedes a larger amperometric spike that represents
the release of the remaining amount of NT. Full collapse fusion would be represented by little to
no capacitance flickering and a larger charge associated with amerpometric recordings. Finally
vesicles containing fluorescent FM dyes only partially release the dye such that a small amount
still remains inside the vesicle. Full collapse fusion would cause complete expulsion of the dye
from the vesicle (reviewed in Fernández-Peruchena et al., 2005). A study by Alés et al. (1999)
using rat chromaffin cells showed that high [Ca2+] increases the number of kiss-and-run events
that permitted full release of NTs, whereas full collapse fusion was observed under low [Ca2+],
indicating that kiss-and-run is utilized to allow continuous NT release under intense stimulation.
Similar findings were found in cultured hippocampal cells (Klingauf et al., 1998; Ryan et al.,
1996) and at NMJs (Verstreken et al., 2002) using FM dyes. However, there are some studies
that show evidence of kiss-and-run under low stimulation conditions such as in calf chromaffin
cells (Elhamdani et al., 2006) and at the calyx of Held (Sun et al., 2002; Wu et al., 2005;
9
Yamashita et al., 2005). More surprisingly, there are studies that show no evidence of kiss-and-
run in the same cell systems mentioned above or at other types of synapses (reviewed in He and
Wu, 2007).
Therefore, the debate continues regarding the existence of kiss-and-run and whether or
not it is used under specific stimulation conditions (i.e. high frequency) or can be a general form
of NT release similar to full collapse fusion. Presently, full collapse fusion is accepted as the
primary means of NT release at the synapse, and kiss-and-run, if it exists, may only be used
under special circumstances.
10
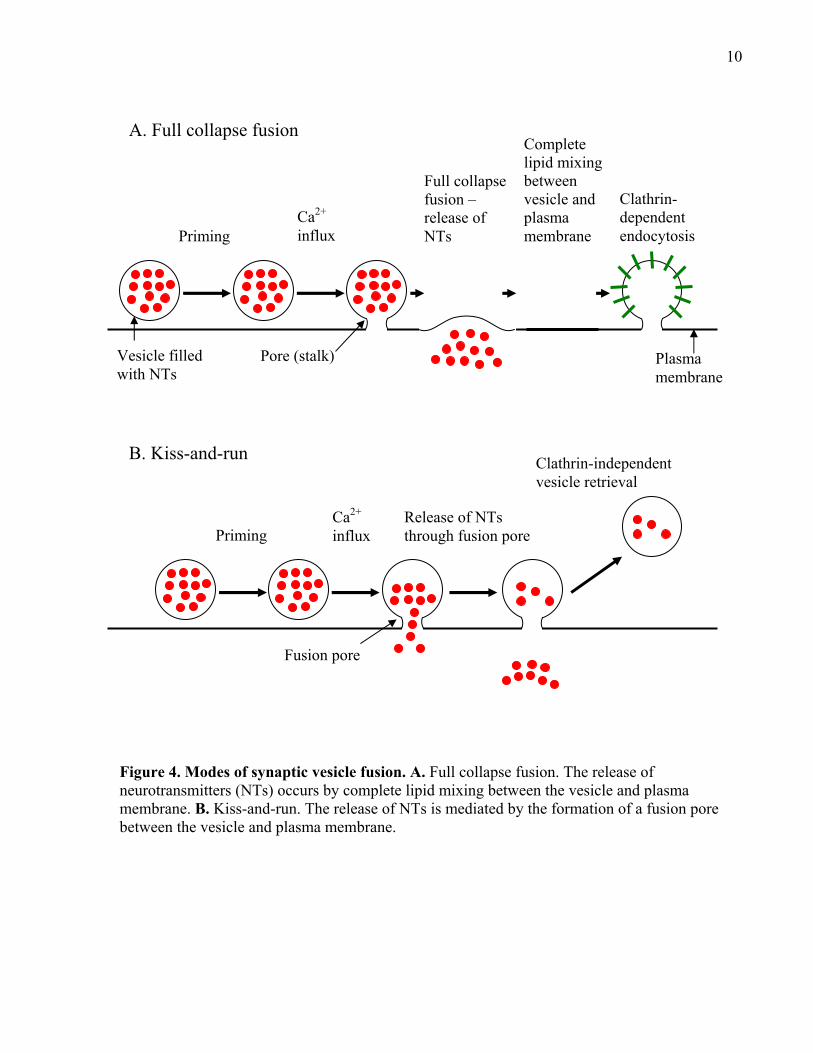
Figure 4. Modes of synaptic vesicle fusion. A. Full collapse fusion. The release of neurotransmitters (NTs) occurs by complete lipid mixing between the vesicle and plasma membrane. B. Kiss-and-run. The release of NTs is mediated by the formation of a fusion pore between the vesicle and plasma membrane.
Priming Ca2+ influx
Full collapse fusion – release of NTs
Complete lipid mixing between vesicle and plasma membrane
Clathrin-dependent endocytosis
A. Full collapse fusion
Pore (stalk) Vesicle filled with NTs
Priming Ca2+ influx
Fusion pore
Release of NTs through fusion pore
Clathrin-independent vesicle retrieval
B. Kiss-and-run
Plasma membrane
11
1.2 Exocytotic machinery
Exocytosis is the process that involves the fusion of intracellular vesicles with the plasma
membrane such that the contents within the vesicles are expelled to the outside of the cell or
transported to other cellular compartments. There are two forms of exocytosis: (1) Constitutive
and (2) regulated (reviewed in Lin and Scheller, 2000). Constitutive exocytosis occurs, for
example, in the endoplasmic reticulum (ER) – Golgi complex pathway to maintain lipids and
proteins on the cell plasma membrane or in other organelles. Regulated exocytosis is associated
with highly specialized pathways involved in specific cellular functions that are more tightly
controlled such as hormonal secretion and NT release. Although each form of exocytosis is
involved in different cellular functions, they share a common mechanism that mediates the
fusion between membranes: SNARE proteins.
1.2.1 SNARE proteins
Starting in the late 1980’s, three SNARE (Soluble N-ethylmaleimide-sensitive factor
Attachment REceptor) proteins were identified: Synaptobrevin (Vesicle-Associated Membrane
Protein, VAMP), synaptosome-associated protein of 25kD (SNAP-25), and Syntaxin. VAMP
was identified as an integral membrane protein that primarily resided on the cytosolic side of
synaptic vesicles (Baumert et al., 1989; Elferink et al., 1989; Trimble, 1993; Trimble et al., 1988)
and accounts for approximately 8-9% of total vesicle protein (Takamori et al., 2006; Walch-
Solimena et al., 1995). In contrast, SNAP-25 (anchored to the membrane by a string of
palmitoylated cysteine residues) and Syntaxin (integral membrane protein) were found
predominately on the plasma membrane of presynaptic terminals (Bennett et al., 1992; Hess et
al., 1992; Oyler et al., 1989). The location of the SNAREs is not exclusive to one particular
membrane because studies revealed that each SNARE can be found on both the vesicle and
presynaptic terminal membranes (Taubenblatt et al., 1999; Walch-Solimena et al., 1995). Both
Syntaxin and SNAP-25 account for approximately 3% of total vesicle protein versus 4-5% of
total synaptosomal protein, and VAMP represents 1.8% of total synaptosomal protein (Walch-
Solimena et al., 1995).
Early studies showed that the transport and fusion of vesicles in the constitutive
exocytotic pathway between the ER and Golgi complex requires the ATPase, N-ethylmaleimide-
Sensitive Factor (NSF) protein (Novick et al., 1981; Tagaya et al., 1993; Wilson et al., 1989).
12
NSF was found to associate with the membrane indirectly by binding with soluble NSF proteins
(SNAPs), especially α-SNAP (Whiteheart et al., 1992), which in turn are also important in the
ER-Golgi transport pathway (Clary et al., 1990; Kaiser and Schekman, 1990) and known to
associate with the membrane by binding with SNAP-receptors on the membrane (Graham and
Emr, 1991). The resulting complex consisting of NSF, α-SNAP and SNAP-receptors was
referred to as the 20S complex (Wilson et al., 1992). In the presence of Mg2+-ATP, the 20S
complex would completely dissociate and it was suggested that this ATP-dependent process was
the molecular basis of vesicle fusion (Whiteheart et al., 1992; Wilson et al., 1992). The finding
that the 20S complex was involved in vesicle fusion represented a significant step in
understanding the mechanism of exocytosis. However, a significant milestone was achieved by
the classical work of Söllner et al. (1993a, b), which identified the SNAP-receptor and shed new
light on a general mechanism applicable to almost all forms of vesicle fusion. The work by
Söllner et al. showed that the neuronal SNAP-receptor that binds with α-SNAP in the 20S
complex was composed of the three SNARE proteins (Syntaxin, SNAP-25, and VAMP) in a
stoichiometric 1:1:1 ratio, which became known as the SNARE (7S) complex and was identified
as being sodium dodecyl sulfate (SDS)-resistant (unlike yeast SNARE complexes (Rice et al.,
1997)) and requiring Mg2+-ATP to dissociate. This suggested that both constitutive and regulated
exocytosis share a common mechanism. This finding led Söllner et al. (1993a, b) to establish the
SNARE Hypothesis: “…each transport vesicle has its own specific v-SNARE [VAMP] that
pairs up in a unique match with a cognate t-SNARE [Syntaxin and SNAP-25] found only at the
intended target membrane”. Söllner et al. (1993a) proposed that the pairing of v- and t-SNAREs
confers target specificity and docks vesicles to the target membrane, and the ATP-dependent
dissociation of the 20S complex would trigger vesicle fusion. Furthermore, the initial pairing
between the v- and t-SNAREs would be anti-parallel and the energy provided by ATP would be
used to rotate the SNAREs during fusion such that afterwards the SNAREs would be parallel on
the same membrane.
The importance of the SNAREs in exocytosis was verified in a series of parallel
independent studies that showed the SNAREs were the target of Clostridial neurotoxins and their
cleavage by the neurotoxins impaired NT release (Blasi et al., 1993a, b; Link et al., 1992;
Schiavo et al., 1992a, b) (The Clostridial neurotoxins are described in further detail in sections
1.2.3.1 and 1.3). Later research revealed that SNAREs did not confer target specificity and had a
post-docking role, and the formation, not the dissociation, of the SNARE complex was required
13
for vesicle fusion (reviewed in Brunger, 2005; Jahn and Südhof, 1999; Südhof, 2004). In the
sections that follow, I describe the structure and assembly of the SNARE complex and its role in
exocytosis.
1.2.2 The SNARE complex
1.2.2.1 Structure
The SNARE complex is the result of a highly ordered interaction between the three
SNARE proteins. Complex formation is mediated by the intertwining of a specific α-helical
domain from each SNARE protein known as the SNARE complex domain or simply the SNARE
motif. Both VAMP and Syntaxin have one SNARE motif close to their C-terminal
transmembrane domain (H3 domain in Syntaxin), and SNAP-25 has two SNARE motifs (N- and
C-terminal domains, also known as the Sn1 and Sn2 domains, respectively) that are linked
together via the unstructured mid-region of SNAP-25 which contains the palmitoylated cysteine
residues (see Figure 5; Cánaves and Montal, 1998; Chapman et al., 1994; Ellena et al., 2009;
Sutton et al., 1998; Weimbs et al., 1997). The resulting interaction yields a SNARE complex
with a left-hand, four-helical coiled-coil structure in which the interaction between the SNARE
motifs defines the core of the complex (Lin and Scheller, 1997; Sutton et al., 1998). In solution,
the monomeric form of Syntaxin exhibits a moderate helical structure at its N-terminal (Habc
domain) and C-terminal (H3 and transmembrane domains) ends, whereas the other two SNAREs
are unstructured, showing little to no helical content (Fasshauer et al., 1997a, b; Poirier et al.,
1998). When the SNAREs are allowed to mix together, however, they readily interact
(energetically favourable) with each other to form the SNARE complex, in which each SNARE
now exhibits a high degree of α-helical content primarily around the SNARE motif regions
(Fasshauer et al., 1997b; Poirier et al., 1998; Sutton et al., 1998). Structural analysis of the
SNARE complex revealed that the four SNARE motif regions (two contributed by SNAP-25)
align in parallel with their N-terminal regions at one end and the C-terminal region at the
opposing end (see Figure 6A; Lin and Scheller, 1997; Poirier et al., 1998; Sutton et al., 1998).
The core complex is not extended and linear but instead has kinks along its length, allowing the
complex to bend at key points to exhibit the coiled-coil structure (Lin and Scheller, 1997; Sutton
et al., 1998). Interestingly, the α-helical curvature of each SNARE motif plus the angles at which
each one crosses the axis of the core complex are slightly different, and this may explain why the
SNARE motifs are not completely in register with each other (Sutton et al., 1998).
14
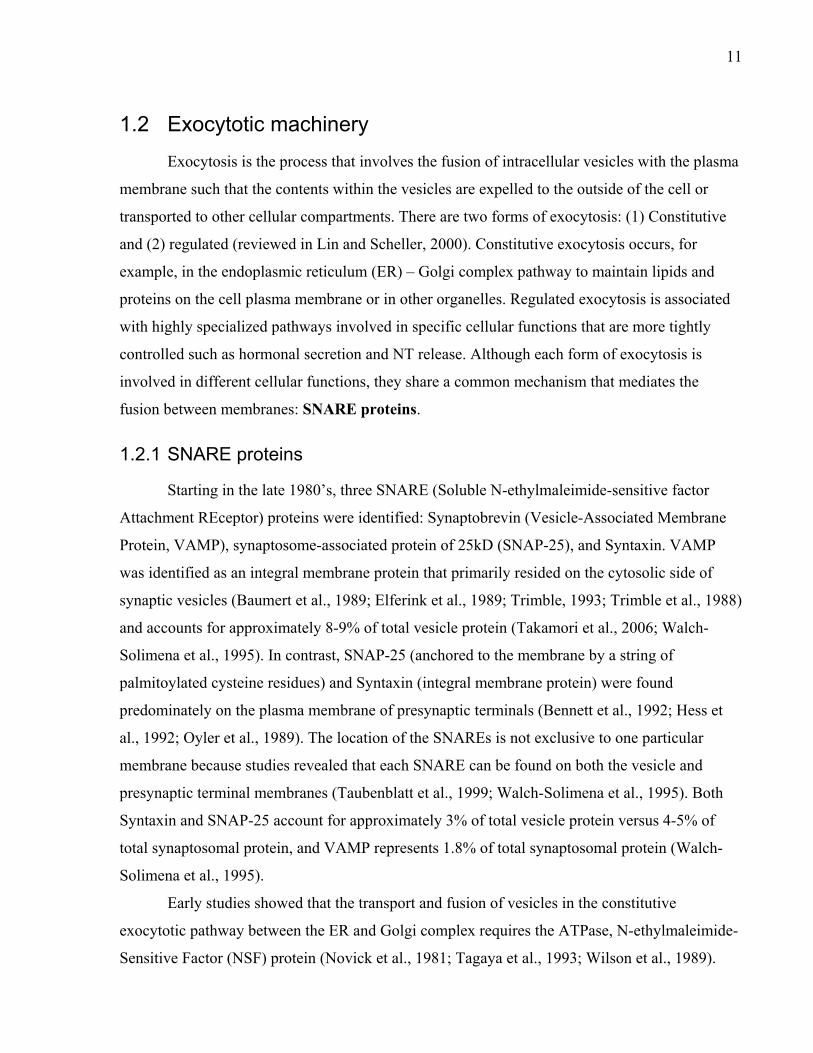
Figure 5. Domain structure of the three neuronal SNARE proteins. A. Syntaxin-1a. B. SNAP-25A. C. VAMP-2. The SNARE motif (minimum region required for SNARE complex formation) of each SNARE is depicted in yellow. The amino acid numbers are based on the rat protein sequences.
N-terminal Habc (inhibitory) domain
Flexible linker region
H3 SNARE motif (aa 191-253)
N-
Transmembrane domain
N-
-C
Flexible region with palmitoylated cysteine residues
CCCCCCCCCC
Sn1 SNARE motif (aa 11-82)
Sn2 SNARE motif (aa 141-203)
N- -C SNARE motif (aa 29-93)
C. VAMP-2
B. SNAP-25A
A. Syntaxin-1a
Transmembrane domain
Linker region
15
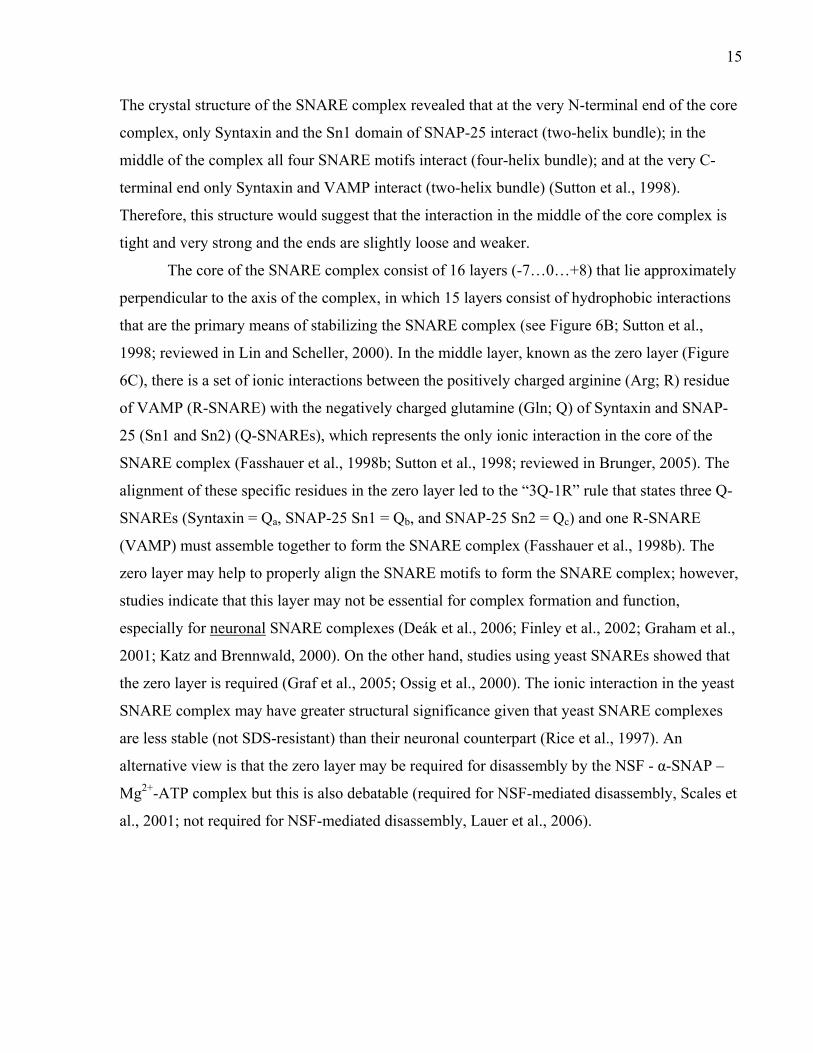
The crystal structure of the SNARE complex revealed that at the very N-terminal end of the core
complex, only Syntaxin and the Sn1 domain of SNAP-25 interact (two-helix bundle); in the
middle of the complex all four SNARE motifs interact (four-helix bundle); and at the very C-
terminal end only Syntaxin and VAMP interact (two-helix bundle) (Sutton et al., 1998).
Therefore, this structure would suggest that the interaction in the middle of the core complex is
tight and very strong and the ends are slightly loose and weaker.
The core of the SNARE complex consist of 16 layers (-7…0…+8) that lie approximately
perpendicular to the axis of the complex, in which 15 layers consist of hydrophobic interactions
that are the primary means of stabilizing the SNARE complex (see Figure 6B; Sutton et al.,
1998; reviewed in Lin and Scheller, 2000). In the middle layer, known as the zero layer (Figure
6C), there is a set of ionic interactions between the positively charged arginine (Arg; R) residue
of VAMP (R-SNARE) with the negatively charged glutamine (Gln; Q) of Syntaxin and SNAP-
25 (Sn1 and Sn2) (Q-SNAREs), which represents the only ionic interaction in the core of the
SNARE complex (Fasshauer et al., 1998b; Sutton et al., 1998; reviewed in Brunger, 2005). The
alignment of these specific residues in the zero layer led to the “3Q-1R” rule that states three Q-
SNAREs (Syntaxin = Qa, SNAP-25 Sn1 = Qb, and SNAP-25 Sn2 = Qc) and one R-SNARE
(VAMP) must assemble together to form the SNARE complex (Fasshauer et al., 1998b). The
zero layer may help to properly align the SNARE motifs to form the SNARE complex; however,
studies indicate that this layer may not be essential for complex formation and function,
especially for neuronal SNARE complexes (Deák et al., 2006; Finley et al., 2002; Graham et al.,
2001; Katz and Brennwald, 2000). On the other hand, studies using yeast SNAREs showed that
the zero layer is required (Graf et al., 2005; Ossig et al., 2000). The ionic interaction in the yeast
SNARE complex may have greater structural significance given that yeast SNARE complexes
are less stable (not SDS-resistant) than their neuronal counterpart (Rice et al., 1997). An
alternative view is that the zero layer may be required for disassembly by the NSF - α-SNAP –
Mg2+-ATP complex but this is also debatable (required for NSF-mediated disassembly, Scales et
al., 2001; not required for NSF-mediated disassembly, Lauer et al., 2006).
16
Figure 6. Structure of the SNARE complex. A. Ribbon diagram showing the four-helix, left-handed coiled-coil structure of the SNARE complex involving the SNARE motif(s) of each SNARE protein (VAMP, blue; Syntaxin, red; and SNAP-25 (Sn1 and Sn2), green). B. Diagram showing the 16 layers that defines the core of the SNARE complex with the corresponding SNARE motifs of each SNARE protein and the residues (bold) that are associated with each of the 16 layers (Sx1A - Syntaxin-1A; Sb2 - VAMP-2; SN1 - SNAP-25 Sn1; SN2 - SNAP-25 Sn2). C. Ionic interaction at the zero (0) layer. Figure was adapted from Jahn and Scheller (2006) and Parpura and Mohideen (2008).
A
B
C
Syntaxin-1A
VAMP-2
SNAP-25 Sn2
SNAP-25 Sn1
-C N-
N- -C
17
A defining feature of the neuronal SNARE complex is its stability by which it
demonstrates SDS-resistance and high thermal tolerance (the complex will dissociate at ≥ 95°C)
(Fasshauer et al., 1998a, 2002; Hayashi et al., 1994; Söllner et al., 1993a). As mentioned
previously, the disassembly of the SNARE complex is an ATP-dependent process that requires
NSF and the SNARE complex binding protein α-SNAP (Banerjee et al., 1996; Scales et al.,
2001; Söllner et al., 1993a, b). In fact, the SNARE complex is so stable that it would take at least
one billion years for the complex to disassemble in an NSF-independent process (Fasshauer et
al., 2002). The SNARE motifs are the minimum required regions to assemble the SNARE
complex which exhibits SDS-resistance, thermostability, and coiled-coil structure similar to the
SNARE complex of full-length SNAREs (Cánaves and Montal, 1998; Fasshauer et al., 1998a;
Hayashi et al., 1994). This was further demonstrated using trypsin, chymotrypsin, and proteinase
K digestion of the SNARE complex, which resulted in a complex held together with just the
SNARE motifs after all other exposed regions of the SNARE proteins were removed (i.e.
remaining regions of Syntaxin and VAMP, and the mid-region of SNAP-25) (Fasshauer et al.,
1998a).
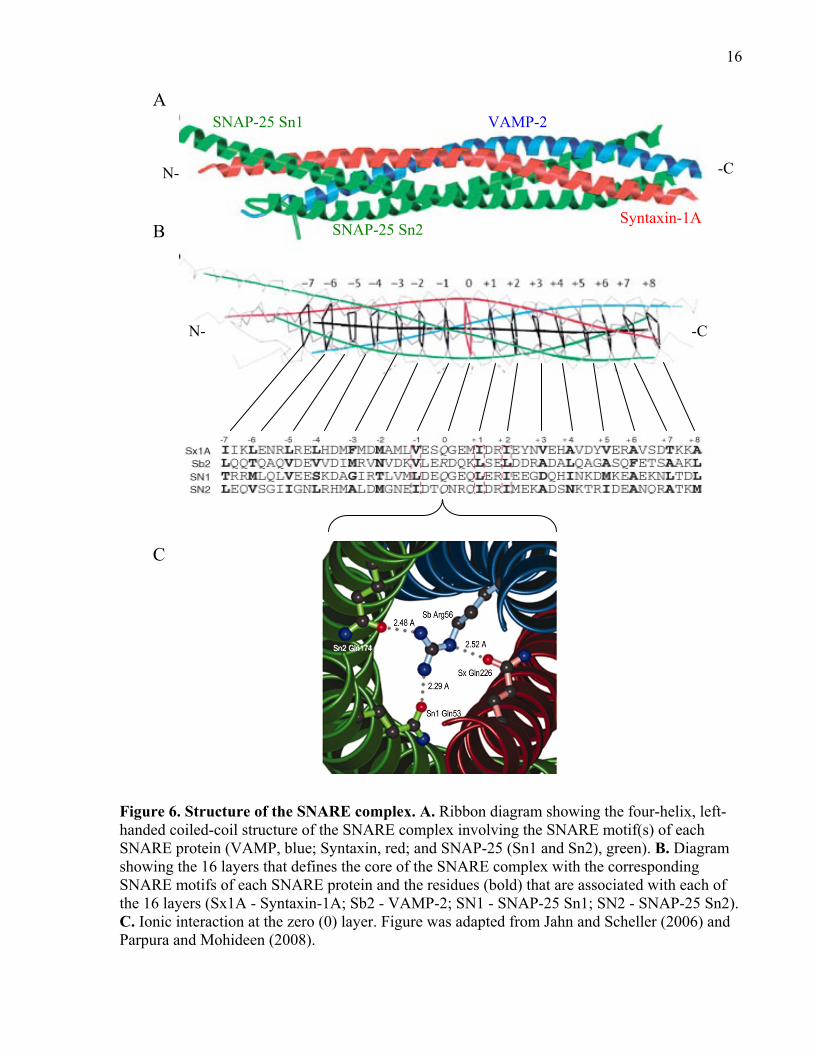
1.2.2.2 SNARE complex assembly
The SNARE complex can exist in one of two states: cis-complex or trans-complex
(Figure 7). The cis-SNARE complex represents the interaction among the three SNAREs located
on the same membrane, which can either be on the vesicle or target membrane (Otto et al., 1997;
Sanyal et al., 2001; Walch-Solimena et al., 1995). The trans-SNARE complex is the result of the
interaction between the SNAREs spanning two different membranes (vesicle and target
membrane) in which VAMP on the vesicle membrane interacts with the t-SNAREs on the target
membrane (Schwartz and Merz, 2009; Ungermann et al., 1998). The trans-SNARE complex is
the only form considered fusogenic because the complex bridges two membranes, a requirement
for vesicle fusion (Ungermann et al., 1998). The disassembly of the cis-SNARE complex by the
NSF-dependent process serves to replenish the pool of free SNAREs on both the vesicle and cell
plasma membrane and therefore, replenish the RRP for subsequent rounds of fusion (Sanyal et
al., 2001; Tolar and Pallanck, 1998; Ungermann et al., 1998).
An interesting facet of the SNARE complex is how it initially assembles. In solution or
proteoliposome assays, mixing the three SNARE proteins together readily produces the ternary
18
Figure 7. cis- and trans- SNARE complexes. 1. The trans-SNARE complexes link the vesicle with the plasma membrane. 2. Fully assembled trans-SNARE complexes trigger vesicle fusion. 3. The SNARE complexes remain on the plasma membrane in a cis-conformation after vesicle fusion. Note that cis-SNARE complexes can also exist on the vesicle membrane (see section 1.2.2.2). Blue – VAMP; green – Syntaxin; red – SNAP-25. For simplification, the two SNARE motifs of SNAP-25 are represented as a single line.
trans-SNARE complexes
Fusion of vesicle with plasma membrane
cis-SNARE complexes on the plasma membrane
1.
2.
3.
Plasma membrane
Vesicle
Neurotransmitters
VAMP
Syntaxin
SNAP-25
19
SNARE complex. However, reducing the concentration of VAMP relative to the t-SNAREs can
yield two primary intermediates that are referred to as the t-heterodimer complex or t-SNARE
complex (herein referred to as the t-complex): (1) 2:1 Syntaxin-SNAP-25 four-helix bundle (one
SNAP-25 contributes two SNARE motifs and two Syntaxin proteins each contribute a single
SNARE motif); and (2) 1:1 Syntaxin-SNAP-25 three-helix bundle (Fasshauer and Margittai,
2004; Fasshauer et al., 1997a, b, 2002; Pobbati et al., 2006; Weninger at al., 2008). Increasing
the concentration of VAMP will result in the more favourable ternary SNARE complex.
Syntaxin and SNAP-25 alone do not have a high affinity for VAMP; however, the t-complex
exhibits a very high affinity for VAMP (Fasshauer et al., 1997b; Hayashi et al., 1994;
Wiederhold and Fasshauer, 2009). The existence of the t-complex is not only found in solution
but has also been observed on supported lipid bilayers and in cultured cells (An and Almers,
2004; Rickman et al., 2010; reviewed in Dun et al., 2010). Furthermore, techniques that measure
energy or force associated with protein interactions, such as isothermal titration calorimetry and
atomic force microscopy, found that the formation of the t-complex, in particular the 1:1 t-
complex, requires a significant amount of energy compared to SNARE complex formation, and
may represent the rate-limiting step in SNARE complex assembly (Abdulreda et al., 2008;
Wiederhold and Fasshauer, 2009; Yersin et al., 2003). Therefore, the assembly of the trans-
SNARE complex may initially start with t-complex formation on the target membrane (i.e. active
zone) which then attracts VAMP with high affinity to form the trans-SNARE complex. This will
bring the vesicle in close proximity to the target membrane, and under the right conditions, the
complete assembly of the SNARE complex will initiate vesicle fusion.
The concept of the t-complex initiating trans-SNARE complex assembly is an attractive
model to explain how vesicles can exist in close opposition to the target membrane and mediate
vesicle fusion. However, an important question remains: how does the assembly of the trans-
SNARE complex drive vesicle fusion?
1.2.2.2.1 Zippering hypothesis
As mentioned before, the SNARE Hypothesis (Söllner et al., 1993a, b) stated that the v-
and t-SNARE proteins assembled in a trans-conformation but in an anti-parallel orientation and
the NSF-dependent disassembly of the complex was responsible for vesicle fusion. However,
with structural analyses showing that the SNAREs are arranged in parallel in the SNARE
complex (see section 1.2.2.1) and studies showing that vesicle fusion can occur in the absence of
20
NSF and ATP (Hanson et al., 1997; Sanyal et al., 2001; Schwartz and Merz, 2009), the SNARE
Hypothesis became obsolete. The realization that the SNARE complex is still required but a
parallel, trans-complex is necessary to pull two opposing membranes together led to the
development of the Zippering Hypothesis: the interaction between the SNARE motif(s) of each
SNARE protein initially starts at their N-terminal end and “zippers up” towards the C-terminal
end, producing the necessary force to drive vesicle fusion (Fiebig et al., 1999; Hanson et al.,
1997; Hua and Charlton, 1999; Lin and Scheller, 1997; Rothman, 1994).
There is no direct proof showing in real-time that as the trans-SNARE complex zippers
up vesicle fusion occurs; however, there is overwhelming evidence that indicates the Zippering
Hypothesis is valid and fits the criteria for vesicle fusion. For instance, interfering peptides based
on the N-terminal half of the SNARE motif but not the C-terminal half can interfere with
SNARE complex formation and vesicle fusion in different cell systems (Giraudo et al., 2006;
Jung et al., 2008; Matos et al., 2003; Melia et al., 2002). In addition, using SNAREs with
mutations in the N-terminal half of the SNARE motif or creating truncated SNAREs missing the
N-terminal half of the SNARE motif prevented SNARE complex formation and fusion
(Fasshauer and Margittai, 2004; Schwartz and Merz, 2009; Sørensen et al., 2006). These findings
support the hypothesis that SNAREs initially interact at the N-terminal end of their SNARE
motif(s) and therefore, the N- to C-terminal zippering of the trans-SNARE complex drives
vesicle fusion (see Figure 8).
When SNAREs are placed in membranes they form a partially zippered trans-complex
(Figure 8B) rather than a tightly zippered trans-complex (Figure 8A) as seen in solution (Su et
al., 2008; Zhang et al., 2005). Partially zippered complexes also exist under resting conditions in
almost every membrane system such as proteoliposome fusion assays, cell culture, and ex-vivo
systems such as the crayfish NMJs (Chen et al., 2001; Hua and Charlton, 1999; Kubista et al.,
2004; Matos et al., 2003; Melia et al., 2002; Su et al., 2008; Xu et al., 1999). It is unclear how
much of the N-terminal region of the SNARE complex is zippered up in the partially zippered
state, but studies indicate that it may be at least from the -7 to zero layer region (Hua and
Charlton, 1999; Melia et al., 2002) or as much as the -7 to +3 layer region (Schwartz and Merz,
2009). Therefore, a partial zippered SNARE complex refers to the SNARE motifs from each
SNARE protein zippered only at their N-terminal end, and the C- terminal ends are unzippered
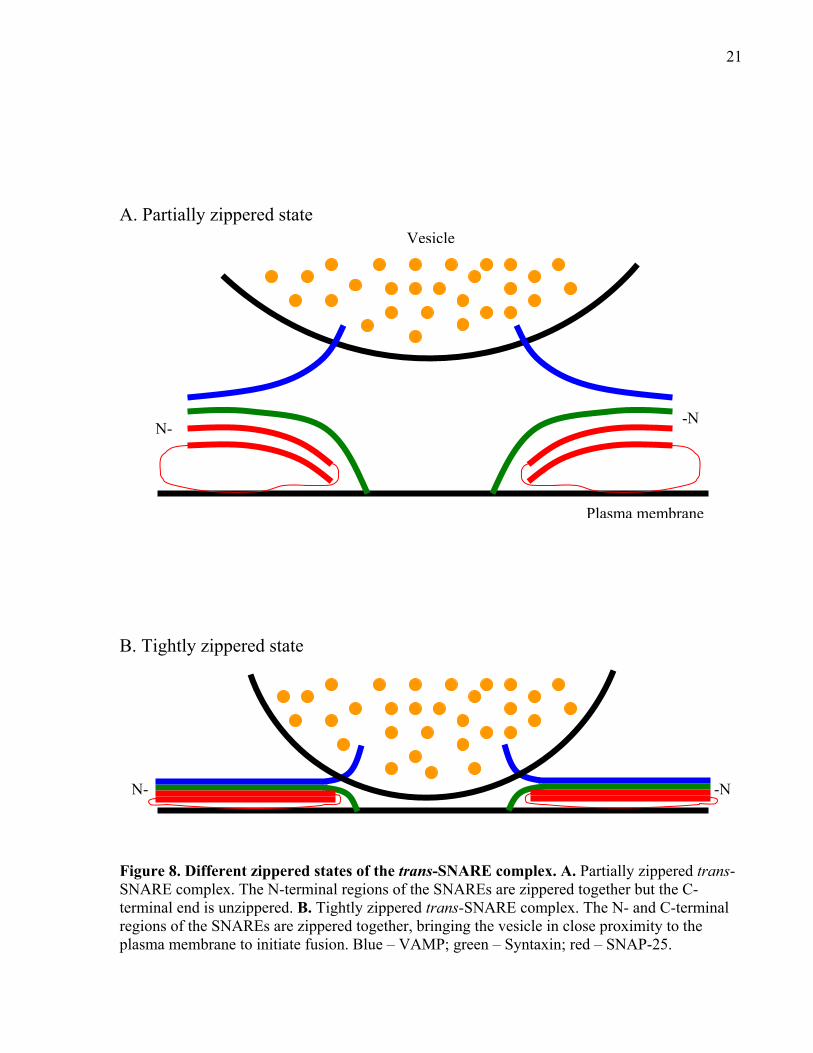
21
Figure 8. Different zippered states of the trans-SNARE complex. A. Partially zippered trans-SNARE complex. The N-terminal regions of the SNAREs are zippered together but the C-terminal end is unzippered. B. Tightly zippered trans-SNARE complex. The N- and C-terminal regions of the SNAREs are zippered together, bringing the vesicle in close proximity to the plasma membrane to initiate fusion. Blue – VAMP; green – Syntaxin; red – SNAP-25.
A. Partially zippered state
B. Tightly zippered state
Vesicle
Plasma membrane
N- -N
N- -N
22
(Hua and Charlton, 1999; Sørensen et al., 2006). However, other studies indicate that the trans-
SNARE complex may be more zippered up at rest than initially envisioned and that the partially
zippered state is the result of an unstructured C-terminal end, in particular the Sn2 domain of
SNAP-25 (Melia et al., 2002; Su et al., 2008). Furthermore, the trans-SNARE complex may be
in a dynamic equilibrium with different partially zippered states or even fluctuate between
uncomplexed and partially zippered (Chen et al., 2001; Xu et al., 1999). The idea that SNARE
complexes exist in different partially zippered states under resting conditions may help to explain
the existence of multiple intermediate states (hysteresis) of the SNARE complex during initial
assembly prior to complete complex assembly (Fasshauer et al., 2002). Furthermore, different
degrees of zippering may also explain how docked vesicles in a proteoliposome fusion assay can
be located at different distances from the target membrane, which includes a hemifusion state
where only the outer leaflet of the bilayer of the vesicle and target membrane mix together
without full fusion (Xu et al., 2005; Yoon et al., 2006). Therefore, the different intermediate
states of a docked vesicle at the active zone may be the result of different partially zippered
trans-SNARE complexes, in which the more tightly zippered complexes will confer a higher
probability of Ca2+-dependent vesicle fusion (see Xu et al., 1999).
1.2.2.3 Is a single trans-SNARE complex sufficient for fusion?
The zippering of the trans-SNARE complex represents the mechanism that is required to
initiate vesicle fusion. However, does a single trans-SNARE complex generate the necessary
force to overcome membrane repulsion and trigger fusion? The answer to this question appears
to be “No”. The zippering of a single SNARE complex releases free energy (33-43kBT; kB =
Boltzmann constant, T = absolute temperature) (Li et al., 2007; Liu et al., 2006, 2008;
Wiederhold and Fasshauer, 2009, Yersin et al., 2003); however, the amount may not be sufficient
for a single SNARE complex to overcome the energy barrier to fuse two membranes, which
remains unknown but is estimated to be in the range of 40-200kBT (Kozlovsky and Kozlov,
2002; Siegel and Kozlov, 2004). It is estimated that a minimum of three trans-SNARE
complexes may be required for fusion (Hua and Scheller, 2001; Montecucco et al., 2005),
although other estimates put it in the range of 5-15 (Domanska et al., 2009; Han et al., 2004;
James et al., 2009; Montecucco et al., 2005). Furthermore, a ring of trans-SNARE complexes
may be required for fusion (Cho et al., 2002, 2005; Montecucco et al., 2005; reviewed in Jena,
2008), and this is not surprising as SNARE complexes in solution are known to form oligomers
23
(Fasshauer et al., 1998a). However, recent work by van den Bogaart et al. (2010) demonstrated
that a single trans-SNARE complex was sufficient for fusion between v- and t-SNARE
liposomes, and between purified synaptic vesicles and t-SNARE liposomes. In addition, a ring of
SNARE complexes was not observed during fusion. Therefore, it is possible that a single
SNARE complex is sufficient for fusion. It should be noted, however, that the radius of the
liposomes was 17nm, which the authors pointed out is smaller than a synaptic vesicle (≥ 20nm)
which would require more energy for fusion. Therefore, at the synapse, more than 1 trans-
SNARE complex may be required for vesicle fusion with the active zone membrane.
1.2.3 The importance of SNAREs in exocytosis as demonstrated by various experimental tools
The observation that vesicles contain a high concentration of VAMP whereas the cell
plasma membrane contains of a high concentration of Syntaxin and SNAP-25, and that the
SNAREs readily assemble to form the SNARE complex makes the trans-SNARE complex an
ideal mechanism to drive vesicle fusion at the synapse.
Proteoliposome fusion assays examine the fusion between “vesicle” liposomes with
“target” liposomes or a planar lipid bilayer. It is observed that fusion between two protein-free
lipids either does not occur or the fusion rate is very slow over a period of time. However, the
addition of VAMP on one liposome (v-liposome) and the t-SNAREs on another liposome (t-
liposome) greatly facilitates the rate of vesicle fusion (Fix et al., 2004; Hu et al., 2002; Liu et al.,
2005). Furthermore, there is an increase in the number of v-liposomes docked with t-liposomes
or planar bilayers (Cypionka et al., 2009; Liu et al., 2005; Yoon et al., 2008). Surprisingly, the
effect of the SNARE complex on lipid mixing varies between studies. Some studies claim that
the SNARE complex alone is required to facilitate fusion (Liu et al., 2005; Parlati et al., 1999;
Schuette et al., 2004); however, other studies claim that the SNARE complex is required but
SNARE-dependent fusion is accelerated with the addition of other factors such as Ca2+ and other
proteins that are known to associate with the SNARE complex (i.e. Synaptotagmin-1,
Complexin, CAPS – these and other SNARE-associated proteins are described in section 1.2.5)
(Bhalla et al., 2006; Chicka et al., 2008; James et al., 2009; Lu et al., 2006; Mahal et al., 2002;
Yoon et al., 2008). The different results observed between these studies could be attributed to a
variety of factors that include liposome size and composition, the concentration of each SNARE
on the membranes, temperature, concentration of Ca2+ and other proteins, etc. In any case, the
24
results show that the trans-SNARE complex is important for lipid mixing perhaps by providing
the required energy to make it easier for two membranes to fuse together.
Similar to the results of the proteoliposome fusion assays, the importance of the SNAREs
and SNARE complex in exocytosis is also observed in more complete systems such as
synaptosomes, cultured cells, NMJs, and whole animal models. Various techniques such as
Clostridial neurotoxins, interfering peptides, antibodies, and mutations have been employed to
study the role of SNAREs in exocytosis, and the general consensus is that interruption of the
SNAREs zippering together to form the trans-SNARE complex will impair release.
1.2.3.1 Clostridial neurotoxins
The Clostridial tetanus and botulinum neurotoxins (TeNT, BoNT) cause spastic paralysis
and flacid paralysis, respectively. These symptoms are caused by blockade of NT release at
central inhibitory synapses (TeNT) or at NMJs (BoNTs). These neurotoxins are endoproteases
that cleave highly conserved peptide bonds within the SNARE proteins. The binding and
cleavage sites for TeNT and BoNTs that target the SNAREs are described in section 1.3.1.
Some of the initial experiments that showed the importance of the SNARE proteins in
exocytosis used TeNT and BoNTs (Blasi et al., 1993a, b; Link et al., 1992; Schiavo et al.,
1992a). In general, the proteolysis of the SNARE proteins by the neurotoxins results in moderate
to severe inhibition of release. For instance, in cultured cells and more intact systems such as the
calyx of Held and NMJs, the proteolysis of VAMP (Borisovska et al., 2005; Hua and Charlton,
1999; Hua et al., 1998; Hunt et al., 1994; Lawrence and Dolly, 2002; Llinás et al., 1994; Sakaba
et al., 2005; Young, 2005), Syntaxin (O’Connor et al., 1997; Marsal et al., 1997; Sakaba et al.,
2005), and SNAP-25 (Finley et al., 2002; Gil et al., 1998; Graham et al., 2001; Lawrence and
Dolly, 2002; Sakaba et al., 2005; Washbourne et al., 1999; Young, 2005) decreases or blocks the
evoked response. Interestingly, the inhibited response associated with the cleavage of SNAP-25,
especially by BoNT/A, can almost be completely recovered if the extracellular [Ca2+] ([Ca2+]o) is
increased (Lawrence and Dolly, 2002; Sakaba et al., 2005; Washbourne et al., 1999). This
suggests that the SNARE complex may associate with the Ca2+-sensor for evoked release via
SNAP-25 (further discussed in section 1.2.5). Furthermore, minis are still present and in some
cases the frequency is reduced (Hua et al., 1998; Searl and Silinsky, 2005) or even increased
(Young, 2005).
25
1.2.3.2 Interfering peptides
Another common tool that is used to examine the function of SNAREs in exocytosis is
the use of interfering peptides. More specifically, peptides that interfere with the SNARE motifs
interacting with each other to form the trans-SNARE complex will impair release. For example,
the greatest inhibition results from using peptides that mimic the N-terminal end of the SNARE
motifs in the presence of stimulation (Apland et al., 2003; Blanes-Mira et al., 2004; Jung et al.,
2008; Matos et al., 2003). The N-terminal peptides block the initial zippering of the SNAREs at
their N-terminal ends, thus preventing the assembly of the SNARE complex. Surprisingly,
peptides that mimic the C-terminal end of the SNARE motifs do not significantly impair release
(Hunt et al., 1994; Jung et al., 2008; Matos et al., 2003). This could be the result of steric
hindrance at the C-terminal end of the SNARE complex or the peptide has a low affinity for the
SNAREs such that it is easily displaced when the SNAREs fully zipper to trigger fusion. The
effects of SNARE-specific peptides are further discussed in Chapter 4.
1.2.3.3 Genetic manipulations
Finally, genetic manipulations of the SNAREs have helped to dissect the role of the
SNAREs in different forms of release. Knockout of VAMP in cultured mammalian cells
decreases the evoked response and reduces mini frequency (Borisovska et al., 2005; Deák et al.,
2006; Sara et al., 2005). Similarly, Drosophila VAMP null/knockout or knockdown mutants also
exhibit a decrease in evoked release (Broadie et al., 1995; Deitcher et al., 1998; Kidokoro, 2003;
Stewart et al., 2000) and is often accompanied by a decline in mini frequency (Deitcher et al.,
1998; Kidokoro, 2003). Furthermore, Drosophila Syntaxin knockout or knockdown mutants
show a decrease in the evoked response (Broadie et al., 1995; Kidokoro, 2003; Stewart et al.,
2000) and either complete inhibition (knockout, Broadie et al., 1995) or a decrease (knockdown,
Stewart et al., 2000) in mini frequency.
The expression of SNAREs with mutations, especially in the SNARE motifs, has given
insight into how SNAREs interact and the role of the SNARE complex in release. For instance,
point mutations in Syntaxin’s SNARE motif that alters it α-helical structure or makes it more
hydrophilic decreases the evoked response and mini frequency (Fergestad et al., 2001; Han and
Jackson, 2006). Deletion of the C-terminal end of Syntaxin’s SNARE motif also decreases the
evoked response but the mini frequency increases (Wu et al., 1999). Mutations to VAMP such
that the SNARE motif is more hydrophilic (Han and Jackson, 2006), or substitution of residues at
26
the C-terminal end of the transmembrane domain that associates with the inner leaflet of the
vesicle membrane with positively charged residues (Ngatchou et al., 2010), or extending the
linker region (in between SNARE motif and transmembrane domain, see Figure 5C) (Deák et al.,
2006; Kesavan et al., 2007) decreases evoked release. The effect of extending the linker region is
likely related to the fact that the SNARE motif is located further from the vesicle membrane.
Therefore, the transfer of force from zippering of the trans-SNARE complex to lipid mixing will
be ineffective as the vesicle will not be close enough to the target membrane to undergo fusion.
Mutations to SNAP-25 in which the SNARE motifs (Sn1 or Sn2) are made more
hydrophilic or the last 6, 9 or 26 amino acids of the C-terminal end of SNAP-25 are deleted
decrease release (Finley et al., 2002; Han and Jackson, 2006; Sørensen et al., 2006).
Furthermore, a study by Rao et al. (2001) created a Drosophila SNAP-25 temperature-sensitive
mutant, in which a mutation of G50E was made in the Sn1 SNARE motif. At 22C this mutant
exhibited an increase in both the evoked release and mini frequency whereas at 37C there was a
decrease in the evoked response without a change in the amplitude or frequency of minis. The
authors hypothesized that a tighter SNARE complex may account for the results at 22C but
unstable SNARE complexes or SNARE complex oligomers may have been responsible for the
results at 37C because, at 37C in-vitro, there was a decrease in the number of observed
SNARE complexes and SNARE complex oligomers were less stable than using wild-type
SNAP-25. Perhaps the enhanced release at 22C is due to an increase in affinity of SNAP-25 for
the Ca2+-sensor (see section 1.2.5).
Therefore, the SNAREs play an essential role in Ca2+-dependent evoked release and
minis, although minis may be regulated by other factors in addition to the SNARE proteins.
1.2.4 Post-docking role of the trans-SNARE complex
The strong interaction between the SNAREs and the observation that v- and t-liposomes
show increased docking (dwell) times with each other compared to protein-free liposomes make
the trans-SNARE complex an ideal mechanism for vesicle docking. Unfortunately, studies that
have used many of the techniques mentioned above to interfere with SNARE complex assembly
show that the morphological docking of vesicles at release sites is not affected (Broadie et al.,
1995; Hunt et al., 1994; Llinás et al., 1994; Low et al., 1999; Marsal et al., 1997; O’Connor et al.,
1997). Therefore, the trans-SNARE complex has a post-docking role in exocytosis in which it is
more likely involved in the triggering of the fusion event itself as stated by the Zippering
27
Hypothesis. In support of this, kinetics of lipid mixing is not affected when SNAREs are
manipulated using various techniques (Broadie, et al., 1995; Finley et al., 2002; Graham et al.,
2001; Stewart et al., 2000; Washbourne et al., 1999), indicating that the trans-SNARE complex
is necessary for but does not carry out lipid mixing.
1.2.5 SNARE-associated proteins
An interesting outcome of fusion in a proteoliposome fusion assay with v- and t-SNARE
liposomes or using purified synaptic vesicles, as is the case in the studies mentioned above (see
section 1.2.3), is that the rate of fusion is much slower than that observed at synapses. This result
suggests that although the SNARE complex is required for vesicle fusion, it requires the
assistance of other factors to speed up the process. There are a variety of proteins known to
interact with individual SNAREs or the SNARE complex. The majority have a regulatory role in
preparing the SNAREs for complex formation as well as controlling the zippering of the SNARE
complex. Therefore, these proteins contribute significantly to release by modulating the
interactions between the SNAREs and determining the output of the synapse. In the following
sections, I will discuss the importance of two proteins, Synaptotagmin-1 and Complexin, known
to have a significant impact on SNARE complex zippering and Ca2+-dependent vesicle fusion. A
summary of other SNARE-associated proteins is given in Table 1.
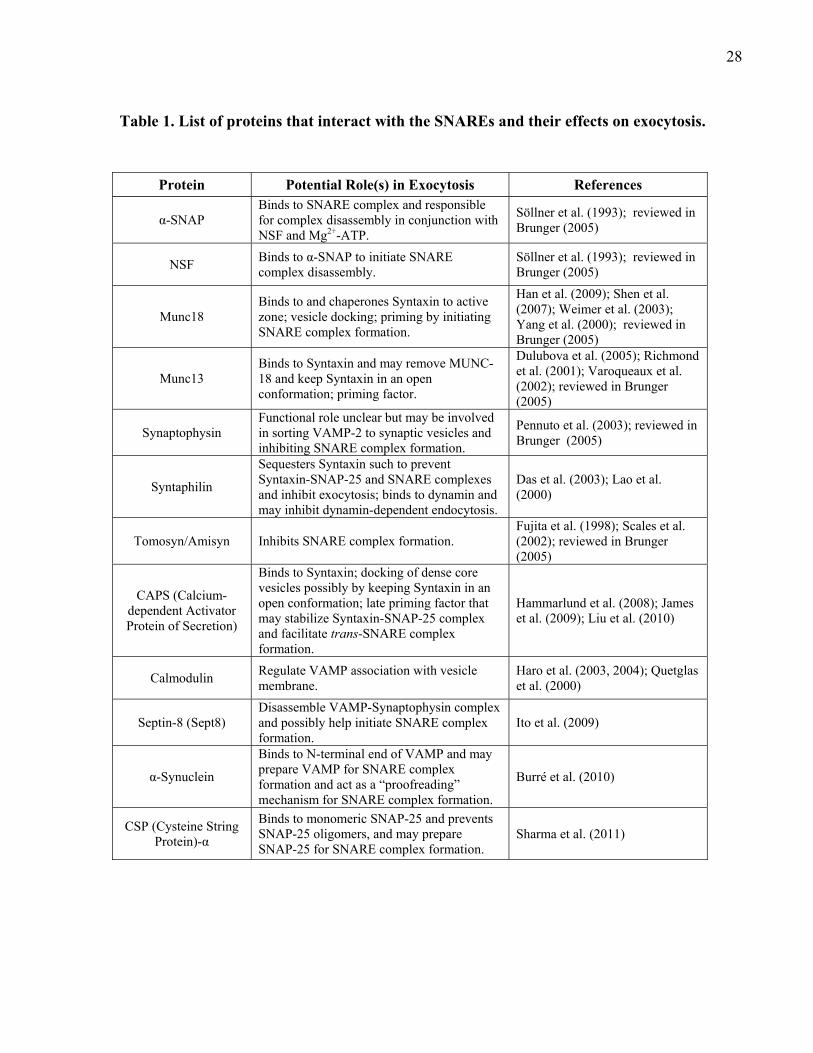
28
Table 1. List of proteins that interact with the SNAREs and their effects on exocytosis.
Protein Potential Role(s) in Exocytosis References
α-SNAP Binds to SNARE complex and responsible for complex disassembly in conjunction with NSF and Mg2+-ATP.
Söllner et al. (1993); reviewed in Brunger (2005)
NSF Binds to α-SNAP to initiate SNARE complex disassembly.
Söllner et al. (1993); reviewed in Brunger (2005)
Munc18 Binds to and chaperones Syntaxin to active zone; vesicle docking; priming by initiating SNARE complex formation.
Han et al. (2009); Shen et al. (2007); Weimer et al. (2003); Yang et al. (2000); reviewed in Brunger (2005)
Munc13 Binds to Syntaxin and may remove MUNC-18 and keep Syntaxin in an open conformation; priming factor.
Dulubova et al. (2005); Richmond et al. (2001); Varoqueaux et al. (2002); reviewed in Brunger (2005)
Synaptophysin Functional role unclear but may be involved in sorting VAMP-2 to synaptic vesicles and inhibiting SNARE complex formation.
Pennuto et al. (2003); reviewed in Brunger (2005)
Syntaphilin
Sequesters Syntaxin such to prevent Syntaxin-SNAP-25 and SNARE complexes and inhibit exocytosis; binds to dynamin and may inhibit dynamin-dependent endocytosis.
Das et al. (2003); Lao et al. (2000)
Tomosyn/Amisyn Inhibits SNARE complex formation. Fujita et al. (1998); Scales et al. (2002); reviewed in Brunger (2005)
CAPS (Calcium-dependent Activator Protein of Secretion)
Binds to Syntaxin; docking of dense core vesicles possibly by keeping Syntaxin in an open conformation; late priming factor that may stabilize Syntaxin-SNAP-25 complex and facilitate trans-SNARE complex formation.
Hammarlund et al. (2008); James et al. (2009); Liu et al. (2010)
Calmodulin Regulate VAMP association with vesicle membrane.
Haro et al. (2003, 2004); Quetglas et al. (2000)
Septin-8 (Sept8) Disassemble VAMP-Synaptophysin complex and possibly help initiate SNARE complex formation.
Ito et al. (2009)
α-Synuclein
Binds to N-terminal end of VAMP and may prepare VAMP for SNARE complex formation and act as a “proofreading” mechanism for SNARE complex formation.
Burré et al. (2010)
CSP (Cysteine String Protein)-α
Binds to monomeric SNAP-25 and prevents SNAP-25 oligomers, and may prepare SNAP-25 for SNARE complex formation.
Sharma et al. (2011)
29
1.2.5.1 Synaptotagmin-1
Synaptotagmin-1 (Syt1) is an integral membrane protein found on synaptic vesicles, in
which its N-terminal end contains a transmembrane domain plus an extended intravesicular
region, and its C-terminal cytoplasmic end contains two C2 domains (C2A and C2B) (see Figure
9; reviewed in Südhof, 2004). The C2A domain binds to three Ca2+ ions and the C2B binds two
Ca2+ ions (Fernandez et al., 2001; Fernandez-Chacon et al., 2002; Ubach et al., 1998) and when
bound to Ca2+, the domains partially embed into phospholipid bilayers (Chapman and Davis,
1998; Fernandez et al., 2001; Fernandez-Chacon et al., 2001). The primary role of Syt1 is a Ca2+-
sensor for fast Ca2+-dependent NT release (Fernandez-Chacon et al., 2001; Geppert et al., 1994).
One of the primary binding partners of Syt1, excluding the membrane, is the SNARE complex
(reviewed in Südhof, 2004). More specifically, it appears that the effects associated with Syt1 are
primarily the result of it interacting with SNAP-25. Synaptotagmin-1 has a high affinity for
SNAP-25 and to a lesser degree, Syntaxin, but exhibits no affinity for VAMP (Schiavo et al.,
1997). Although Syt1 associates with Syntaxin (Kee and Scheller, 1996, Schiavo, et al., 1997),
more recent studies indicate that the primary effects associated with Syt1 are the result of the
Syt1-SNAP-25 interaction and I will focus my discussion only on the functional significance of
this interaction.
Disruption of the formation of the trans-SNARE complex using various techniques such
as knockouts or proteolysis of SNAREs using neurotoxins reduces the Ca2+-dependent evoked
response (Gerona et al., 2000; Lawrence and Dolly, 2002; Stewart et al., 2000; Washbourne et
al., 1999). However, in situations where SNAP-25 is cleaved by BoNT/A, the response can be
recovered by increasing the [Ca2+]o (Gerona et al., 2000; Lawrence and Dolly, 2002;
Washbourne et al., 1999). Therefore, this indicates that the Ca2+-sensor (Syt1) may be linked to
the fusion machinery via SNAP-25 and this could define the link between Ca2+ influx and vesicle
fusion.
In some studies that use proteoliposome fusion assays, the presence of SNAREs promotes
fusion and the addition of Ca2+ and Syt1 enhances the rate of liposome fusion (Bhalla et al.,
2006; Chicka et al., 2008; Lu et al., 2006). Furthermore, as mentioned earlier, it is observed that
vesicle docking is unaffected if SNARE complex assembly is disrupted. Therefore, if the trans-
SNARE complex is not involved in docking, then what is responsible for this process? The
answer may involve the interaction between Syt1 and SNAP-25. There is evidence
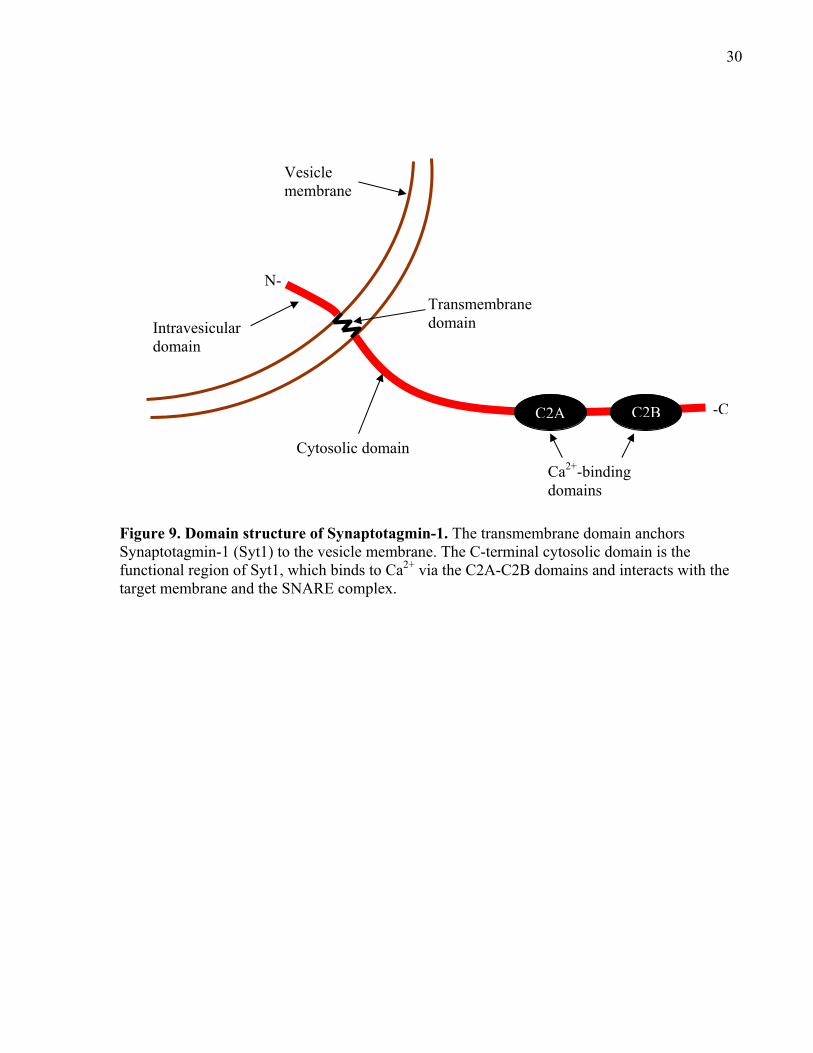
30
Figure 9. Domain structure of Synaptotagmin-1. The transmembrane domain anchors Synaptotagmin-1 (Syt1) to the vesicle membrane. The C-terminal cytosolic domain is the functional region of Syt1, which binds to Ca2+ via the C2A-C2B domains and interacts with the target membrane and the SNARE complex.
C2A C2B
Vesicle membrane
Cytosolic domain
Intravesicular domain
-C
N-
Transmembrane domain
Ca2+-binding domains
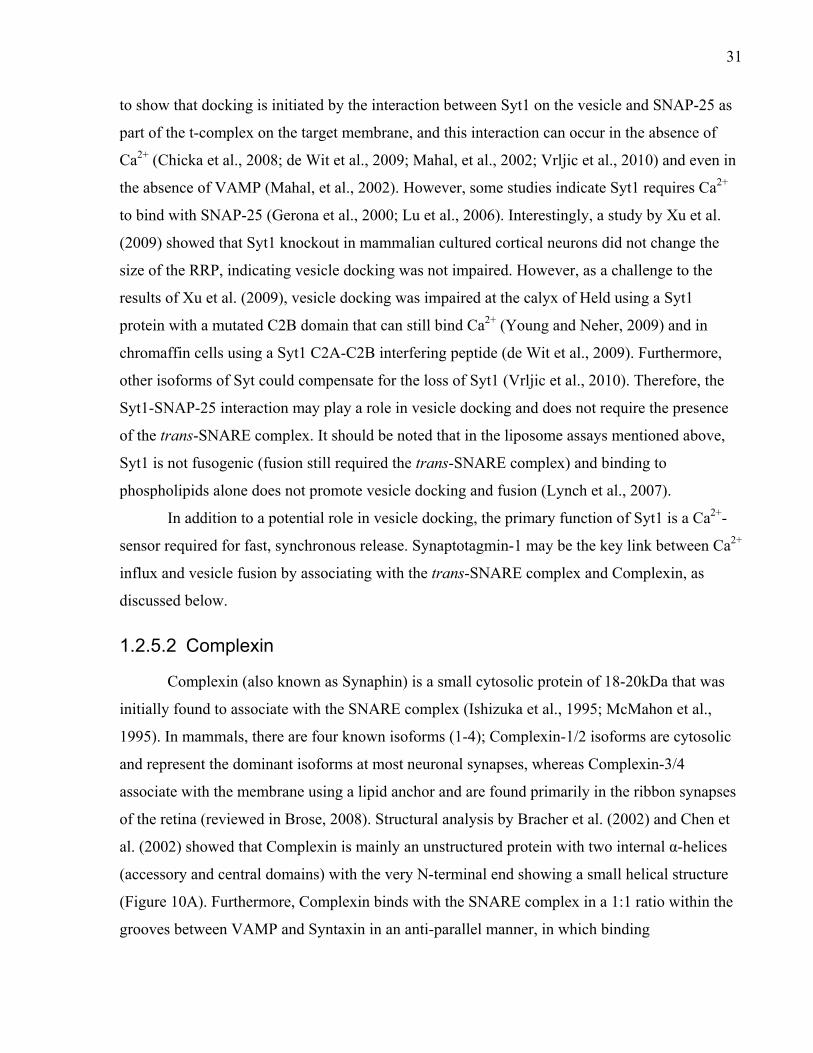
31
to show that docking is initiated by the interaction between Syt1 on the vesicle and SNAP-25 as
part of the t-complex on the target membrane, and this interaction can occur in the absence of
Ca2+ (Chicka et al., 2008; de Wit et al., 2009; Mahal, et al., 2002; Vrljic et al., 2010) and even in
the absence of VAMP (Mahal, et al., 2002). However, some studies indicate Syt1 requires Ca2+
to bind with SNAP-25 (Gerona et al., 2000; Lu et al., 2006). Interestingly, a study by Xu et al.
(2009) showed that Syt1 knockout in mammalian cultured cortical neurons did not change the
size of the RRP, indicating vesicle docking was not impaired. However, as a challenge to the
results of Xu et al. (2009), vesicle docking was impaired at the calyx of Held using a Syt1
protein with a mutated C2B domain that can still bind Ca2+ (Young and Neher, 2009) and in
chromaffin cells using a Syt1 C2A-C2B interfering peptide (de Wit et al., 2009). Furthermore,
other isoforms of Syt could compensate for the loss of Syt1 (Vrljic et al., 2010). Therefore, the
Syt1-SNAP-25 interaction may play a role in vesicle docking and does not require the presence
of the trans-SNARE complex. It should be noted that in the liposome assays mentioned above,
Syt1 is not fusogenic (fusion still required the trans-SNARE complex) and binding to
phospholipids alone does not promote vesicle docking and fusion (Lynch et al., 2007).
In addition to a potential role in vesicle docking, the primary function of Syt1 is a Ca2+-
sensor required for fast, synchronous release. Synaptotagmin-1 may be the key link between Ca2+
influx and vesicle fusion by associating with the trans-SNARE complex and Complexin, as
discussed below.
1.2.5.2 Complexin
Complexin (also known as Synaphin) is a small cytosolic protein of 18-20kDa that was
initially found to associate with the SNARE complex (Ishizuka et al., 1995; McMahon et al.,
1995). In mammals, there are four known isoforms (1-4); Complexin-1/2 isoforms are cytosolic
and represent the dominant isoforms at most neuronal synapses, whereas Complexin-3/4
associate with the membrane using a lipid anchor and are found primarily in the ribbon synapses
of the retina (reviewed in Brose, 2008). Structural analysis by Bracher et al. (2002) and Chen et
al. (2002) showed that Complexin is mainly an unstructured protein with two internal α-helices
(accessory and central domains) with the very N-terminal end showing a small helical structure
(Figure 10A). Furthermore, Complexin binds with the SNARE complex in a 1:1 ratio within the
grooves between VAMP and Syntaxin in an anti-parallel manner, in which binding
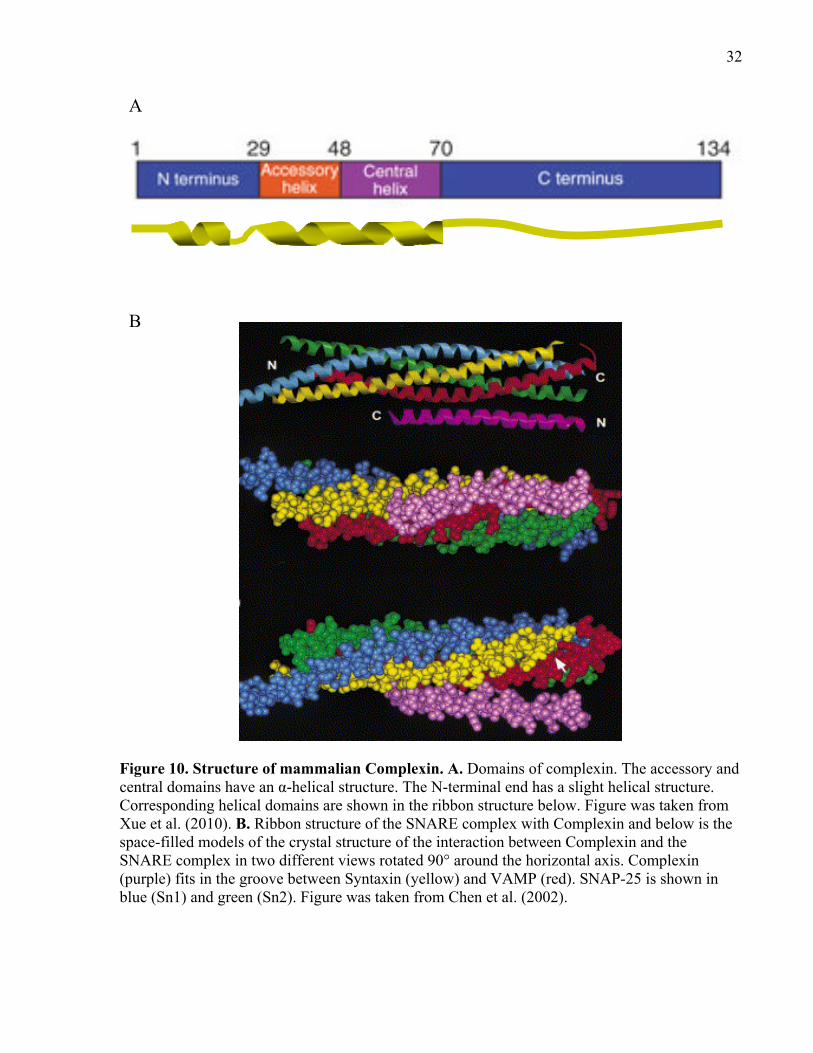
32
Figure 10. Structure of mammalian Complexin. A. Domains of complexin. The accessory and central domains have an α-helical structure. The N-terminal end has a slight helical structure. Corresponding helical domains are shown in the ribbon structure below. Figure was taken from Xue et al. (2010). B. Ribbon structure of the SNARE complex with Complexin and below is the space-filled models of the crystal structure of the interaction between Complexin and the SNARE complex in two different views rotated 90° around the horizontal axis. Complexin (purple) fits in the groove between Syntaxin (yellow) and VAMP (red). SNAP-25 is shown in blue (Sn1) and green (Sn2). Figure was taken from Chen et al. (2002).
A
B
33
occurs closer to the C-terminal end of the SNARE complex and mediated primarily by
Complexin’s central α-helix (Figure 10B). This suggests that Complexin could play a role in
clamping the trans-SNARE complex in a partial zippered state by preventing the zippering of the
C-terminal end. Complexin has a stronger affinity for the ternary SNARE complex and has little
to no affinity for the individual SNARE proteins or binary SNARE complexes (Liu et al., 2006;
Pabst et al., 2002). In addition, work by Liu et al. (2006) showed that Complexin has a higher
affinity for a more zippered SNARE complex as demonstrated using truncated SNAP-25 of
different lengths to mimic different degrees of zippering of the SNARE complex.
An early functional experiment showed that injection of a Complexin-2 antibody in the
Aplysia buccal ganglia increased NT release whereas the injection of full-length recombinant rat
Complexin-2 protein decreased NT release (Ono et al., 1998). These results suggested that
Complexin has an inhibitory (“clamping”) function at the synapse. However, work by Reim et al.
(2001) showed that in cultured hippocampal cells, neither Complexin-1 nor -2 knockouts had an
effect on evoked release and minis; however, a Complexin-1/2 double knockout decreased
evoked release and initial release probability without any effect on minis and the size of the RRP.
The results of this study suggested that Complexin facilitates fast, synchronous Ca2+-dependent
release, opposite to what was found in Aplysia. However, as more experiments were conducted
the role of Complexin became more complex as different results were found in different systems
using various techniques (reviewed in Brose, 2008; Neher, 2010).
There is controversy regarding the role of Complexin at the synapse. Initially, it was
hypothesized that Complexin had only a clamping effect on release; however, further research
revealed that Complexin may have a dual role in release: clamping and activation/priming.
Work by Giraudo et al. (2006, 2008, 2009) using flipped SNAREs expressed on the
surface of HeLa cells (Henrietta Lacks immortal cell line) showed that Complexin acts as a
clamp on trans-SNARE complex assembly such that the complex is in a partially zippered state
and the clamp was removed by introducing Ca2+ and Syt1 in the system. The central α-helix was
essential to bind with the SNARE complex and the clamping effect was mediated by the
accessory α-helix. Therefore, the work by Giraudo et al. showed that Complexin only had a
clamping effect on vesicle fusion.
In support of the work done by Giraudo et al. (2006, 2008, 2009) a study by Tang et al.
(2006) using mammalian cultured cortical neurons showed that a Complexin-Syt1 switch occurs
to drive vesicle fusion. Initially, under resting conditions, the SNAREs interact and form a
34
partially zippered trans-complex. In addition, Complexin binds to the complex and further
zippers it such that it reaches a high-energy “metastable” state that is then clamped by
Complexin (unknown if it is completely zippered or still partially zippered). Then, in response to
Ca2+, Syt1 displaces Complexin completely from the SNARE complex, which removes the
clamp and releases the energy stored in the SNARE complex to trigger vesicle fusion. This
became to be known as the Syt-Switch Hypothesis.
The mechanism proposed by Tang et al. (2006) fits nicely with other studies showing that
Complexin has a clamping effect on release that is overcome by Ca2+ and Syt1 (Giraudo et al.,
2006, 2008, 2009; Yoon et al., 2008). Interestingly, even though Tang et al. showed that
Complexin and Syt1 compete for the SNARE complex, other biochemical studies showed that
Complexin and Syt1 can bind to the SNARE complex simultaneously (Chicka and Chapman,
2009) and Syt1 can even bind to the C-terminal end of Complexin in a 1:1 ratio in a Ca2+-
independent manner, suggesting that Complexin could recruit Syt1 to the SNARE complex
(Tokumaru et al., 2008). Therefore, the interplay between Complexin and Syt1 may be more
complicated than simply a competition for the SNARE complex.
More recently, the view that Complexin has a dual role in exocytosis has gained
momentum. First, a study by Xue et al. (2009) conducted a series of Complexin knockout-rescue
experiments using various constructs of both mammalian and Drosophila Complexin expressed
in both mammalian hippocampal cultured cells and Drosophila preparations. It was observed that
Complexin knockouts in hippocampal cells decreased both evoked release and mini frequency
without changing the RRP size; however, the Drosophila null mutant showed a decrease in
evoked release, but a large increase in mini frequency with a reduction in the RRP size was
observed. Furthermore, the accessory α-helix and to a lesser extent, the C-terminal domain,
exhibited an inhibitory effect whereas the N-terminal domain facilitated release. Finally, the
results revealed that there was a species-dependent effect of Complexin on release in which
Drosophila Complexin has an inhibitory role in release and mammalian Complexin has a
facilitatory role. This suggests that each species-specific Complexin is tailored to function in a
specific manner to reflect the output of a specific type of synapse in a particular system.
In a parallel set of similar studies by Maximov et al. (2009) and Yang et al. (2010) using
Complexin knockdowns in mammalian cultured cells, it was also observed that Complexin has a
dual role in exocytosis. Complexin knockdowns exhibited a decrease in evoked release, increase
in mini frequency, and decrease in RRP size, similar to the Drosophila null mutant as reported
35
by Xue et al. (2009). The accessory α-helix demonstrated a clamping function and the N-terminal
domain promoted vesicle priming and facilitated release, and Ca2+ and Syt1 removed the clamp
and initiated fusion. However, the order in which the two roles of Complexin act on release
differs between the two parallel studies. Maximov et al. suggested that Complexin first clamps
the trans-SNARE complex in a partial zippered state and then Ca2+-Syt1 removes the clamp
followed by Complexin’s N-terminal end facilitating complete zippering of the SNARE complex
to initiate fusion. Conversely, Yang et al. suggested that Complexin first primes vesicles, perhaps
by zippering up the trans-SNARE complex in a metastable state as indicated by Tang et al.
(2006), and then Complexin clamps the primed vesicles such that they are now ready for fusion.
Yang et al. also indicated that the two roles of Complexin are independent of each other and that
Ca2+-Syt1 only removes the clamp to trigger fusion, and the priming effect occurs upstream to
the clamping effect and is not affected by Ca2+-Syt1. Therefore, the work by Yang et al. partially
corroborates the Syt-Switch Hypothesis, in which they agree that Syt1 removes the Complexin
clamp to trigger fusion but disagree with Syt1 affecting the activation (priming) effect of
Complexin.
Finally, current findings by Xue et al. (2010) using both proteoliposome fusion assays
and mammalian cultured cells also showed that Complexin has a dual role in release. Using a
series of mutated Complexins, Xue et al. showed that the N-terminal domain is required for Ca2+-
dependent evoked synchronous release and contributes to the initial release probability, Ca2+-
sensitivity, and RRP size. Xue et al. proposed that Complexin initially clamps the partially
zippered trans-SNARE complex using its accessory α-helix. Then the N-terminal domain
stabilizes the C-terminal end of the SNARE complex in a Ca2+-independent process, which
would prime the vesicle for fusion. In their propose model, however, it is unclear at what point in
time the clamp is removed. They suggested one of three scenarios: (1) The N-terminal domain
displaces the accessory α-helix as it stabilizes the SNARE complex; (2) the clamp is removed by
Ca2+-Syt1; or (3) both (1) and (2) simultaneously. Scenarios (2) and (3) fit with models proposed
by other studies mentioned above; however, scenario (1) fails to address what prevents the
vesicle from undergoing fusion if the clamp is removed by the N-terminal domain before Ca2+
influx. I propose a possible explanation in section 1.2.5.3.
Overall, it appears that Complexin does have a dual role in vesicle fusion. It is widely
accepted that Complexin has a clamping role mediated by its accessory α-helix, and Complexin
works with Syt1 to mediate Ca2+-dependent synchronous release. Unfortunately, there is a
36
disagreement of the facilitatory/activation/priming role of Complexin as to whether or not it
occurs before or after clamping and if it occurs before or during vesicle fusion. This controversy
seems to stem from observations that different results are obtained using different model systems
and techniques. It is possible, as suggested by Neher (2010) and observed by Xue et al. (2009),
that each system evolved priming and fusion mechanisms with slight differences, perhaps by
using different isoforms. However, there is no denying the fact that Complexin is an important
factor that significantly contributes to Ca2+-sensitivity and the initial release probability at the
synapse mediated by its interactions with Syt1 and the trans-SNARE complex.
1.2.5.3 Proposed mechanism of vesicle docking and fusion
Based on the results from the studies mentioned above plus work done by Hui et al.
(2009) and Martens et al. (2007), which examined how Syt1 promotes membrane curvature, and
work done by Dai et al. (2007), which looked at the interaction between Syt1, the SNARE
complex, and phospholipids, I propose the following hypothetical scenario that outlines the steps
involved in docking and Ca2+-dependent vesicle fusion (summarized in Figure 11):
Initially, under resting conditions at the synapse (low Ca2+), the t-complex forms on the
cell plasma membrane and the interaction between Syt1 on the vesicle with SNAP-25 docks the
vesicle to the active zone. The Ca2+-free C2A-C2B domains of Syt1 cannot embed in the plasma
membrane and therefore, vesicle fusion is prevented. At the same time, the close proximity of the
vesicle to the plasma membrane increases the probability of VAMP binding with the t-complex,
and because Syt1 arrests the vesicle in the docked state, the SNAREs will only form a partially
zippered trans-complex, which does not interfere with the Syt1-SNAP-25 interaction because it
takes place at the C-terminal end of SNAP-25. Then, Complexin binds to and clamps the
SNARE complex in a partially zippered, high-energy state without interfering with the Syt1-
SNAP-25 interaction. With the influx of Ca2+ and Ca2+ binding to the C2A and C2B domains,
Syt1 changes conformation and removes the clamping effect of Complexin at the same time the
N-terminal domain of Complexin facilitates complete SNARE zippering. During this time Syt1
embeds in and induces plasma membrane curvature such that the plasma membrane approaches
the vesicle membrane. As a result, the energy provided by SNARE zippering and inducing
membrane curvature triggers lipid mixing between the two membranes and initiates vesicle
fusion.
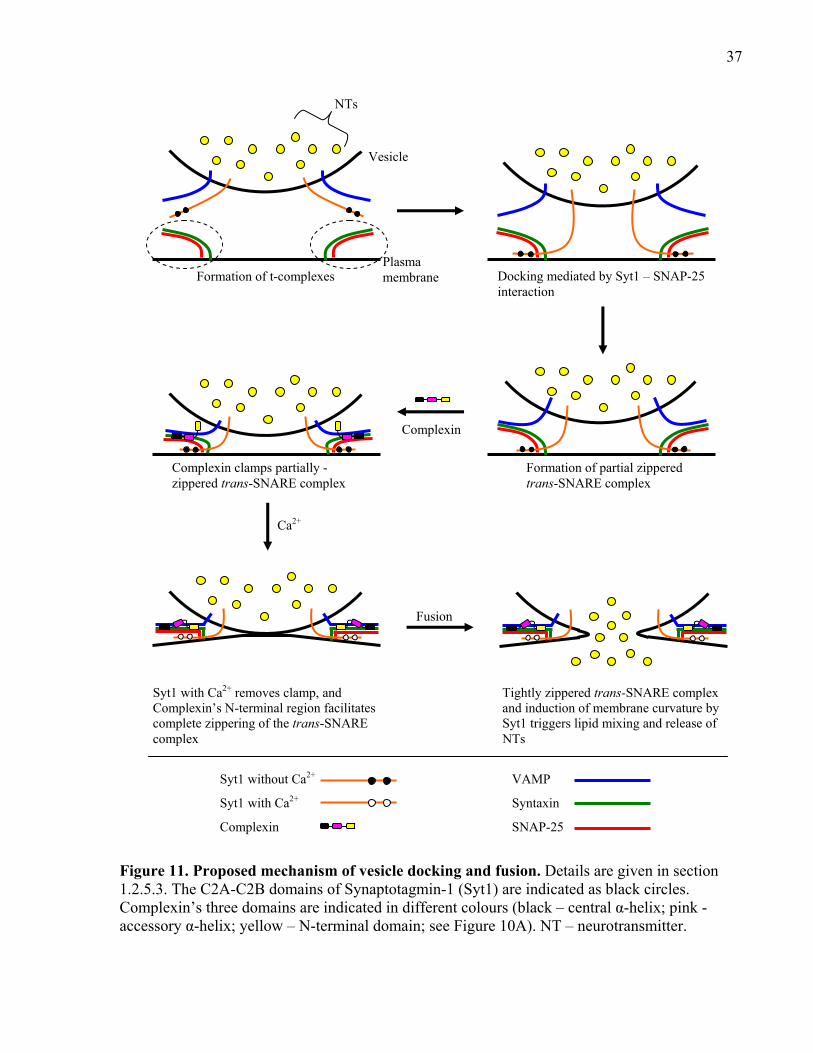
37
Figure 11. Proposed mechanism of vesicle docking and fusion. Details are given in section 1.2.5.3. The C2A-C2B domains of Synaptotagmin-1 (Syt1) are indicated as black circles. Complexin’s three domains are indicated in different colours (black – central α-helix; pink - accessory α-helix; yellow – N-terminal domain; see Figure 10A). NT – neurotransmitter.
Formation of t-complexes Docking mediated by Syt1 – SNAP-25 interaction
Formation of partial zippered trans-SNARE complex
Complexin clamps partially -zippered trans-SNARE complex
Syt1 with Ca2+ removes clamp, and Complexin’s N-terminal region facilitates complete zippering of the trans-SNARE complex
Tightly zippered trans-SNARE complex and induction of membrane curvature by Syt1 triggers lipid mixing and release of NTs
Vesicle
Plasma membrane
NTs
Ca2+
Syt1 without Ca2+
Syt1 with Ca2+
Complexin
VAMP
Syntaxin
SNAP-25
Complexin
Fusion
38
The steps outlined in the model above are hypothetical; the model attempts to account for
some of the observed interactions between Syt1, Complexin, the SNAREs, and phospholipids,
and potentially reflects different mechanisms for docking and fusion and their linkage by Ca2+.
Interestingly, this model suggests that Syt1 may also play a role in determining the zippered state
of the trans-SNARE complex depending on whether or not it embeds in the plasma membrane.
In this thesis I investigate the effects of injecting a Complexin interfering peptide in
crayfish axonal terminals to determine the effects of Complexin on initial release probability.
1.3 Clostridial neurotoxins
The two types of Clostridial neurotoxins used in this thesis are TeNT and BoNTs. These
neurotoxins are produced by bacteria Clostridium tetani and Clostridium botulinum, respectively,
in which there is a single TeNT and seven serotypes of BoNTs (A, B, C1, D, E, F, and G)
(Grumelli et al., 2005; Pellizzari et al., 1999), and are considered the most toxic biological agents
known (median lethal dose is ≤ 1ng per kg body weight) (Gill 1982). Tetanus neurotoxin results
in spastic paralysis of muscles whereas BoNTs cause muscle paralysis and both can be lethal if
not treated promptly (Grumelli et al., 2005). The neurotoxins are initially released from bacteria
as a holotoxin, which is a single-chain polypeptide (150kDa) and subsequently undergoes
proteolytic cleavage (“nicking”) on its surface-exposed loop by bacterial or tissue proteases to
yield a di-chain polypeptide held together by a single disulfide bond (DasGupta 1989, 1994;
Lacy et al, 1998; Weller et al., 1989). The resulting polypeptide consist of a light-chain (50kDa)
and a heavy-chain (100kDa) linked by the disulfide bridge (see Figure 12; Pellizzari et al., 1999).
The catalytic activity of the neurotoxins is mediated solely by the light-chain, whereas the heavy-
chain is responsible for cell binding and internalization (C-terminal end, HC) and translocation of
the light-chain into the cytosol (N-terminal end, HN) (Grumelli et al., 2005; Schiavo et al., 2000).
The Clostridial neurotoxins are a class of metalloendopeptidases because the light-chain
contains a highly conserved zinc (Zn2+) binding domain (His-Glu-X-X-His, where X is any
amino acid) and requires a single Zn2+ ion for catalytic activity, although other divalent ions can
bind to the domain with less affinity, but this reduces neurotoxin activity (Montecucco and
Schiavo, 1993; Schiavo et al., 1992a, b; Shone and Roberts, 1994; Tonello et al., 1997; Wright et
al., 1992). Work done by Eswaramoorthy et al. (2004) showed that two Ca2+ ions bind to BoNTs
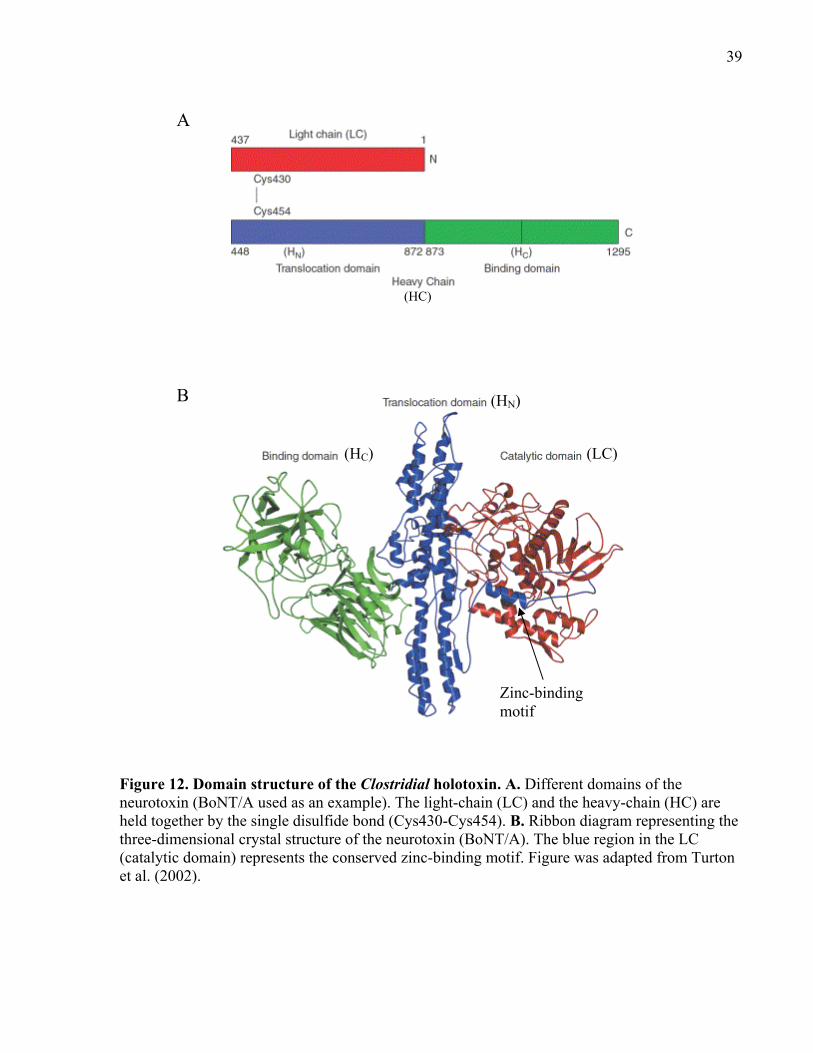
39
Figure 12. Domain structure of the Clostridial holotoxin. A. Different domains of the neurotoxin (BoNT/A used as an example). The light-chain (LC) and the heavy-chain (HC) are held together by the single disulfide bond (Cys430-Cys454). B. Ribbon diagram representing the three-dimensional crystal structure of the neurotoxin (BoNT/A). The blue region in the LC (catalytic domain) represents the conserved zinc-binding motif. Figure was adapted from Turton et al. (2002).
A
B
(HC)
(HN)
(LC)
Zinc-binding motif
(HC)
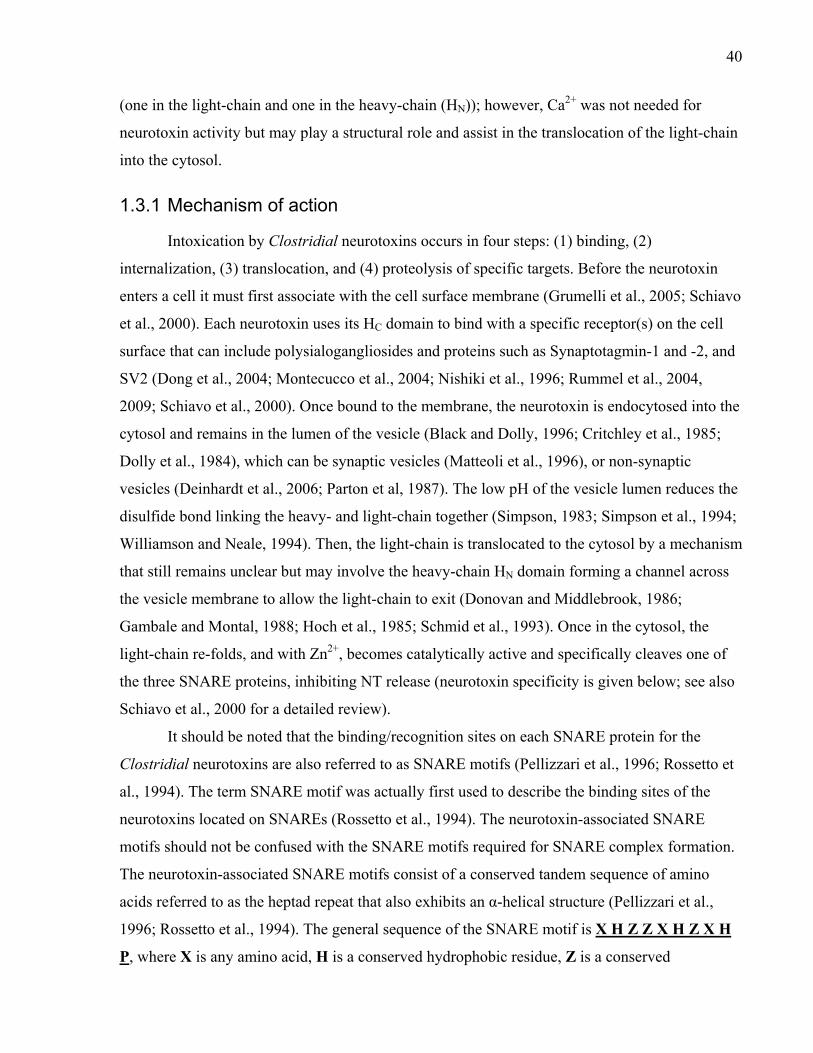
40
(one in the light-chain and one in the heavy-chain (HN)); however, Ca2+ was not needed for
neurotoxin activity but may play a structural role and assist in the translocation of the light-chain
into the cytosol.
1.3.1 Mechanism of action
Intoxication by Clostridial neurotoxins occurs in four steps: (1) binding, (2)
internalization, (3) translocation, and (4) proteolysis of specific targets. Before the neurotoxin
enters a cell it must first associate with the cell surface membrane (Grumelli et al., 2005; Schiavo
et al., 2000). Each neurotoxin uses its HC domain to bind with a specific receptor(s) on the cell
surface that can include polysialogangliosides and proteins such as Synaptotagmin-1 and -2, and
SV2 (Dong et al., 2004; Montecucco et al., 2004; Nishiki et al., 1996; Rummel et al., 2004,
2009; Schiavo et al., 2000). Once bound to the membrane, the neurotoxin is endocytosed into the
cytosol and remains in the lumen of the vesicle (Black and Dolly, 1996; Critchley et al., 1985;
Dolly et al., 1984), which can be synaptic vesicles (Matteoli et al., 1996), or non-synaptic
vesicles (Deinhardt et al., 2006; Parton et al, 1987). The low pH of the vesicle lumen reduces the
disulfide bond linking the heavy- and light-chain together (Simpson, 1983; Simpson et al., 1994;
Williamson and Neale, 1994). Then, the light-chain is translocated to the cytosol by a mechanism
that still remains unclear but may involve the heavy-chain HN domain forming a channel across
the vesicle membrane to allow the light-chain to exit (Donovan and Middlebrook, 1986;
Gambale and Montal, 1988; Hoch et al., 1985; Schmid et al., 1993). Once in the cytosol, the
light-chain re-folds, and with Zn2+, becomes catalytically active and specifically cleaves one of
the three SNARE proteins, inhibiting NT release (neurotoxin specificity is given below; see also
Schiavo et al., 2000 for a detailed review).
It should be noted that the binding/recognition sites on each SNARE protein for the
Clostridial neurotoxins are also referred to as SNARE motifs (Pellizzari et al., 1996; Rossetto et
al., 1994). The term SNARE motif was actually first used to describe the binding sites of the
neurotoxins located on SNAREs (Rossetto et al., 1994). The neurotoxin-associated SNARE
motifs should not be confused with the SNARE motifs required for SNARE complex formation.
The neurotoxin-associated SNARE motifs consist of a conserved tandem sequence of amino
acids referred to as the heptad repeat that also exhibits an α-helical structure (Pellizzari et al.,
1996; Rossetto et al., 1994). The general sequence of the SNARE motif is X H Z Z X H Z X H
P, where X is any amino acid, H is a conserved hydrophobic residue, Z is a conserved
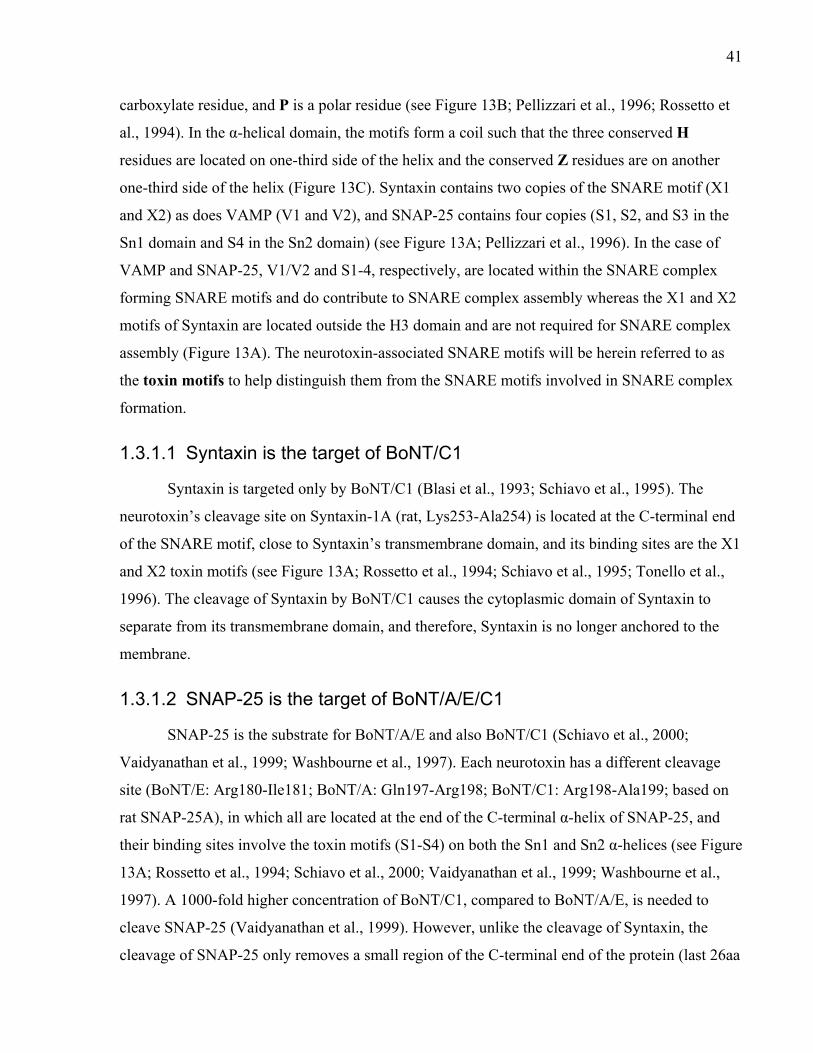
41
carboxylate residue, and P is a polar residue (see Figure 13B; Pellizzari et al., 1996; Rossetto et
al., 1994). In the α-helical domain, the motifs form a coil such that the three conserved H
residues are located on one-third side of the helix and the conserved Z residues are on another
one-third side of the helix (Figure 13C). Syntaxin contains two copies of the SNARE motif (X1
and X2) as does VAMP (V1 and V2), and SNAP-25 contains four copies (S1, S2, and S3 in the
Sn1 domain and S4 in the Sn2 domain) (see Figure 13A; Pellizzari et al., 1996). In the case of
VAMP and SNAP-25, V1/V2 and S1-4, respectively, are located within the SNARE complex
forming SNARE motifs and do contribute to SNARE complex assembly whereas the X1 and X2
motifs of Syntaxin are located outside the H3 domain and are not required for SNARE complex
assembly (Figure 13A). The neurotoxin-associated SNARE motifs will be herein referred to as
the toxin motifs to help distinguish them from the SNARE motifs involved in SNARE complex
formation.
1.3.1.1 Syntaxin is the target of BoNT/C1
Syntaxin is targeted only by BoNT/C1 (Blasi et al., 1993; Schiavo et al., 1995). The
neurotoxin’s cleavage site on Syntaxin-1A (rat, Lys253-Ala254) is located at the C-terminal end
of the SNARE motif, close to Syntaxin’s transmembrane domain, and its binding sites are the X1
and X2 toxin motifs (see Figure 13A; Rossetto et al., 1994; Schiavo et al., 1995; Tonello et al.,
1996). The cleavage of Syntaxin by BoNT/C1 causes the cytoplasmic domain of Syntaxin to
separate from its transmembrane domain, and therefore, Syntaxin is no longer anchored to the
membrane.
1.3.1.2 SNAP-25 is the target of BoNT/A/E/C1
SNAP-25 is the substrate for BoNT/A/E and also BoNT/C1 (Schiavo et al., 2000;
Vaidyanathan et al., 1999; Washbourne et al., 1997). Each neurotoxin has a different cleavage
site (BoNT/E: Arg180-Ile181; BoNT/A: Gln197-Arg198; BoNT/C1: Arg198-Ala199; based on
rat SNAP-25A), in which all are located at the end of the C-terminal α-helix of SNAP-25, and
their binding sites involve the toxin motifs (S1-S4) on both the Sn1 and Sn2 α-helices (see Figure
13A; Rossetto et al., 1994; Schiavo et al., 2000; Vaidyanathan et al., 1999; Washbourne et al.,
1997). A 1000-fold higher concentration of BoNT/C1, compared to BoNT/A/E, is needed to
cleave SNAP-25 (Vaidyanathan et al., 1999). However, unlike the cleavage of Syntaxin, the
cleavage of SNAP-25 only removes a small region of the C-terminal end of the protein (last 26aa
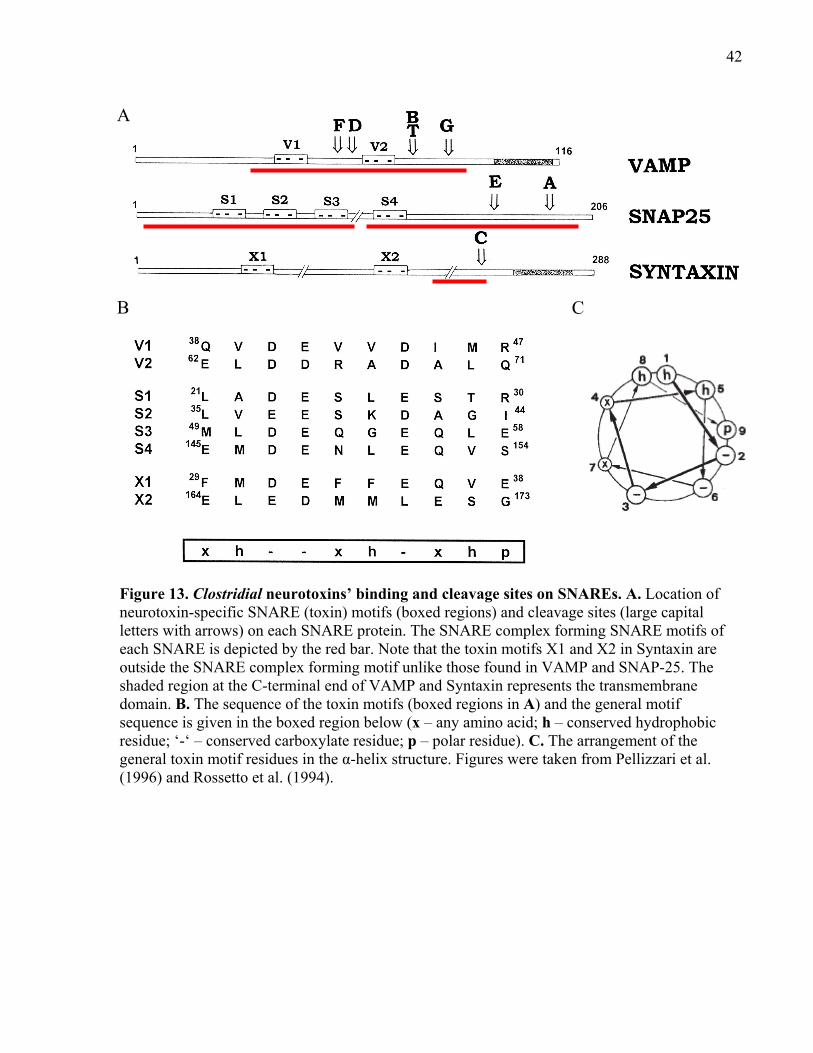
42
Figure 13. Clostridial neurotoxins’ binding and cleavage sites on SNAREs. A. Location of neurotoxin-specific SNARE (toxin) motifs (boxed regions) and cleavage sites (large capital letters with arrows) on each SNARE protein. The SNARE complex forming SNARE motifs of each SNARE is depicted by the red bar. Note that the toxin motifs X1 and X2 in Syntaxin are outside the SNARE complex forming motif unlike those found in VAMP and SNAP-25. The shaded region at the C-terminal end of VAMP and Syntaxin represents the transmembrane domain. B. The sequence of the toxin motifs (boxed regions in A) and the general motif sequence is given in the boxed region below (x – any amino acid; h – conserved hydrophobic residue; ‘-‘ – conserved carboxylate residue; p – polar residue). C. The arrangement of the general toxin motif residues in the α-helix structure. Figures were taken from Pellizzari et al. (1996) and Rossetto et al. (1994).
A
B C
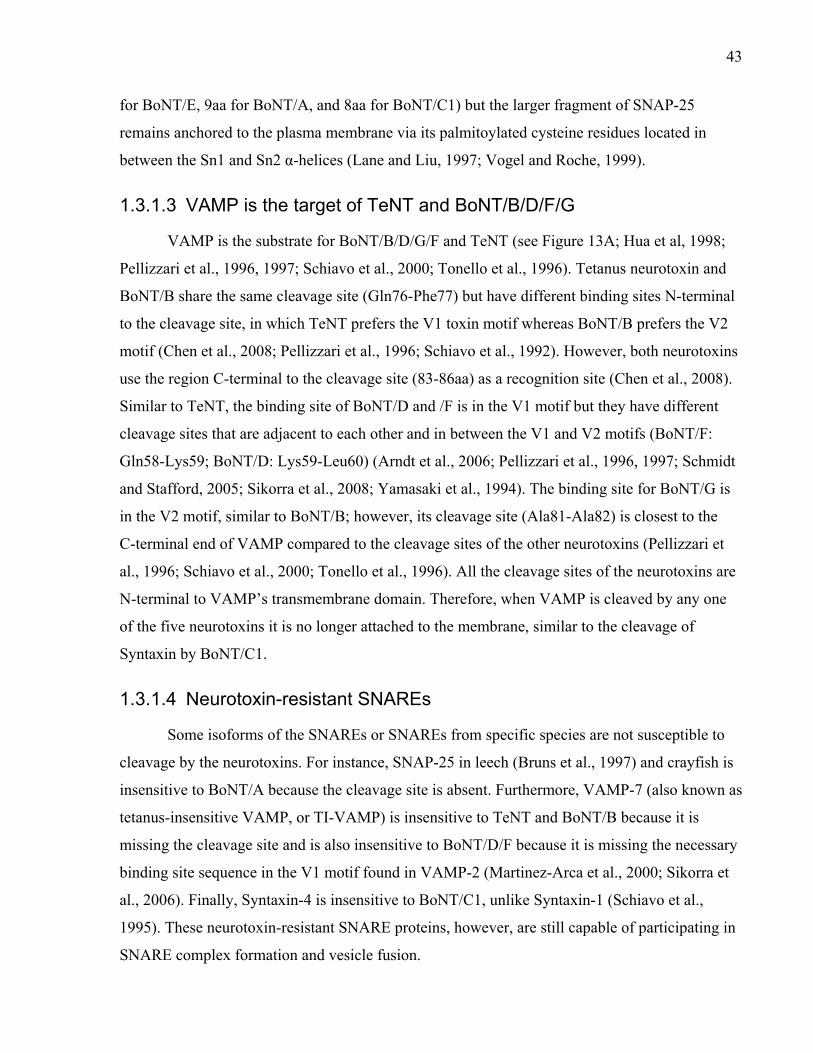
43
for BoNT/E, 9aa for BoNT/A, and 8aa for BoNT/C1) but the larger fragment of SNAP-25
remains anchored to the plasma membrane via its palmitoylated cysteine residues located in
between the Sn1 and Sn2 α-helices (Lane and Liu, 1997; Vogel and Roche, 1999).
1.3.1.3 VAMP is the target of TeNT and BoNT/B/D/F/G
VAMP is the substrate for BoNT/B/D/G/F and TeNT (see Figure 13A; Hua et al, 1998;
Pellizzari et al., 1996, 1997; Schiavo et al., 2000; Tonello et al., 1996). Tetanus neurotoxin and
BoNT/B share the same cleavage site (Gln76-Phe77) but have different binding sites N-terminal
to the cleavage site, in which TeNT prefers the V1 toxin motif whereas BoNT/B prefers the V2
motif (Chen et al., 2008; Pellizzari et al., 1996; Schiavo et al., 1992). However, both neurotoxins
use the region C-terminal to the cleavage site (83-86aa) as a recognition site (Chen et al., 2008).
Similar to TeNT, the binding site of BoNT/D and /F is in the V1 motif but they have different
cleavage sites that are adjacent to each other and in between the V1 and V2 motifs (BoNT/F:
Gln58-Lys59; BoNT/D: Lys59-Leu60) (Arndt et al., 2006; Pellizzari et al., 1996, 1997; Schmidt
and Stafford, 2005; Sikorra et al., 2008; Yamasaki et al., 1994). The binding site for BoNT/G is
in the V2 motif, similar to BoNT/B; however, its cleavage site (Ala81-Ala82) is closest to the
C-terminal end of VAMP compared to the cleavage sites of the other neurotoxins (Pellizzari et
al., 1996; Schiavo et al., 2000; Tonello et al., 1996). All the cleavage sites of the neurotoxins are
N-terminal to VAMP’s transmembrane domain. Therefore, when VAMP is cleaved by any one
of the five neurotoxins it is no longer attached to the membrane, similar to the cleavage of
Syntaxin by BoNT/C1.
1.3.1.4 Neurotoxin-resistant SNAREs
Some isoforms of the SNAREs or SNAREs from specific species are not susceptible to
cleavage by the neurotoxins. For instance, SNAP-25 in leech (Bruns et al., 1997) and crayfish is
insensitive to BoNT/A because the cleavage site is absent. Furthermore, VAMP-7 (also known as
tetanus-insensitive VAMP, or TI-VAMP) is insensitive to TeNT and BoNT/B because it is
missing the cleavage site and is also insensitive to BoNT/D/F because it is missing the necessary
binding site sequence in the V1 motif found in VAMP-2 (Martinez-Arca et al., 2000; Sikorra et
al., 2006). Finally, Syntaxin-4 is insensitive to BoNT/C1, unlike Syntaxin-1 (Schiavo et al.,
1995). These neurotoxin-resistant SNARE proteins, however, are still capable of participating in
SNARE complex formation and vesicle fusion.
44
1.3.2 The effect of Clostridial neurotoxins on exocytosis
It is established that the effects of TeNT and BoNTs on NT release or secretion is the
result of cleavage of the three SNARE proteins, which prevents them from forming a stable
fusogenic trans-SNARE complex (Hayashi et al., 1994, Pellegrini et al., 1995, Rossetta et al.,
1994; see reviews by Grumelli et al., 2005, and Schiavo et al., 2000). A feature of the
neurotoxins, however, is that they cannot cleave the SNARE proteins when the three SNAREs
form the SNARE complex (Hayashi et al., 1994; Pellegrini et al., 1994, 1995; Schiavo et al.,
1997; reviewed by Schiavo et al., 2000). The tight interaction between the three SNARE proteins
shields them from the neurotoxins by occluding the binding and cleavage sites of the neurotoxins
(Figure 14). Therefore, the neurotoxins are only effective when the SNAREs are not tightly
zippered together (Hayashi et al., 1994; Hua et al., 1998; Pellegrini et al., 1994, 1995).
The cleavage product(s) of a given SNARE protein is capable of forming SNARE
complexes with the intact form of the other two SNARE proteins with varying degrees of
stability. Work done by Hayashi et al. (1994) showed that the cleavage products of VAMP
generated by BoNT/D/F/G and TeNT formed SNARE complexes with intact Syntaxin and
SNAP-25 but only the TeNT and BoNT/G cleavage products formed SDS-resistant SNARE
complexes, although work by Pellegrini et al. (1995) indicated that SNARE complexes with the
TeNT cleavage product were partially SDS-resistant. In addition, the BoNT/A, but not the
BoNT/E, cleavage product of SNAP-25 formed a partially SDS-resistant SNARE complex.
Finally, the BoNT/C1 cleavage product of Syntaxin-1A formed non-SDS-resistant SNARE
complexes. Therefore, the cleavage products of SNARE proteins are capable of forming SNARE
complexes providing the SNARE motifs are present and intact, and the region that surrounds the
cleavage sites (and the V1 and V2 motifs of VAMP) may confer SDS-resistance (Hayashi et al.,
1994).
The actions of TeNT and BoNTs are similar, resulting in the inhibition of release. For
example, the VAMP-specific neurotoxins can severely and irreversibly reduce release in various
systems (Hua and Charlton, 1999; Hua et al., 1998; Hunt et al., 1994; Sakaba et al., 2005;
Schiavo et al., 1992). Cleavage of Syntaxin by BoNT/C1 produces a similar or more severe
effect (Blasi et al., 1993; Llinás et al., 1994; Marsal et al., 1997; O’Connor et al., 1997; Sakaba et
al., 2005). The cleavage of SNAP-25 by both BoNT/A/E reduces release (Ferrer-Montiel et al.,
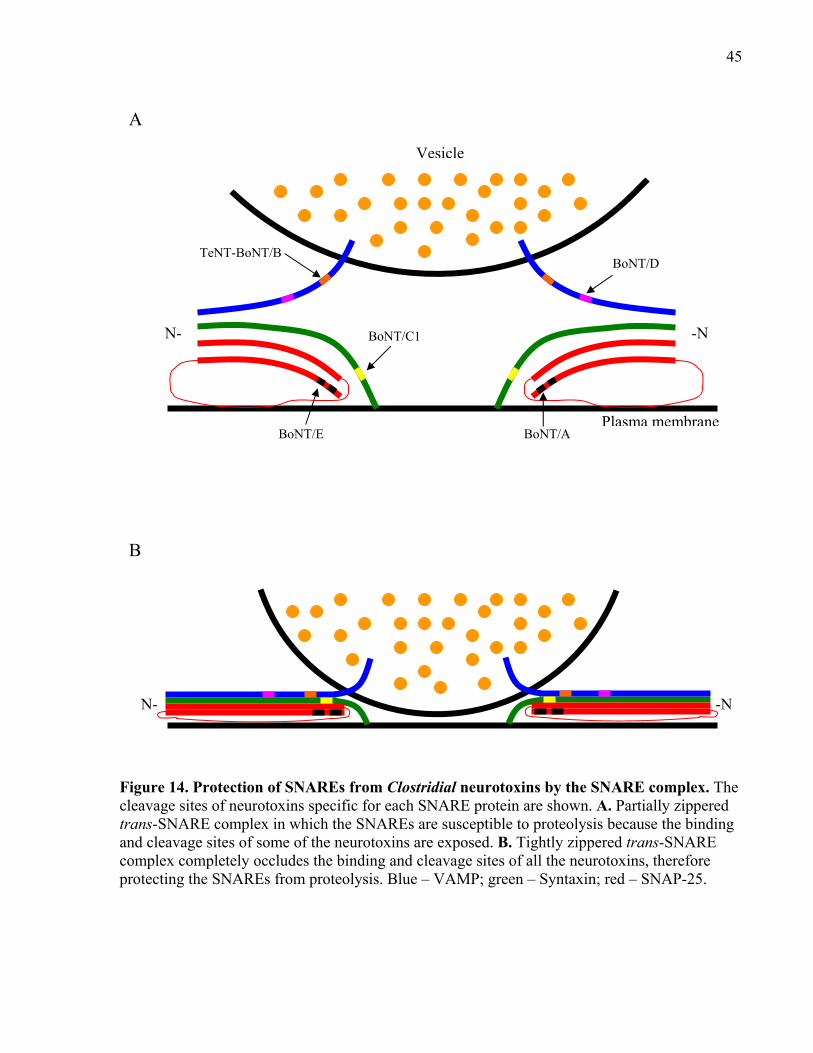
45
Figure 14. Protection of SNAREs from Clostridial neurotoxins by the SNARE complex. The cleavage sites of neurotoxins specific for each SNARE protein are shown. A. Partially zippered trans-SNARE complex in which the SNAREs are susceptible to proteolysis because the binding and cleavage sites of some of the neurotoxins are exposed. B. Tightly zippered trans-SNARE complex completely occludes the binding and cleavage sites of all the neurotoxins, therefore protecting the SNAREs from proteolysis. Blue – VAMP; green – Syntaxin; red – SNAP-25.
A
B
Vesicle
Plasma membrane
N- -N
N- -N
TeNT-BoNT/B BoNT/D
BoNT/C1
BoNT/E BoNT/A
46
1998; Sakaba et al., 2005; Verderio et al., 1999; Washbourne et al., 1999), but the effect can be
reversed to some degree if the [Ca2+]o is elevated (Huang et al., 2001; Lawrence and
Dolly, 2002; Sakaba et al., 2005; Washbourne et al., 1999). Therefore, the specificity of the
neurotoxins to only the SNARE proteins make using them good candidates to study the role of
SNARE proteins in exocytosis and determine the zippered state of the trans-SNARE complex.
1.4 Model systems for the study of synaptic strength
To study presynaptic factors that contribute to differences in synaptic strength requires
the use of an experimental model system that contains synapses with different initial release
probabilities, especially in a system that has a common postsynaptic cell with different synaptic
inputs. This helps to eliminate any postsynaptic factors that may contribute to differences in the
synaptic response. There are a few systems that fit these criteria and can be used to study release
probability.
One example found in the mammalian central nervous system (CNS) is the synaptic
inputs of the granule cell parallel fibres and climbing fibre onto a common Purkinje cell in the
cerebellum. In response to stimulation of the parallel fibres, the Purkinje cell exhibits an initial
small response but facilitates with repeated stimulation; however, the Purkinje cell shows an
initial large response by stimulating the climbing fibre and depresses with repeated stimulation
(Xu-Friedman and Regehr, 2004; reviewed in Atwood and Karunanithi, 2002). Another example
in the mammalian CNS is found in layer 2/4 of the neocortex. In this system, two different
interneurons make synaptic contacts with a single pyramidal cell in which stimulation of one
interneuron initially produces a small synaptic response that can facilitate, and stimulation of the
second interneuron produces a large synaptic response that depresses (Gupta et al., 2000;
reviewed in Atwood and Karunanithi, 2002).
An example of an invertebrate system is the Drosophila type 1b and 1s motor axons that
innervate the larval abdominal ventral longitudinal muscle fibres 6 and 7. The 1b motor axon
compared to the 1s has a lower initial release probability and facilitates with high frequency
stimulation whereas the 1s depresses (Kurdyak et al., 1994; Lnenicka and Keshishian, 2000).
Another invertebrate system that represents a model of synaptic strength is the crayfish phasic
and tonic synapses of the walking leg extensor muscle. In this system, the phasic and tonic motor
neurons can form synapses on the same muscle fibre in which phasic synapses have a very large
initial release probability compared to tonic synapses (100-1000-fold larger initial release
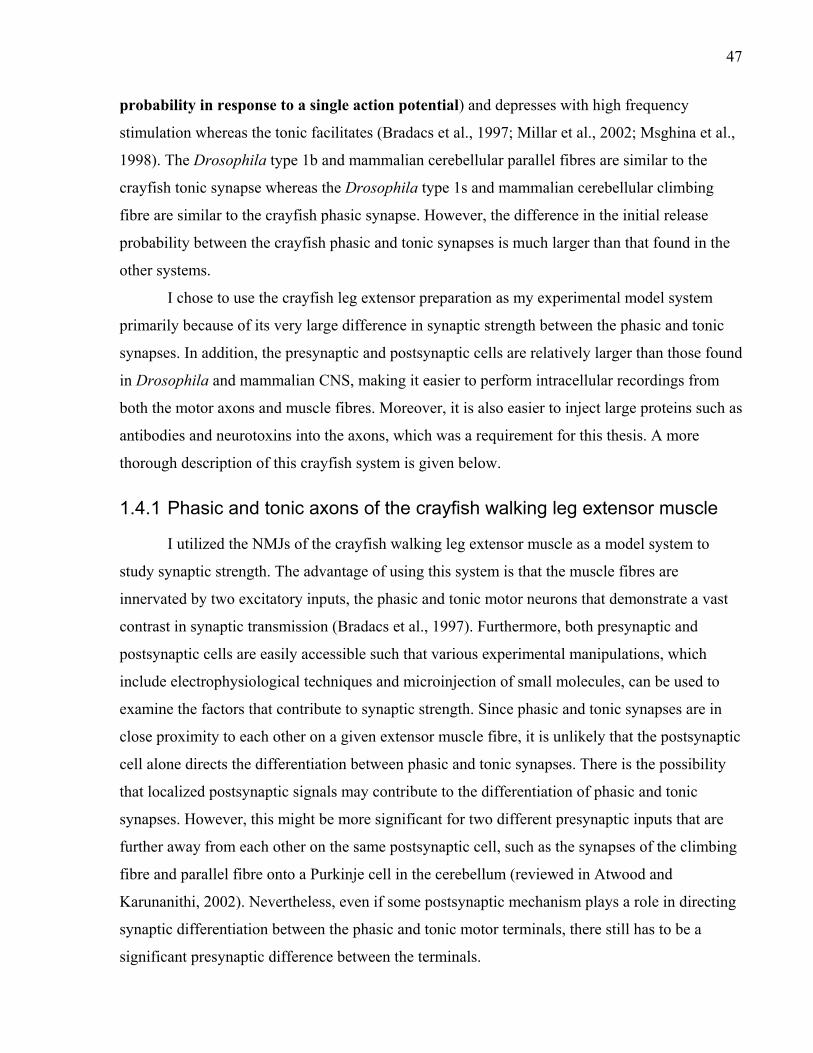
47
probability in response to a single action potential) and depresses with high frequency
stimulation whereas the tonic facilitates (Bradacs et al., 1997; Millar et al., 2002; Msghina et al.,
1998). The Drosophila type 1b and mammalian cerebellular parallel fibres are similar to the
crayfish tonic synapse whereas the Drosophila type 1s and mammalian cerebellular climbing
fibre are similar to the crayfish phasic synapse. However, the difference in the initial release
probability between the crayfish phasic and tonic synapses is much larger than that found in the
other systems.
I chose to use the crayfish leg extensor preparation as my experimental model system
primarily because of its very large difference in synaptic strength between the phasic and tonic
synapses. In addition, the presynaptic and postsynaptic cells are relatively larger than those found
in Drosophila and mammalian CNS, making it easier to perform intracellular recordings from
both the motor axons and muscle fibres. Moreover, it is also easier to inject large proteins such as
antibodies and neurotoxins into the axons, which was a requirement for this thesis. A more
thorough description of this crayfish system is given below.
1.4.1 Phasic and tonic axons of the crayfish walking leg extensor muscle
I utilized the NMJs of the crayfish walking leg extensor muscle as a model system to
study synaptic strength. The advantage of using this system is that the muscle fibres are
innervated by two excitatory inputs, the phasic and tonic motor neurons that demonstrate a vast
contrast in synaptic transmission (Bradacs et al., 1997). Furthermore, both presynaptic and
postsynaptic cells are easily accessible such that various experimental manipulations, which
include electrophysiological techniques and microinjection of small molecules, can be used to
examine the factors that contribute to synaptic strength. Since phasic and tonic synapses are in
close proximity to each other on a given extensor muscle fibre, it is unlikely that the postsynaptic
cell alone directs the differentiation between phasic and tonic synapses. There is the possibility
that localized postsynaptic signals may contribute to the differentiation of phasic and tonic
synapses. However, this might be more significant for two different presynaptic inputs that are
further away from each other on the same postsynaptic cell, such as the synapses of the climbing
fibre and parallel fibre onto a Purkinje cell in the cerebellum (reviewed in Atwood and
Karunanithi, 2002). Nevertheless, even if some postsynaptic mechanism plays a role in directing
synaptic differentiation between the phasic and tonic motor terminals, there still has to be a
significant presynaptic difference between the terminals.
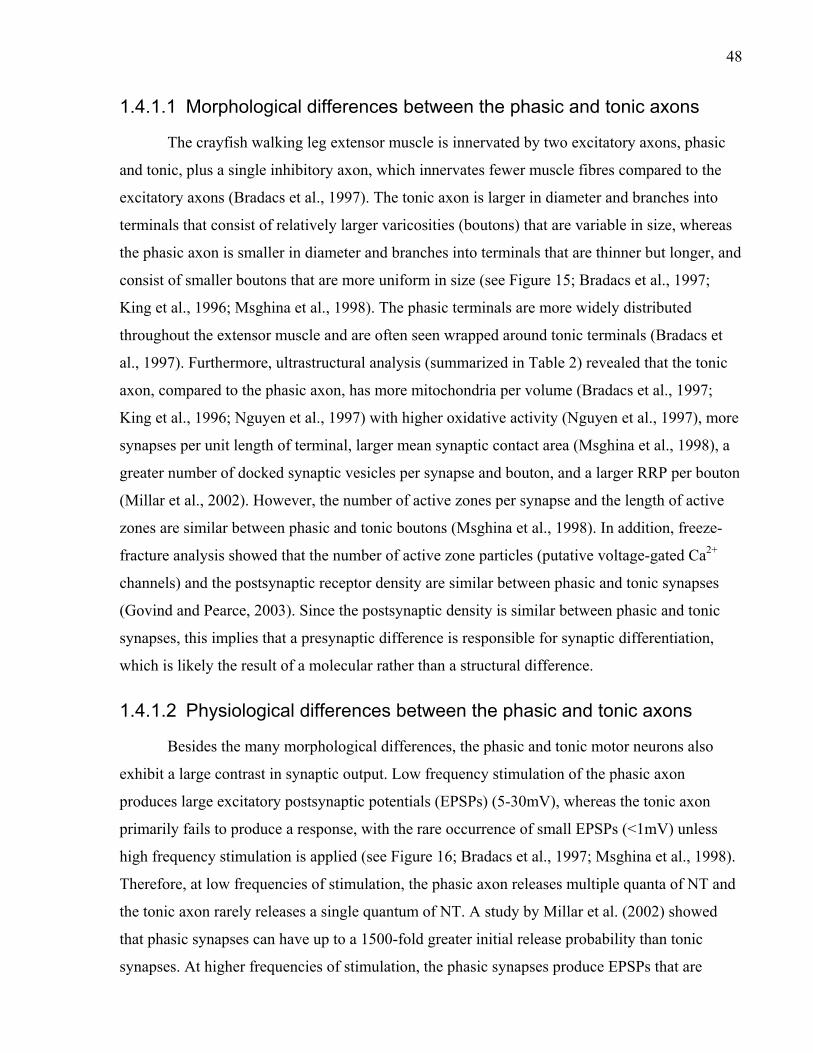
48
1.4.1.1 Morphological differences between the phasic and tonic axons
The crayfish walking leg extensor muscle is innervated by two excitatory axons, phasic
and tonic, plus a single inhibitory axon, which innervates fewer muscle fibres compared to the
excitatory axons (Bradacs et al., 1997). The tonic axon is larger in diameter and branches into
terminals that consist of relatively larger varicosities (boutons) that are variable in size, whereas
the phasic axon is smaller in diameter and branches into terminals that are thinner but longer, and
consist of smaller boutons that are more uniform in size (see Figure 15; Bradacs et al., 1997;
King et al., 1996; Msghina et al., 1998). The phasic terminals are more widely distributed
throughout the extensor muscle and are often seen wrapped around tonic terminals (Bradacs et
al., 1997). Furthermore, ultrastructural analysis (summarized in Table 2) revealed that the tonic
axon, compared to the phasic axon, has more mitochondria per volume (Bradacs et al., 1997;
King et al., 1996; Nguyen et al., 1997) with higher oxidative activity (Nguyen et al., 1997), more
synapses per unit length of terminal, larger mean synaptic contact area (Msghina et al., 1998), a
greater number of docked synaptic vesicles per synapse and bouton, and a larger RRP per bouton
(Millar et al., 2002). However, the number of active zones per synapse and the length of active
zones are similar between phasic and tonic boutons (Msghina et al., 1998). In addition, freeze-
fracture analysis showed that the number of active zone particles (putative voltage-gated Ca2+
channels) and the postsynaptic receptor density are similar between phasic and tonic synapses
(Govind and Pearce, 2003). Since the postsynaptic density is similar between phasic and tonic
synapses, this implies that a presynaptic difference is responsible for synaptic differentiation,
which is likely the result of a molecular rather than a structural difference.
1.4.1.2 Physiological differences between the phasic and tonic axons
Besides the many morphological differences, the phasic and tonic motor neurons also
exhibit a large contrast in synaptic output. Low frequency stimulation of the phasic axon
produces large excitatory postsynaptic potentials (EPSPs) (5-30mV), whereas the tonic axon
primarily fails to produce a response, with the rare occurrence of small EPSPs (<1mV) unless
high frequency stimulation is applied (see Figure 16; Bradacs et al., 1997; Msghina et al., 1998).
Therefore, at low frequencies of stimulation, the phasic axon releases multiple quanta of NT and
the tonic axon rarely releases a single quantum of NT. A study by Millar et al. (2002) showed
that phasic synapses can have up to a 1500-fold greater initial release probability than tonic
synapses. At higher frequencies of stimulation, the phasic synapses produce EPSPs that are
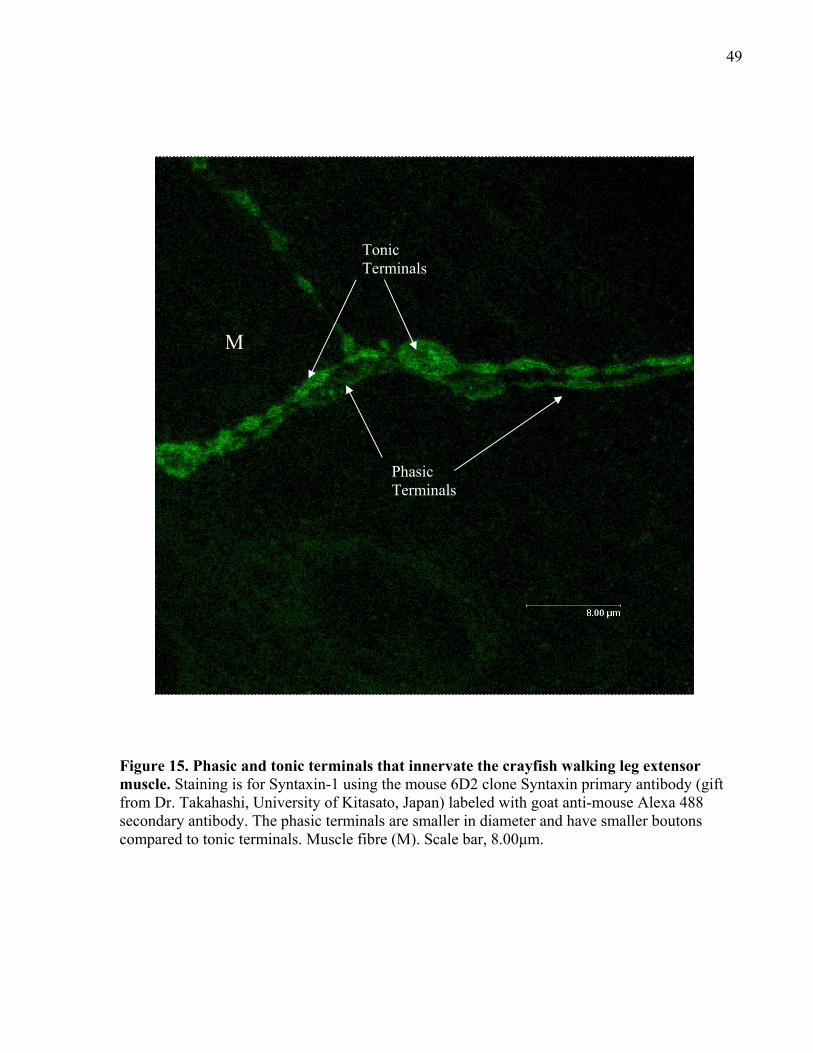
49
Figure 15. Phasic and tonic terminals that innervate the crayfish walking leg extensor muscle. Staining is for Syntaxin-1 using the mouse 6D2 clone Syntaxin primary antibody (gift from Dr. Takahashi, University of Kitasato, Japan) labeled with goat anti-mouse Alexa 488 secondary antibody. The phasic terminals are smaller in diameter and have smaller boutons compared to tonic terminals. Muscle fibre (M). Scale bar, 8.00μm.
Phasic Terminals
Tonic Terminals
M
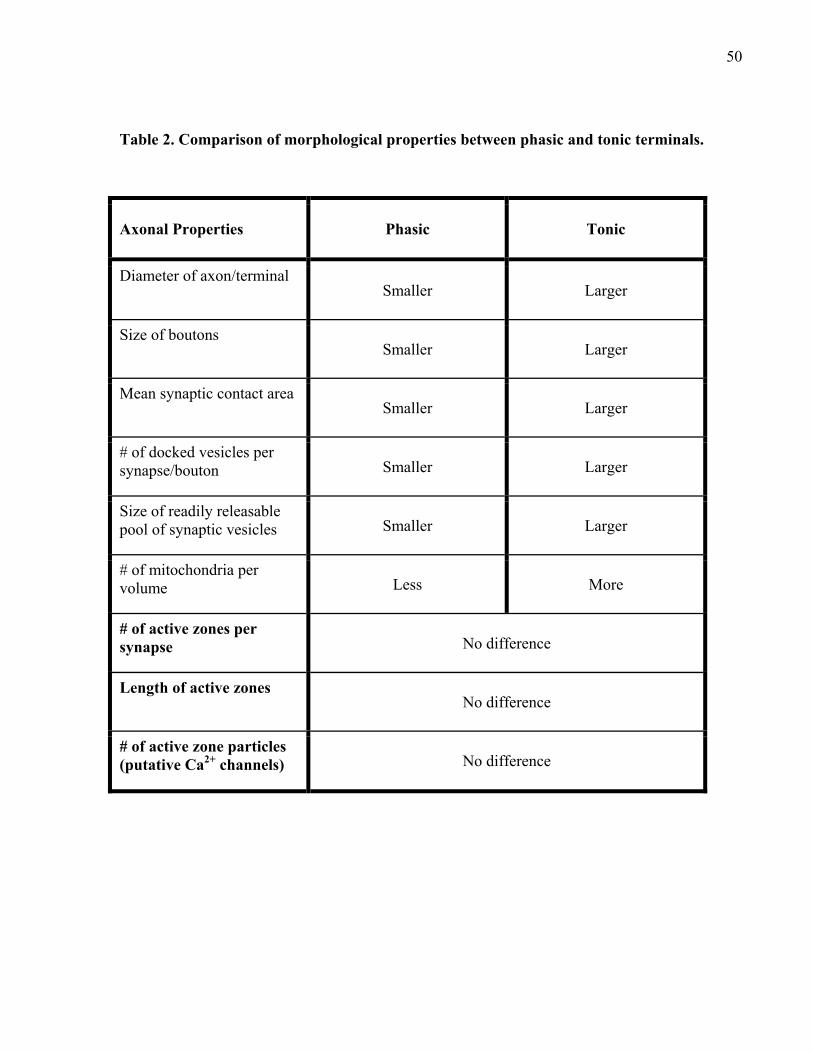
50
Table 2. Comparison of morphological properties between phasic and tonic terminals.
Axonal Properties Phasic Tonic
Diameter of axon/terminal Smaller Larger
Size of boutons Smaller Larger
Mean synaptic contact area Smaller Larger
# of docked vesicles per synapse/bouton Smaller Larger
Size of readily releasable pool of synaptic vesicles Smaller Larger
# of mitochondria per volume Less More
# of active zones per synapse No difference
Length of active zones No difference
# of active zone particles (putative Ca2+ channels) No difference
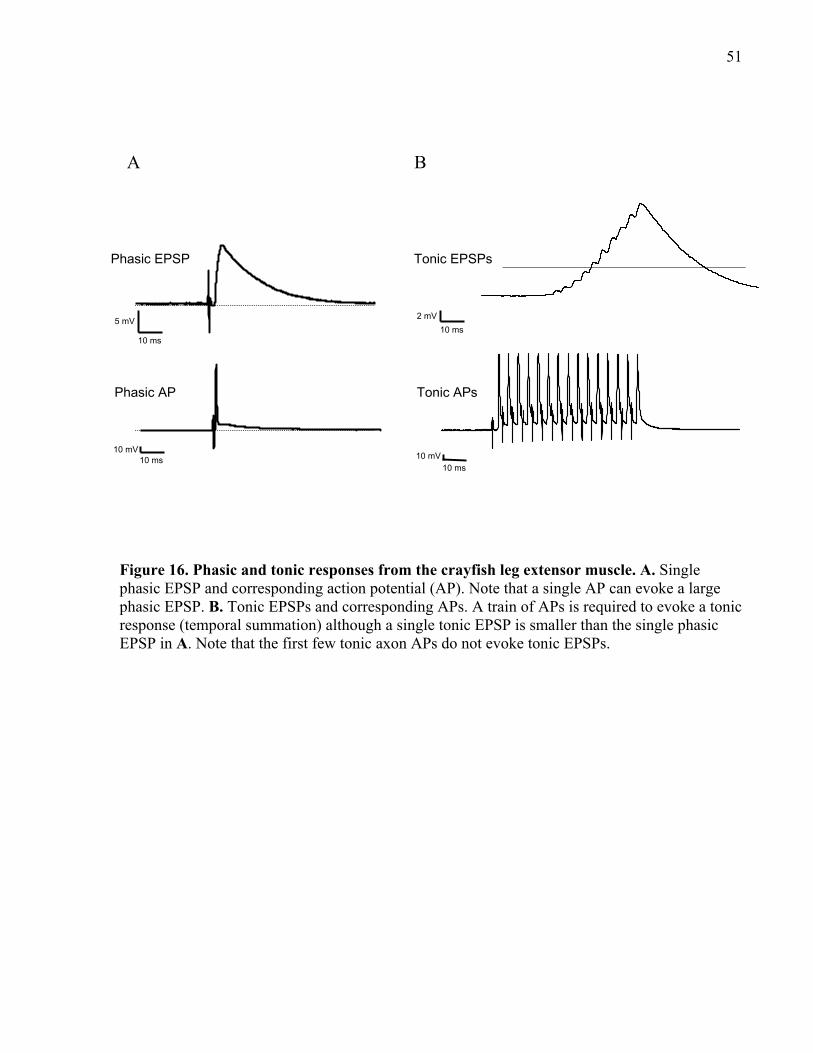
51
Figure 16. Phasic and tonic responses from the crayfish leg extensor muscle. A. Single phasic EPSP and corresponding action potential (AP). Note that a single AP can evoke a large phasic EPSP. B. Tonic EPSPs and corresponding APs. A train of APs is required to evoke a tonic response (temporal summation) although a single tonic EPSP is smaller than the single phasic EPSP in A. Note that the first few tonic axon APs do not evoke tonic EPSPs.
Phasic EPSP
Phasic AP
10 ms
5 mV
10 ms
10 mV
Nerve
10 mV
2.00 ms
1 mV
Muscle
Tonic APs
Tonic EPSPs
2 mV
10 ms
10 ms 10 mV
A B
52
similar in size at lower frequencies, but the tonic synapses produce more noticeable EPSPs with
fewer failures, especially at frequencies ranging from 20Hz to 40Hz (Msghina et al., 1998). In
addition, prolonged high frequency stimulation induces short-term plasticity at the phasic and
tonic synapses. At phasic synapses, there is an initial brief facilitation of the EPSPs followed by
a large depression (Bradacs et al., 1997; Msghina et al., 1998). In contrast, there is facilitation of
EPSPs at tonic synapses; however, the amplitude of a single EPSP in the facilitated response
generated at 10-20Hz does not exceed the amplitude of phasic EPSPs generated at 1Hz (see
Figure 16; Bradacs et al., 1997; Msghina et al., 1998, 1999).
1.4.1.3 What is responsible for synaptic differentiation between the phasic and tonic axons?
Initially, it was believed that the morphological differences could explain the synaptic
differentiation between the phasic and tonic motor neurons. However, studies showed that
structural differences such as the size of the synapse or active zone, the number of active zones
per synapse, or the number of synapses could not fully account for the 1500-fold difference in
the initial release probability between the phasic and tonic synapses (King et al., 1996; Millar et
al., 2002; Msghina et al., 1998). In fact, the size of the synapse and the number of synapses per
unit length of terminal was inversely proportional to the quantal content released by the phasic
and tonic axons (Msghina et al., 1998). Furthermore, Millar et al. (2002) showed that the initial
release probability, rather than the number of docked synaptic vesicles and the size of the RRP,
might be responsible for the difference in the synaptic response at phasic and tonic synapses.
Since synaptic differentiation between the phasic and tonic axons could not be fully
explained by morphological differences, other factors were investigated. One potential candidate
was the rate of oxidative metabolism of mitochondria. A study by Nguyen et al. (1997) showed
that mitochondria in the tonic axon have a higher rate of oxidative metabolism and thus produces
more energy in the form of ATP, compared to mitochondria in the phasic axon. Nguyen et al.
also showed that when oxidative phosphorylation or the electron transport chain of mitochondria
was inhibited, the tonic axon showed depression and the phasic axon showed accelerated
depression when continuously stimulated. Although this result indicates that the difference in the
rate of oxidative metabolism might play a role in short-term plasticity of the phasic and tonic
synapses, in which facilitation at tonic synapses may be due to the presence of more energy, the
result does not explain the difference in quantal content of the phasic and tonic axons at low
53
frequencies of stimulation. Another potential candidate is Ca2+. Calcium ions are important for
triggering the process of exocytosis, and therefore, it is possible that a difference in [Ca2+]
between phasic and tonic boutons can have a significant role in synaptic differentiation.
However, research indicated that the amount of Ca2+ present in phasic and tonic boutons might
not be a significant factor. For instance, Msghina et al. (1999) showed that a difference in Ca2+
entry at active zones or the change in the intracellular [Ca2+] ([Ca2+]i) during stimulation could
not explain the physiological differences between the phasic and tonic synapses. Furthermore,
although studies have shown that the rate of Ca2+ clearance is greater in tonic boutons than in
phasic boutons, this still cannot fully explain synaptic differentiation between the phasic and
tonic motor neurons (Fengler and Lnenicka, 2002; Msghina et al., 1999).
Therefore, the differences in oxidative activity of mitochondria and the [Ca2+] between
the phasic and tonic axons are not sufficient to account for the difference in synaptic strength
between the phasic and tonic synapses. However, a difference in Ca2+ sensitivity between the
phasic and tonic axons might contribute to synaptic differentiation, in which phasic release has a
higher sensitivity to Ca2+ (Msghina et al., 1999). As mentioned previously, the SNARE complex
is known to associate with the Ca2+ sensor, Syt1, and may be clamped in different zippered states
by Complexin. Furthermore, the SNARE complex may be in a dynamic equilibrium between
different degrees of zippering that even includes fully zippered and unzippered states. Therefore,
it is possible that the zippered state of the trans-SNARE complex is responsible for the Ca2+
sensitivity of the synapse by determining the probability of vesicle fusion in the RRP.
1.5 Outline of thesis
1.5.1 Objectives
The primary aim of this thesis is to determine the molecular mechanisms that regulate
synaptic strength. The focus is directed on how the trans-SNARE complex and Complexin
contribute to release probability. The objectives are as follows:
1. Determine the zippered state of the trans-SNARE complex associated with vesicles in the
RRP at the crayfish phasic and tonic synapses under resting conditions.
2. Determine if the zippered state of the trans-SNARE complex is different between the
phasic and tonic synapses.
54
3. Find a correlation between the zippered state of the trans-SNARE complex and release
probability.
4. Determine if Complexin has a clamping or priming or a dual role in vesicle fusion and
how it affects release probability.
1.5.2 Hypotheses
To determine the role that the trans-SNARE complex and Complexin play in initial release
probability, I used various physiological and molecular techniques that include the use of
neurotoxins, antibodies, and interfering peptides to test the following hypotheses:
1. The trans-SNARE complex associated with vesicles in the RRP can exist in a partially
zippered state under resting conditions.
2. Greater zippering of the trans-SNARE complex confers a larger initial release
probability.
3. A more tightly zippered trans-SNARE complex exists at the phasic versus tonic
synapses.
4. Complexin promotes greater release at phasic synapses compared to tonic synapses.
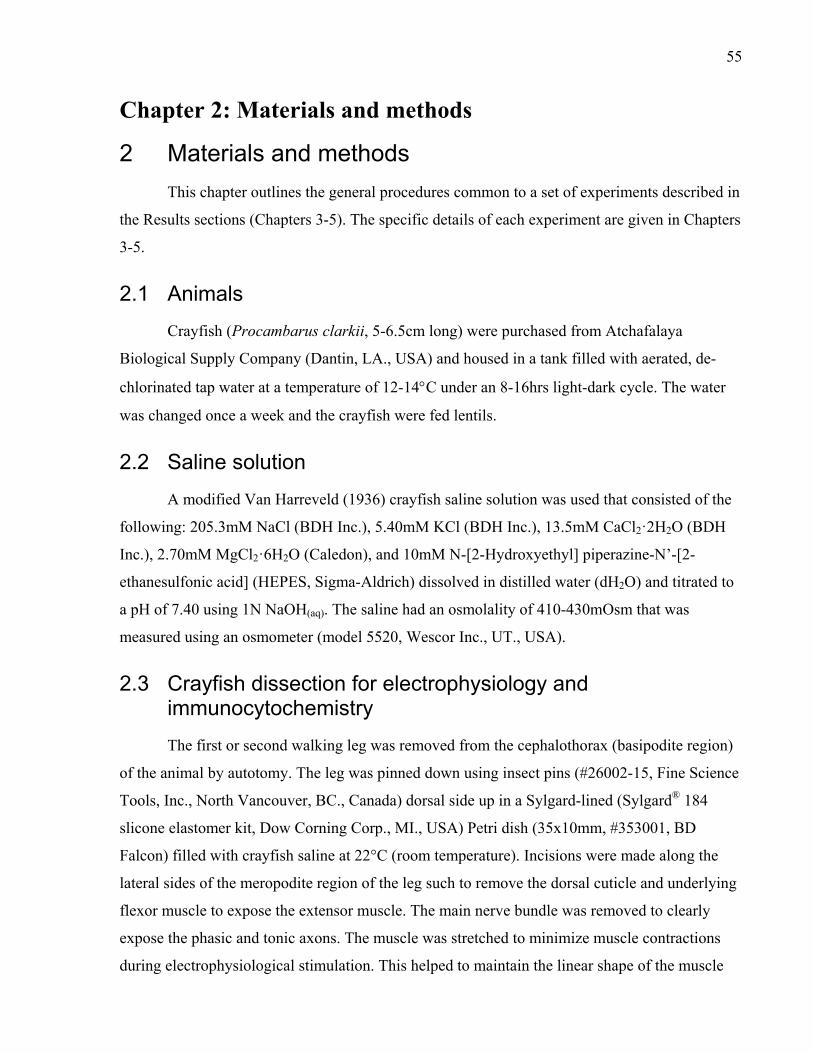
55
Chapter 2: Materials and methods
2 Materials and methods
This chapter outlines the general procedures common to a set of experiments described in
the Results sections (Chapters 3-5). The specific details of each experiment are given in Chapters
3-5.
2.1 Animals
Crayfish (Procambarus clarkii, 5-6.5cm long) were purchased from Atchafalaya
Biological Supply Company (Dantin, LA., USA) and housed in a tank filled with aerated, de-
chlorinated tap water at a temperature of 12-14C under an 8-16hrs light-dark cycle. The water
was changed once a week and the crayfish were fed lentils.
2.2 Saline solution
A modified Van Harreveld (1936) crayfish saline solution was used that consisted of the
following: 205.3mM NaCl (BDH Inc.), 5.40mM KCl (BDH Inc.), 13.5mM CaCl2·2H2O (BDH
Inc.), 2.70mM MgCl2·6H2O (Caledon), and 10mM N-[2-Hydroxyethyl] piperazine-N’-[2-
ethanesulfonic acid] (HEPES, Sigma-Aldrich) dissolved in distilled water (dH2O) and titrated to
a pH of 7.40 using 1N NaOH(aq). The saline had an osmolality of 410-430mOsm that was
measured using an osmometer (model 5520, Wescor Inc., UT., USA).
2.3 Crayfish dissection for electrophysiology and immunocytochemistry
The first or second walking leg was removed from the cephalothorax (basipodite region)
of the animal by autotomy. The leg was pinned down using insect pins (#26002-15, Fine Science
Tools, Inc., North Vancouver, BC., Canada) dorsal side up in a Sylgard-lined (Sylgard® 184
slicone elastomer kit, Dow Corning Corp., MI., USA) Petri dish (35x10mm, #353001, BD
Falcon) filled with crayfish saline at 22°C (room temperature). Incisions were made along the
lateral sides of the meropodite region of the leg such to remove the dorsal cuticle and underlying
flexor muscle to expose the extensor muscle. The main nerve bundle was removed to clearly
expose the phasic and tonic axons. The muscle was stretched to minimize muscle contractions
during electrophysiological stimulation. This helped to maintain the linear shape of the muscle
56
fibres and axons during fixation for immunocytochemistry, which would otherwise contort due
to shrinkage caused by fixation. Images of a dissected crayfish leg are given in Figure 17.
2.4 Immunocytochemistry Dissected crayfish legs were pinned down in Sylgard-lined Petri dishes and the leg
extensor muscle was stretched to minimize contortion and shrinkage during fixation for
immunocytochemistry. The muscle was first fixed in phosphate buffer solution (PBS; 10mM
Na2HPO4 (Sigma-Aldrich), 2mM KH2PO4 (Sigma-Aldrich), 140mM NaCl, and 2.7mM KCl, pH
7.40, 410-430mOsm) with 4% (v/v) paraformaldehyde (Polysciences, Inc., Warrington, PA.,
USA) for 1hr at 22°C. Then, each preparation was transferred to individual wells of a 24-well
multi-well tissue culture plate (#353047, BD Falcon) and washed in PBS three times at 5min
intervals on an orbital shaker. The preparations were then placed in blocking solution (PBS
containing 0.1% (v/v) Triton X-100 (Sigma-Aldrich) and 1% (w/v) bovine serum albumin (BSA;
Sigma-Aldrich)) for 1.5hrs at 22C on an orbital shaker such to minimize non-specific binding of
the primary antibody that can contribute to background staining. Then, the preparations were
placed in the primary antibody solution (PBS containing 0.1% (v/v) Triton X-100 and the
primary antibody of interest) overnight at 4C on an orbital shaker. The next day, the
preparations were washed in PBS containing 0.1% (v/v) Triton X-100 five times at 5min
intervals at 22C on an orbital shaker. Then, the preparations were placed in the secondary
antibody solution (PBS containing 0.1% (v/v) Triton X-100 and the fluorescently-labeled
secondary antibody of interest) for 2.5hrs at 22C on an orbital shaker. Finally, the preparations
were washed in PBS containing 0.1% (v/v) Triton X-100 five times at 5min intervals followed
by PBS alone three times at 5min intervals at 22C on an orbital shaker. The preparations were
stored in PBS at 4C until ready for imaging. For long-term storage, PBS with 0.02% (v/v)
sodium azide (Sigma-Aldrich) was used as a preservative to prevent bacterial/fungal growth.
This had no effect on fluorescence imaging.
57
Figure 17. Dissected crayfish walking leg. A. Crayfish Procambarus clarkii. B. and C. Dissected walking leg pinned down in a Sylgard-lined Petri dish with the extensor muscle in the meropodite region exposed (white arrows). The insect pin encircled in red was used to stretch the extensor muscle.
A.
B. C.
2nd walking leg
1st walking leg
58
2.4.1 Laser confocal imaging
Fluorescently-labeled preparations were pinned down on Sylgard-lined Petri dishes
containing PBS and imaged using a Leica TCS SL laser confocal microscope with software
version 2.61, build 1537 181.031 (Leica Microsystems, Wetzlar, Germany). Images were taken
using a 40x (N.A. 0.80) or a 63x (N.A. 1.20) water immersion objective and 488nm and/or
543nm laser excitation wavelengths.
2.5 SDS-PAGE and Western blotting
2.5.1 Solutions
The solutions in Table 3 were used to perform sodium dodecyl sulphate polyacrylamide
gel electrophoresis (SDS-PAGE) and Western blotting.
2.5.2 Protein extraction
The complete ventral nerve cords from 20 crayfish (2-2.5in long) were placed in an
autoclaved 1.5mL microfuge tube, which was placed on dry ice to keep the nerve cords frozen.
An autoclaved plastic pestle (KT749510, VWR Canada) was used to homogenize the frozen
sample until a homogenous white solution was formed. Then, 700-1000µL of the
homogenization buffer was added to the sample and mixed thoroughly using the plastic pestle
and then the sample was allowed to sit at room temperature (22°C) for 10min. The tube was then
placed in a boiling water bath for 10min and then centrifuged at 12000xg (Centrifuge 5810R,
Eppendorf) for 10min at 4°C. The clear supernatant containing the extracted proteins was
removed and placed in another autoclaved 1.5mL microfuge tube and stored at -20°C until ready
for use. In some experiments, proteins were also extracted from 40 leg extensor muscles using
the same procedure above.
The concentration of the nerve cord protein sample was at least 1.0µg/µL, which was
measured using the Protein dotMETRIC Assay kit (G-Biosciences, Maryland Heights, MO.,
USA). The leg extensor muscle protein sample was approximately 6µg/µL.
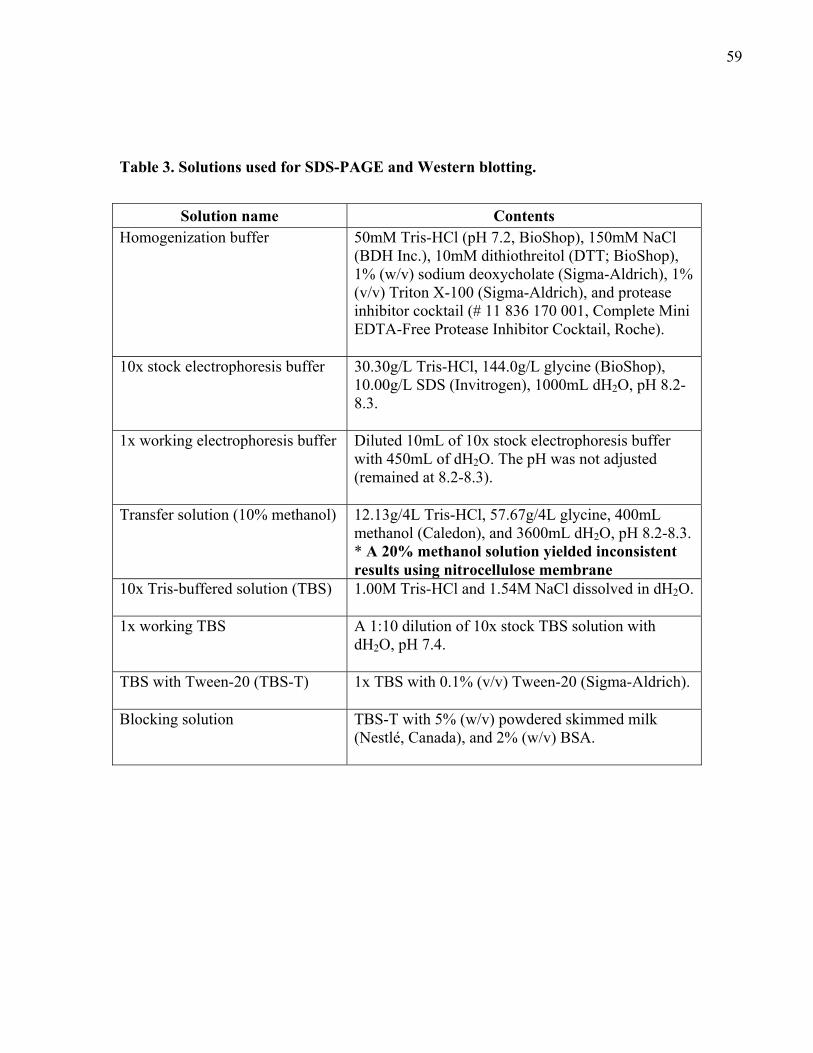
59
Table 3. Solutions used for SDS-PAGE and Western blotting.
Solution name Contents
Homogenization buffer 50mM Tris-HCl (pH 7.2, BioShop), 150mM NaCl (BDH Inc.), 10mM dithiothreitol (DTT; BioShop), 1% (w/v) sodium deoxycholate (Sigma-Aldrich), 1% (v/v) Triton X-100 (Sigma-Aldrich), and protease inhibitor cocktail (# 11 836 170 001, Complete Mini EDTA-Free Protease Inhibitor Cocktail, Roche).
10x stock electrophoresis buffer 30.30g/L Tris-HCl, 144.0g/L glycine (BioShop), 10.00g/L SDS (Invitrogen), 1000mL dH2O, pH 8.2-8.3.
1x working electrophoresis buffer Diluted 10mL of 10x stock electrophoresis buffer with 450mL of dH2O. The pH was not adjusted (remained at 8.2-8.3).
Transfer solution (10% methanol) 12.13g/4L Tris-HCl, 57.67g/4L glycine, 400mL methanol (Caledon), and 3600mL dH2O, pH 8.2-8.3. * A 20% methanol solution yielded inconsistent results using nitrocellulose membrane
10x Tris-buffered solution (TBS) 1.00M Tris-HCl and 1.54M NaCl dissolved in dH2O.
1x working TBS A 1:10 dilution of 10x stock TBS solution with dH2O, pH 7.4.
TBS with Tween-20 (TBS-T) 1x TBS with 0.1% (v/v) Tween-20 (Sigma-Aldrich).
Blocking solution TBS-T with 5% (w/v) powdered skimmed milk (Nestlé, Canada), and 2% (w/v) BSA.

60
2.5.3 SDS-PAGE
Protein samples were first mixed with 3x SDS sample buffer (#B77098, New England
BioLabs) at a 1:3 dilution factor and then placed in a boiling water bath for 10min. Next, a
protease inhibitor cocktail (#11 836 170 001, Complete Mini EDTA-Free Protease Inhibitor
Cocktail, Roche) was added using a 1:7 dilution factor and DTT was added such that its final
concentration was 10mM. The resulting protein solution was then added to the denaturing
electrophoresis gel (#161-1104, Ready Gel precast polyacrylamide 4-15% Tris-HCl gradient gel,
Bio-Rad) that was housed in an electrophoresis unit (Mini PROTEAN III, Bio-Rad). A ready-
made broad-range prestained protein marker (#SM0671, PageRuler Prestained Protein Ladder,
Fermentas) was loaded on the gel to serve as a reference to determine the approximate molecular
weight of protein bands. Gel lanes that contained no protein sample were loaded with a mixture
of 3x SDS sample buffer and distilled water (1:3) to prevent protein samples in neighboring lanes
from drifting into the “empty” lanes. Electrophoresis was carried out in the denaturing 1x
electrophoresis buffer initially at a constant voltage of 75V for 10min followed by a constant
voltage of 130V for 75min (or when the dye front reached the bottom of the gel) at 22°C. Power
was supplied by a Bio-Rad Power Pac 1000 unit. An image of the Bio-Rad Mini PROTEAN III
electrophoresis unit is given in Figure 18.
2.5.4 Transfer
Proteins were transferred from the gel to a nitrocellulose membrane using the Bio-Rad
Mini-PROTEAN III Trans-Blot system. Starting on the cathode (black) side of the transfer
cassette, the unit was assembled in the following order: A filter pad, 2 thin pieces of filter paper,
the gel, the nitrocellulose membrane (Biotrace NT, 0.2um pore size, Pall Corp.), 2 thin pieces of
filter paper, and a filter pad. The assembled transfer cassette was loaded into the transfer unit
containing an ice block and transfer solution was added until the transfer cassette was completely
immersed. Transfer was carried out at a constant current of 355mA for 85min at 4ºC (cold room).
The assembled unit was placed on top of a stir plate which was used to spin a stir bar inside the
unit to circulate the transfer solution. An image of the Bio-Rad Mini PROTEAN III Trans-Blot
system is given in Figure 19.
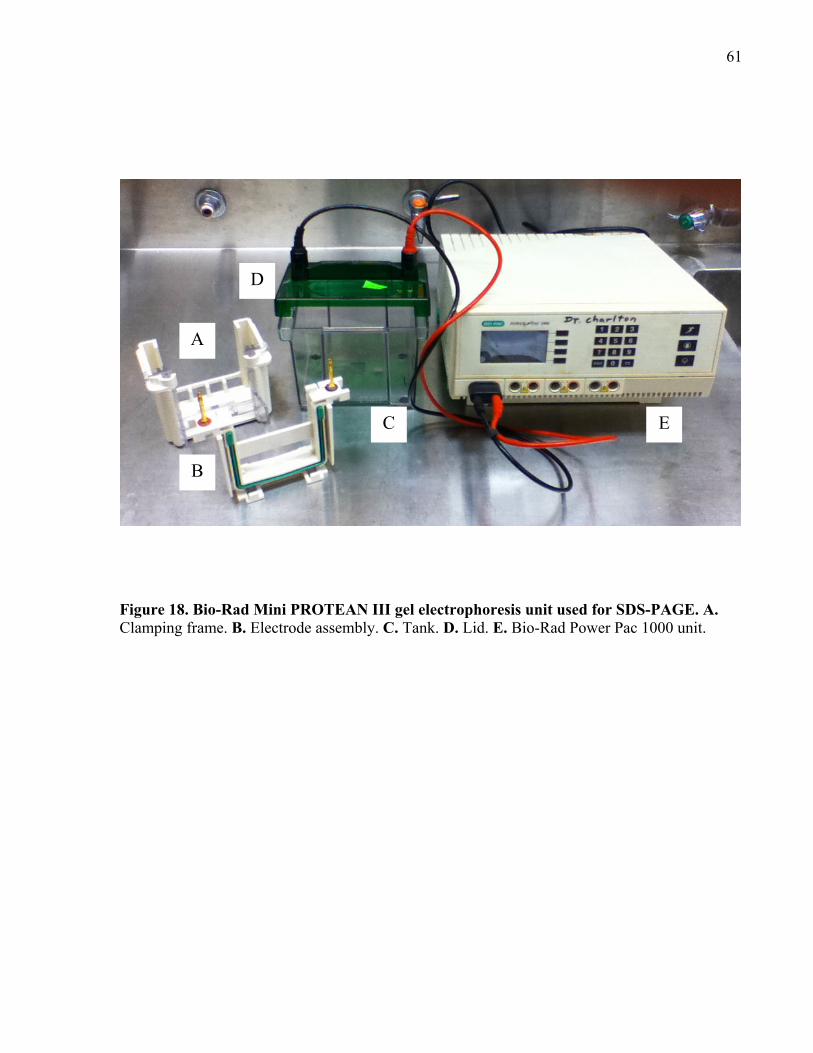
61
Figure 18. Bio-Rad Mini PROTEAN III gel electrophoresis unit used for SDS-PAGE. A. Clamping frame. B. Electrode assembly. C. Tank. D. Lid. E. Bio-Rad Power Pac 1000 unit.
A
B
C
D
E
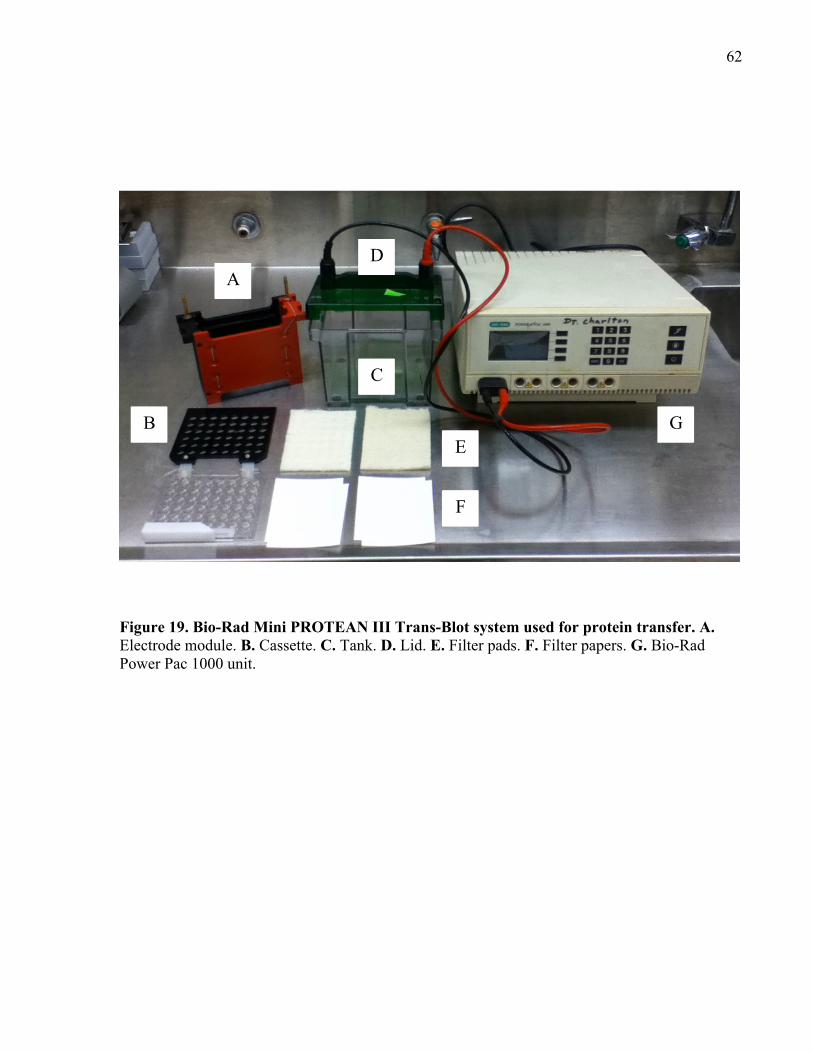
62
Figure 19. Bio-Rad Mini PROTEAN III Trans-Blot system used for protein transfer. A. Electrode module. B. Cassette. C. Tank. D. Lid. E. Filter pads. F. Filter papers. G. Bio-Rad Power Pac 1000 unit.
B
A
C
D
E
F
G
63
2.5.5 Immunostaining
Following protein transfer, the nitrocellulose membrane was placed in blocking solution
for 2.5hrs at 22°C on an orbital shaker. Then, the membrane was placed in the primary antibody
solution (blocking solution with the primary antibody of interest) overnight at 4°C on an orbital
shaker. The next day, the membrane was washed in TBS-T five times at 5min intervals (22°C)
and then placed in the secondary antibody solution (blocking solution with the horseradish
peroxidase (HRP)-tagged secondary antibody of interest) for 2.5hrs at 22°C on an orbital shaker.
After, the membrane was washed in TBS-T five times at 5min intervals followed by TBS two
times at 5min intervals.
To detect protein bands, a chemiluminescence solution (NEL105001EA, Western
Lightning Plus-ECl, Perkin Elmer, MA., USA) was added to the membrane, which is used by
HRP to induce a chemical reaction that emits photons to help visualize any protein bands that are
associated with the primary-secondary antibody complex. The chemiluminescence solution was
applied for 1-3min and then washed off with dH2O. The membrane was then imaged using the
Kodak Image Station 2000R (Mandel Scientific Company Inc., Guelph, ON., Canada).
2.6 Electrophysiology
Phasic and tonic EPSPs were recorded intracellularly from muscle fibres of the crayfish
leg extensor muscle as a measure of NT release.
2.6.1 Setup for intracellular recordings
Intracellular recordings were taken from a muscle fibre located in the mid-lateral region
of the crayfish walking leg extensor muscle using a sharp glass microelectrode filled with 3M
KCl (10-15M in crayfish saline) (see Figure 20). The sharp glass microelectrode was placed in
an electrode holder, which was connected to a 1x head stage that was attached to an amplifier
(Intracellular Electrometer IE-201, Warner Instruments Corp., CT., USA). The analog signal
from the amplifier was sent to a low pass 4-pole Bessel filter (LPF202, Warner Instruments
Corp., CT., USA), which filtered out high frequency noise (set at 2kHz) and amplified the signal
by 10-fold. Then, the signal was sent to an analog-to-digital converter (Axon Digidata 1200,
Molecular Devices. Inc., CA., USA (previously Axon Instruments, Inc.)), which digitized the
analog signal at 10kHz. The digital signal was acquired using the WINWCP software (ver. 4.0.8,
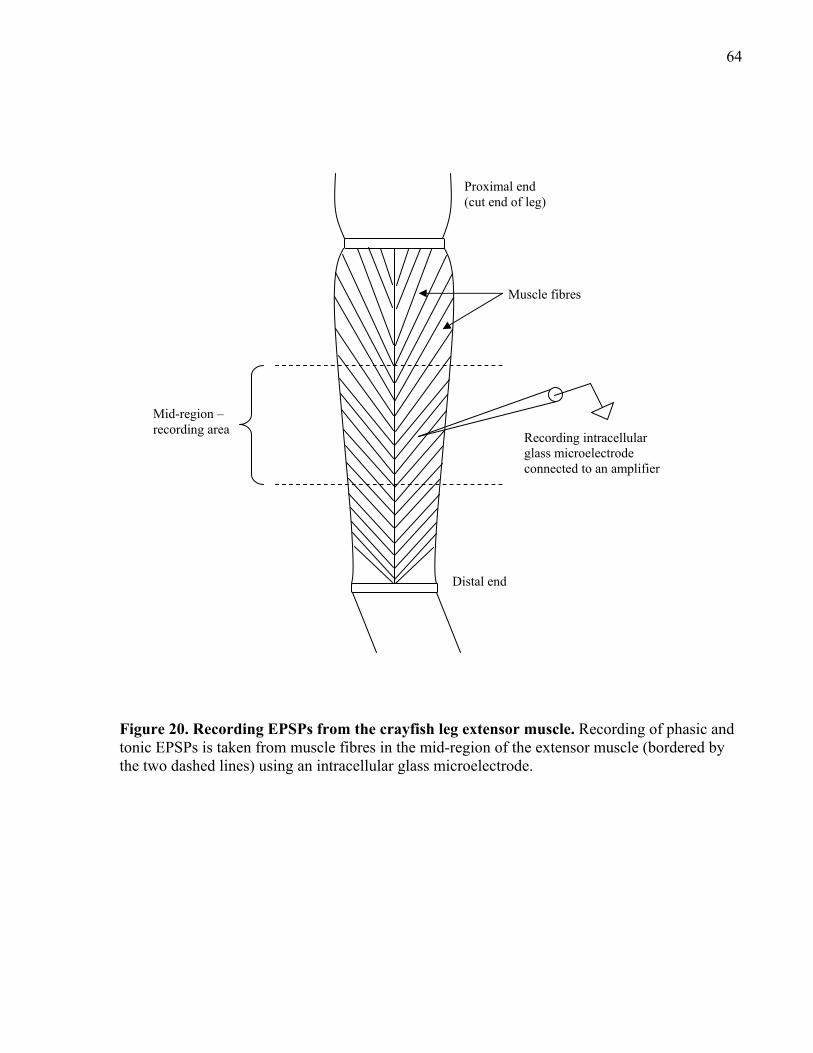
64
Figure 20. Recording EPSPs from the crayfish leg extensor muscle. Recording of phasic and tonic EPSPs is taken from muscle fibres in the mid-region of the extensor muscle (bordered by the two dashed lines) using an intracellular glass microelectrode.
Mid-region – recording area
Proximal end (cut end of leg)
Distal end
Recording intracellular glass microelectrode connected to an amplifier
Muscle fibres
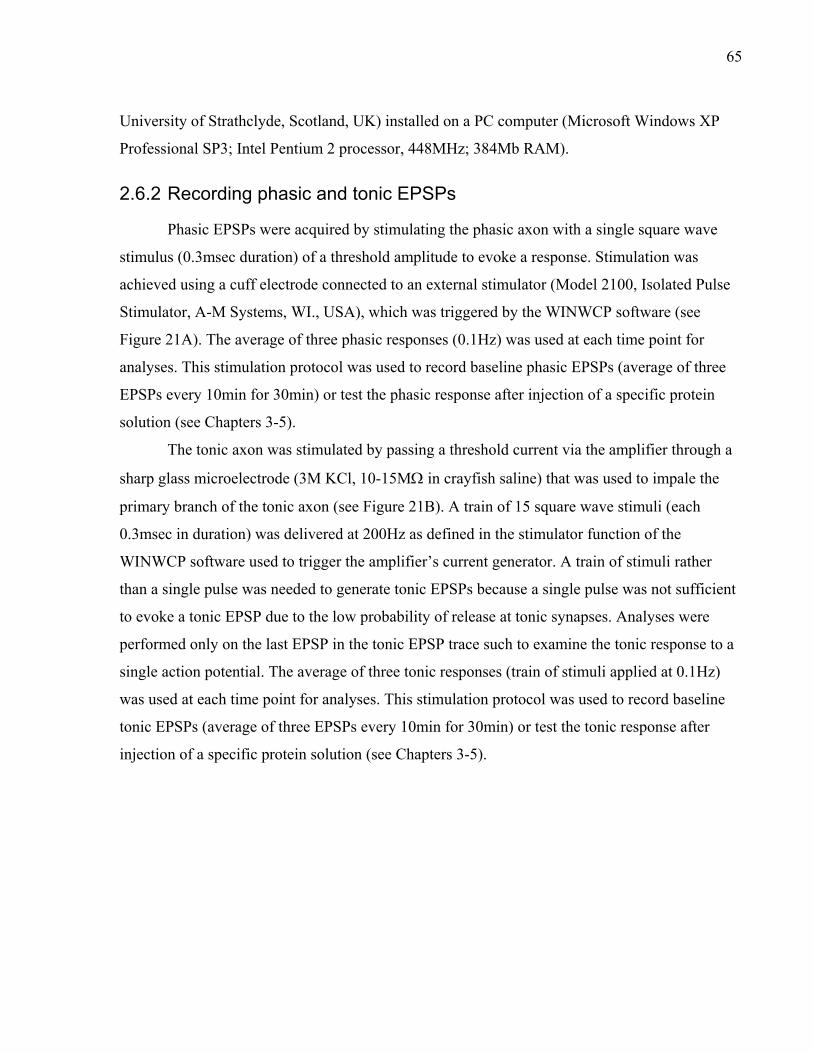
65
University of Strathclyde, Scotland, UK) installed on a PC computer (Microsoft Windows XP
Professional SP3; Intel Pentium 2 processor, 448MHz; 384Mb RAM).
2.6.2 Recording phasic and tonic EPSPs
Phasic EPSPs were acquired by stimulating the phasic axon with a single square wave
stimulus (0.3msec duration) of a threshold amplitude to evoke a response. Stimulation was
achieved using a cuff electrode connected to an external stimulator (Model 2100, Isolated Pulse
Stimulator, A-M Systems, WI., USA), which was triggered by the WINWCP software (see
Figure 21A). The average of three phasic responses (0.1Hz) was used at each time point for
analyses. This stimulation protocol was used to record baseline phasic EPSPs (average of three
EPSPs every 10min for 30min) or test the phasic response after injection of a specific protein
solution (see Chapters 3-5).
The tonic axon was stimulated by passing a threshold current via the amplifier through a
sharp glass microelectrode (3M KCl, 10-15M in crayfish saline) that was used to impale the
primary branch of the tonic axon (see Figure 21B). A train of 15 square wave stimuli (each
0.3msec in duration) was delivered at 200Hz as defined in the stimulator function of the
WINWCP software used to trigger the amplifier’s current generator. A train of stimuli rather
than a single pulse was needed to generate tonic EPSPs because a single pulse was not sufficient
to evoke a tonic EPSP due to the low probability of release at tonic synapses. Analyses were
performed only on the last EPSP in the tonic EPSP trace such to examine the tonic response to a
single action potential. The average of three tonic responses (train of stimuli applied at 0.1Hz)
was used at each time point for analyses. This stimulation protocol was used to record baseline
tonic EPSPs (average of three EPSPs every 10min for 30min) or test the tonic response after
injection of a specific protein solution (see Chapters 3-5).
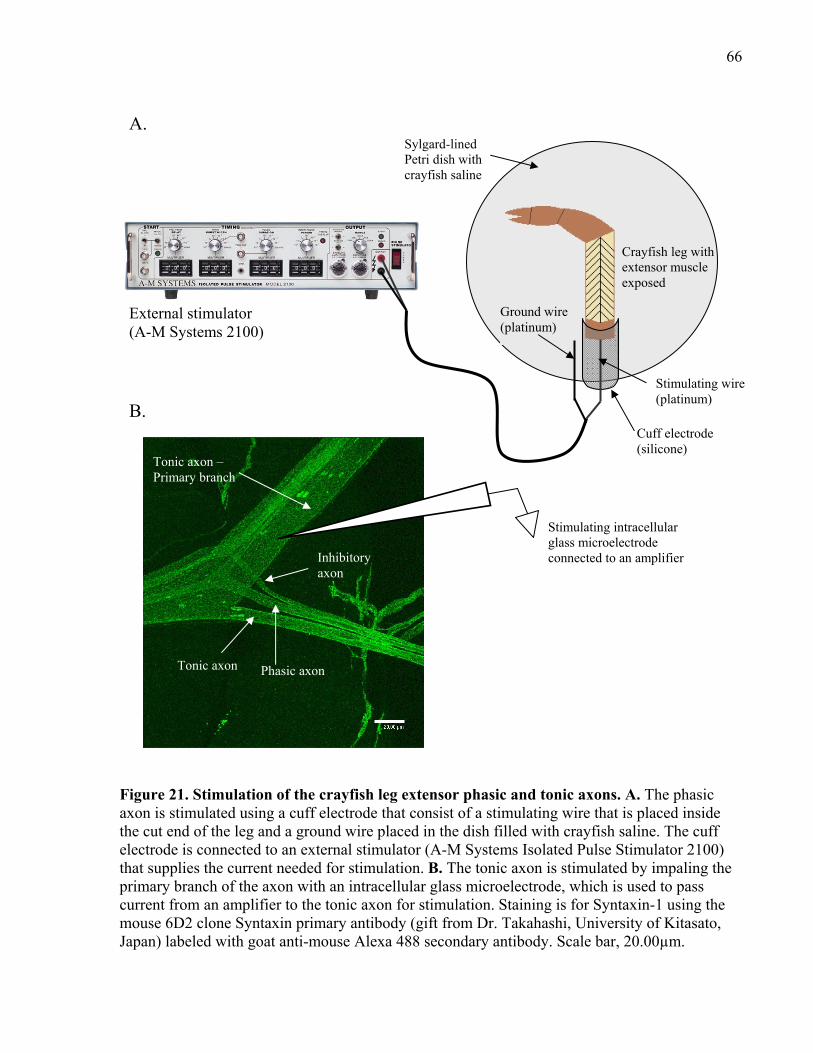
66
Figure 21. Stimulation of the crayfish leg extensor phasic and tonic axons. A. The phasic axon is stimulated using a cuff electrode that consist of a stimulating wire that is placed inside the cut end of the leg and a ground wire placed in the dish filled with crayfish saline. The cuff electrode is connected to an external stimulator (A-M Systems Isolated Pulse Stimulator 2100) that supplies the current needed for stimulation. B. The tonic axon is stimulated by impaling the primary branch of the axon with an intracellular glass microelectrode, which is used to pass current from an amplifier to the tonic axon for stimulation. Staining is for Syntaxin-1 using the mouse 6D2 clone Syntaxin primary antibody (gift from Dr. Takahashi, University of Kitasato, Japan) labeled with goat anti-mouse Alexa 488 secondary antibody. Scale bar, 20.00µm.
External stimulator (A-M Systems 2100)
Ground wire (platinum)
Stimulating wire (platinum)
Cuff electrode (silicone)
Sylgard-lined Petri dish with crayfish saline
Crayfish leg with extensor muscle exposed
Tonic axon
Inhibitory axon
Phasic axon
Tonic axon – Primary branch
Stimulating intracellular glass microelectrode connected to an amplifier
A.
B.
67
2.6.3 Pressure injection
Following baseline recordings, a specific protein solution (see Chapters 3-5) was
pressure-injected into the phasic or tonic axon using a sharp glass microelectrode, in which the
tip was filled with a specific protein solution and then backfilled with 100mM KCl (40-55M in
crayfish saline). A Picospritzer II microinjector (General Valve Corporation, NJ., USA) was used
for pressure injection, in which the pressure was 25-40psi and the duration of each air pulse was
5-30msec applied every 10sec for 90min. Injection was continuously monitored to ensure that no
significant damage was inflicted on the axon. If the axon suffered extensive damage, as seen by
many circular dark spots (“blebs”) in the axoplasm, the preparation was not used. No evoked
EPSP recordings were made during injection because muscle contractions would dislodge the
injection microelectrode or movement of the axon impaled with the microelectrode would cause
axonal damage. Stretching the muscle was not sufficient to prevent this from happening.
After pressure injection, responses were recorded to determine any effects of the injected
protein solution on the evoked phasic or tonic response. Post-injection recordings are described
in detail for each experiment in Chapters 3-5.
2.6.4 Recording phasic and tonic axon action potentials
At the start and end of each experiment, action potentials were recorded from the phasic
or tonic axon using a sharp glass microelectrode filled with 3M KCl (10-15M in crayfish
saline). The average peak amplitude of three action potentials at the start and end of each
experiment was used for analysis. The cuff electrode connected to the external stimulator
(triggered by the WINWCP software) was used to stimulate the phasic and tonic axons using a
single square wave pulse (0.3msec duration) of threshold amplitude at 0.1Hz. The average peak
amplitude of three phasic and tonic axon action potentials was used for statistical analyses. See
Figure 22B for action potential measurement (shows a single phasic axon action potential but it
also applies to measuring tonic axon action potentials).
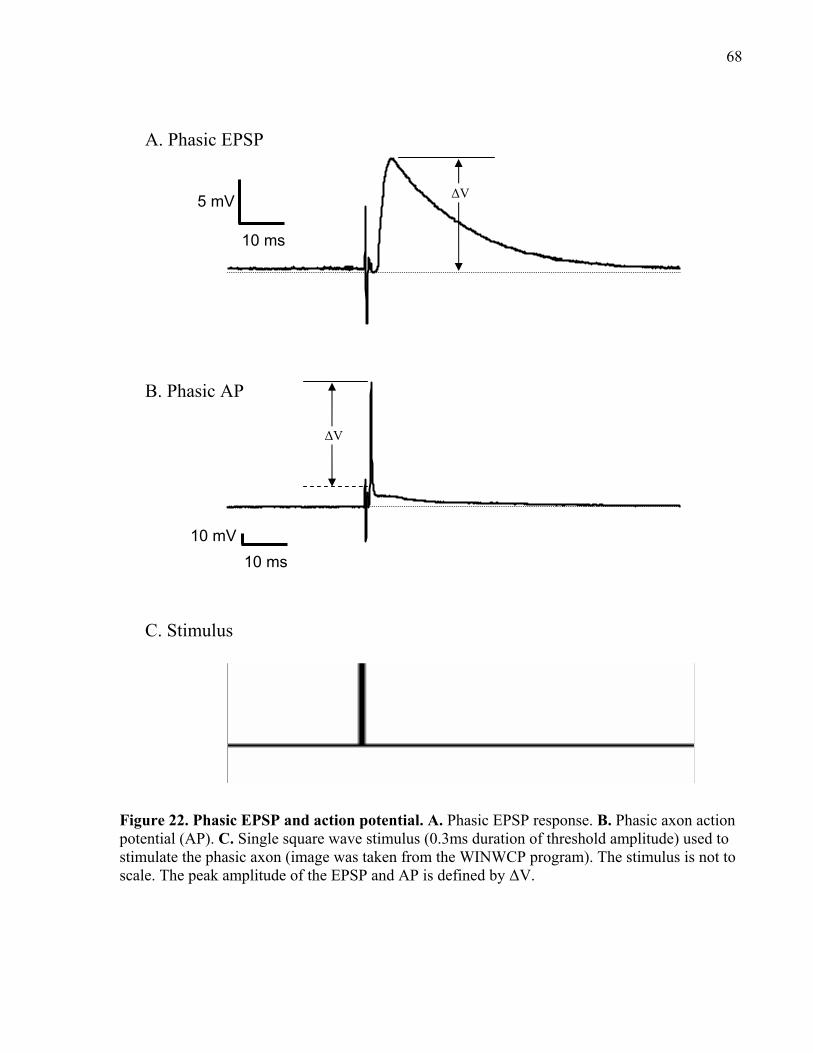
68
Figure 22. Phasic EPSP and action potential. A. Phasic EPSP response. B. Phasic axon action potential (AP). C. Single square wave stimulus (0.3ms duration of threshold amplitude) used to stimulate the phasic axon (image was taken from the WINWCP program). The stimulus is not to scale. The peak amplitude of the EPSP and AP is defined by ΔV.
10 mV 10 ms
ΔV
ΔV
5 mV
10 ms
A. Phasic EPSP
B. Phasic AP
C. Stimulus
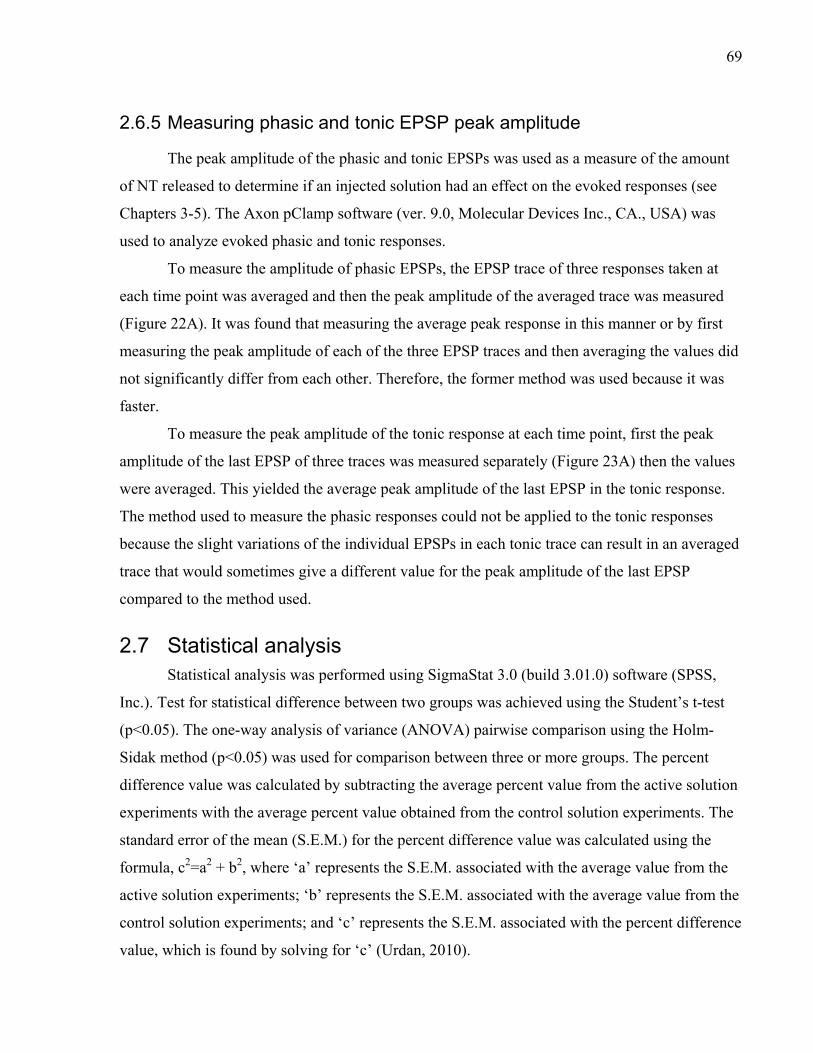
69
2.6.5 Measuring phasic and tonic EPSP peak amplitude
The peak amplitude of the phasic and tonic EPSPs was used as a measure of the amount
of NT released to determine if an injected solution had an effect on the evoked responses (see
Chapters 3-5). The Axon pClamp software (ver. 9.0, Molecular Devices Inc., CA., USA) was
used to analyze evoked phasic and tonic responses.
To measure the amplitude of phasic EPSPs, the EPSP trace of three responses taken at
each time point was averaged and then the peak amplitude of the averaged trace was measured
(Figure 22A). It was found that measuring the average peak response in this manner or by first
measuring the peak amplitude of each of the three EPSP traces and then averaging the values did
not significantly differ from each other. Therefore, the former method was used because it was
faster.
To measure the peak amplitude of the tonic response at each time point, first the peak
amplitude of the last EPSP of three traces was measured separately (Figure 23A) then the values
were averaged. This yielded the average peak amplitude of the last EPSP in the tonic response.
The method used to measure the phasic responses could not be applied to the tonic responses
because the slight variations of the individual EPSPs in each tonic trace can result in an averaged
trace that would sometimes give a different value for the peak amplitude of the last EPSP
compared to the method used.
2.7 Statistical analysis Statistical analysis was performed using SigmaStat 3.0 (build 3.01.0) software (SPSS,
Inc.). Test for statistical difference between two groups was achieved using the Student’s t-test
(p<0.05). The one-way analysis of variance (ANOVA) pairwise comparison using the Holm-
Sidak method (p<0.05) was used for comparison between three or more groups. The percent
difference value was calculated by subtracting the average percent value from the active solution
experiments with the average percent value obtained from the control solution experiments. The
standard error of the mean (S.E.M.) for the percent difference value was calculated using the
formula, c2=a2 + b2, where ‘a’ represents the S.E.M. associated with the average value from the
active solution experiments; ‘b’ represents the S.E.M. associated with the average value from the
control solution experiments; and ‘c’ represents the S.E.M. associated with the percent difference
value, which is found by solving for ‘c’ (Urdan, 2010).
70
Figure 23. Tonic EPSPs and action potentials. A. Tonic EPSP response. B. Tonic axon action potentials (APs). C. Fifteen square wave pulses at 200Hz (each 0.3ms in duration of threshold amplitude) used to stimulate the tonic axon (image was taken from the WINWCP program). The stimulus is not to scale. The peak amplitude of the last EPSP in the tonic EPSP trace is defined by ΔV and used for analyses. The peak amplitude of a single tonic axon AP was measured using the same method for a single phasic axon AP in Figure 22B. The peak amplitude of a tonic axon AP was not measured from the trace in B.
Nerve
10 mV
2.00 ms
A. Tonic EPSPs
B. Tonic APs
1 mV
Muscle
ΔV
C. Stimulus
2mV 5ms
10mV 5ms
71
2.8 Cloning and sequencing crayfish VAMP
Crayfish neuronal VAMP was cloned and sequenced to determine its gene and
corresponding protein amino acid sequence in order to compare it with VAMP from other
species. In addition, the VAMP sequence was used to determine if the binding and cleavage
sites for VAMP-specific TeNT and BoNTs are present and to use the sequence to synthesize a
short peptide to interfere with SNARE zippering. The sequence found represents the first known
crayfish VAMP sequence. Special thanks goes to Dr. Z-P Feng and her postdoc Dr. Kwokyin
Hui (Department of Physiology, UofT, Toronto, ON., Canada) for their assistance with cloning
and sequencing the SNARE motif of crayfish VAMP.
2.8.1 Cloning and sequencing the SNARE motif of crayfish VAMP
2.8.1.1 RNA extraction and cDNA synthesis
Total RNA was extracted from 20 crayfish abdominal (tail) nerve cords by first placing
the nerve cords in an autoclaved 1.5mL microfuge tube and freezing the samples by placing the
tube on dry ice. Then, the nerve cords were homogenized using a sterile plastic pestle
(KT749510-1500, VWR Canada) until they were ground up into a fine white powder. Finally,
the homogenized sample was mixed with TRI Reagent (Sigma-Aldrich), which helps to separate
RNA, DNA, and proteins in the sample. The extraction protocol that was supplied with the TRI
Reagent was used for RNA extraction.
Single-stranded RNAs are very unstable and cannot be used directly for cloning purposes
(Farrell, 2005). Therefore, RNA must undergo reverse transcription to form a more stable,
single-strand complementary DNA (cDNA) that can be used for Polymerase Chain Reaction
(PCR) in the next section. To generate cDNAs, the crayfish total RNA sample was incubated
with SuperScript III reverse transcriptase (#18080-093, Invitrogen) and an oligo(dT)18 primer
(Fermentas) for 1hr in a 52ºC water bath. The protocol that was supplied with the reverse
transcriptase was used for reverse transcription.
2.8.1.2 Polymerase chain reaction (PCR)
The most conserved region of VAMP across all species is the SNARE motif. This region
is responsible for binding with the SNARE motifs from the other two SNARE proteins (Syntaxin
and SNAP-25) to form the SNARE complex. Therefore, I designed PCR primers to amplify the
72
SNARE motif region of VAMP and use this region as the foundation to determine the full-length
crayfish VAMP sequence later on. Primers were designed with the help from an online program
called CODEHOP (COnsensus-DEgenerate Hybrid Oligonucleotide Primers;
http://bioinformatics.weizmann.ac.il/blocks/codehop.html). A detailed explanation of how to use
CODEHOP is given at the website above. Briefly, I generated a multiple protein alignment of
VAMP from different species and submitted the alignment to CODEHOP, which generated a list
of forward (5’-end) and reverse (3’-end) PCR primers. The forward and reverse primers that
yielded the crayfish VAMP SNARE motif sequence are given below.
To amplify the SNARE motif region of crayfish VAMP, the cDNA sample generated in
the previous section was subjected to PCR. This was achieved using the Fermentas GeneJet Fast
2x master mix (K0171, Fermentas) to which 10µM of the following forward and reverse primers
were added (Tm = primer melting temperature):
Forward primer (F8): 5’- GGTGGATGAGGTGGTGGACATCATGAG -3’ Tm = 64.6°C (V D E V V D I M R) Reverse primer (New R2): 5’- ATGATCATCATCTTGCAGTTYTTCCACC -3’ Tm = 58.4°C (W W K N C K M M I I)
The forward primer (F8) was made by ACGT Corp. (Toronto, ON., Canada) and the
reverse primer (New R2) was made by Integrated DNA Technologies, Inc. (Coralville, IA.,
USA). Amplification was carried out using the hot-start touchdown PCR method, in which the
following settings were used for the thermocycler (Primus 96 Plus Thermal Cycler, MWG-
Biotech AG, Ebersberg, Germany):
Lid heat = 110°C Initial melt = 95°C for 3min 30 cycles Denaturation: 90°C for 30sec
Annealing: 60°C for 30sec (decrement of 0.4°C every cycle; range of 60°C to 48.4°C)
Extension: 72°C for 30sec Final extension = 72°C for 8min
73
Following the PCR reaction, the entire sample (10µL) was run on a 1.5% agarose gel
containing ethidium bromide (1:20000 dilution; Sigma-Aldrich) to verify that the expected PCR
product (SNARE motif) of approximately 180-200bp was present. Once this was confirmed, the
band was excised out of the gel and purified using the Qiagen MinElute Gel Extraction Kit
(#28604, Qiagen) following the protocol outlined by the manufacturer. The agarose gel was
made by first making a 50x TAE (Tris-acetate-EDTA) stock solution (242g Tris base (BioShop),
57.1mL glacial acetic acid (BioShop), and 100mL of 0.5M EDTA (BioShop) (pH 8.0) made to a
final volume of 1L using dH2O) and diluting it by 1:50 using dH2O to make a 1x TAE working
solution. Then, 2.1g of agarose (Invitrogen) was added to 140mL of 1x TAE solution. The
agarose solution was boiled in a microwave until the agarose completely dissolved, then it was
allowed to cool down, after which ethidium bromide was added, and then the solution was
poured into a horizontal gel electrophoresis tank (Model B2, Owl Separation Systems, Inc.,
Portsmouth, NH., USA) and allowed to cool and harden before use.
2.8.1.3 Ligation of the VAMP PCR product to a TA vector
To amplify the PCR product required for sequencing, the product was ligated to a TA
vector using the Qiagen Cloning Kit (#231122, Qiagen) following the protocol outlined by the
manufacturer, except that the ligation mixture was incubated overnight at 14°C. This produced a
recombinant TA vector that contained the PCR product. In general, a TA vector is one that has 3’
thymine nucleic acid (T) overhangs such that PCR products produced by the Taq DNA
polymerase with complementary 3’ adenine nucleic acid (A) overhangs can bind with each other
(T-A base pairing; Farrell, 2005).
2.8.1.4 Transformation of bacteria cells
To amplify the recombinant TA vector, and therefore the PCR product, necessary for
sequencing, bacterial cells (#200130, Stratagene XL1-Blue subcloning-grade competent cells,
Stratagene) were transformed with the recombinant TA vector using the following procedure:
1. 100µL of bacterial cell solution was mixed with the entire volume (10µL) of the
recombinant TA vector solution in a 1.5mL microfuge vial. 2. The mixture sat on ice for 30min. 3. The cells were heat shocked to induce transformation by placing the vial in a 42°C water
bath for 90sec and then let the vial sit on ice for 2min. At this point the bacterial cells are transformed.
74
4. 500µL of LB (Luria-Bertani) medium (L2542, Sigma-Aldrich) was added to the vial and placed in an incubator-shaker at 37°C, 250rpm for 1hr.
5. The transformed bacterial cells were plated in a dish containing LB-agar medium (7.5g agar (Agar-Bacto (Difco), BD Falcon) added to 500mL LB medium) with carbenicillin (100µg/mL of LB-agar solution, added once LB-agar medium cooled down but still in liquid form), which is an antibiotic that kills bacterial cells that do not express the antibiotic-resistant gene found on the TA vector. Therefore, only transformed bacterial cells will grow in the dish.
6. The dish was placed upside down in a 37°C incubator overnight.
2.8.1.5 Selecting and growing bacterial colonies
To grow bacteria to amplify the recombinant TA vector such that a sufficient amount can
be obtained for sequencing, 10 bacterial colonies were removed from the dish and added to
separate clear plastic, round-bottom, 14mL culture tubes (#352059, BD Falcon) each containing
5mL of LB medium and carbenicillin (100µg/mL of LB solution). The tubes were placed in an
incubator-shaker at 37°C, 250rpm overnight to permit the colonies to grow and yield a large
quantity of the recombinant vector. More than one colony was selected because it is not
guaranteed that every colony will have a recombinant vector. Some colonies may even contain
the TA vector without the PCR product.
2.8.1.6 Extracting recombinant TA vectors from bacterial cells
The recombinant vectors from each of the 10 colonies selected were extracted using the
Qiagen Qiaprep Spin Miniprep Kit (#27106, Qiagen) following the protocol outlined by the
manufacturer.
2.8.1.7 Verification of the VAMP PCR product from the extracted recombinant TA vectors
To check if the recovered TA vectors contained the PCR fragment, EcoR1 (E. coli
endonuclease) digestion was used. The EcoR1 cleavage site (GAATTC) is on the vector at both
ends of the multiple cloning site (insertion point) but is not present in the PCR fragment. If the
vector contains the PCR fragment then digestion will yield two products: TA vector (3.85kb) and
the PCR product (180-200bp). EcoR1 digestion was performed as followed:
1. Mixed the following together in a 1.5mL microfuge tube for each colony sample:
2µL plasmid 6.8µL dH2O 1µL EcoR1 buffer (B0101S, New England BioLabs)
75
0.2µL EcoR1 (R0101S, New England BioLabs ; 0.2uL dH2O for controls) (Total volume = 10uL)
2. The mixture was incubated in a 37°C water bath for 2.5hrs. 3. Each sample was run on a 1.5% agarose gel with ethidium bromide (1:20000 dilution) to
check for the digestion products.
2.8.1.8 Sequencing recombinant TA vectors with the VAMP PCR product
A sample of the extracted recombinant vector from the selected bacterial colonies that
showed the predicted PCR product (180-200bp) after EcoR1 digestion was submitted to The
Centre for Applied Genomics (The Hospital for Sick Children, MaRS Centre, Toronto, ON.,
Canada) for sequencing. The nucleotide and corresponding amino acid sequence is given in
Figure 24. Sequencing was successful in 7 out of the 10 colonies selected. The sequence obtained
represents the majority of the SNARE motif of crayfish VAMP. The sequence contains the
cleavage sites for BoNT/D/F and BoNT/B-TeNT, but not BoNT/G. The multiple protein
alignment with VAMP-1 and VAMP-2 isoforms (Figure 25) from other species showed that the
crayfish sequence is similar to the SNARE motif region in both VAMP isoforms, which is
conserved across all species tested.
2.8.2 Sequencing full-length crayfish VAMP
The region of crayfish VAMP cloned and sequenced in section 2.8.1.8 above represents
the SNARE motif, which is only a part of full-length VAMP. To determine the full-length
crayfish VAMP sequence, a procedure known as Rapid Amplification of cDNA Ends (RACE)
was performed to determine the sequence of the 5’- and 3’- ends of crayfish VAMP relative to
the SNARE motif. The RACE procedures outlined below were performed using the Clontech
SMART RACE amplification kit (#634914, Clontech) that contained the Advantage 2 PCR kit
(#639207) and the Moloney Murine Leukemia Virus (MMLV) reverse transcriptase (#639523).
The protocol supplied with the kit was followed and any changes or important information
relevant to the RACE protocols are given below. The nested VAMP-specific primers used in the
5’- and 3’- RACE procedures below were designed using the crayfish VAMP SNARE motif
sequence and synthesized by ACGT Corp. (Toronto, ON., Canada); the Nested Universal Primer
A was supplied with the Clontech SMART RACE kit. The lab technician, Hui Zhang, was
responsible for performing this procedure.
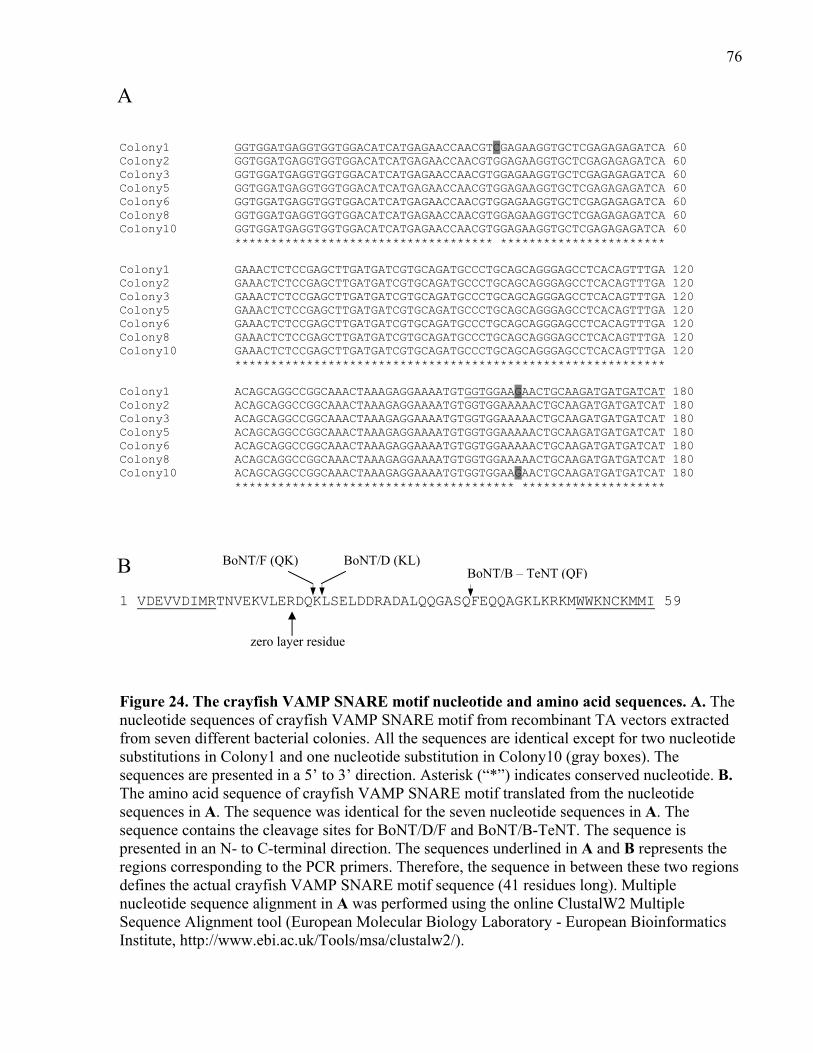
76
Colony1 GGTGGATGAGGTGGTGGACATCATGAGAACCAACGTCGAGAAGGTGCTCGAGAGAGATCA 60 Colony2 GGTGGATGAGGTGGTGGACATCATGAGAACCAACGTGGAGAAGGTGCTCGAGAGAGATCA 60 Colony3 GGTGGATGAGGTGGTGGACATCATGAGAACCAACGTGGAGAAGGTGCTCGAGAGAGATCA 60 Colony5 GGTGGATGAGGTGGTGGACATCATGAGAACCAACGTGGAGAAGGTGCTCGAGAGAGATCA 60 Colony6 GGTGGATGAGGTGGTGGACATCATGAGAACCAACGTGGAGAAGGTGCTCGAGAGAGATCA 60 Colony8 GGTGGATGAGGTGGTGGACATCATGAGAACCAACGTGGAGAAGGTGCTCGAGAGAGATCA 60 Colony10 GGTGGATGAGGTGGTGGACATCATGAGAACCAACGTGGAGAAGGTGCTCGAGAGAGATCA 60 ************************************ *********************** Colony1 GAAACTCTCCGAGCTTGATGATCGTGCAGATGCCCTGCAGCAGGGAGCCTCACAGTTTGA 120 Colony2 GAAACTCTCCGAGCTTGATGATCGTGCAGATGCCCTGCAGCAGGGAGCCTCACAGTTTGA 120 Colony3 GAAACTCTCCGAGCTTGATGATCGTGCAGATGCCCTGCAGCAGGGAGCCTCACAGTTTGA 120 Colony5 GAAACTCTCCGAGCTTGATGATCGTGCAGATGCCCTGCAGCAGGGAGCCTCACAGTTTGA 120 Colony6 GAAACTCTCCGAGCTTGATGATCGTGCAGATGCCCTGCAGCAGGGAGCCTCACAGTTTGA 120 Colony8 GAAACTCTCCGAGCTTGATGATCGTGCAGATGCCCTGCAGCAGGGAGCCTCACAGTTTGA 120 Colony10 GAAACTCTCCGAGCTTGATGATCGTGCAGATGCCCTGCAGCAGGGAGCCTCACAGTTTGA 120 ************************************************************ Colony1 ACAGCAGGCCGGCAAACTAAAGAGGAAAATGTGGTGGAAGAACTGCAAGATGATGATCAT 180 Colony2 ACAGCAGGCCGGCAAACTAAAGAGGAAAATGTGGTGGAAAAACTGCAAGATGATGATCAT 180 Colony3 ACAGCAGGCCGGCAAACTAAAGAGGAAAATGTGGTGGAAAAACTGCAAGATGATGATCAT 180 Colony5 ACAGCAGGCCGGCAAACTAAAGAGGAAAATGTGGTGGAAAAACTGCAAGATGATGATCAT 180 Colony6 ACAGCAGGCCGGCAAACTAAAGAGGAAAATGTGGTGGAAAAACTGCAAGATGATGATCAT 180 Colony8 ACAGCAGGCCGGCAAACTAAAGAGGAAAATGTGGTGGAAAAACTGCAAGATGATGATCAT 180 Colony10 ACAGCAGGCCGGCAAACTAAAGAGGAAAATGTGGTGGAAGAACTGCAAGATGATGATCAT 180 *************************************** ******************** 1 VDEVVDIMRTNVEKVLERDQKLSELDDRADALQQGASQFEQQAGKLKRKMWWKNCKMMI 59
Figure 24. The crayfish VAMP SNARE motif nucleotide and amino acid sequences. A. The nucleotide sequences of crayfish VAMP SNARE motif from recombinant TA vectors extracted from seven different bacterial colonies. All the sequences are identical except for two nucleotide substitutions in Colony1 and one nucleotide substitution in Colony10 (gray boxes). The sequences are presented in a 5’ to 3’ direction. Asterisk (“*”) indicates conserved nucleotide. B. The amino acid sequence of crayfish VAMP SNARE motif translated from the nucleotide sequences in A. The sequence was identical for the seven nucleotide sequences in A. The sequence contains the cleavage sites for BoNT/D/F and BoNT/B-TeNT. The sequence is presented in an N- to C-terminal direction. The sequences underlined in A and B represents the regions corresponding to the PCR primers. Therefore, the sequence in between these two regions defines the actual crayfish VAMP SNARE motif sequence (41 residues long). Multiple nucleotide sequence alignment in A was performed using the online ClustalW2 Multiple Sequence Alignment tool (European Molecular Biology Laboratory - European Bioinformatics Institute, http://www.ebi.ac.uk/Tools/msa/clustalw2/).
A
B BoNT/F (QK) BoNT/D (KL)BoNT/B – TeNT (QF)
zero layer residue
77
Figure 25. Comparison of crayfish VAMP SNARE motif amino acid sequence with VAMP-1 and VAMP-2 isoforms from other species. Multiple protein alignment shows the crayfish sequence is similar to the highly conserved SNARE motif region in VAMP-1 and VAMP-2 isoforms from other species (black bar). The type of isoform is unknown for some species. The cleavage sites of VAMP-specific neurotoxins are indicated in the alignment. The crayfish VAMP sequence is missing only the BoNT/G cleavage site. The regions used to design the forward ( ) and reverse ( ) PCR primers are indicated. Asterisk (“*”) indicates conserved residue; colon (“:”) indicates residues with strongly similar properties; period (“.”) indicates residues with weakly similar properties. The multiple protein sequence alignment was performed using the online ClustalW2 Multiple Sequence Alignment tool (European Molecular Biology Laboratory - European Bioinformatics Institute, http://www.ebi.ac.uk/Tools/msa/clustalw2/).
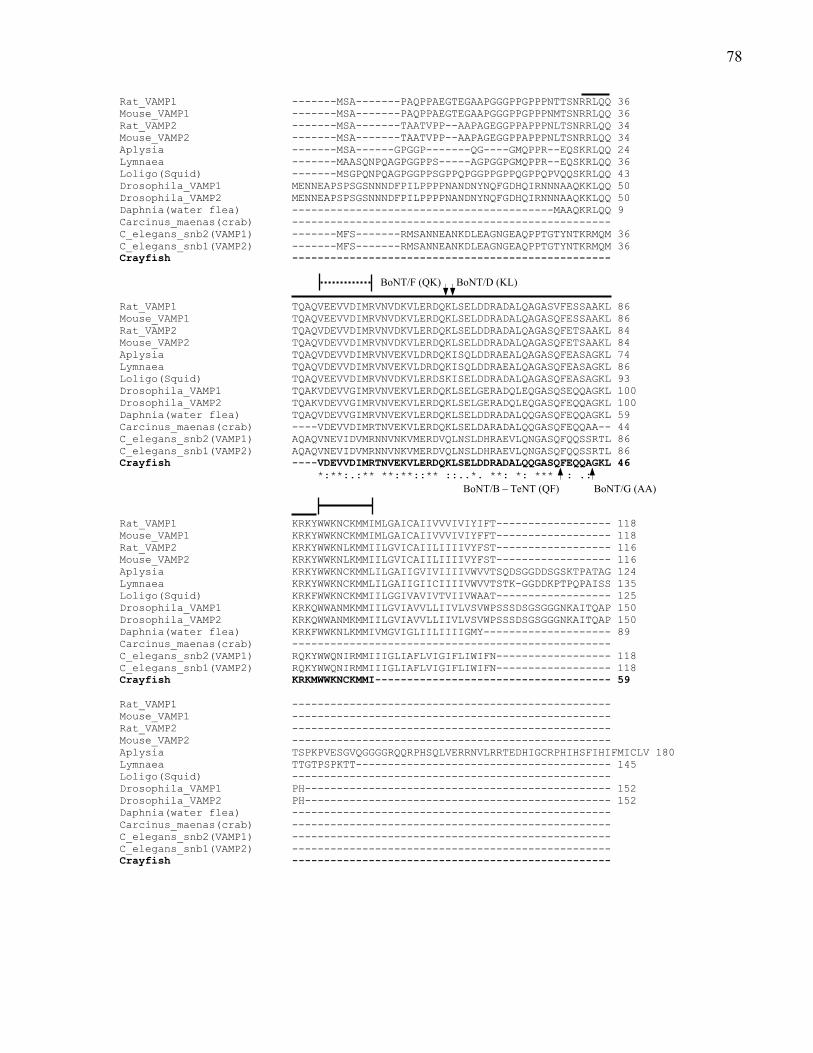
78
Rat_VAMP1 -------MSA-------PAQPPAEGTEGAAPGGGPPGPPPNTTSNRRLQQ 36 Mouse_VAMP1 -------MSA-------PAQPPAEGTEGAAPGGGPPGPPPNMTSNRRLQQ 36 Rat_VAMP2 -------MSA-------TAATVPP--AAPAGEGGPPAPPPNLTSNRRLQQ 34 Mouse_VAMP2 -------MSA-------TAATVPP--AAPAGEGGPPAPPPNLTSNRRLQQ 34 Aplysia -------MSA------GPGGP-------QG----GMQPPR--EQSKRLQQ 24 Lymnaea -------MAASQNPQAGPGGPPS-----AGPGGPGMQPPR--EQSKRLQQ 36 Loligo(Squid) -------MSGPQNPQAGPGGPPSGPPQPGGPPGPPQGPPQPVQQSKRLQQ 43 Drosophila_VAMP1 MENNEAPSPSGSNNNDFPILPPPPNANDNYNQFGDHQIRNNNAAQKKLQQ 50 Drosophila_VAMP2 MENNEAPSPSGSNNNDFPILPPPPNANDNYNQFGDHQIRNNNAAQKKLQQ 50 Daphnia(water flea) -----------------------------------------MAAQKRLQQ 9 Carcinus_maenas(crab) -------------------------------------------------- C_elegans_snb2(VAMP1) -------MFS-------RMSANNEANKDLEAGNGEAQPPTGTYNTKRMQM 36 C_elegans_snb1(VAMP2) -------MFS-------RMSANNEANKDLEAGNGEAQPPTGTYNTKRMQM 36 Crayfish -------------------------------------------------- Rat_VAMP1 TQAQVEEVVDIMRVNVDKVLERDQKLSELDDRADALQAGASVFESSAAKL 86 Mouse_VAMP1 TQAQVEEVVDIMRVNVDKVLERDQKLSELDDRADALQAGASQFESSAAKL 86 Rat_VAMP2 TQAQVDEVVDIMRVNVDKVLERDQKLSELDDRADALQAGASQFETSAAKL 84 Mouse_VAMP2 TQAQVDEVVDIMRVNVDKVLERDQKLSELDDRADALQAGASQFETSAAKL 84 Aplysia TQAQVDEVVDIMRVNVEKVLDRDQKISQLDDRAEALQAGASQFEASAGKL 74 Lymnaea TQAQVDEVVDIMRVNVEKVLDRDQKISQLDDRAEALQAGASQFEASAGKL 86 Loligo(Squid) TQAQVEEVVDIMRVNVDKVLERDSKISELDDRADALQAGASQFEASAGKL 93 Drosophila_VAMP1 TQAKVDEVVGIMRVNVEKVLERDQKLSELGERADQLEQGASQSEQQAGKL 100 Drosophila_VAMP2 TQAKVDEVVGIMRVNVEKVLERDQKLSELGERADQLEQGASQFEQQAGKL 100 Daphnia(water flea) TQAQVDEVVGIMRVNVEKVLERDQKLSELDDRADALQQGASQFEQQAGKL 59 Carcinus_maenas(crab) ----VDEVVDIMRTNVEKVLERDQKLSELDARADALQQGASQFEQQAA-- 44 C_elegans_snb2(VAMP1) AQAQVNEVIDVMRNNVNKVMERDVQLNSLDHRAEVLQNGASQFQQSSRTL 86 C_elegans_snb1(VAMP2) AQAQVNEVIDVMRNNVNKVMERDVQLNSLDHRAEVLQNGASQFQQSSRTL 86 Crayfish ----VDEVVDIMRTNVEKVLERDQKLSELDDRADALQQGASQFEQQAGKL 46 *:**:.:** **:**::** ::..*. **: *: *** : .: Rat_VAMP1 KRKYWWKNCKMMIMLGAICAIIVVVIVIYIFT------------------ 118 Mouse_VAMP1 KRKYWWKNCKMMIMLGAICAIIVVVIVIYFFT------------------ 118 Rat_VAMP2 KRKYWWKNLKMMIILGVICAIILIIIIVYFST------------------ 116 Mouse_VAMP2 KRKYWWKNLKMMIILGVICAIILIIIIVYFST------------------ 116 Aplysia KRKYWWKNCKMMLILGAIIGVIVIIIIVWVVTSQDSGGDDSGSKTPATAG 124 Lymnaea KRKYWWKNCKMMLILGAIIGIICIIIIVWVVTSTK-GGDDKPTPQPAISS 135 Loligo(Squid) KRKFWWKNCKMMIILGGIVAVIVTVIIVWAAT------------------ 125 Drosophila_VAMP1 KRKQWWANMKMMIILGVIAVVLLIIVLVSVWPSSSDSGSGGGNKAITQAP 150 Drosophila_VAMP2 KRKQWWANMKMMIILGVIAVVLLIIVLVSVWPSSSDSGSGGGNKAITQAP 150 Daphnia(water flea) KRKFWWKNLKMMIVMGVIGLIILIIIIGMY-------------------- 89 Carcinus_maenas(crab) -------------------------------------------------- C_elegans_snb2(VAMP1) RQKYWWQNIRMMIIIGLIAFLVIGIFLIWIFN------------------ 118 C_elegans_snb1(VAMP2) RQKYWWQNIRMMIIIGLIAFLVIGIFLIWIFN------------------ 118 Crayfish KRKMWWKNCKMMI------------------------------------- 59 Rat_VAMP1 -------------------------------------------------- Mouse_VAMP1 -------------------------------------------------- Rat_VAMP2 -------------------------------------------------- Mouse_VAMP2 -------------------------------------------------- Aplysia TSPKPVESGVQGGGGRQQRPHSQLVERRNVLRRTEDHIGCRPHIHSFIHIFMICLV 180 Lymnaea TTGTPSPKTT---------------------------------------- 145 Loligo(Squid) -------------------------------------------------- Drosophila_VAMP1 PH------------------------------------------------ 152 Drosophila_VAMP2 PH------------------------------------------------ 152 Daphnia(water flea) -------------------------------------------------- Carcinus_maenas(crab) -------------------------------------------------- C_elegans_snb2(VAMP1) -------------------------------------------------- C_elegans_snb1(VAMP2) -------------------------------------------------- Crayfish --------------------------------------------------
BoNT/G (AA)
BoNT/F (QK) BoNT/D (KL)
BoNT/B – TeNT (QF)
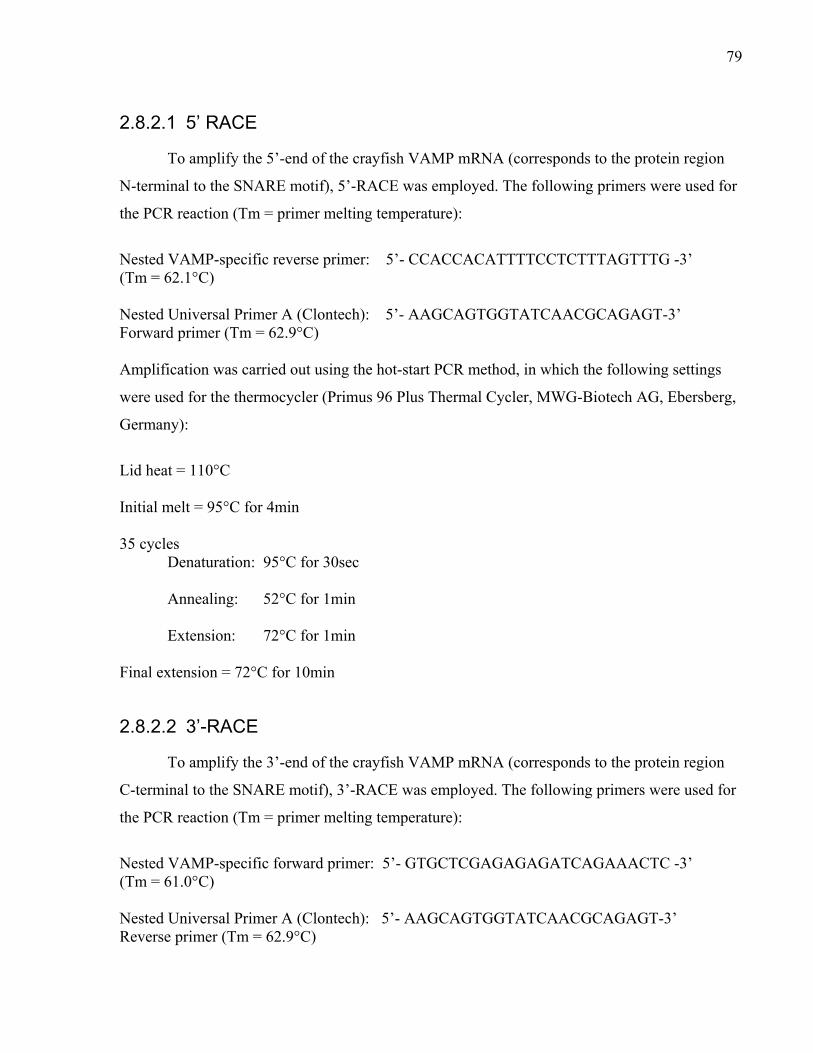
79
2.8.2.1 5’ RACE
To amplify the 5’-end of the crayfish VAMP mRNA (corresponds to the protein region
N-terminal to the SNARE motif), 5’-RACE was employed. The following primers were used for
the PCR reaction (Tm = primer melting temperature):
Nested VAMP-specific reverse primer: 5’- CCACCACATTTTCCTCTTTAGTTTG -3’ (Tm = 62.1°C) Nested Universal Primer A (Clontech): 5’- AAGCAGTGGTATCAACGCAGAGT-3’ Forward primer (Tm = 62.9°C) Amplification was carried out using the hot-start PCR method, in which the following settings
were used for the thermocycler (Primus 96 Plus Thermal Cycler, MWG-Biotech AG, Ebersberg,
Germany):
Lid heat = 110°C Initial melt = 95°C for 4min 35 cycles Denaturation: 95°C for 30sec
Annealing: 52°C for 1min Extension: 72°C for 1min
Final extension = 72°C for 10min
2.8.2.2 3’-RACE
To amplify the 3’-end of the crayfish VAMP mRNA (corresponds to the protein region
C-terminal to the SNARE motif), 3’-RACE was employed. The following primers were used for
the PCR reaction (Tm = primer melting temperature):
Nested VAMP-specific forward primer: 5’- GTGCTCGAGAGAGATCAGAAACTC -3’ (Tm = 61.0°C) Nested Universal Primer A (Clontech): 5’- AAGCAGTGGTATCAACGCAGAGT-3’ Reverse primer (Tm = 62.9°C)
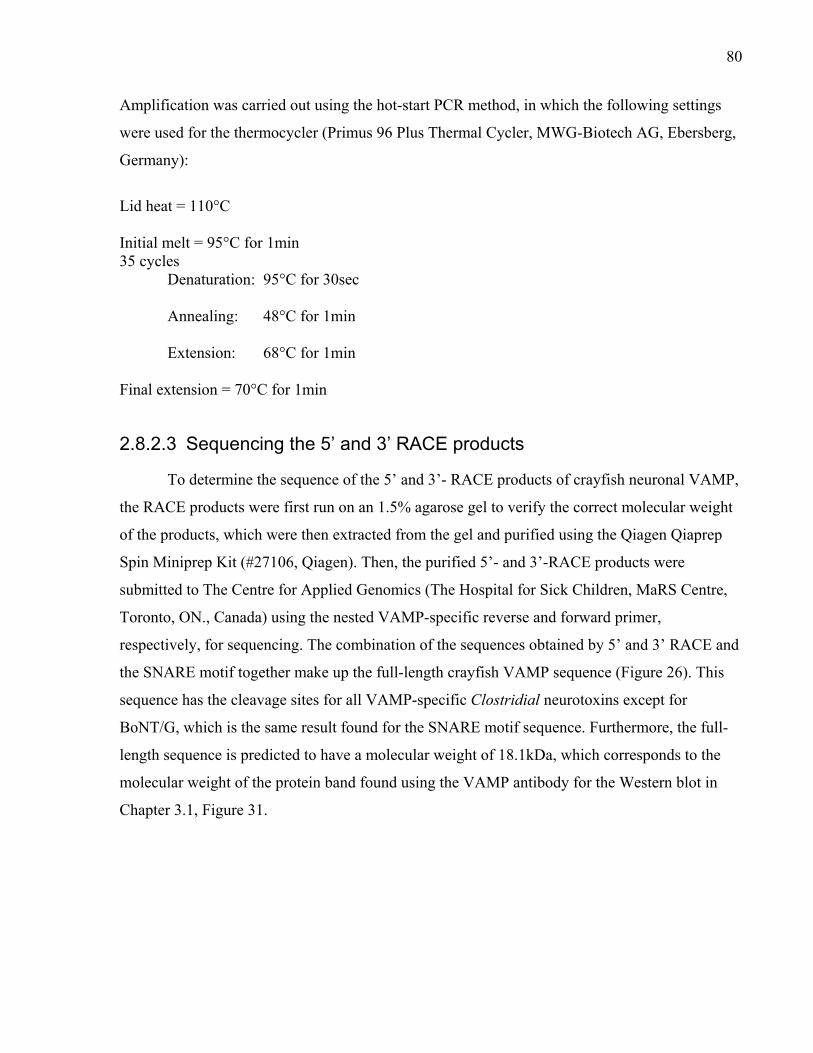
80
Amplification was carried out using the hot-start PCR method, in which the following settings
were used for the thermocycler (Primus 96 Plus Thermal Cycler, MWG-Biotech AG, Ebersberg,
Germany):
Lid heat = 110°C Initial melt = 95°C for 1min 35 cycles Denaturation: 95°C for 30sec
Annealing: 48°C for 1min Extension: 68°C for 1min
Final extension = 70°C for 1min
2.8.2.3 Sequencing the 5’ and 3’ RACE products
To determine the sequence of the 5’ and 3’- RACE products of crayfish neuronal VAMP,
the RACE products were first run on an 1.5% agarose gel to verify the correct molecular weight
of the products, which were then extracted from the gel and purified using the Qiagen Qiaprep
Spin Miniprep Kit (#27106, Qiagen). Then, the purified 5’- and 3’-RACE products were
submitted to The Centre for Applied Genomics (The Hospital for Sick Children, MaRS Centre,
Toronto, ON., Canada) using the nested VAMP-specific reverse and forward primer,
respectively, for sequencing. The combination of the sequences obtained by 5’ and 3’ RACE and
the SNARE motif together make up the full-length crayfish VAMP sequence (Figure 26). This
sequence has the cleavage sites for all VAMP-specific Clostridial neurotoxins except for
BoNT/G, which is the same result found for the SNARE motif sequence. Furthermore, the full-
length sequence is predicted to have a molecular weight of 18.1kDa, which corresponds to the
molecular weight of the protein band found using the VAMP antibody for the Western blot in
Chapter 3.1, Figure 31.
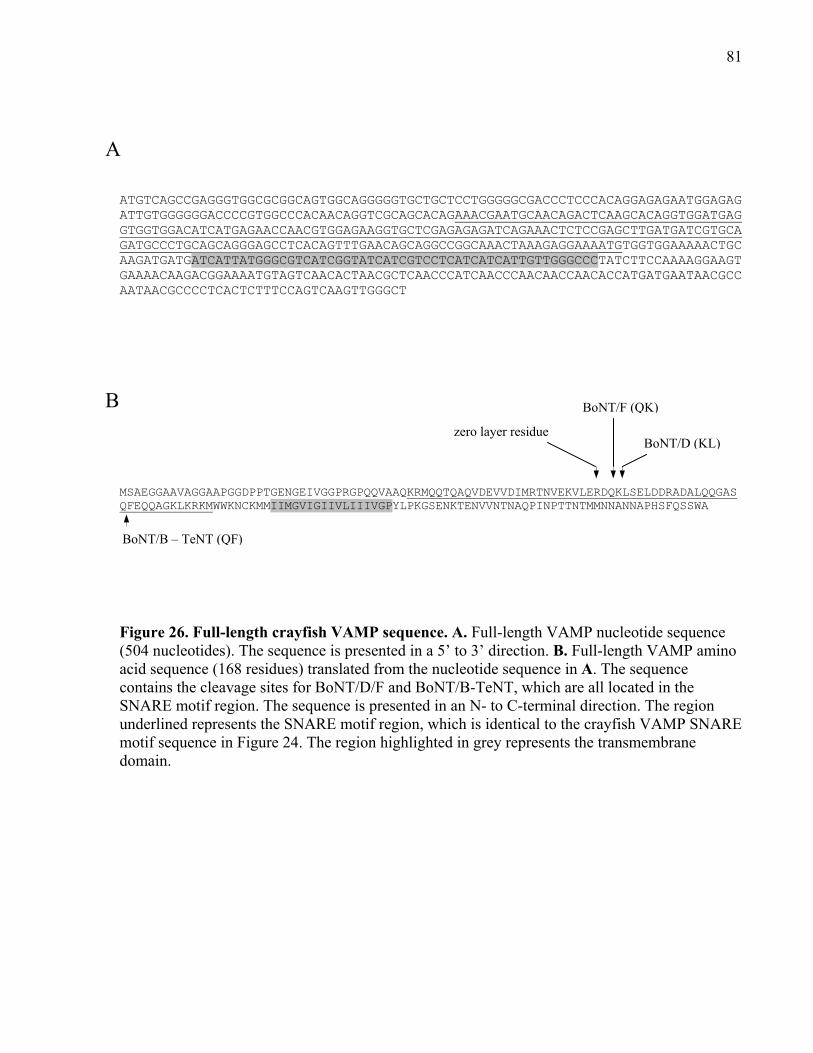
81
ATGTCAGCCGAGGGTGGCGCGGCAGTGGCAGGGGGTGCTGCTCCTGGGGGCGACCCTCCCACAGGAGAGAATGGAGAGATTGTGGGGGGACCCCGTGGCCCACAACAGGTCGCAGCACAGAAACGAATGCAACAGACTCAAGCACAGGTGGATGAGGTGGTGGACATCATGAGAACCAACGTGGAGAAGGTGCTCGAGAGAGATCAGAAACTCTCCGAGCTTGATGATCGTGCAGATGCCCTGCAGCAGGGAGCCTCACAGTTTGAACAGCAGGCCGGCAAACTAAAGAGGAAAATGTGGTGGAAAAACTGCAAGATGATGATCATTATGGGCGTCATCGGTATCATCGTCCTCATCATCATTGTTGGGCCCTATCTTCCAAAAGGAAGTGAAAACAAGACGGAAAATGTAGTCAACACTAACGCTCAACCCATCAACCCAACAACCAACACCATGATGAATAACGCCAATAACGCCCCTCACTCTTTCCAGTCAAGTTGGGCT MSAEGGAAVAGGAAPGGDPPTGENGEIVGGPRGPQQVAAQKRMQQTQAQVDEVVDIMRTNVEKVLERDQKLSELDDRADALQQGASQFEQQAGKLKRKMWWKNCKMMIIMGVIGIIVLIIIVGPYLPKGSENKTENVVNTNAQPINPTTNTMMNNANNAPHSFQSSWA
Figure 26. Full-length crayfish VAMP sequence. A. Full-length VAMP nucleotide sequence (504 nucleotides). The sequence is presented in a 5’ to 3’ direction. B. Full-length VAMP amino acid sequence (168 residues) translated from the nucleotide sequence in A. The sequence contains the cleavage sites for BoNT/D/F and BoNT/B-TeNT, which are all located in the SNARE motif region. The sequence is presented in an N- to C-terminal direction. The region underlined represents the SNARE motif region, which is identical to the crayfish VAMP SNARE motif sequence in Figure 24. The region highlighted in grey represents the transmembrane domain.
A
B BoNT/F (QK)
BoNT/D (KL)
BoNT/B – TeNT (QF)
zero layer residue
82
2.8.2.4 VAMP peptide synthesis
The peptide sequence corresponding to the C-terminal half of the crayfish VAMP
SNARE motif was submitted to GenScript (Piscataway, NJ., USA) for synthesis. The peptide is
referred to as the Vc peptide and its sequence is given in Figure 27. The scrambled Vc peptide
(control peptide) was generated by the online Expasy RandSeq program
(http://expasy.org/tools/randseq.html) in which the Vc peptide sequence was input into the
program and then random sequences were generated using the same number and type of amino
acids found in the Vc peptide. The scrambled Vc peptide sequence in Figure 27 was submitted to
GenScript for synthesis. Acetylation was applied to the N-terminus and amidation was applied to
the C-terminus such to remove the charge at the ends of both peptides as found in the native
protein since this is an internal sequence.
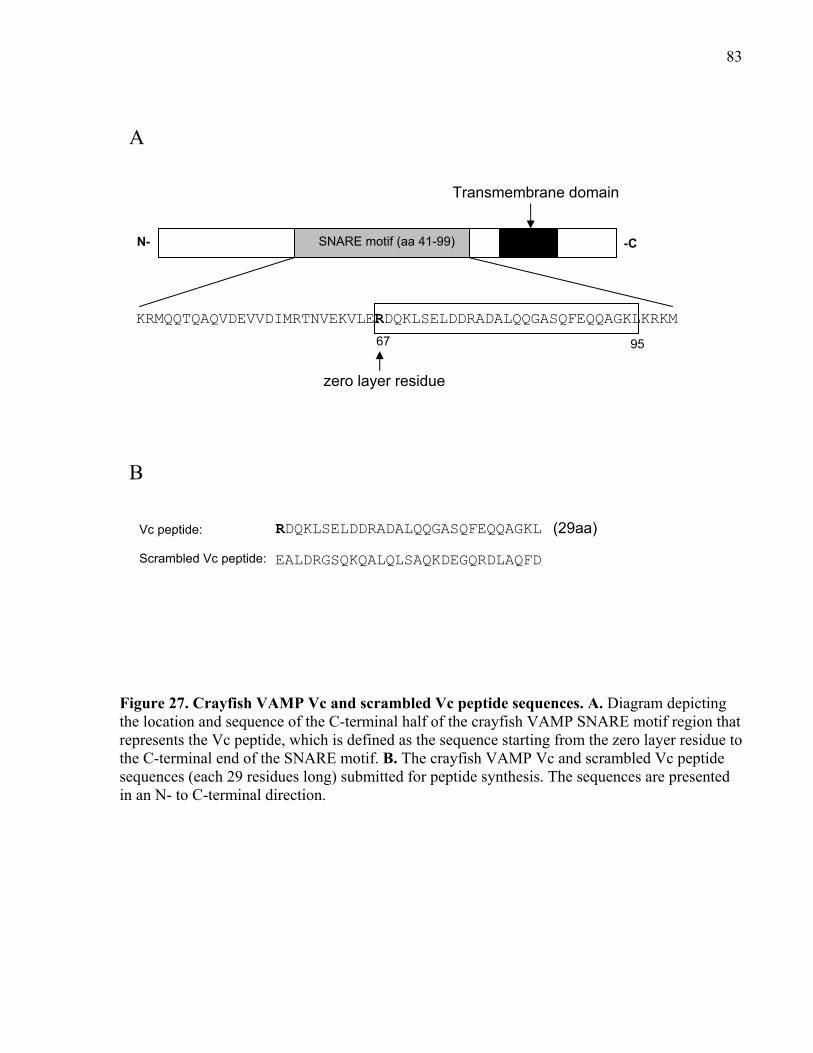
83
N- -C SNARE motif (aa 41-99)
KRMQQTQAQVDEVVDIMRTNVEKVLERDQKLSELDDRADALQQGASQFEQQAGKLKRKM
67 95
zero layer residue
Transmembrane domain
RDQKLSELDDRADALQQGASQFEQQAGKL
EALDRGSQKQALQLSAQKDEGQRDLAQFD
Vc peptide: Scrambled Vc peptide:
(29aa)
A
B
Figure 27. Crayfish VAMP Vc and scrambled Vc peptide sequences. A. Diagram depicting the location and sequence of the C-terminal half of the crayfish VAMP SNARE motif region that represents the Vc peptide, which is defined as the sequence starting from the zero layer residue to the C-terminal end of the SNARE motif. B. The crayfish VAMP Vc and scrambled Vc peptide sequences (each 29 residues long) submitted for peptide synthesis. The sequences are presented in an N- to C-terminal direction.
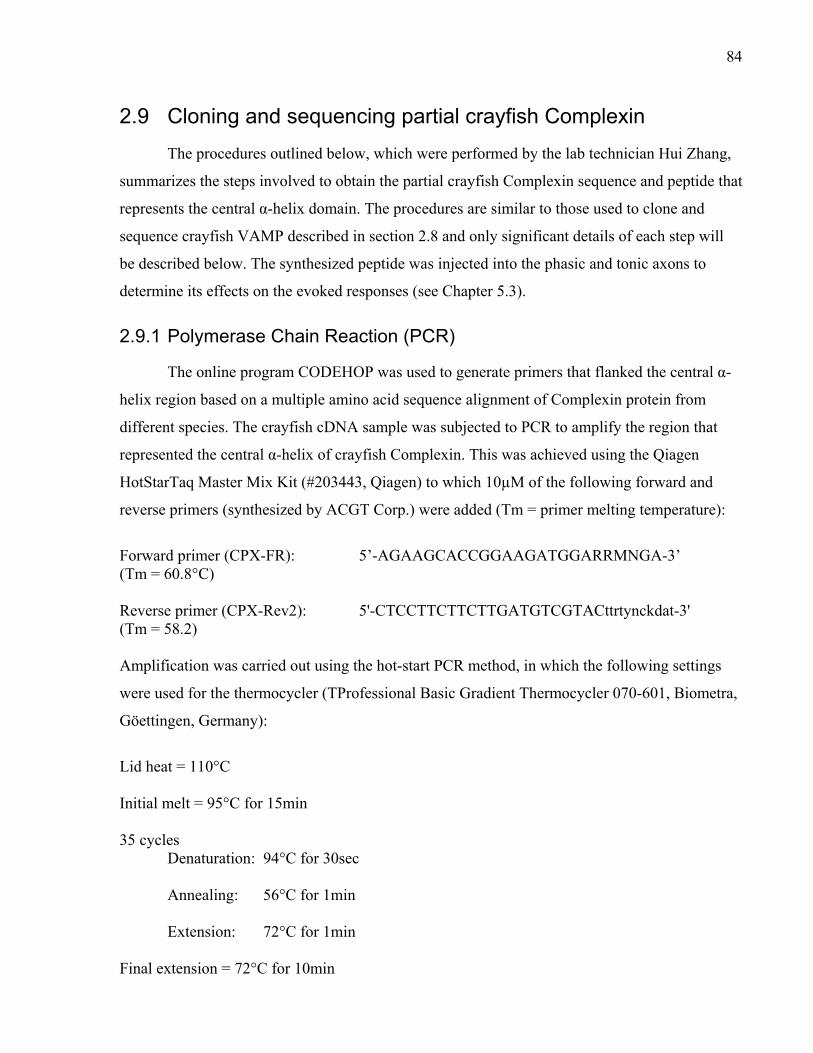
84
2.9 Cloning and sequencing partial crayfish Complexin
The procedures outlined below, which were performed by the lab technician Hui Zhang,
summarizes the steps involved to obtain the partial crayfish Complexin sequence and peptide that
represents the central α-helix domain. The procedures are similar to those used to clone and
sequence crayfish VAMP described in section 2.8 and only significant details of each step will
be described below. The synthesized peptide was injected into the phasic and tonic axons to
determine its effects on the evoked responses (see Chapter 5.3).
2.9.1 Polymerase Chain Reaction (PCR)
The online program CODEHOP was used to generate primers that flanked the central α-
helix region based on a multiple amino acid sequence alignment of Complexin protein from
different species. The crayfish cDNA sample was subjected to PCR to amplify the region that
represented the central α-helix of crayfish Complexin. This was achieved using the Qiagen
HotStarTaq Master Mix Kit (#203443, Qiagen) to which 10µM of the following forward and
reverse primers (synthesized by ACGT Corp.) were added (Tm = primer melting temperature):
Forward primer (CPX-FR): 5’-AGAAGCACCGGAAGATGGARRMNGA-3’ (Tm = 60.8°C) Reverse primer (CPX-Rev2): 5'-CTCCTTCTTCTTGATGTCGTACttrtynckdat-3' (Tm = 58.2) Amplification was carried out using the hot-start PCR method, in which the following settings
were used for the thermocycler (TProfessional Basic Gradient Thermocycler 070-601, Biometra,
Göettingen, Germany):
Lid heat = 110°C Initial melt = 95°C for 15min 35 cycles Denaturation: 94°C for 30sec
Annealing: 56°C for 1min
Extension: 72°C for 1min Final extension = 72°C for 10min
85
2.9.2 Ligation and transformation
The PCR product was subcloned into a TOPO TA vector using the TOPO TA Cloning
Kit (# K450001, Invitrogen) and then the TOP10 One Shot competent cells (supplied with the
kit) were transformed with the recombinant vector. The protocol supplied with the kit was used.
2.9.3 Sequencing
The extracted recombinant vectors from bacterial colonies that contained the correct size
of the expected PCR product (70-80bp) were submitted to The Centre for Applied Genomics
(The Hospital for Sick Children, MaRS Centre, Toronto, ON., Canada) for sequencing.
2.9.4 Complexin central α-helix peptide design and synthesis
Sequencing analysis yielded four different sequences from 4 out of 10 different bacterial
colonies selected (colonies 1, 3, 4, and 6, Figure 28). The four sequences differed by a few
residues but overall were similar. An alignment of the corresponding amino acids of the four
sequences with Complexin from other species showed that the sequences are similar to the
central α-helix region of Complexin (see Chapter 5.2, Figure 71). The multiple protein alignment
was also used to help choose the sequence needed to synthesize the corresponding interfering
peptide and scrambled peptide, in which the sequences are given in Figure 29. The sequences
were submitted to GenScript for peptide synthesis. Acetylation was applied to the N-terminus
and amidation was applied to the C-terminus such to remove the charge at the ends of the
peptides as found in the native protein since this is an internal sequence. In addition, a cysteine
residue was added to the N-terminal end of the interfering peptide to which keyhole limpet
hemocyanin (KLH) can be attached such that the peptide can be used as an antigen for antibody
production in the future. The central α-helix peptide was longer than the true cloned sequence
(defined as the sequence in between the two PCR primers; see Figures 28 and 29) because the
shorter sequence was not stable for peptide synthesis by GenScript.
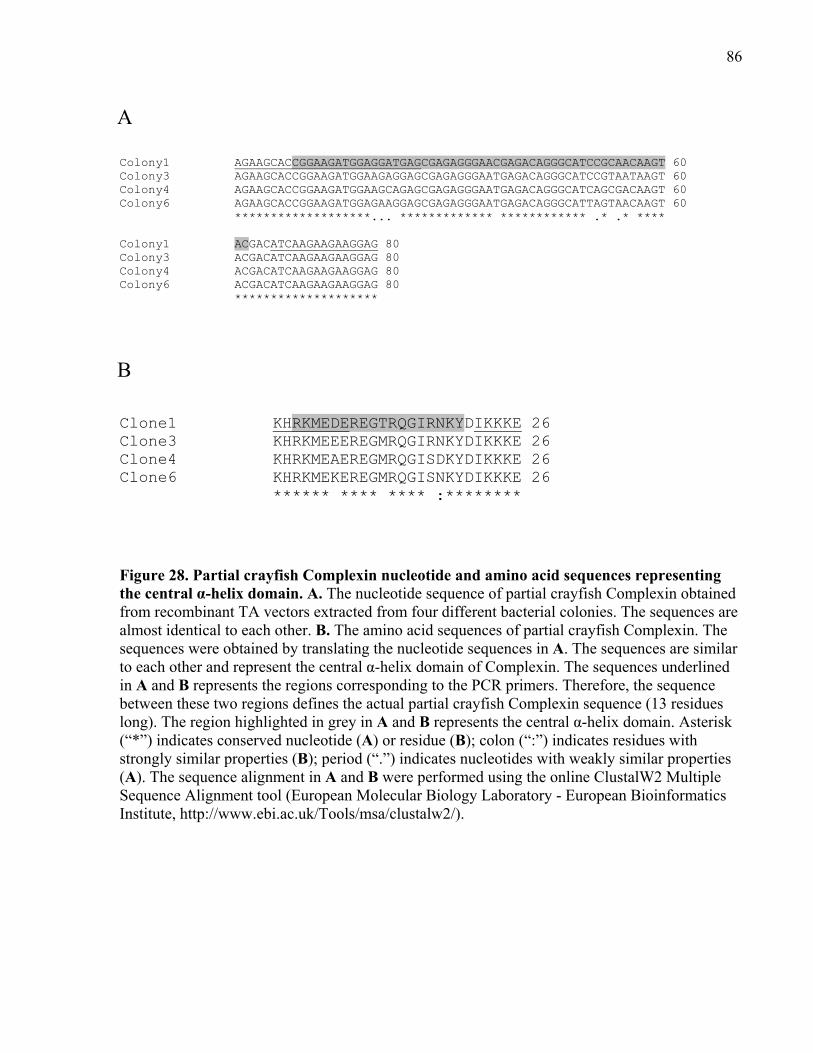
86
Colony1 AGAAGCACCGGAAGATGGAGGATGAGCGAGAGGGAACGAGACAGGGCATCCGCAACAAGT 60 Colony3 AGAAGCACCGGAAGATGGAAGAGGAGCGAGAGGGAATGAGACAGGGCATCCGTAATAAGT 60 Colony4 AGAAGCACCGGAAGATGGAAGCAGAGCGAGAGGGAATGAGACAGGGCATCAGCGACAAGT 60 Colony6 AGAAGCACCGGAAGATGGAGAAGGAGCGAGAGGGAATGAGACAGGGCATTAGTAACAAGT 60 *******************... ************* ************ .* .* **** Colony1 ACGACATCAAGAAGAAGGAG 80 Colony3 ACGACATCAAGAAGAAGGAG 80 Colony4 ACGACATCAAGAAGAAGGAG 80 Colony6 ACGACATCAAGAAGAAGGAG 80 ********************
Clone1 KHRKMEDEREGTRQGIRNKYDIKKKE 26 Clone3 KHRKMEEEREGMRQGIRNKYDIKKKE 26 Clone4 KHRKMEAEREGMRQGISDKYDIKKKE 26 Clone6 KHRKMEKEREGMRQGISNKYDIKKKE 26 ****** **** **** :********
Figure 28. Partial crayfish Complexin nucleotide and amino acid sequences representing the central α-helix domain. A. The nucleotide sequence of partial crayfish Complexin obtained from recombinant TA vectors extracted from four different bacterial colonies. The sequences are almost identical to each other. B. The amino acid sequences of partial crayfish Complexin. The sequences were obtained by translating the nucleotide sequences in A. The sequences are similar to each other and represent the central α-helix domain of Complexin. The sequences underlined in A and B represents the regions corresponding to the PCR primers. Therefore, the sequence between these two regions defines the actual partial crayfish Complexin sequence (13 residues long). The region highlighted in grey in A and B represents the central α-helix domain. Asterisk (“*”) indicates conserved nucleotide (A) or residue (B); colon (“:”) indicates residues with strongly similar properties (B); period (“.”) indicates nucleotides with weakly similar properties (A). The sequence alignment in A and B were performed using the online ClustalW2 Multiple Sequence Alignment tool (European Molecular Biology Laboratory - European Bioinformatics Institute, http://www.ebi.ac.uk/Tools/msa/clustalw2/).
B
A
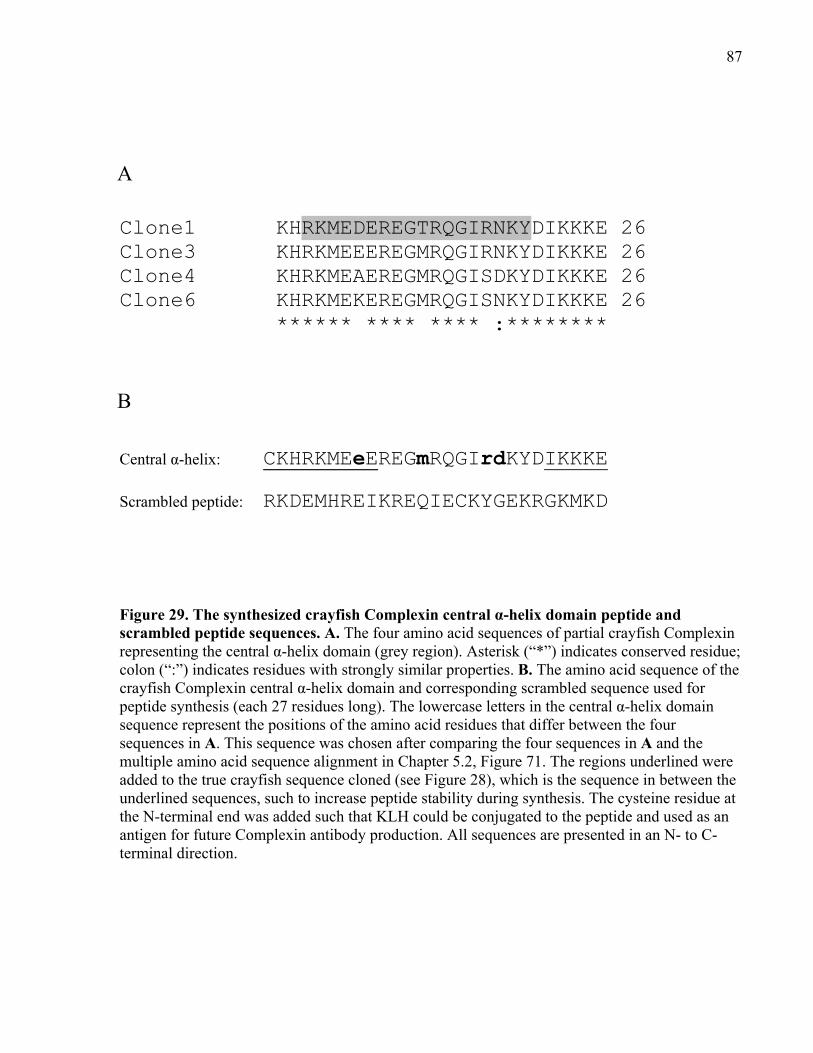
87
Clone1 KHRKMEDEREGTRQGIRNKYDIKKKE 26 Clone3 KHRKMEEEREGMRQGIRNKYDIKKKE 26 Clone4 KHRKMEAEREGMRQGISDKYDIKKKE 26 Clone6 KHRKMEKEREGMRQGISNKYDIKKKE 26 ****** **** **** :******** Central α-helix: CKHRKMEeEREGmRQGIrdKYDIKKKE Scrambled peptide: RKDEMHREIKREQIECKYGEKRGKMKD Figure 29. The synthesized crayfish Complexin central α-helix domain peptide and scrambled peptide sequences. A. The four amino acid sequences of partial crayfish Complexin representing the central α-helix domain (grey region). Asterisk (“*”) indicates conserved residue; colon (“:”) indicates residues with strongly similar properties. B. The amino acid sequence of the crayfish Complexin central α-helix domain and corresponding scrambled sequence used for peptide synthesis (each 27 residues long). The lowercase letters in the central α-helix domain sequence represent the positions of the amino acid residues that differ between the four sequences in A. This sequence was chosen after comparing the four sequences in A and the multiple amino acid sequence alignment in Chapter 5.2, Figure 71. The regions underlined were added to the true crayfish sequence cloned (see Figure 28), which is the sequence in between the underlined sequences, such to increase peptide stability during synthesis. The cysteine residue at the N-terminal end was added such that KLH could be conjugated to the peptide and used as an antigen for future Complexin antibody production. All sequences are presented in an N- to C-terminal direction.
A
B
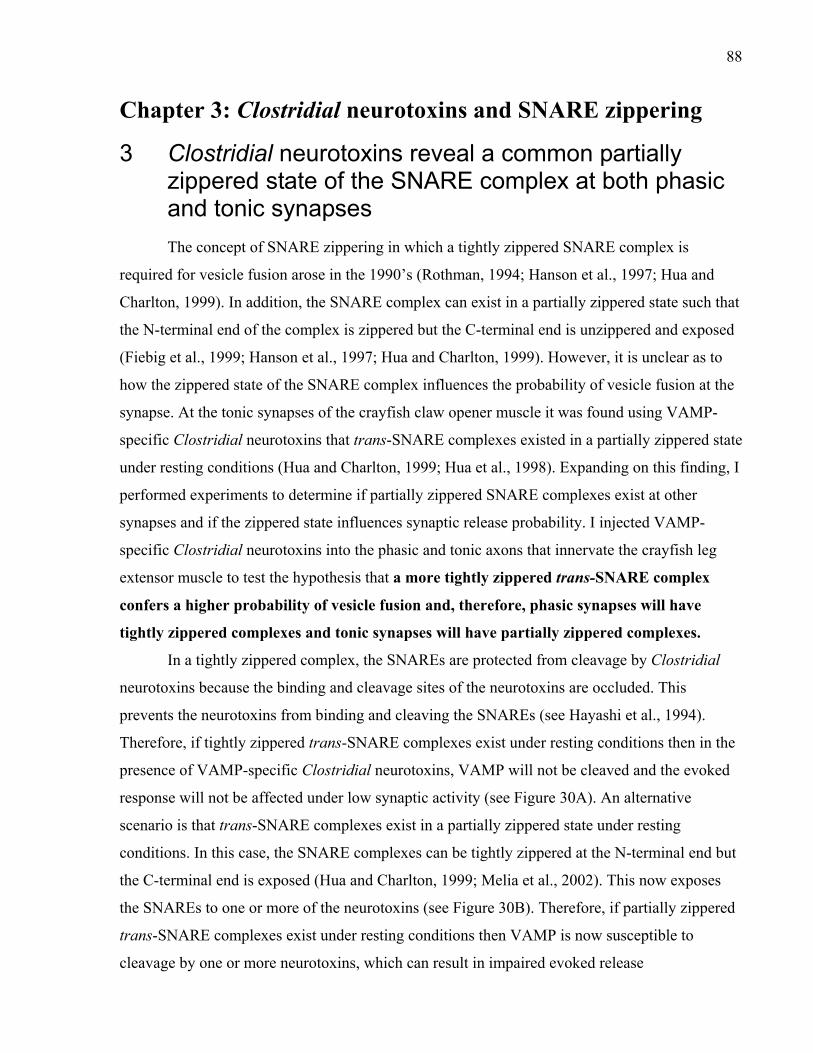
88
Chapter 3: Clostridial neurotoxins and SNARE zippering
3 Clostridial neurotoxins reveal a common partially zippered state of the SNARE complex at both phasic and tonic synapses
The concept of SNARE zippering in which a tightly zippered SNARE complex is
required for vesicle fusion arose in the 1990’s (Rothman, 1994; Hanson et al., 1997; Hua and
Charlton, 1999). In addition, the SNARE complex can exist in a partially zippered state such that
the N-terminal end of the complex is zippered but the C-terminal end is unzippered and exposed
(Fiebig et al., 1999; Hanson et al., 1997; Hua and Charlton, 1999). However, it is unclear as to
how the zippered state of the SNARE complex influences the probability of vesicle fusion at the
synapse. At the tonic synapses of the crayfish claw opener muscle it was found using VAMP-
specific Clostridial neurotoxins that trans-SNARE complexes existed in a partially zippered state
under resting conditions (Hua and Charlton, 1999; Hua et al., 1998). Expanding on this finding, I
performed experiments to determine if partially zippered SNARE complexes exist at other
synapses and if the zippered state influences synaptic release probability. I injected VAMP-
specific Clostridial neurotoxins into the phasic and tonic axons that innervate the crayfish leg
extensor muscle to test the hypothesis that a more tightly zippered trans-SNARE complex
confers a higher probability of vesicle fusion and, therefore, phasic synapses will have
tightly zippered complexes and tonic synapses will have partially zippered complexes.
In a tightly zippered complex, the SNAREs are protected from cleavage by Clostridial
neurotoxins because the binding and cleavage sites of the neurotoxins are occluded. This
prevents the neurotoxins from binding and cleaving the SNAREs (see Hayashi et al., 1994).
Therefore, if tightly zippered trans-SNARE complexes exist under resting conditions then in the
presence of VAMP-specific Clostridial neurotoxins, VAMP will not be cleaved and the evoked
response will not be affected under low synaptic activity (see Figure 30A). An alternative
scenario is that trans-SNARE complexes exist in a partially zippered state under resting
conditions. In this case, the SNARE complexes can be tightly zippered at the N-terminal end but
the C-terminal end is exposed (Hua and Charlton, 1999; Melia et al., 2002). This now exposes
the SNAREs to one or more of the neurotoxins (see Figure 30B). Therefore, if partially zippered
trans-SNARE complexes exist under resting conditions then VAMP is now susceptible to
cleavage by one or more neurotoxins, which can result in impaired evoked release
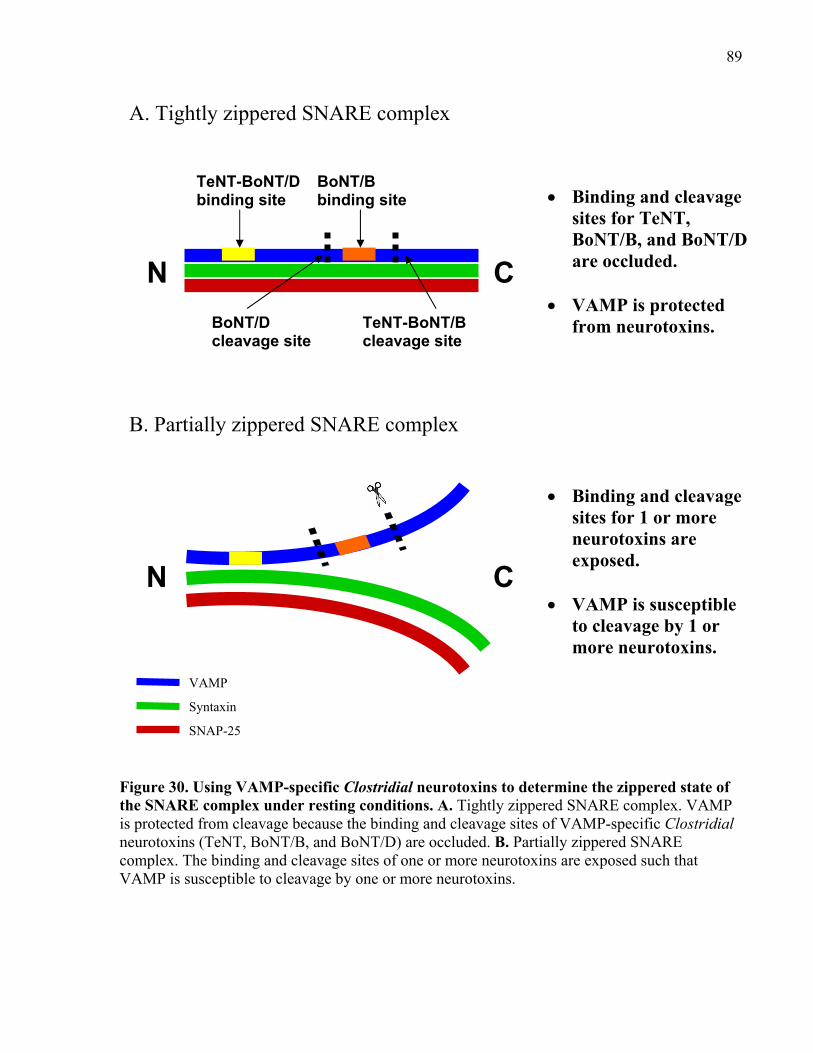
89
Figure 30. Using VAMP-specific Clostridial neurotoxins to determine the zippered state of the SNARE complex under resting conditions. A. Tightly zippered SNARE complex. VAMP is protected from cleavage because the binding and cleavage sites of VAMP-specific Clostridial neurotoxins (TeNT, BoNT/B, and BoNT/D) are occluded. B. Partially zippered SNARE complex. The binding and cleavage sites of one or more neurotoxins are exposed such that VAMP is susceptible to cleavage by one or more neurotoxins.
CN
TeNT-BoNT/D binding site
BoNT/B binding site
BoNT/D cleavage site
TeNT-BoNT/B cleavage site
N C
A. Tightly zippered SNARE complex
B. Partially zippered SNARE complex
Binding and cleavage sites for TeNT, BoNT/B, and BoNT/D are occluded.
VAMP is protected
from neurotoxins.
Binding and cleavage sites for 1 or more neurotoxins are exposed.
VAMP is susceptible
to cleavage by 1 or more neurotoxins.
VAMP
Syntaxin
SNAP-25
90
(see Hua and Charlton, 1999; Hua et al., 1998). In a third scenario, if VAMP is free and not
associated with the other SNAREs in a complex then it is expected that VAMP-specific
neurotoxins will cleave VAMP and impair evoked release under low synaptic activity.
The quantal content of phasic release is significantly larger than tonic release from both
the leg extensor and claw opener muscles (Msghina et al., 1998). However, the quantal content
of the leg extensor tonic synapses are lower than those of the claw opener tonic synapses (Hatt
and Smith, 1976; Quigley et al., 1999; Wojtowicz et al., 1991; Zucker, 1973). Therefore, there is
the possibility that the trans-SNARE complexes at the tonic synapses of the leg extensor may be
more unzippered than those of the tonic synapses of the claw opener.
3.1 Crayfish neuronal VAMP is cleaved by Clostridial neurotoxins in-vitro
Vesicle-associated membrane protein (VAMP)-specific tetanus neurotoxin light-chain
(TeNT-LC) and botulinum neurotoxins B and D light-chain (BoNT/B-LC and BoNT/D-LC,
respectively) were purchased from List Biologicals Laboratories, Inc. (Campbell, CA., USA).
The light-chain is non-toxic and safe to handle as it does not contain the heavy-chain required for
uptake into cells. The freeze-dried form of each neurotoxin was reconstituted with 100mM KCl
such that the concentration of TeNT-LC and BoNT/B-LC were 0.5µg/µL and BoNT/D-LC was
0.3µg/µL (similar to Hua and Charlton (1999) except that the concentration of TeNT-LC and
BoNT/B-LC I used was lower because the volume of the KCl solution required for a
concentration greater than 0.5µg/µL was not sufficient to completely dissolve the lyophilized
neurotoxin). The neurotoxins were stored at -70C and used within four weeks after they were
reconstituted because the efficacy of the neurotoxins was reduced after four weeks. Control
neurotoxin solutions were placed in a boiling water bath for 30min to denature and inactivate
them.
To verify the activity and specificity of the neurotoxins, the protein sample obtained from
crayfish nerve cords was incubated with each neurotoxin separately and subjected to SDS-PAGE
and Western blotting using a polyclonal guinea pig VAMP antibody (made to the SNARE motif
of human VAMP-2; gift from Dr. C.C. Shone, University of Bath, Claverton Down, Bath, UK)
to detect uncleaved VAMP. The antibody’s epitope spans the cleavage sites of TeNT/BoNT/B
and BoNT/D, and therefore, cleaved VAMP will not be detected using the VAMP antibody and
91
no protein band will appear in Western blots (see Hua and Charlton, 1999; Hua et al., 1998; Li et
al., 1994). A detailed outline of the protein extraction, SDS-PAGE, and Western blotting
protocols are given in Chapter 2.5.
Crayfish protein samples (10µg) were mixed with one of the three neurotoxins (active or
inactive forms) in a 1.5mL microfuge vial and were placed in an incubator-shaker at 37°C,
170rpm for 2.5hrs. After incubation, the samples were subjected to SDS-PAGE and Western
blotting. The VAMP antibody was used at a dilution of 1:500 and the polyclonal rabbit Actin
antibody (A5060, Sigma-Aldrich) was used at a dilution of 1:1000 (Actin staining was used to
verify equal loading of protein sample in each lane in the gel used for SDS-PAGE). A goat anti-
guinea pig antibody tagged with HRP (Jackson ImmunoResearch, Inc.) was used at a dilution of
1:2000 to detect the VAMP antibody, and a goat anti-rabbit antibody tagged with HRP (Jackson
ImmunoResearch, Inc.) was used at a dilution of 1:2000 to detect the Actin antibody.
The Western blot (Figure 31) showed that inactivated neurotoxins did not cleave crayfish
VAMP because a single band representing VAMP of 18kDa for each control sample was
observed. In the presence of each active neurotoxin, however, VAMP staining was not observed.
This indicated that VAMP was cleaved by each neurotoxin in-vitro, and that crayfish VAMP
contains the binding and cleavage sites for BoNT/B, BoNT/D, and TeNT. The results were the
same as previously shown by Hua et al. (1998) using protein samples from the crayfish nerve
cord and the same VAMP antibody.
The VAMP antibody revealed a single band for each control neurotoxin solution. It
would appear that there is only one isoform of crayfish neuronal VAMP, which would parallel
the cloning and sequencing results for crayfish VAMP showing the presence of only one amino
acid sequence from seven different bacterial colonies analyzed (see Chapter 4.1, Figure 61).
However, the presence of another VAMP isoform of similar molecular weight could not be ruled
out. For instance, VAMP-1 and -2 isoforms can have similar molecular weights, and therefore,
can appear in approximately the same spot on a Western blot (Elferink et al., 1989; Rossetto et
al., 1996; Trimble et al., 1988).
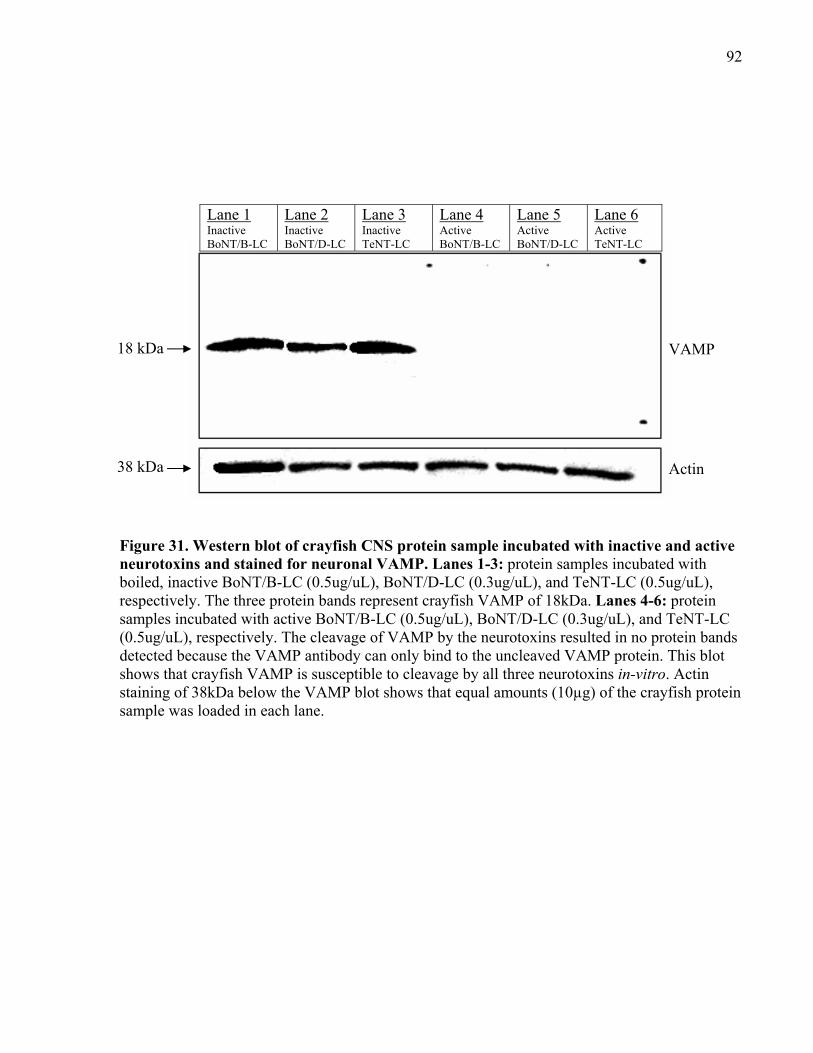
92
Figure 31. Western blot of crayfish CNS protein sample incubated with inactive and active neurotoxins and stained for neuronal VAMP. Lanes 1-3: protein samples incubated with boiled, inactive BoNT/B-LC (0.5ug/uL), BoNT/D-LC (0.3ug/uL), and TeNT-LC (0.5ug/uL), respectively. The three protein bands represent crayfish VAMP of 18kDa. Lanes 4-6: protein samples incubated with active BoNT/B-LC (0.5ug/uL), BoNT/D-LC (0.3ug/uL), and TeNT-LC (0.5ug/uL), respectively. The cleavage of VAMP by the neurotoxins resulted in no protein bands detected because the VAMP antibody can only bind to the uncleaved VAMP protein. This blot shows that crayfish VAMP is susceptible to cleavage by all three neurotoxins in-vitro. Actin staining of 38kDa below the VAMP blot shows that equal amounts (10µg) of the crayfish protein sample was loaded in each lane.
Lane 1 Inactive BoNT/B-LC
Lane 2 Inactive BoNT/D-LC
Lane 3 Inactive TeNT-LC
Lane 4 Active BoNT/B-LC
Lane 5 Active BoNT/D-LC
Lane 6 Active TeNT-LC
VAMP
Actin
18 kDa
38 kDa
93
3.2 Using Clostridial neurotoxins to determine the zippered state of the SNARE complex
The previous work by Hua and Charlton (1999) and Hua et al. (1998) showed that axonal
activity can influence the effects of TeNT-LC and BoNT/B/D-LC at the tonic synapses of the
crayfish claw opener muscle. Under low axonal activity only BoNT/B-LC inhibited release
whereas all three neurotoxins inhibited release under high frequency stimulation (the inhibitory
effect of BoNT/B-LC was accelerated). The results indicated that under resting conditions the
SNARE complex is partially zippered such that the N-terminal half of VAMP is occluded and
the C-terminal half is exposed. Therefore, the shared binding site of TeNT-LC and BoNT/D-LC
on VAMP is blocked but the more C-terminal binding and cleavage sites of BoNT/B-LC are
exposed. However, the results from high frequency stimulation revealed that a significant portion
of the VAMP molecule is exposed during multiple rounds of vesicle fusion, which is why
VAMP was susceptible to cleavage by all three neurotoxins. During high frequency stimulation,
there is a rapid turnover of vesicles, during which the SNAREs initially tightly zipper to initiate
fusion and then dissociate to prepare for another round of fusion. This cycle repeats as along as
stimulation is applied. It is during the dissociation of the SNARE complex that VAMP is
completely exposed such that it is susceptible not only to BoNT/B-LC but also to TeNT-LC and
BoNT/D-LC. Therefore, measuring the effects of TeNT-LC and BoNT/B/D-LC under low and
high frequencies of stimulation can help to assess the zippered state of the SNARE complex.
Using TeNT-LC and BoNT/B/D-LC, the stimulation protocols used by Hua and Charlton
(1999) and Hua et al. (1998) were adopted and modified for this thesis to examine the zippered
state of the SNARE complex at phasic and tonic synapses that innervate the crayfish walking leg
extensor muscle.
3.2.1 Neurotoxin preparation for pressure injection
The freeze-dried form of each neurotoxin (TeNT-LC and BoNT/B/D-LC) was
reconstituted with a solution consisting of 100mM KCl and 300M 3kDa dextran Texas red
fluorescent dye (Invitrogen) such that the concentration of TeNT-LC and BoNT/B-LC were
0.5µg/µL and BoNT/D-LC was 0.3µg/µL (similar to Hua and Charlton (1999) except that the
concentration of TeNT-LC and BoNT/B-LC I used was lower because the volume of the KCl-
Texas red dye solution required for a concentration greater than 0.5µg/µL was not sufficient to
94
completely dissolve the lyophilized neurotoxin). The fluorescent dye was used to monitor
neurotoxin injection. The neurotoxins were stored at -70C and used within four weeks after they
were reconstituted because the efficacy of the neurotoxins was reduced after four weeks.
Neurotoxin solutions placed in a boiling water bath for 30min, which would denature and
inactivate the neurotoxins, were used as controls for pressure injection.
3.2.2 Immunocytochemistry procedure following neurotoxin injection experiments
Once the neurotoxin pressure injection experiments were completed, the preparations
were used for immunocytochemistry to determine if the injected neurotoxin cleaved VAMP in
the phasic or tonic axonal terminals. The immunocytochemistry protocol was followed as
outlined in Chapter 2.4. The polyclonal guinea pig VAMP antibody used for Western blots in
section 3.1 was used to stain for VAMP, in which the antibody will only detect the uncleaved
form of VAMP. A 1:100 dilution was used. A polyclonal rabbit Synapsin (G304) antibody (gift
from Dr. H-T. Kao, Brown University, Providence, RI., USA) was used as a synaptic vesicle
marker (1:300 dilution). A goat anti-guinea pig antibody tagged with Alexa 488 fluorescent dye
(Invitrogen) was used at a dilution of 1:500 to detect the VAMP antibody. A goat anti-rabbit
antibody tagged with Alexa 594 fluorescent dye (Invitrogen) was used at a dilution of 1:500 to
detect the Synapsin antibody.
3.2.3 The SNARE complex is partially zippered at rest at both phasic and tonic synapses
To determine the zippered state of the SNARE complex under resting conditions at
phasic and tonic synapses, a low stimulation paradigm using TeNT-LC and BoNT/B/D-LC was
used which is described below. The purpose of this stimulation paradigm was to apply as little
evoked stimulation as possible such to determine the effects of the neurotoxins under resting
conditions. The zippered state of the SNARE complex was determined by observing whether or
not VAMP was cleaved by the three neurotoxins and, therefore, if the evoked response was
inhibited. If all three neurotoxins fail to cleave VAMP and thus fail to inhibit release, then this
would indicate that VAMP is in a tightly zippered SNARE complex. However, if one or more of
the neurotoxins cleave VAMP and thus inhibit release, then this would indicate that VAMP is in
a partially zippered SNARE complex (see Hayashi et al., 1994; Hua and Charlton, 1999; Hua et
al., 1998).
95
Baseline recordings and pressure injection were performed as described in Chapter 2.6.
After neurotoxin injection, phasic or tonic responses were recorded immediately, 2hrs and 4hrs
after injection to determine the effect of the neurotoxin on the evoked response. The phasic axon
was stimulated using the phasic baseline stimulation protocol, and the average of three EPSPs at
each time point was used for analyses. The tonic axon was stimulated using the tonic baseline
stimulation protocol, and the average of three EPSPs (last EPSP in each trace) was used at each
time point for analyses. The measured responses were normalized by expressing each measured
EPSP amplitude as a percentage of the initial baseline EPSP amplitude (time = 0min). The goal
of this experimental protocol was to determine the activity-independent effects (resting
condition) of the neurotoxins (see Hua and Charlton, 1999). The timeline of this protocol is given
in Figure 32A. It should be noted that the phasic response exhibited a stimulation-independent
depression that is superimposed on all phasic responses in this and subsequent experiments in
this thesis. The cause of this phenomenon remains unknown (see Appendix 1).
3.2.3.1 Effects of TeNT-LC and BoNT/D-LC under low stimulation
The injection of TeNT-LC and BoNT/D-LC had no effect on the evoked phasic and tonic
responses under the low stimulation protocol (see Figure 33 for phasic and tonic EPSP traces;
Figures 36 and 38 for phasic data; Figures 37 and 39 for tonic data). These results were similar to
the effects of the injection of the same but inactivated neurotoxins (see Figures 40 (phasic) and
41 (tonic) for percent differences between active and inactive neurotoxins). This finding
paralleled the immunocytochemistry results showing VAMP staining in both phasic (Figures 42
and 44) and tonic (Figures 43 and 45) axonal terminals, indicating that VAMP was not cleaved
by either neurotoxin. In addition, action potentials recorded from the phasic (Figure 46) and tonic
(Figure 47) axons were unaffected by the neurotoxins.
3.2.3.2 Effects of BoNT/B-LC under low stimulation
The injection of BoNT/B-LC resulted in a significant decline of both the phasic and tonic
evoked responses under the low stimulation protocol, first observed immediately after injection
(see Figure 33 for phasic and tonic EPSP traces; Figure 48 for phasic data; Figure 49 for tonic
data; percent difference between active and inactive BoNT/B-LC is presented in Figures 40
(phasic) and 41 (tonic)). Immunocytochemistry paralleled the physiological results showing a
lack of VAMP staining in both axons indicating that VAMP was cleaved (Figures 50 and 51).
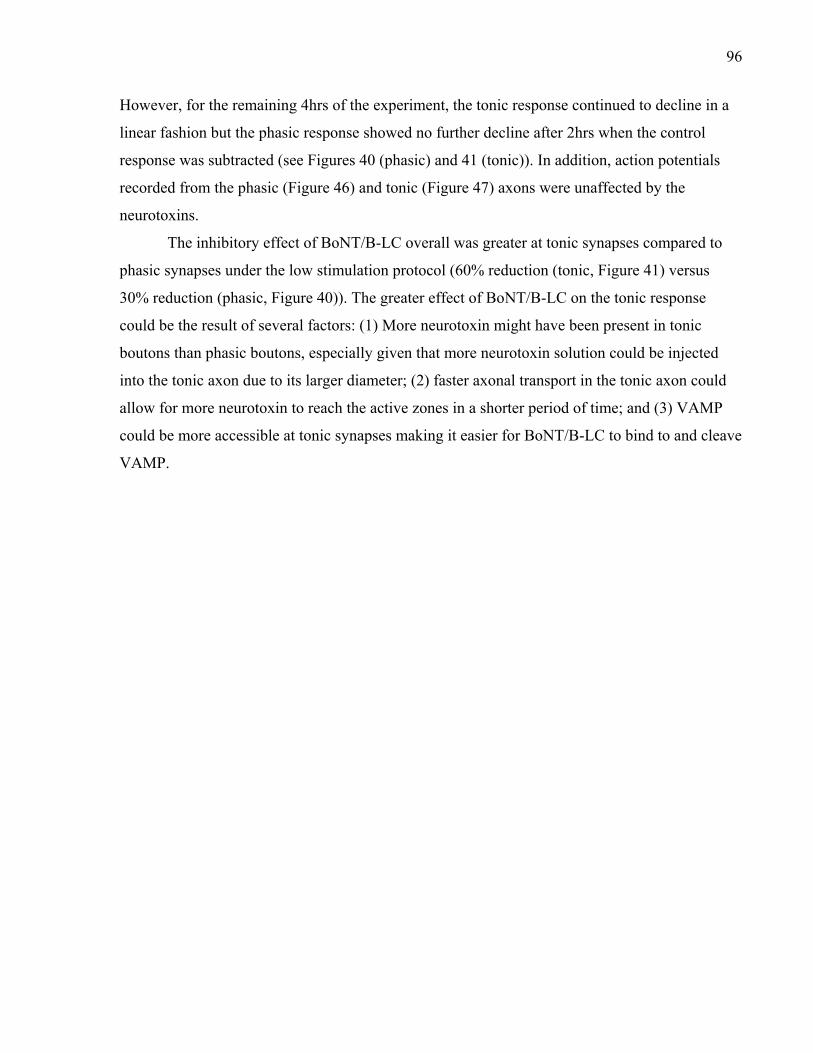
96
However, for the remaining 4hrs of the experiment, the tonic response continued to decline in a
linear fashion but the phasic response showed no further decline after 2hrs when the control
response was subtracted (see Figures 40 (phasic) and 41 (tonic)). In addition, action potentials
recorded from the phasic (Figure 46) and tonic (Figure 47) axons were unaffected by the
neurotoxins.
The inhibitory effect of BoNT/B-LC overall was greater at tonic synapses compared to
phasic synapses under the low stimulation protocol (60% reduction (tonic, Figure 41) versus
30% reduction (phasic, Figure 40)). The greater effect of BoNT/B-LC on the tonic response
could be the result of several factors: (1) More neurotoxin might have been present in tonic
boutons than phasic boutons, especially given that more neurotoxin solution could be injected
into the tonic axon due to its larger diameter; (2) faster axonal transport in the tonic axon could
allow for more neurotoxin to reach the active zones in a shorter period of time; and (3) VAMP
could be more accessible at tonic synapses making it easier for BoNT/B-LC to bind to and cleave
VAMP.
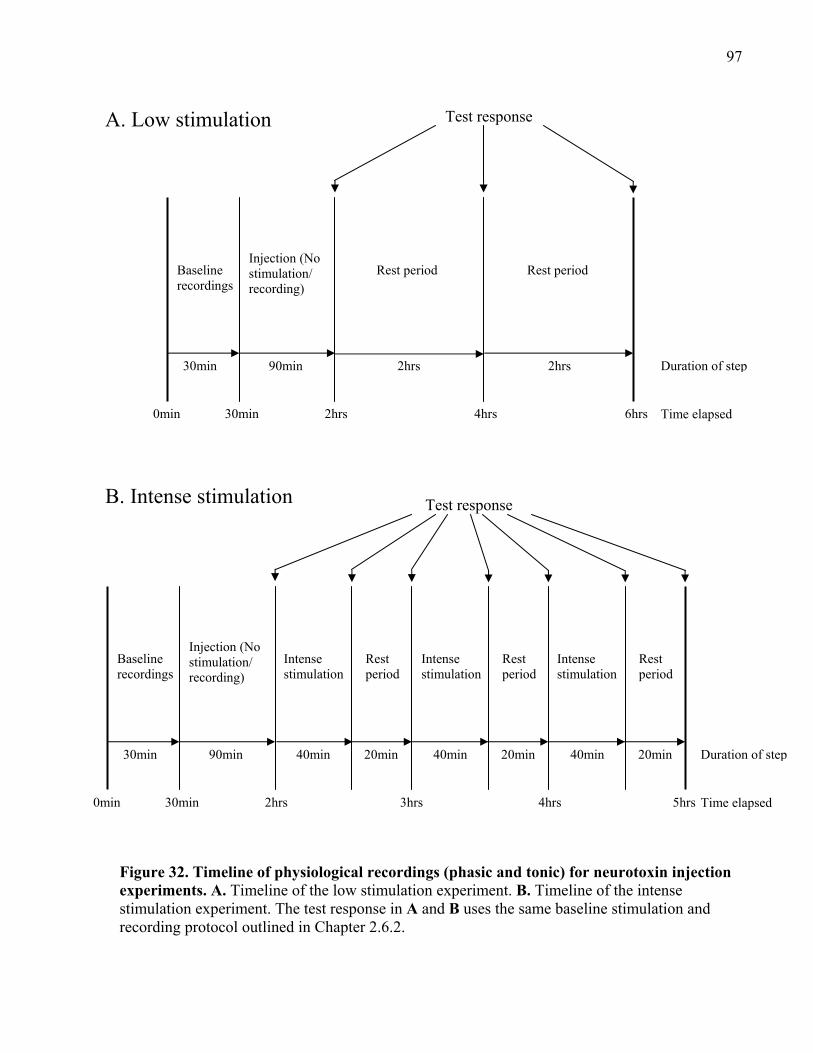
97
Figure 32. Timeline of physiological recordings (phasic and tonic) for neurotoxin injection experiments. A. Timeline of the low stimulation experiment. B. Timeline of the intense stimulation experiment. The test response in A and B uses the same baseline stimulation and recording protocol outlined in Chapter 2.6.2.
30min 90min
Baseline recordings
Injection (No stimulation/ recording)
0min 30min 2hrs
2hrs 2hrs
4hrs 6hrs
Test response
Duration of step
Time elapsed
Rest period Rest period
A. Low stimulation
B. Intense stimulation
30min 90min
Baseline recordings
Injection (No stimulation/ recording)
Rest period
0min 30min 2hrs 3hrs 4hrs
Duration of step
Time elapsed
Test response
Rest period
Rest period
40min 20min 40min 20min 40min 20min
5hrs
Intense stimulation
Intense stimulation
Intense stimulation
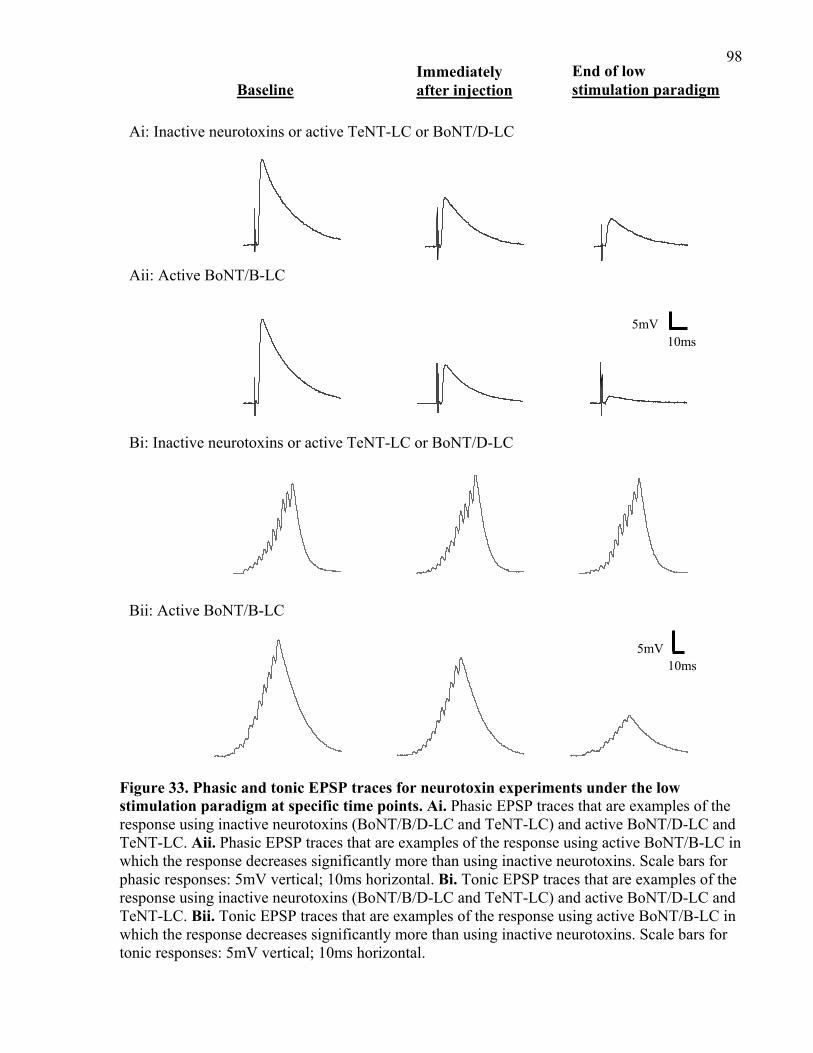
98
Figure 33. Phasic and tonic EPSP traces for neurotoxin experiments under the low stimulation paradigm at specific time points. Ai. Phasic EPSP traces that are examples of the response using inactive neurotoxins (BoNT/B/D-LC and TeNT-LC) and active BoNT/D-LC and TeNT-LC. Aii. Phasic EPSP traces that are examples of the response using active BoNT/B-LC in which the response decreases significantly more than using inactive neurotoxins. Scale bars for phasic responses: 5mV vertical; 10ms horizontal. Bi. Tonic EPSP traces that are examples of the response using inactive neurotoxins (BoNT/B/D-LC and TeNT-LC) and active BoNT/D-LC and TeNT-LC. Bii. Tonic EPSP traces that are examples of the response using active BoNT/B-LC in which the response decreases significantly more than using inactive neurotoxins. Scale bars for tonic responses: 5mV vertical; 10ms horizontal.
Ai: Inactive neurotoxins or active TeNT-LC or BoNT/D-LC
Baseline Immediately after injection
End of low stimulation paradigm
Aii: Active BoNT/B-LC
Bi: Inactive neurotoxins or active TeNT-LC or BoNT/D-LC
Bii: Active BoNT/B-LC
5 mV
10.00 ms
5 mV
10.00 ms
5mV10ms
5mV 10ms
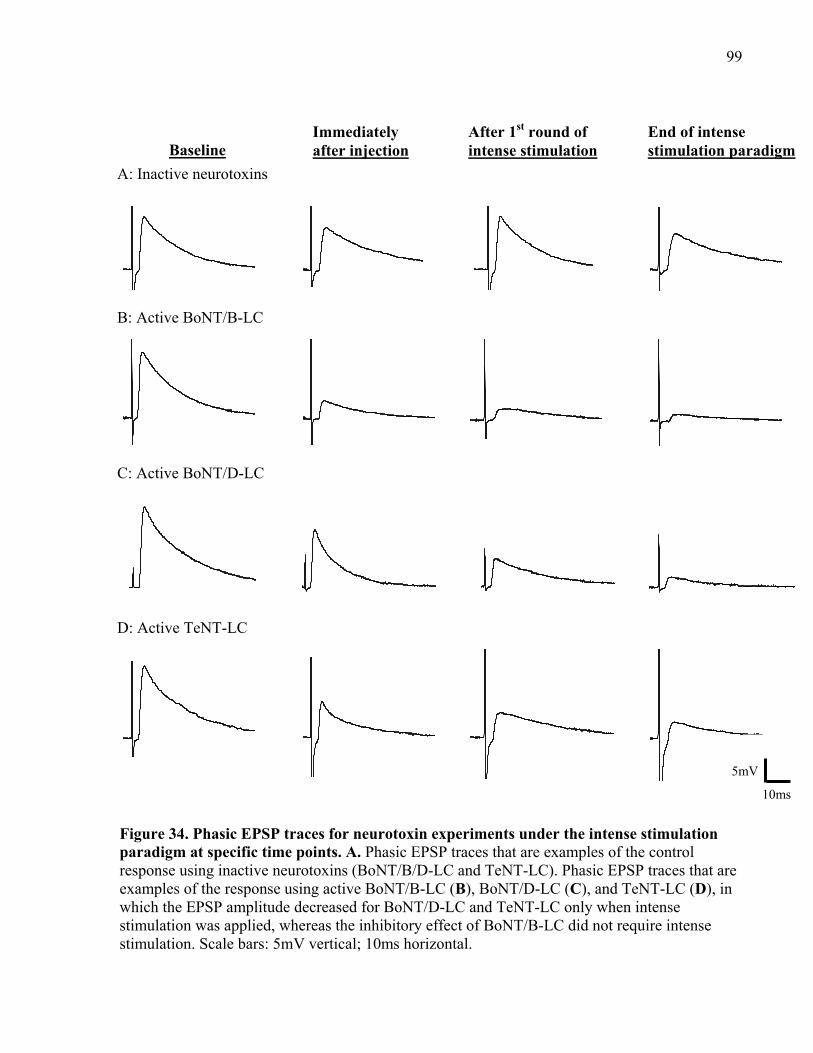
99
Figure 34. Phasic EPSP traces for neurotoxin experiments under the intense stimulation paradigm at specific time points. A. Phasic EPSP traces that are examples of the control response using inactive neurotoxins (BoNT/B/D-LC and TeNT-LC). Phasic EPSP traces that are examples of the response using active BoNT/B-LC (B), BoNT/D-LC (C), and TeNT-LC (D), in which the EPSP amplitude decreased for BoNT/D-LC and TeNT-LC only when intense stimulation was applied, whereas the inhibitory effect of BoNT/B-LC did not require intense stimulation. Scale bars: 5mV vertical; 10ms horizontal.
5 mV
10.00 ms
Baseline Immediately after injection
After 1st round of intense stimulation
End of intense stimulation paradigm
A: Inactive neurotoxins
B: Active BoNT/B-LC
C: Active BoNT/D-LC
D: Active TeNT-LC
5mV
10ms
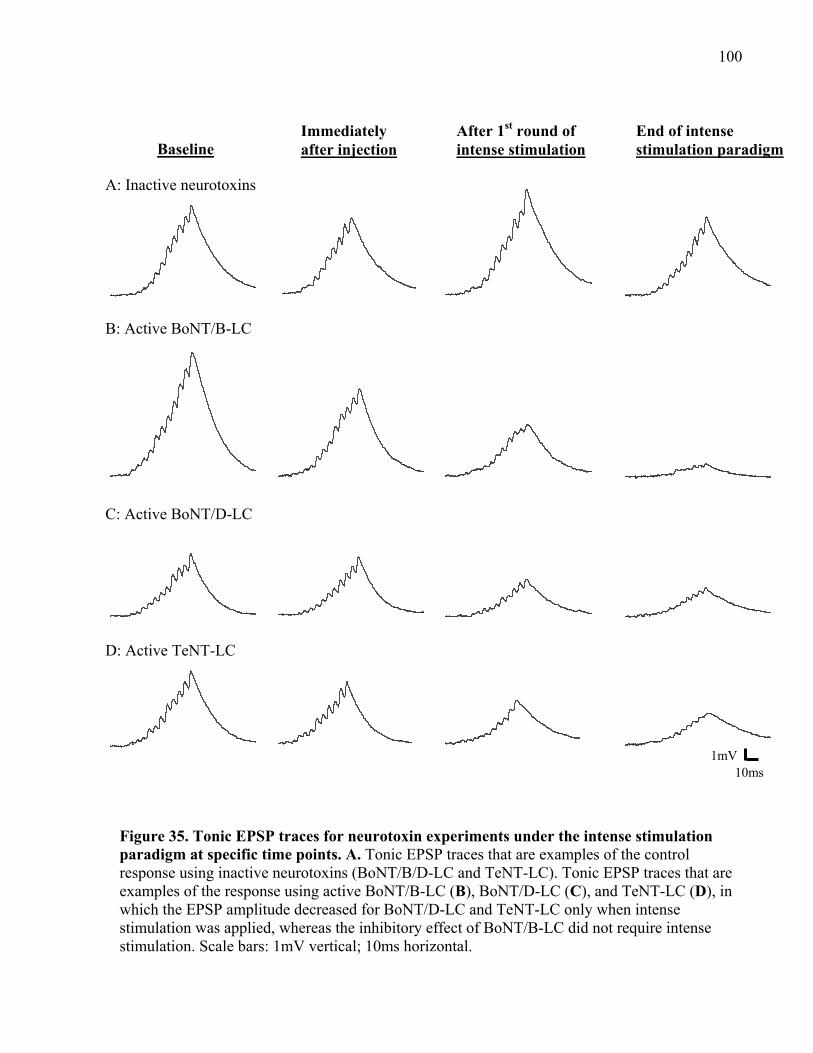
100
Figure 35. Tonic EPSP traces for neurotoxin experiments under the intense stimulation paradigm at specific time points. A. Tonic EPSP traces that are examples of the control response using inactive neurotoxins (BoNT/B/D-LC and TeNT-LC). Tonic EPSP traces that are examples of the response using active BoNT/B-LC (B), BoNT/D-LC (C), and TeNT-LC (D), in which the EPSP amplitude decreased for BoNT/D-LC and TeNT-LC only when intense stimulation was applied, whereas the inhibitory effect of BoNT/B-LC did not require intense stimulation. Scale bars: 1mV vertical; 10ms horizontal.
Baseline Immediately after injection
After 1st round of intense stimulation
End of intense stimulation paradigm
A: Inactive neurotoxins
B: Active BoNT/B-LC
C: Active BoNT/D-LC
D: Active TeNT-LC
1 mV
10.00 ms
1mV10ms
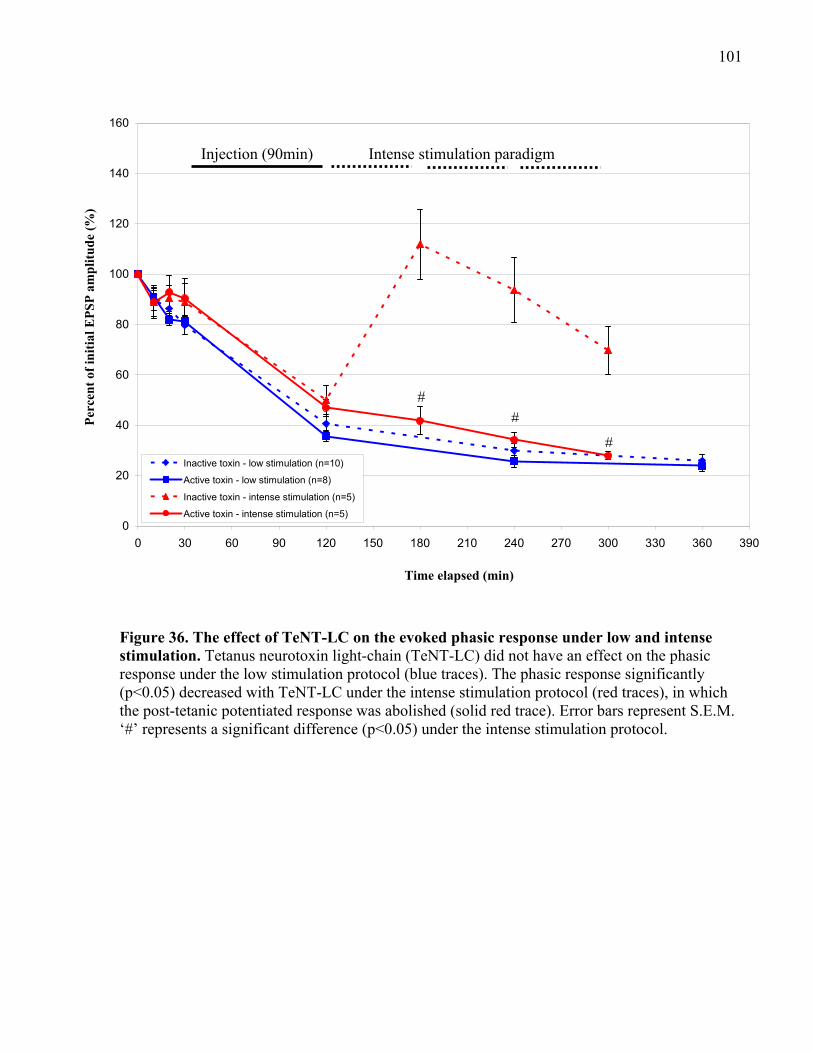
101
0
20
40
60
80
100
120
140
160
0 30 60 90 120 150 180 210 240 270 300 330 360 390
Per
cen
t of
init
ial E
PS
P a
mp
litu
de
(%)
Time elapsed (min)
Injection (90min) Intense stimulation paradigm
##
#Inactive toxin - low stimulation (n=10)
Active toxin - low stimulation (n=8)
Inactive toxin - intense stimulation (n=5)
Active toxin - intense stimulation (n=5)
Figure 36. The effect of TeNT-LC on the evoked phasic response under low and intense stimulation. Tetanus neurotoxin light-chain (TeNT-LC) did not have an effect on the phasic response under the low stimulation protocol (blue traces). The phasic response significantly (p<0.05) decreased with TeNT-LC under the intense stimulation protocol (red traces), in which the post-tetanic potentiated response was abolished (solid red trace). Error bars represent S.E.M. ‘#’ represents a significant difference (p<0.05) under the intense stimulation protocol.
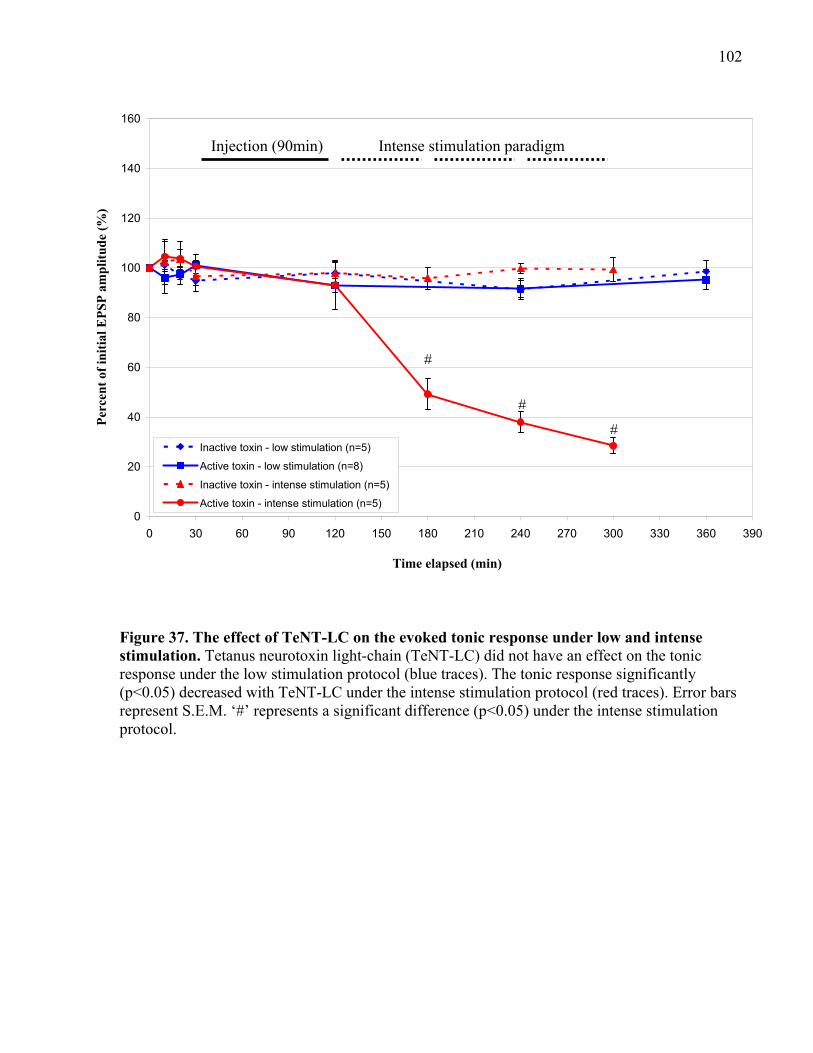
102
0
20
40
60
80
100
120
140
160
0 30 60 90 120 150 180 210 240 270 300 330 360 390
Per
cen
t of
init
ial E
PS
P a
mp
litu
de
(%)
Time elapsed (min)
Injection (90min) Intense stimulation paradigm
#
#
#Inactive toxin - low stimulation (n=5)
Active toxin - low stimulation (n=8)
Inactive toxin - intense stimulation (n=5)
Active toxin - intense stimulation (n=5)
Figure 37. The effect of TeNT-LC on the evoked tonic response under low and intense stimulation. Tetanus neurotoxin light-chain (TeNT-LC) did not have an effect on the tonic response under the low stimulation protocol (blue traces). The tonic response significantly (p<0.05) decreased with TeNT-LC under the intense stimulation protocol (red traces). Error bars represent S.E.M. ‘#’ represents a significant difference (p<0.05) under the intense stimulation protocol.
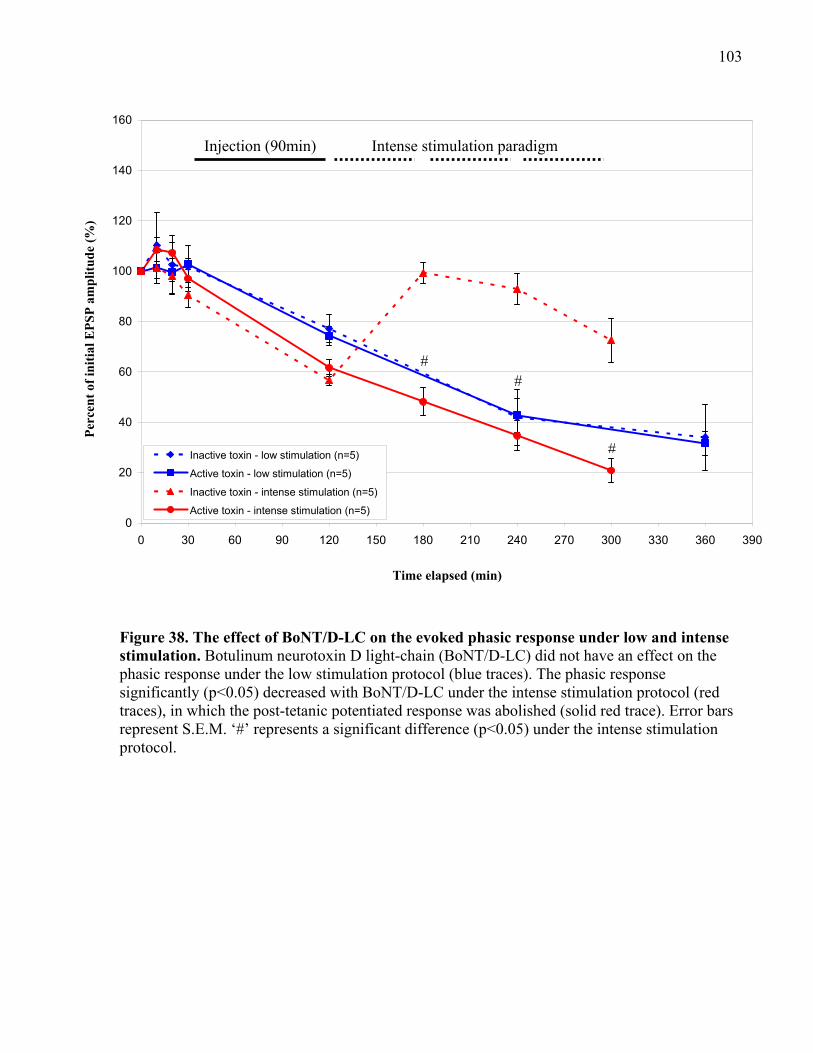
103
0
20
40
60
80
100
120
140
160
0 30 60 90 120 150 180 210 240 270 300 330 360 390
Per
cen
t of
init
ial E
PS
P a
mp
litu
de
(%)
Time elapsed (min)
Injection (90min) Intense stimulation paradigm
##
#Inactive toxin - low stimulation (n=5)
Active toxin - low stimulation (n=5)
Inactive toxin - intense stimulation (n=5)
Active toxin - intense stimulation (n=5)
Figure 38. The effect of BoNT/D-LC on the evoked phasic response under low and intense stimulation. Botulinum neurotoxin D light-chain (BoNT/D-LC) did not have an effect on the phasic response under the low stimulation protocol (blue traces). The phasic response significantly (p<0.05) decreased with BoNT/D-LC under the intense stimulation protocol (red traces), in which the post-tetanic potentiated response was abolished (solid red trace). Error bars represent S.E.M. ‘#’ represents a significant difference (p<0.05) under the intense stimulation protocol.
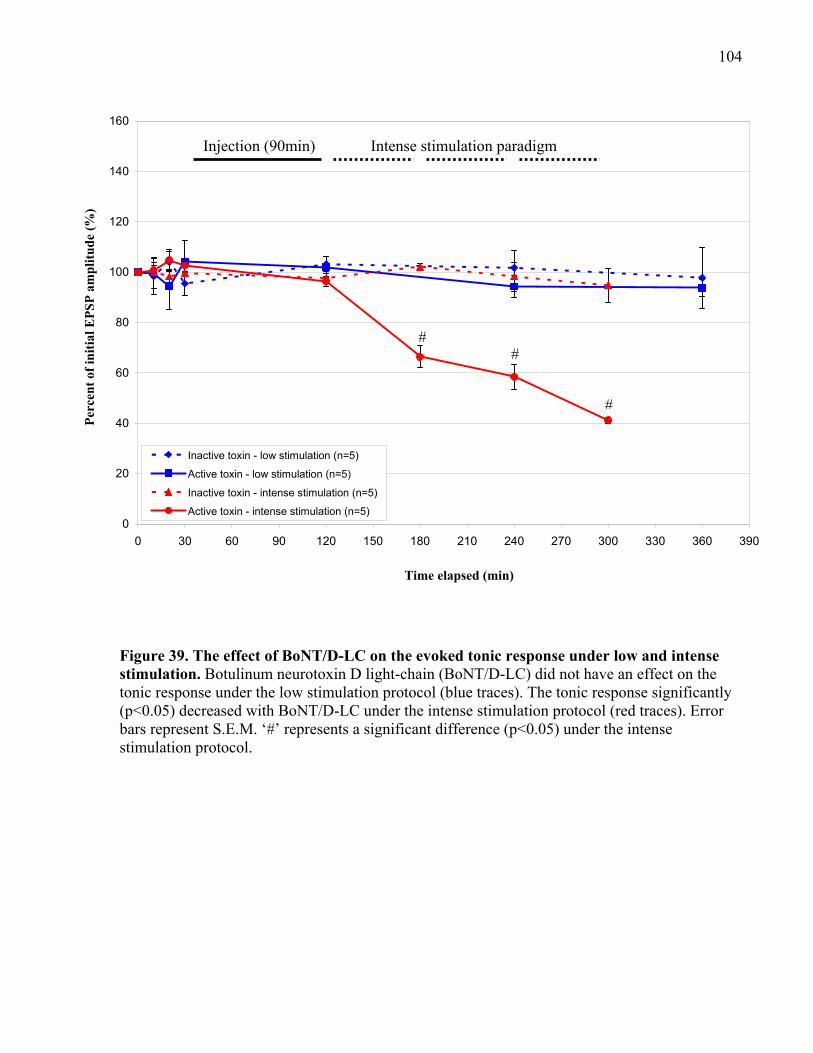
104
0
20
40
60
80
100
120
140
160
0 30 60 90 120 150 180 210 240 270 300 330 360 390
Per
cen
t of
init
ial E
PS
P a
mp
litu
de
(%)
Time elapsed (min)
Injection (90min) Intense stimulation paradigm
##
#
Inactive toxin - low stimulation (n=5)
Active toxin - low stimulation (n=5)
Inactive toxin - intense stimulation (n=5)
Active toxin - intense stimulation (n=5)
Figure 39. The effect of BoNT/D-LC on the evoked tonic response under low and intense stimulation. Botulinum neurotoxin D light-chain (BoNT/D-LC) did not have an effect on the tonic response under the low stimulation protocol (blue traces). The tonic response significantly (p<0.05) decreased with BoNT/D-LC under the intense stimulation protocol (red traces). Error bars represent S.E.M. ‘#’ represents a significant difference (p<0.05) under the intense stimulation protocol.
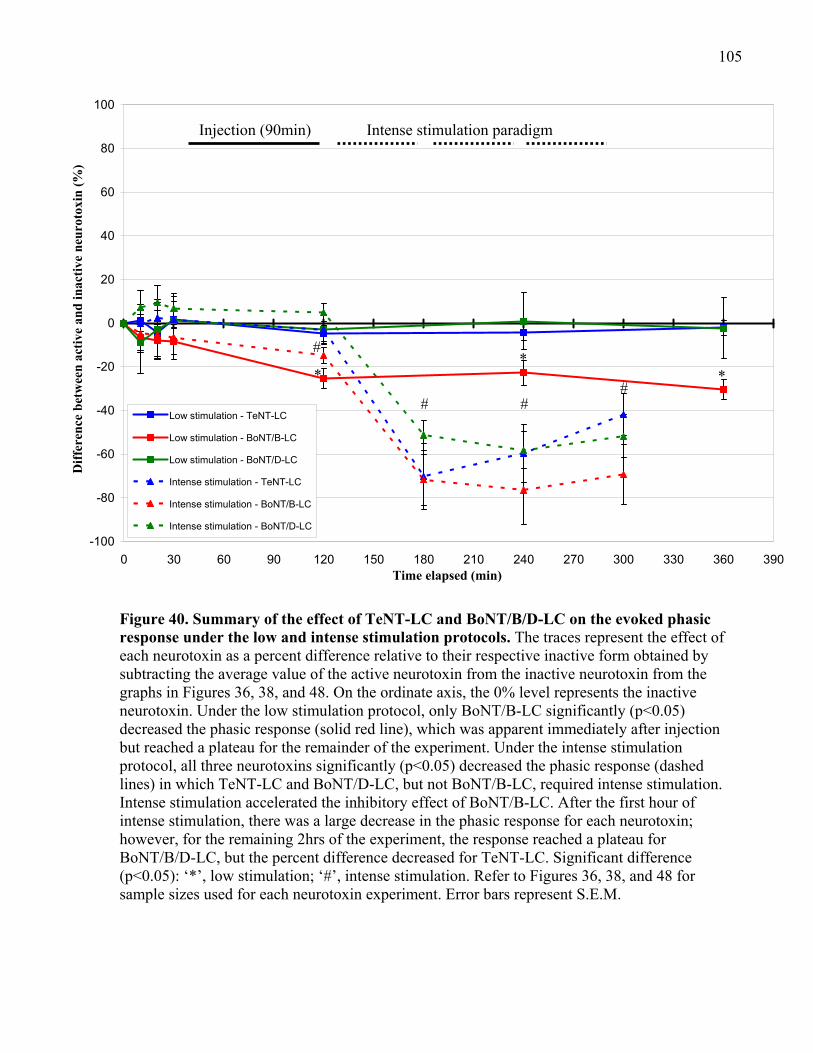
105
-100
-80
-60
-40
-20
0
20
40
60
80
100
0 30 60 90 120 150 180 210 240 270 300 330 360 390
Dif
fere
nce
bet
wee
n a
ctiv
e an
d in
acti
ve n
euro
toxi
n (
%)
Time elapsed (min)
Low stimulation - TeNT-LC
Low stimulation - BoNT/B-LC
Low stimulation - BoNT/D-LC
Intense stimulation - TeNT-LC
Intense stimulation - BoNT/B-LC
Intense stimulation - BoNT/D-LC
Injection (90min) Intense stimulation paradigm
# ##
#
**
*
Figure 40. Summary of the effect of TeNT-LC and BoNT/B/D-LC on the evoked phasic response under the low and intense stimulation protocols. The traces represent the effect of each neurotoxin as a percent difference relative to their respective inactive form obtained by subtracting the average value of the active neurotoxin from the inactive neurotoxin from the graphs in Figures 36, 38, and 48. On the ordinate axis, the 0% level represents the inactive neurotoxin. Under the low stimulation protocol, only BoNT/B-LC significantly (p<0.05) decreased the phasic response (solid red line), which was apparent immediately after injection but reached a plateau for the remainder of the experiment. Under the intense stimulation protocol, all three neurotoxins significantly (p<0.05) decreased the phasic response (dashed lines) in which TeNT-LC and BoNT/D-LC, but not BoNT/B-LC, required intense stimulation. Intense stimulation accelerated the inhibitory effect of BoNT/B-LC. After the first hour of intense stimulation, there was a large decrease in the phasic response for each neurotoxin; however, for the remaining 2hrs of the experiment, the response reached a plateau for BoNT/B/D-LC, but the percent difference decreased for TeNT-LC. Significant difference (p<0.05): ‘*’, low stimulation; ‘#’, intense stimulation. Refer to Figures 36, 38, and 48 for sample sizes used for each neurotoxin experiment. Error bars represent S.E.M.
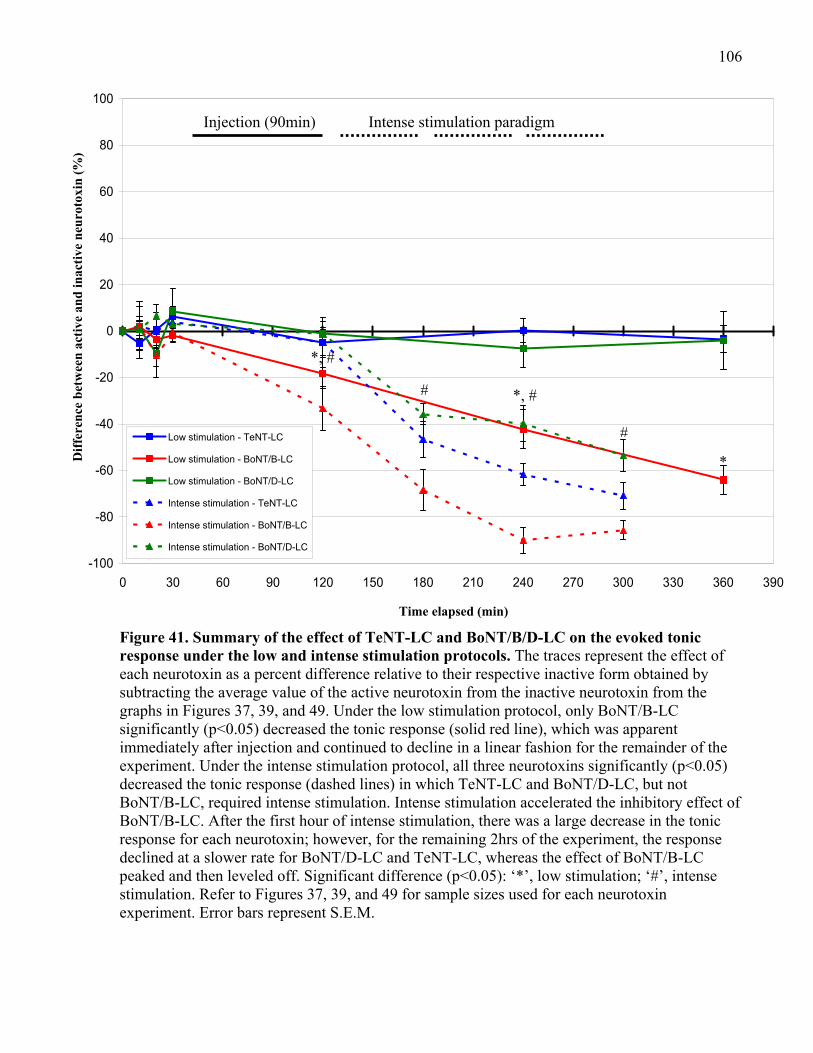
106
-100
-80
-60
-40
-20
0
20
40
60
80
100
0 30 60 90 120 150 180 210 240 270 300 330 360 390
Dif
fere
nce
bet
wee
n a
ctiv
e an
d in
acti
ve n
euro
toxi
n (
%)
Time elapsed (min)
Low stimulation - TeNT-LC
Low stimulation - BoNT/B-LC
Low stimulation - BoNT/D-LC
Intense stimulation - TeNT-LC
Intense stimulation - BoNT/B-LC
Intense stimulation - BoNT/D-LC
Injection (90min) Intense stimulation paradigm
*, #
*, #
*
#
#
Figure 41. Summary of the effect of TeNT-LC and BoNT/B/D-LC on the evoked tonic response under the low and intense stimulation protocols. The traces represent the effect of each neurotoxin as a percent difference relative to their respective inactive form obtained by subtracting the average value of the active neurotoxin from the inactive neurotoxin from the graphs in Figures 37, 39, and 49. Under the low stimulation protocol, only BoNT/B-LC significantly (p<0.05) decreased the tonic response (solid red line), which was apparent immediately after injection and continued to decline in a linear fashion for the remainder of the experiment. Under the intense stimulation protocol, all three neurotoxins significantly (p<0.05) decreased the tonic response (dashed lines) in which TeNT-LC and BoNT/D-LC, but not BoNT/B-LC, required intense stimulation. Intense stimulation accelerated the inhibitory effect of BoNT/B-LC. After the first hour of intense stimulation, there was a large decrease in the tonic response for each neurotoxin; however, for the remaining 2hrs of the experiment, the response declined at a slower rate for BoNT/D-LC and TeNT-LC, whereas the effect of BoNT/B-LC peaked and then leveled off. Significant difference (p<0.05): ‘*’, low stimulation; ‘#’, intense stimulation. Refer to Figures 37, 39, and 49 for sample sizes used for each neurotoxin experiment. Error bars represent S.E.M.
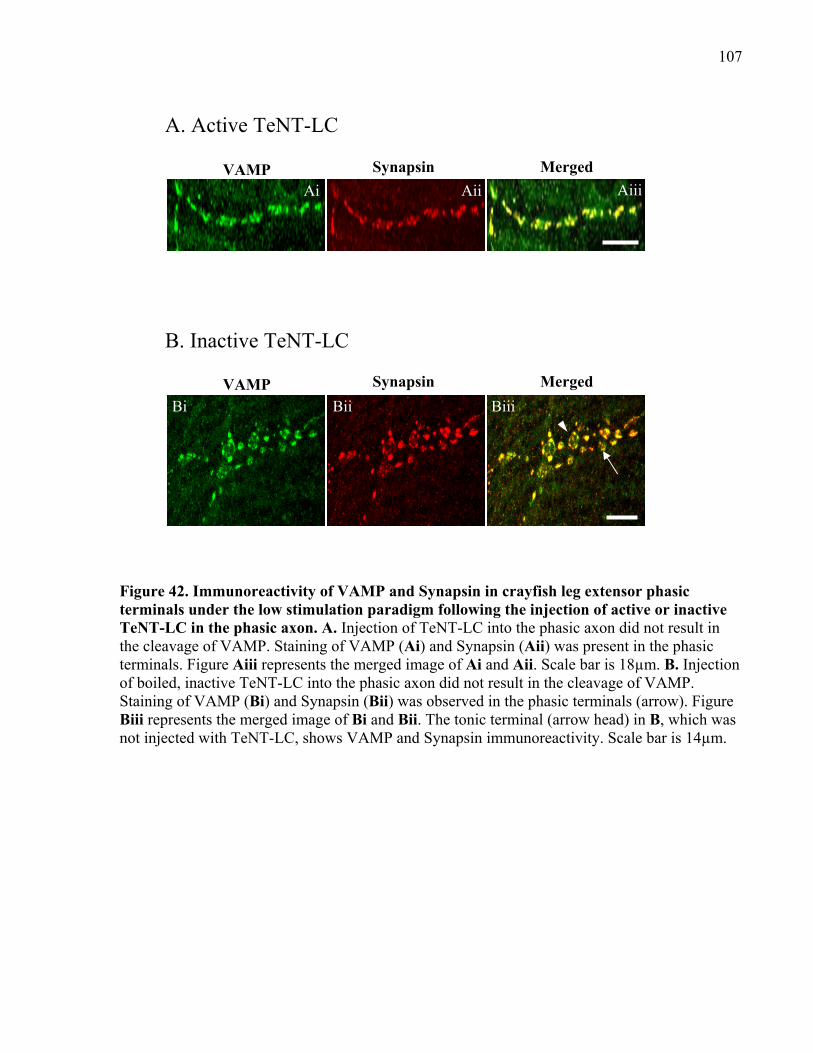
107
Figure 42. Immunoreactivity of VAMP and Synapsin in crayfish leg extensor phasic terminals under the low stimulation paradigm following the injection of active or inactive TeNT-LC in the phasic axon. A. Injection of TeNT-LC into the phasic axon did not result in the cleavage of VAMP. Staining of VAMP (Ai) and Synapsin (Aii) was present in the phasic terminals. Figure Aiii represents the merged image of Ai and Aii. Scale bar is 18µm. B. Injection of boiled, inactive TeNT-LC into the phasic axon did not result in the cleavage of VAMP. Staining of VAMP (Bi) and Synapsin (Bii) was observed in the phasic terminals (arrow). Figure Biii represents the merged image of Bi and Bii. The tonic terminal (arrow head) in B, which was not injected with TeNT-LC, shows VAMP and Synapsin immunoreactivity. Scale bar is 14µm.
Ai Aii
Bi Bii Biii
VAMP Synapsin Merged
VAMP Synapsin Merged
A. Active TeNT-LC
B. Inactive TeNT-LC
Aiii
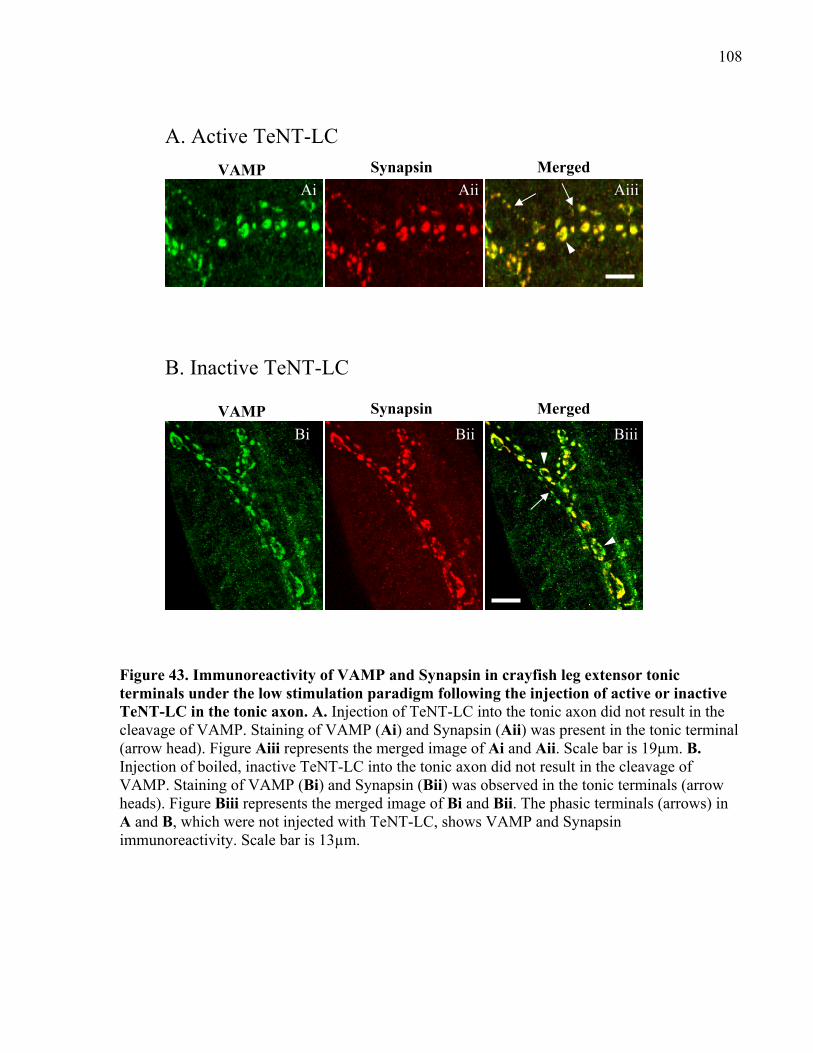
108
Ai Aii Aiii
Bi Bii Biii
VAMP Synapsin Merged
VAMP Synapsin Merged
A. Active TeNT-LC
B. Inactive TeNT-LC
Figure 43. Immunoreactivity of VAMP and Synapsin in crayfish leg extensor tonic terminals under the low stimulation paradigm following the injection of active or inactive TeNT-LC in the tonic axon. A. Injection of TeNT-LC into the tonic axon did not result in the cleavage of VAMP. Staining of VAMP (Ai) and Synapsin (Aii) was present in the tonic terminal (arrow head). Figure Aiii represents the merged image of Ai and Aii. Scale bar is 19µm. B. Injection of boiled, inactive TeNT-LC into the tonic axon did not result in the cleavage of VAMP. Staining of VAMP (Bi) and Synapsin (Bii) was observed in the tonic terminals (arrow heads). Figure Biii represents the merged image of Bi and Bii. The phasic terminals (arrows) in A and B, which were not injected with TeNT-LC, shows VAMP and Synapsin immunoreactivity. Scale bar is 13µm.
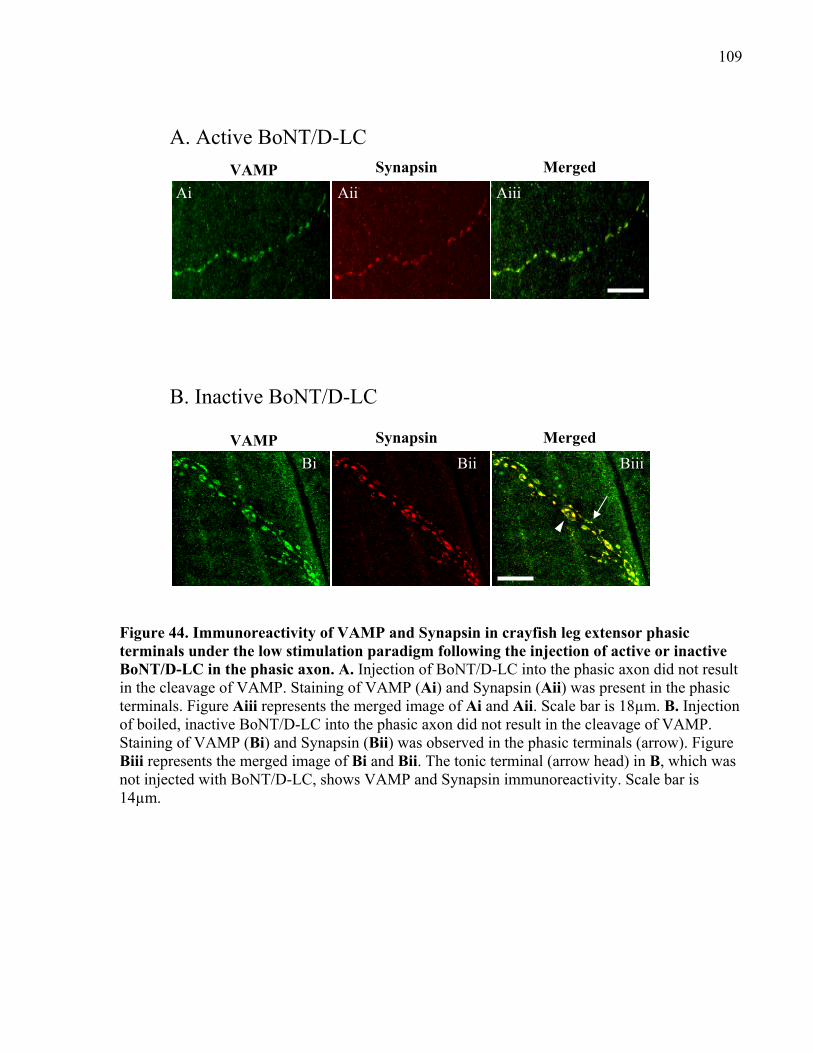
109
VAMP Synapsin Merged
VAMP Synapsin Merged
Ai Aii Aiii
Biii Bii Bi
A. Active BoNT/D-LC
B. Inactive BoNT/D-LC
Figure 44. Immunoreactivity of VAMP and Synapsin in crayfish leg extensor phasic terminals under the low stimulation paradigm following the injection of active or inactive BoNT/D-LC in the phasic axon. A. Injection of BoNT/D-LC into the phasic axon did not result in the cleavage of VAMP. Staining of VAMP (Ai) and Synapsin (Aii) was present in the phasic terminals. Figure Aiii represents the merged image of Ai and Aii. Scale bar is 18µm. B. Injection of boiled, inactive BoNT/D-LC into the phasic axon did not result in the cleavage of VAMP. Staining of VAMP (Bi) and Synapsin (Bii) was observed in the phasic terminals (arrow). Figure Biii represents the merged image of Bi and Bii. The tonic terminal (arrow head) in B, which was not injected with BoNT/D-LC, shows VAMP and Synapsin immunoreactivity. Scale bar is 14µm.
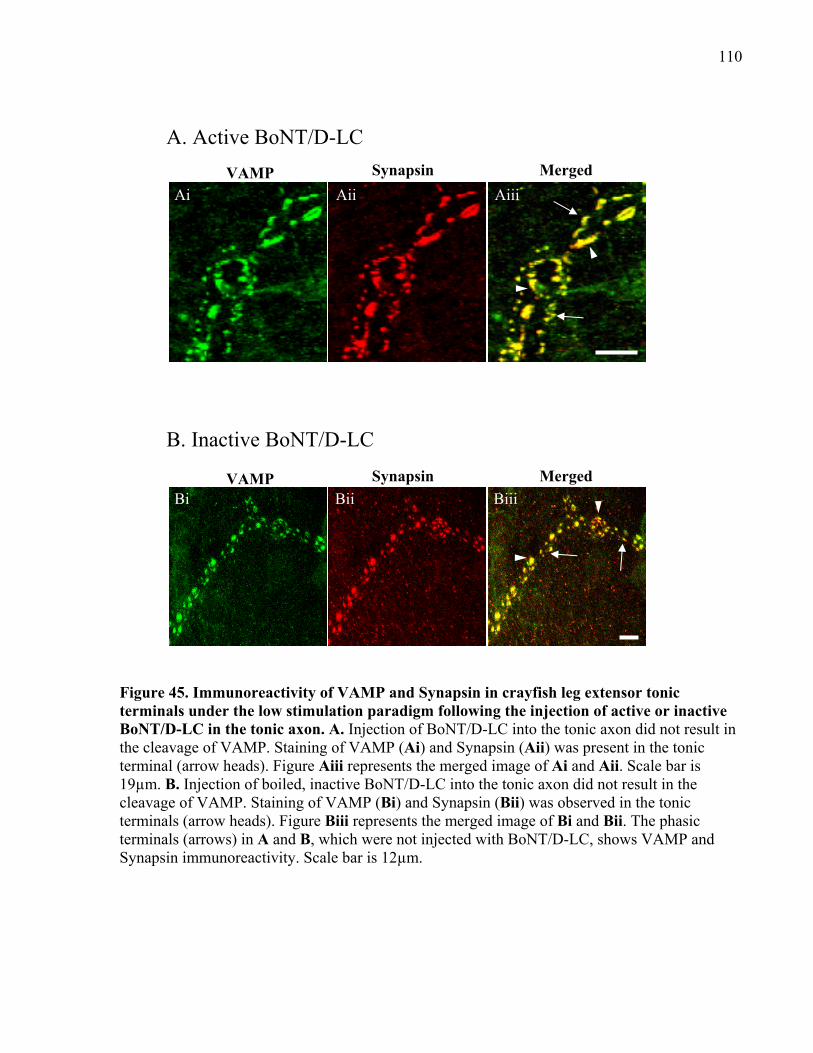
110
VAMP Synapsin Merged
VAMP Synapsin Merged
Ai Aii Aiii
Bi Bii Biii
A. Active BoNT/D-LC
B. Inactive BoNT/D-LC
Figure 45. Immunoreactivity of VAMP and Synapsin in crayfish leg extensor tonic terminals under the low stimulation paradigm following the injection of active or inactive BoNT/D-LC in the tonic axon. A. Injection of BoNT/D-LC into the tonic axon did not result in the cleavage of VAMP. Staining of VAMP (Ai) and Synapsin (Aii) was present in the tonic terminal (arrow heads). Figure Aiii represents the merged image of Ai and Aii. Scale bar is 19µm. B. Injection of boiled, inactive BoNT/D-LC into the tonic axon did not result in the cleavage of VAMP. Staining of VAMP (Bi) and Synapsin (Bii) was observed in the tonic terminals (arrow heads). Figure Biii represents the merged image of Bi and Bii. The phasic terminals (arrows) in A and B, which were not injected with BoNT/D-LC, shows VAMP and Synapsin immunoreactivity. Scale bar is 12µm.
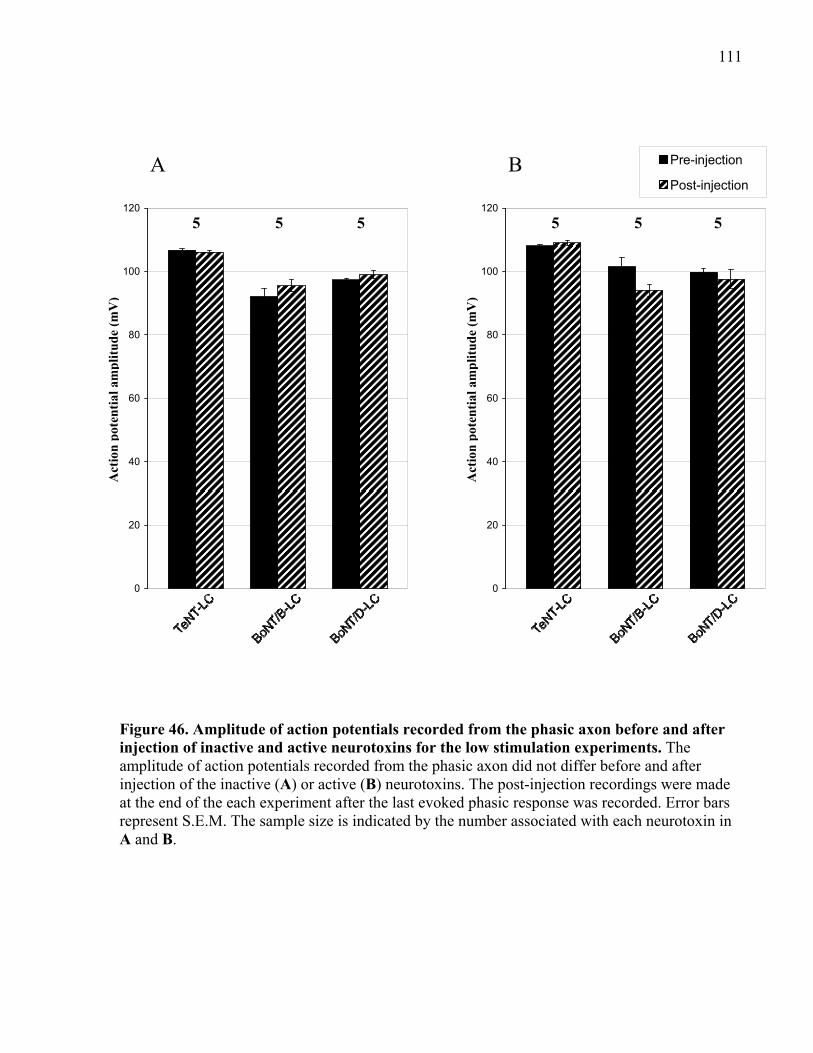
111
Figure 46. Amplitude of action potentials recorded from the phasic axon before and after injection of inactive and active neurotoxins for the low stimulation experiments. The amplitude of action potentials recorded from the phasic axon did not differ before and after injection of the inactive (A) or active (B) neurotoxins. The post-injection recordings were made at the end of the each experiment after the last evoked phasic response was recorded. Error bars represent S.E.M. The sample size is indicated by the number associated with each neurotoxin in A and B.
0
20
40
60
80
100
120
0
20
40
60
80
100
120
Pre-injection
Post-injectionA B
Act
ion
pot
enti
al a
mp
litu
de
(mV
)
Act
ion
pot
enti
al a
mp
litu
de
(mV
)
5 5 5 5 5 5
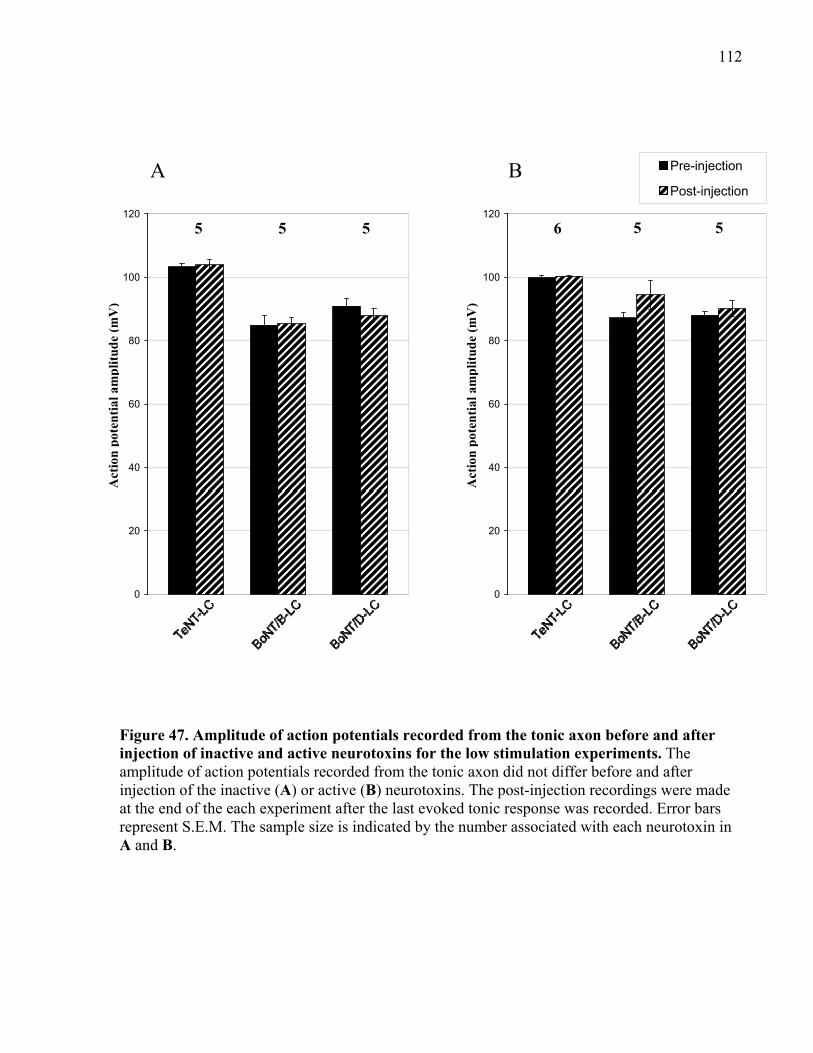
112
Figure 47. Amplitude of action potentials recorded from the tonic axon before and after injection of inactive and active neurotoxins for the low stimulation experiments. The amplitude of action potentials recorded from the tonic axon did not differ before and after injection of the inactive (A) or active (B) neurotoxins. The post-injection recordings were made at the end of the each experiment after the last evoked tonic response was recorded. Error bars represent S.E.M. The sample size is indicated by the number associated with each neurotoxin in A and B.
0
20
40
60
80
100
120
0
20
40
60
80
100
120
Pre-injection
Post-injectionA B
Act
ion
pot
enti
al a
mp
litu
de
(mV
)
Act
ion
pot
enti
al a
mp
litu
de
(mV
)
5 5 5 6 5 5
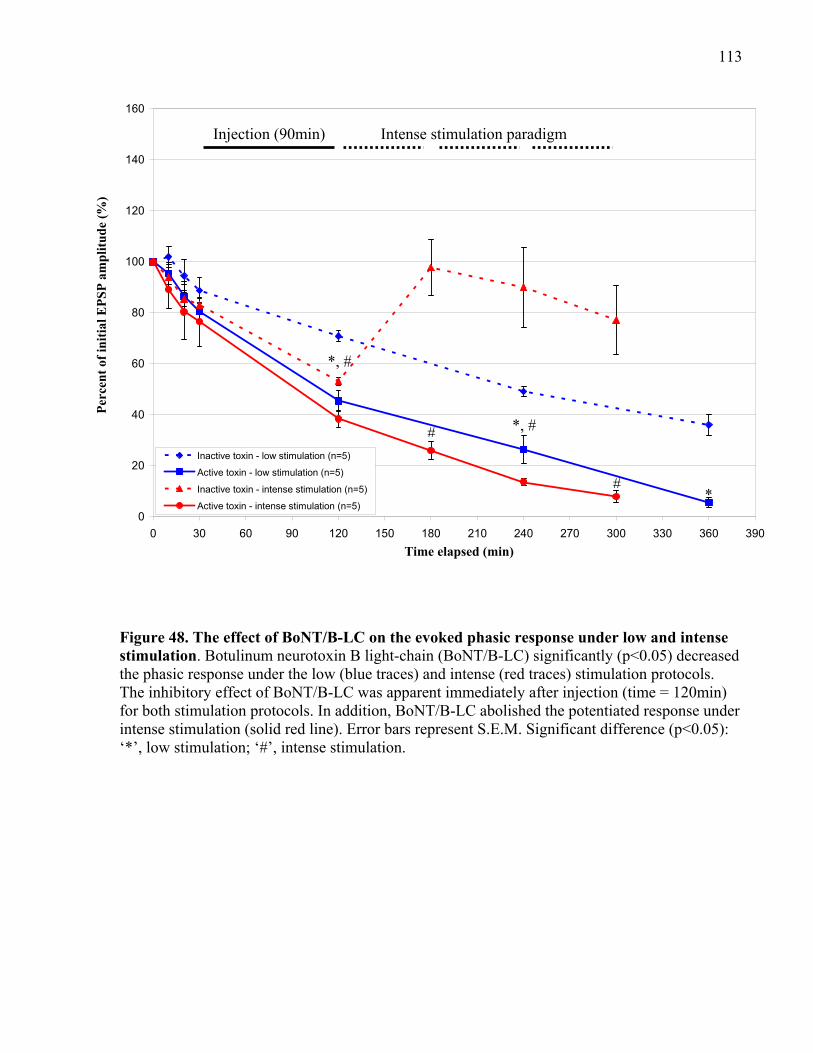
113
Time elapsed (min)
0
20
40
60
80
100
120
140
160
0 30 60 90 120 150 180 210 240 270 300 330 360 390
Per
cen
t of
init
ial E
PS
P a
mp
litu
de
(%)
Injection (90min) Intense stimulation paradigm
*
*, #
*, #
#
#
Inactive toxin - low stimulation (n=5)
Active toxin - low stimulation (n=5)
Inactive toxin - intense stimulation (n=5)
Active toxin - intense stimulation (n=5)
Figure 48. The effect of BoNT/B-LC on the evoked phasic response under low and intense stimulation. Botulinum neurotoxin B light-chain (BoNT/B-LC) significantly (p<0.05) decreased the phasic response under the low (blue traces) and intense (red traces) stimulation protocols. The inhibitory effect of BoNT/B-LC was apparent immediately after injection (time = 120min) for both stimulation protocols. In addition, BoNT/B-LC abolished the potentiated response under intense stimulation (solid red line). Error bars represent S.E.M. Significant difference (p<0.05): ‘*’, low stimulation; ‘#’, intense stimulation.
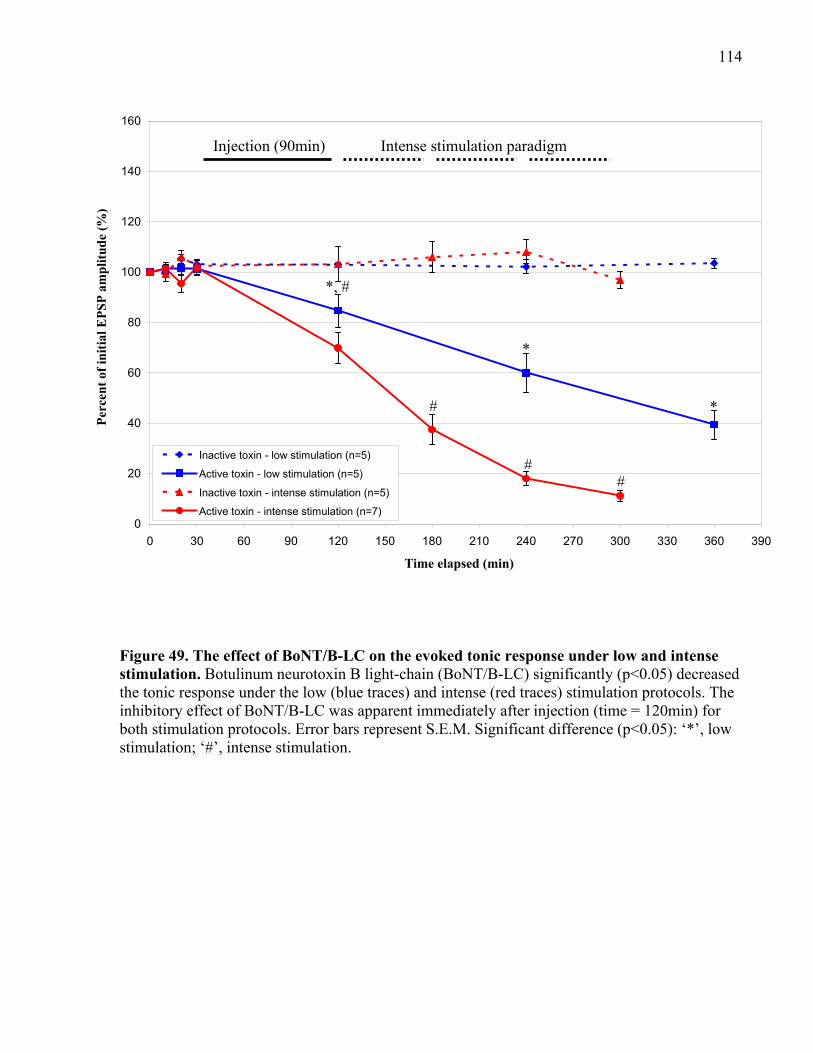
114
0
20
40
60
80
100
120
140
160
0 30 60 90 120 150 180 210 240 270 300 330 360 390
Per
cen
t of
init
ial E
PS
P a
mp
litu
de
(%)
Time elapsed (min)
Injection (90min) Intense stimulation paradigm
*, #
*
*
#
##
Inactive toxin - low stimulation (n=5)
Active toxin - low stimulation (n=5)
Inactive toxin - intense stimulation (n=5)
Active toxin - intense stimulation (n=7)
Figure 49. The effect of BoNT/B-LC on the evoked tonic response under low and intense stimulation. Botulinum neurotoxin B light-chain (BoNT/B-LC) significantly (p<0.05) decreased the tonic response under the low (blue traces) and intense (red traces) stimulation protocols. The inhibitory effect of BoNT/B-LC was apparent immediately after injection (time = 120min) for both stimulation protocols. Error bars represent S.E.M. Significant difference (p<0.05): ‘*’, low stimulation; ‘#’, intense stimulation.
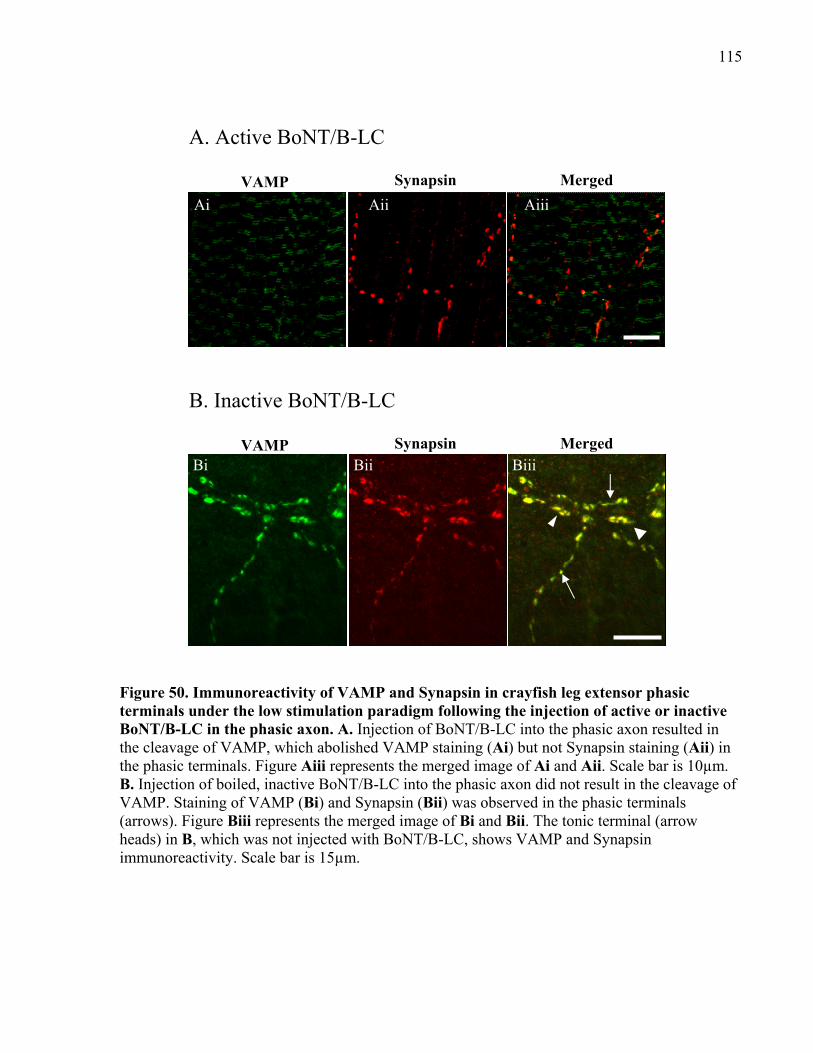
115
Ai Aii Aiii
Bi Bii Biii
VAMP
VAMP
Synapsin Merged
Synapsin Merged
A. Active BoNT/B-LC
B. Inactive BoNT/B-LC
Figure 50. Immunoreactivity of VAMP and Synapsin in crayfish leg extensor phasic terminals under the low stimulation paradigm following the injection of active or inactive BoNT/B-LC in the phasic axon. A. Injection of BoNT/B-LC into the phasic axon resulted in the cleavage of VAMP, which abolished VAMP staining (Ai) but not Synapsin staining (Aii) in the phasic terminals. Figure Aiii represents the merged image of Ai and Aii. Scale bar is 10µm. B. Injection of boiled, inactive BoNT/B-LC into the phasic axon did not result in the cleavage of VAMP. Staining of VAMP (Bi) and Synapsin (Bii) was observed in the phasic terminals (arrows). Figure Biii represents the merged image of Bi and Bii. The tonic terminal (arrow heads) in B, which was not injected with BoNT/B-LC, shows VAMP and Synapsin immunoreactivity. Scale bar is 15µm.
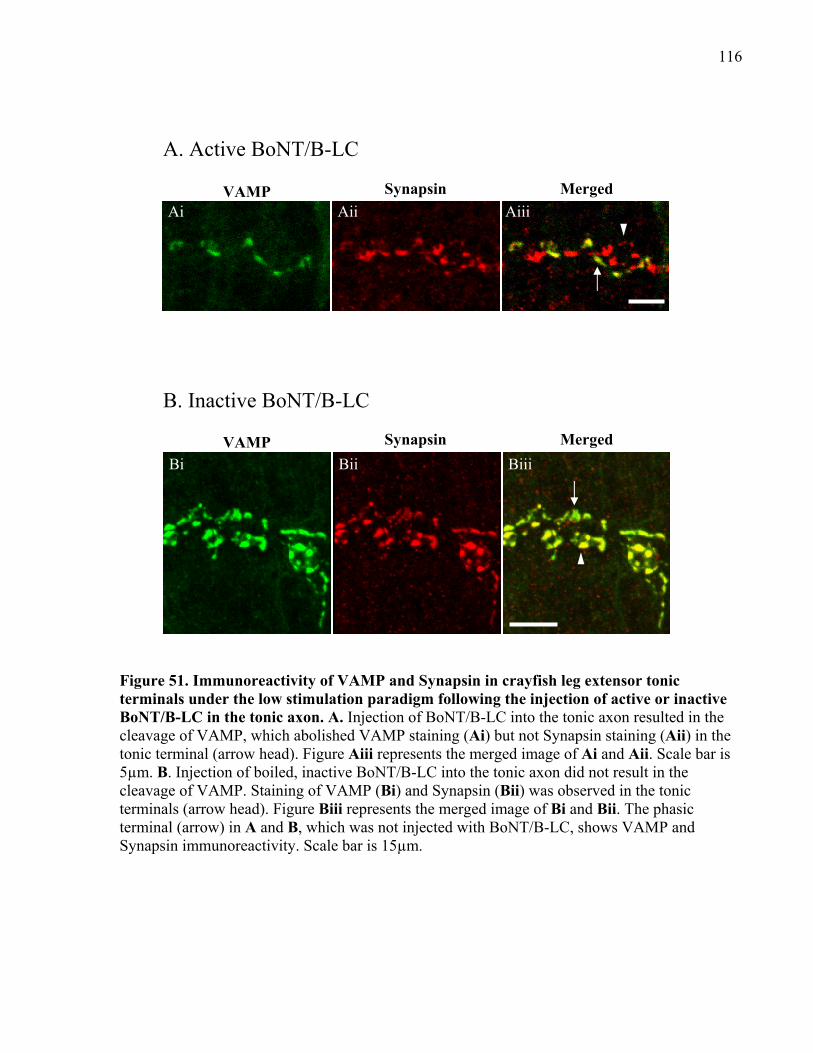
116
Ai Aii Aiii
Bi Bii Biii
VAMP Synapsin Merged
VAMP Synapsin Merged
A. Active BoNT/B-LC
B. Inactive BoNT/B-LC
Figure 51. Immunoreactivity of VAMP and Synapsin in crayfish leg extensor tonic terminals under the low stimulation paradigm following the injection of active or inactive BoNT/B-LC in the tonic axon. A. Injection of BoNT/B-LC into the tonic axon resulted in the cleavage of VAMP, which abolished VAMP staining (Ai) but not Synapsin staining (Aii) in the tonic terminal (arrow head). Figure Aiii represents the merged image of Ai and Aii. Scale bar is 5µm. B. Injection of boiled, inactive BoNT/B-LC into the tonic axon did not result in the cleavage of VAMP. Staining of VAMP (Bi) and Synapsin (Bii) was observed in the tonic terminals (arrow head). Figure Biii represents the merged image of Bi and Bii. The phasic terminal (arrow) in A and B, which was not injected with BoNT/B-LC, shows VAMP and Synapsin immunoreactivity. Scale bar is 15µm.
117
3.2.3.3 Summary of the effects of TeNT-LC and BoNT/B/D-LC under low stimulation
The effects of the three neurotoxins under the low stimulation protocol revealed that
trans-SNARE complexes associated with fusion-competent vesicles in the RRP are partially
zippered at both phasic and tonic synapses such that the binding and cleavage sites for BoNT/B
(which shares its cleavage site with TeNT) on VAMP is exposed, but the shared binding site of
TeNT and BoNT/D, and possibly the cleavage site of BoNT/D, are occluded (the binding and
cleavage site of each neurotoxin must be accessible so that the neurotoxin can cleave VAMP
(Hayashi et al., 1994; Hua et al., 1998; Pellegrini et al., 1994, 1995)). Furthermore, the
immunocytochemical results indicate that non-fusogenic cis-SNARE complexes, which can be
found on both the vesicle membrane and terminal plasma membrane, are also partially zippered
such that only BoNT/B-LC can cleave VAMP. The vesicles in the RRP represent only a small
fraction of the total number of vesicles associated with each synapse. Similarly, only a small
fraction of SNARE complexes is in a trans-conformation. Therefore, if VAMP was cleaved by
BoNT/B-LC only in trans-SNARE complexes, there would still be significant VAMP staining in
the axonal terminals, representing VAMP in either partially or fully zippered cis-SNARE
complexes. However, immunocytochemistry showed little to no VAMP staining in phasic and
tonic axons injected with only BoNT/B-LC. This indicates that VAMP is cleaved in both trans-
and cis-SNARE complexes, and that both types of complexes are partially zippered.
Other studies have shown that cis-SNARE complexes can exist in a partially zippered
state using other experimental techniques. For example, work by Kubista et al. (2004) showed
the presence of what appeared to be partially zippered SNARE complexes extracted from PC12
cells. Antibodies made to the N-terminal end of each SNARE did not detect two primary protein
bands representing SNARE complexes (100kD and 230kD bands) in Western blots unless
protein samples were heat treated. Antibodies made to the C-terminal end of the SNAREs
detected the SNARE complexes without heat treatment. These results showed that extracted cis-
SNARE complexes may exist in a partially zippered state in which heat treatment unzippered the
N-terminal region. Furthermore, work by Zhang et al. (2005) using recombinant yeast SNARE
proteins and electron paramagnetic resonance (EPR) spectroscopy to monitor protein-protein
interactions showed that soluble SNAREs form tightly zippered cis-SNARE complexes in
solution. However, mixing liposomes containing t-SNAREs with soluble VAMP resulted in a
mix of tightly and partially zippered cis-SNARE complexes. This result indicated that cis-
118
SNARE complexes can exist in a partially zippered state, which may be in part mediated by lipid
membranes.
Therefore, under resting conditions, SNARE complexes exist in a partially zippered state,
which are zippered from the N-terminal end to approximately the zero layer residue. This is in
agreement with previous work by Hua and Charlton (1999) and Hua et al. (1998) that showed the
same results using the three neurotoxins in the tonic axon of the crayfish opener muscle in which
the release probability is slightly higher than that of the tonic synapses of the leg extensor muscle
but much lower than phasic synapses. However, the presence of partially zippered complexes at
both phasic and tonic synapses indicates that the difference in the initial release probability
between the two synapses is not the result of a difference in the resting zippered state of the
trans-SNARE complex.
3.2.4 Crayfish neuronal VAMP is susceptible to cleavage by TeNT-LC and BoNT/B/D-LC under intense stimulation
The goal of the low stimulation protocol used in section 3.2.3 above was to determine the
zippered state of the SNARE complex under resting conditions based on whether or not VAMP
was cleaved by the neurotoxins and if the evoked response was inhibited. The results of the low
stimulation protocol showed that SNARE complexes at both phasic and tonic synapses were
partially zippered at rest, and therefore, the zippered state of the SNARE complex was not
responsible for the difference in release probability between the two synapses. This finding was
similar to that of Hua and Charlton (1999) and Hua et al. (1998) at the tonic synapses of the
crayfish claw opener muscle. In addition, Charlton and colleagues showed that the inhibitory
effect of TeNT-LC and BoNT/D-LC was stimulation-dependent and high frequency stimulation
accelerated the inhibitory effect of BoNT/B-LC. Therefore, to determine if VAMP has a similar
stimulation-dependent susceptibility to cleavage by TeNT-LC and BoNT/B/D-LC at phasic and
tonic synapses, high frequency (intense) stimulation protocols were used, which are described
below. It should be noted that this intense stimulation paradigm does not measure the effects of
the neurotoxins on initial release probability as this protocol evokes high frequency stimulation
that induces multiple rounds of vesicle fusion that involves vesicles from both the RRP and RP.
The low stimulation protocol outlined in section 3.2.3 was designed to measure the effects of the
neurotoxins on initial release probability because it involves the fusion of vesicles in only the
RRP.
119
Neurotoxin injection and physiological recordings under the intense stimulation protocol
were similar to those of the low stimulation protocol above (section 3.2.3) except for a few
changes. Following the test response made immediately after neurotoxin injection, the phasic
axon was stimulated at 10Hz for 2min with an inter-stimulation interval of 2min for a total of
40min. The tonic axon was stimulated at 150Hz for 30sec with an inter-stimulation interval of
10sec for a total of 40min. After stimulation, a rest period of 20min was given prior to taking a
test response. This stimulation paradigm was repeated two more times for a total elapsed time of
3hrs (after neurotoxin injection in the low stimulation protocol, the preparation was allowed to
rest for 2hrs before testing the response, which was repeated one more time following another
2hrs rest period). The 20min rest period following each round of stimulation was necessary
because the tonic response, and more so, the phasic response showed signs of potentiation such
that without the rest period the response would be much larger than the initial baseline recordings
(see Appendix 2). Even with the 20min rest period, however, there were instances in which the
phasic test response was larger than the initial baseline recordings. The goal was to minimize the
potentiated effect of the evoked response due to intense stimulation which could mask the effects
of the neurotoxins. The timeline of this protocol is given in Figure 32B. The measured responses
were normalized by expressing each measured EPSP amplitude as a percentage of the initial
baseline EPSP amplitude (time = 0min).
The injection of TeNT-LC, BoNT/D-LC, and BoNT/B-LC under intense stimulation
resulted in a significant decrease of the evoked phasic and tonic responses (see Figures 34 and 35
for phasic and tonic EPSP traces, respectively; Figures 36, 38, and 48 for phasic data; Figures 37,
39, and 49 for tonic data). Both phasic and tonic responses showed a significant decrease
immediately after injection of BoNT/B-LC but not with BoNT/D-LC and TeNT-LC without
intense stimulation, similar to the results using the low stimulation protocol in section 3.2.3,
demonstrating that VAMP is at least partially exposed and accessible only to BoNT/B-LC under
resting conditions. The inhibitory effects of TeNT-LC and BoNT/D-LC were initially observed
following the first round of intense stimulation at both phasic and tonic synapses. The responses
showed the greatest inhibition after the first round of intense stimulation, and thereafter,
continued to decline over time but at a slower rate. Overall, BoNT/B-LC had the greatest
inhibitory effect over time for both phasic and tonic responses followed by BoNT/D-LC and
TeNT-LC, both of which elicited a similar amount of decline over time (see Figures 40 (phasic)
and 41 (tonic) for percent differences between active and inactive neurotoxins).
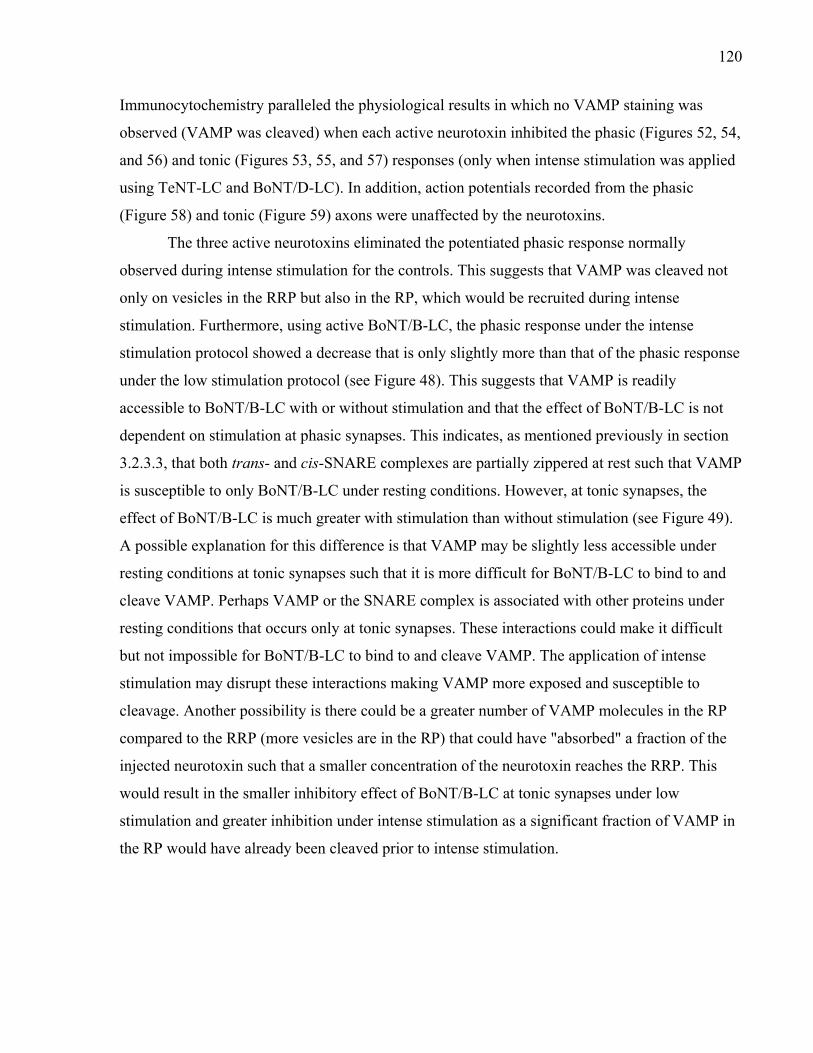
120
Immunocytochemistry paralleled the physiological results in which no VAMP staining was
observed (VAMP was cleaved) when each active neurotoxin inhibited the phasic (Figures 52, 54,
and 56) and tonic (Figures 53, 55, and 57) responses (only when intense stimulation was applied
using TeNT-LC and BoNT/D-LC). In addition, action potentials recorded from the phasic
(Figure 58) and tonic (Figure 59) axons were unaffected by the neurotoxins.
The three active neurotoxins eliminated the potentiated phasic response normally
observed during intense stimulation for the controls. This suggests that VAMP was cleaved not
only on vesicles in the RRP but also in the RP, which would be recruited during intense
stimulation. Furthermore, using active BoNT/B-LC, the phasic response under the intense
stimulation protocol showed a decrease that is only slightly more than that of the phasic response
under the low stimulation protocol (see Figure 48). This suggests that VAMP is readily
accessible to BoNT/B-LC with or without stimulation and that the effect of BoNT/B-LC is not
dependent on stimulation at phasic synapses. This indicates, as mentioned previously in section
3.2.3.3, that both trans- and cis-SNARE complexes are partially zippered at rest such that VAMP
is susceptible to only BoNT/B-LC under resting conditions. However, at tonic synapses, the
effect of BoNT/B-LC is much greater with stimulation than without stimulation (see Figure 49).
A possible explanation for this difference is that VAMP may be slightly less accessible under
resting conditions at tonic synapses such that it is more difficult for BoNT/B-LC to bind to and
cleave VAMP. Perhaps VAMP or the SNARE complex is associated with other proteins under
resting conditions that occurs only at tonic synapses. These interactions could make it difficult
but not impossible for BoNT/B-LC to bind to and cleave VAMP. The application of intense
stimulation may disrupt these interactions making VAMP more exposed and susceptible to
cleavage. Another possibility is there could be a greater number of VAMP molecules in the RP
compared to the RRP (more vesicles are in the RP) that could have "absorbed" a fraction of the
injected neurotoxin such that a smaller concentration of the neurotoxin reaches the RRP. This
would result in the smaller inhibitory effect of BoNT/B-LC at tonic synapses under low
stimulation and greater inhibition under intense stimulation as a significant fraction of VAMP in
the RP would have already been cleaved prior to intense stimulation.
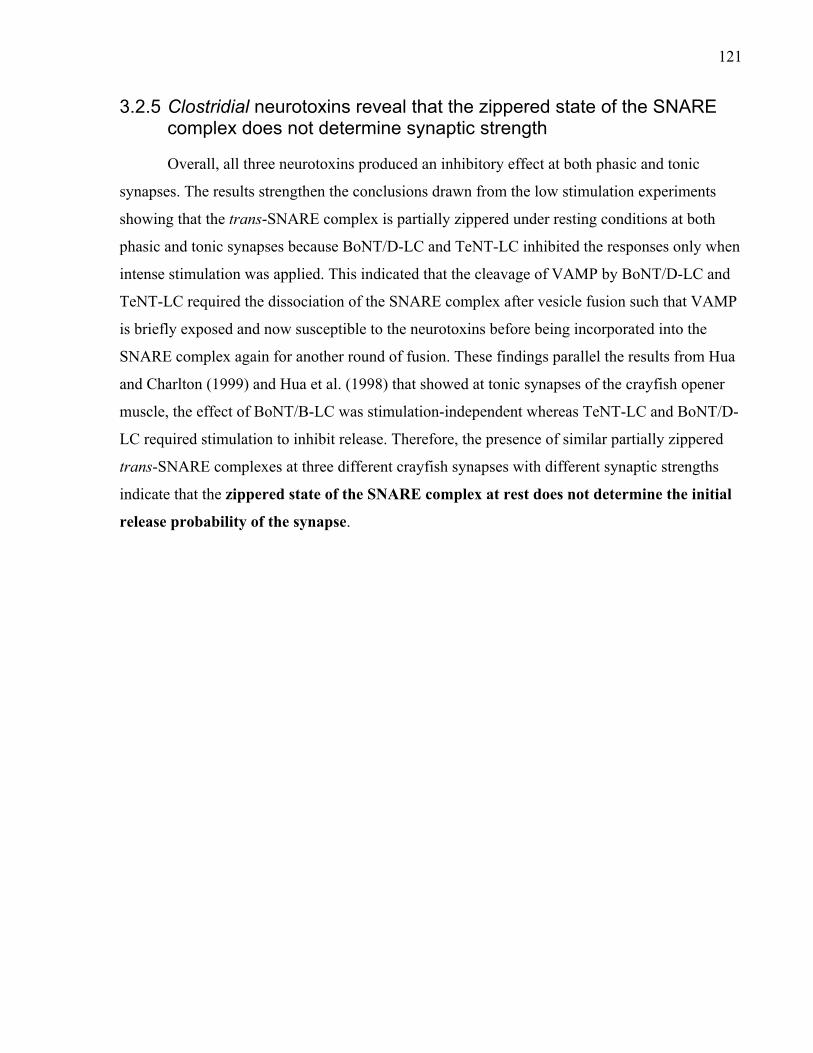
121
3.2.5 Clostridial neurotoxins reveal that the zippered state of the SNARE complex does not determine synaptic strength
Overall, all three neurotoxins produced an inhibitory effect at both phasic and tonic
synapses. The results strengthen the conclusions drawn from the low stimulation experiments
showing that the trans-SNARE complex is partially zippered under resting conditions at both
phasic and tonic synapses because BoNT/D-LC and TeNT-LC inhibited the responses only when
intense stimulation was applied. This indicated that the cleavage of VAMP by BoNT/D-LC and
TeNT-LC required the dissociation of the SNARE complex after vesicle fusion such that VAMP
is briefly exposed and now susceptible to the neurotoxins before being incorporated into the
SNARE complex again for another round of fusion. These findings parallel the results from Hua
and Charlton (1999) and Hua et al. (1998) that showed at tonic synapses of the crayfish opener
muscle, the effect of BoNT/B-LC was stimulation-independent whereas TeNT-LC and BoNT/D-
LC required stimulation to inhibit release. Therefore, the presence of similar partially zippered
trans-SNARE complexes at three different crayfish synapses with different synaptic strengths
indicate that the zippered state of the SNARE complex at rest does not determine the initial
release probability of the synapse.
122
VAMP Synapsin Merged
Ai Aii Aiii
VAMP Synapsin Merged
Bi Bii Biii
A. Active TeNT-LC
B. Inactive TeNT-LC
Figure 52. Immunoreactivity of VAMP and Synapsin in crayfish leg extensor phasic terminals under the intense stimulation paradigm following the injection of active or inactive TeNT-LC in the phasic axon. A. Injection of TeNT-LC into the phasic axon resulted in the cleavage of VAMP, which abolished VAMP staining (Ai) but not Synapsin staining (Aii) in the phasic terminals. Figure Aiii represents the merged image of Ai and Aii. Scale bar is 14µm. B. Injection of boiled, inactive TeNT-LC into the phasic axon did not result in the cleavage of VAMP. Staining of VAMP (Bi) and Synapsin (Bii) was observed in the phasic terminals (arrows). Figure Biii represents the merged image of Bi and Bii. The tonic terminal (arrow head) in B, which was not injected with TeNT-LC, shows VAMP and Synapsin immunoreactivity. Scale bar is 8.5µm.
123
VAMP Synapsin Merged
Ai Aii Aiii
VAMP Synapsin Merged
Bi Bii Biii
A. Active TeNT-LC
B. Inactive TeNT-LC
Figure 53. Immunoreactivity of VAMP and Synapsin in crayfish leg extensor tonic terminals under the intense stimulation paradigm following the injection of active or inactive TeNT-LC in the tonic axon. A. Injection of TeNT-LC into the tonic axon resulted in the cleavage of VAMP, which abolished VAMP staining (Ai) but not Synapsin staining (Aii) in the tonic terminal (arrow head). Figure Aiii represents the merged image of Ai and Aii. Scale bar is 5µm. B. Injection of boiled, inactive TeNT-LC into the tonic axon did not result in the cleavage of VAMP. Staining of VAMP (Bi) and Synapsin (Bii) was observed in the tonic terminals (arrow head). Figure Biii represents the merged image of Bi and Bii. The phasic terminal (arrows) in A and B, which was not injected with TeNT-LC, shows VAMP and Synapsin immunoreactivity. Scale bar is 9.5µm.
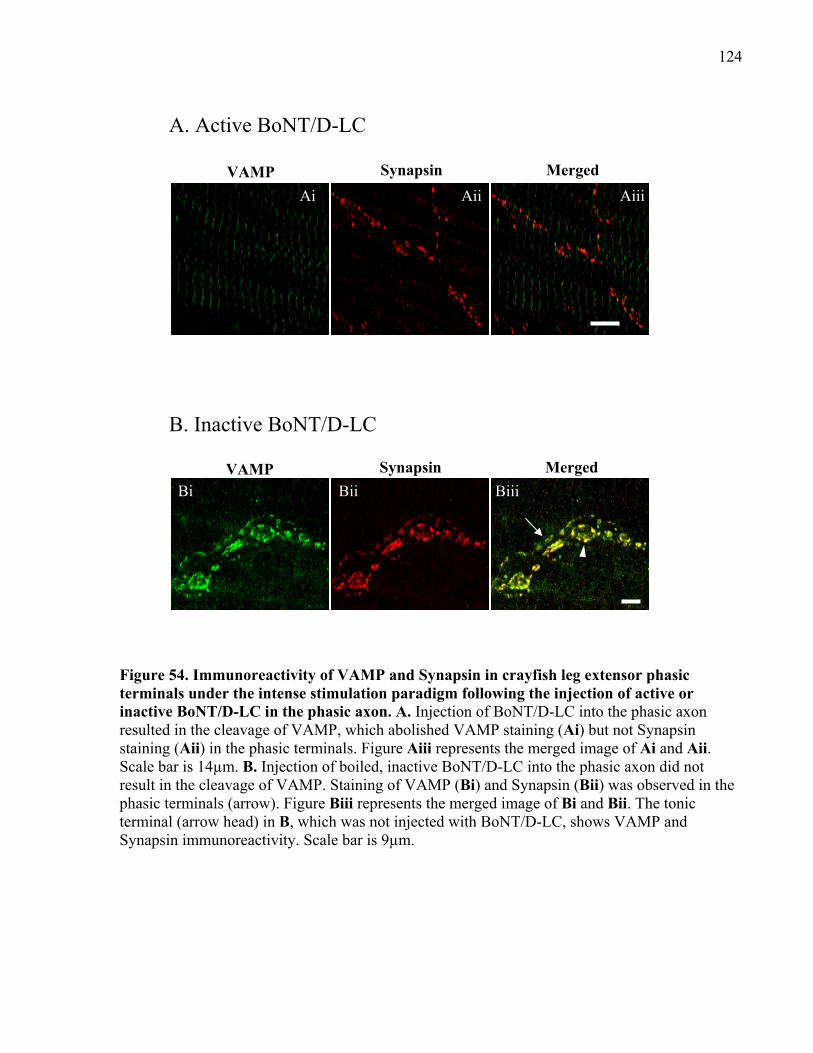
124
VAMP Synapsin Merged
Ai Aii Aiii
VAMP Synapsin Merged
Bi Bii Biii
A. Active BoNT/D-LC
B. Inactive BoNT/D-LC
Figure 54. Immunoreactivity of VAMP and Synapsin in crayfish leg extensor phasic terminals under the intense stimulation paradigm following the injection of active or inactive BoNT/D-LC in the phasic axon. A. Injection of BoNT/D-LC into the phasic axon resulted in the cleavage of VAMP, which abolished VAMP staining (Ai) but not Synapsin staining (Aii) in the phasic terminals. Figure Aiii represents the merged image of Ai and Aii. Scale bar is 14µm. B. Injection of boiled, inactive BoNT/D-LC into the phasic axon did not result in the cleavage of VAMP. Staining of VAMP (Bi) and Synapsin (Bii) was observed in the phasic terminals (arrow). Figure Biii represents the merged image of Bi and Bii. The tonic terminal (arrow head) in B, which was not injected with BoNT/D-LC, shows VAMP and Synapsin immunoreactivity. Scale bar is 9µm.
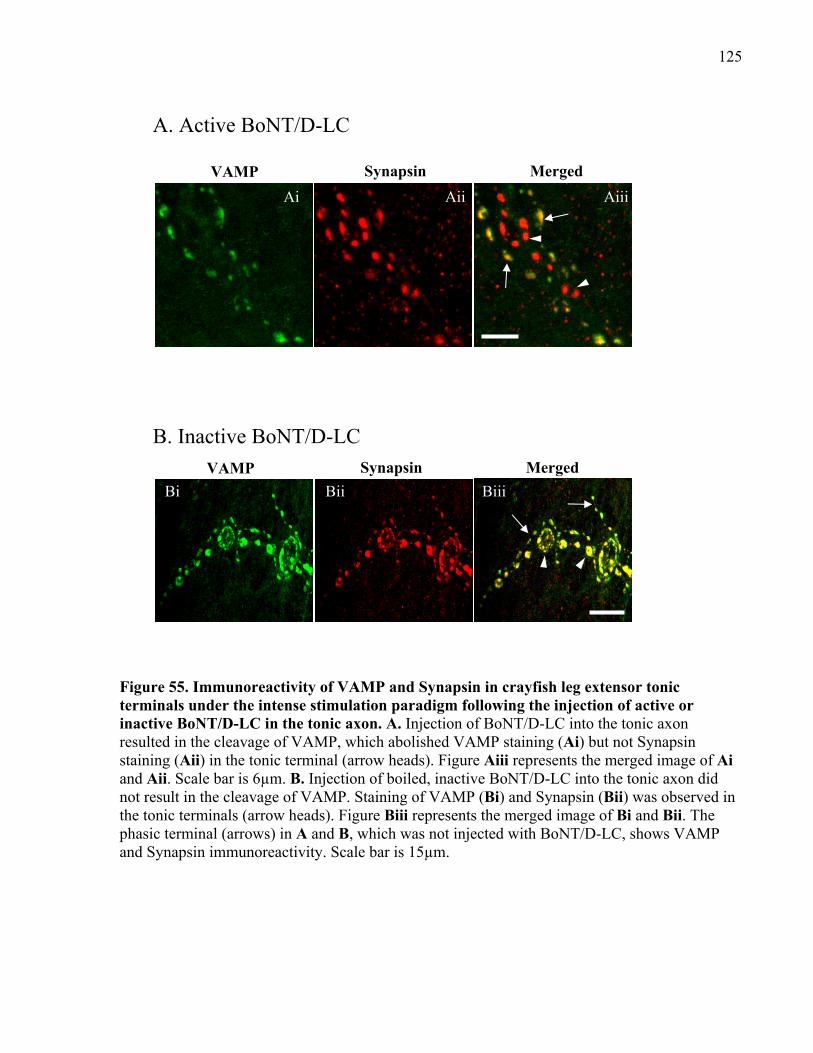
125
VAMP Synapsin Merged
Ai Aii Aiii
VAMP Synapsin Merged
Bi Bii Biii
A. Active BoNT/D-LC
B. Inactive BoNT/D-LC
Figure 55. Immunoreactivity of VAMP and Synapsin in crayfish leg extensor tonic terminals under the intense stimulation paradigm following the injection of active or inactive BoNT/D-LC in the tonic axon. A. Injection of BoNT/D-LC into the tonic axon resulted in the cleavage of VAMP, which abolished VAMP staining (Ai) but not Synapsin staining (Aii) in the tonic terminal (arrow heads). Figure Aiii represents the merged image of Ai and Aii. Scale bar is 6µm. B. Injection of boiled, inactive BoNT/D-LC into the tonic axon did not result in the cleavage of VAMP. Staining of VAMP (Bi) and Synapsin (Bii) was observed in the tonic terminals (arrow heads). Figure Biii represents the merged image of Bi and Bii. The phasic terminal (arrows) in A and B, which was not injected with BoNT/D-LC, shows VAMP and Synapsin immunoreactivity. Scale bar is 15µm.
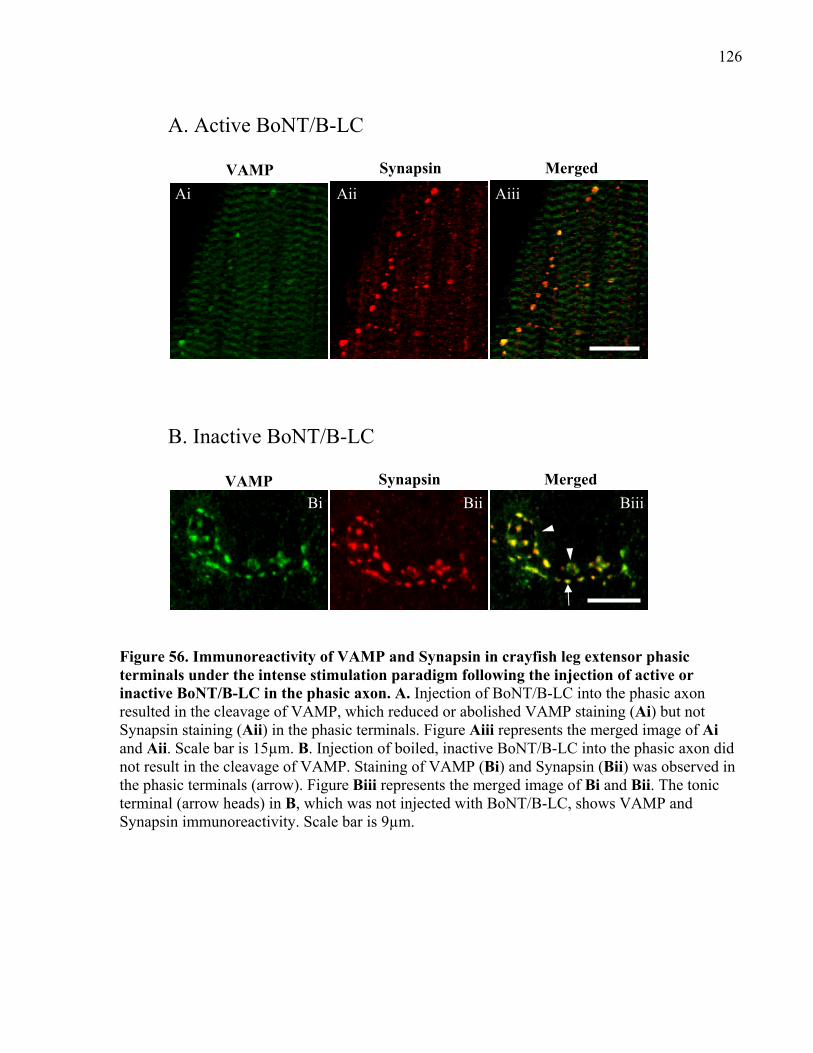
126
Figure 56. Immunoreactivity of VAMP and Synapsin in crayfish leg extensor phasic terminals under the intense stimulation paradigm following the injection of active or inactive BoNT/B-LC in the phasic axon. A. Injection of BoNT/B-LC into the phasic axon resulted in the cleavage of VAMP, which reduced or abolished VAMP staining (Ai) but not Synapsin staining (Aii) in the phasic terminals. Figure Aiii represents the merged image of Ai and Aii. Scale bar is 15µm. B. Injection of boiled, inactive BoNT/B-LC into the phasic axon did not result in the cleavage of VAMP. Staining of VAMP (Bi) and Synapsin (Bii) was observed in the phasic terminals (arrow). Figure Biii represents the merged image of Bi and Bii. The tonic terminal (arrow heads) in B, which was not injected with BoNT/B-LC, shows VAMP and Synapsin immunoreactivity. Scale bar is 9µm.
VAMP Synapsin Merged
VAMP Synapsin Merged
Ai Aii Aiii
Bi Bii Biii
A. Active BoNT/B-LC
B. Inactive BoNT/B-LC
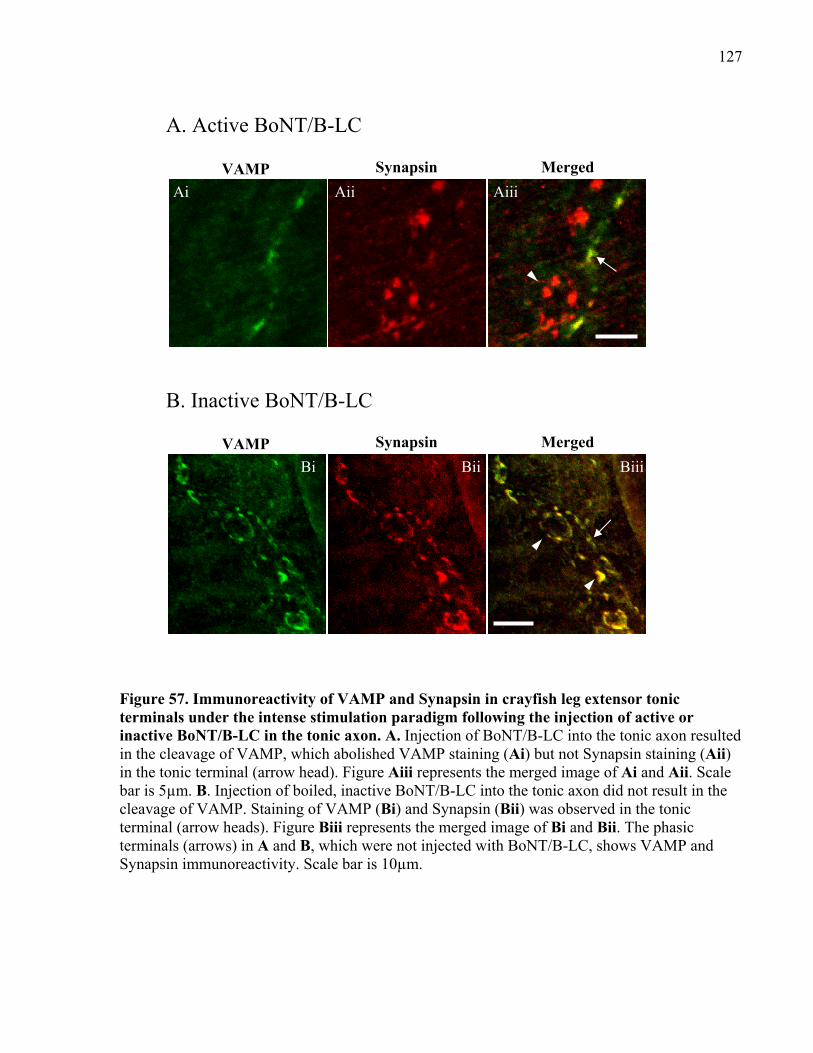
127
Figure 57. Immunoreactivity of VAMP and Synapsin in crayfish leg extensor tonic terminals under the intense stimulation paradigm following the injection of active or inactive BoNT/B-LC in the tonic axon. A. Injection of BoNT/B-LC into the tonic axon resulted in the cleavage of VAMP, which abolished VAMP staining (Ai) but not Synapsin staining (Aii) in the tonic terminal (arrow head). Figure Aiii represents the merged image of Ai and Aii. Scale bar is 5µm. B. Injection of boiled, inactive BoNT/B-LC into the tonic axon did not result in the cleavage of VAMP. Staining of VAMP (Bi) and Synapsin (Bii) was observed in the tonic terminal (arrow heads). Figure Biii represents the merged image of Bi and Bii. The phasic terminals (arrows) in A and B, which were not injected with BoNT/B-LC, shows VAMP and Synapsin immunoreactivity. Scale bar is 10µm.
Ai Aii Aiii
Bi Bii Biii
VAMP Synapsin Merged
VAMP Synapsin Merged
A. Active BoNT/B-LC
B. Inactive BoNT/B-LC
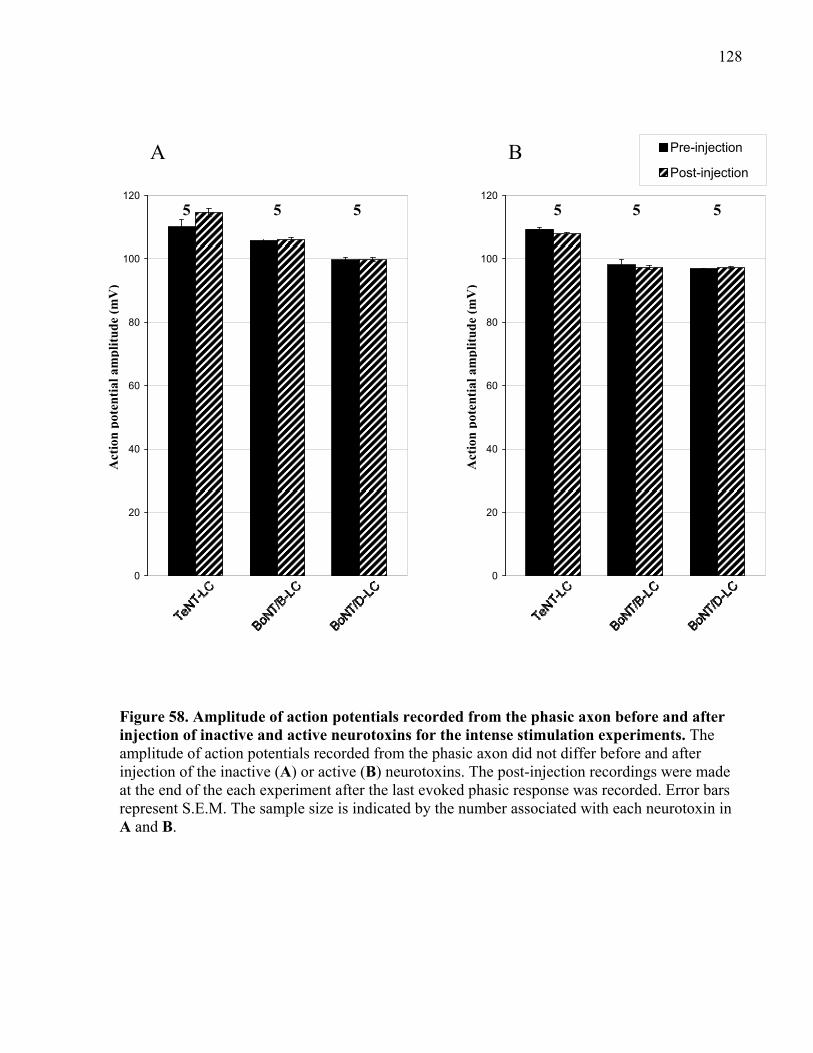
128
Figure 58. Amplitude of action potentials recorded from the phasic axon before and after injection of inactive and active neurotoxins for the intense stimulation experiments. The amplitude of action potentials recorded from the phasic axon did not differ before and after injection of the inactive (A) or active (B) neurotoxins. The post-injection recordings were made at the end of the each experiment after the last evoked phasic response was recorded. Error bars represent S.E.M. The sample size is indicated by the number associated with each neurotoxin in A and B.
0
20
40
60
80
100
120
0
20
40
60
80
100
120
Pre-injection
Post-injectionA B
Act
ion
pot
enti
al a
mp
litu
de
(mV
)
Act
ion
pot
enti
al a
mp
litu
de
(mV
)
5 5 5 5 5 5
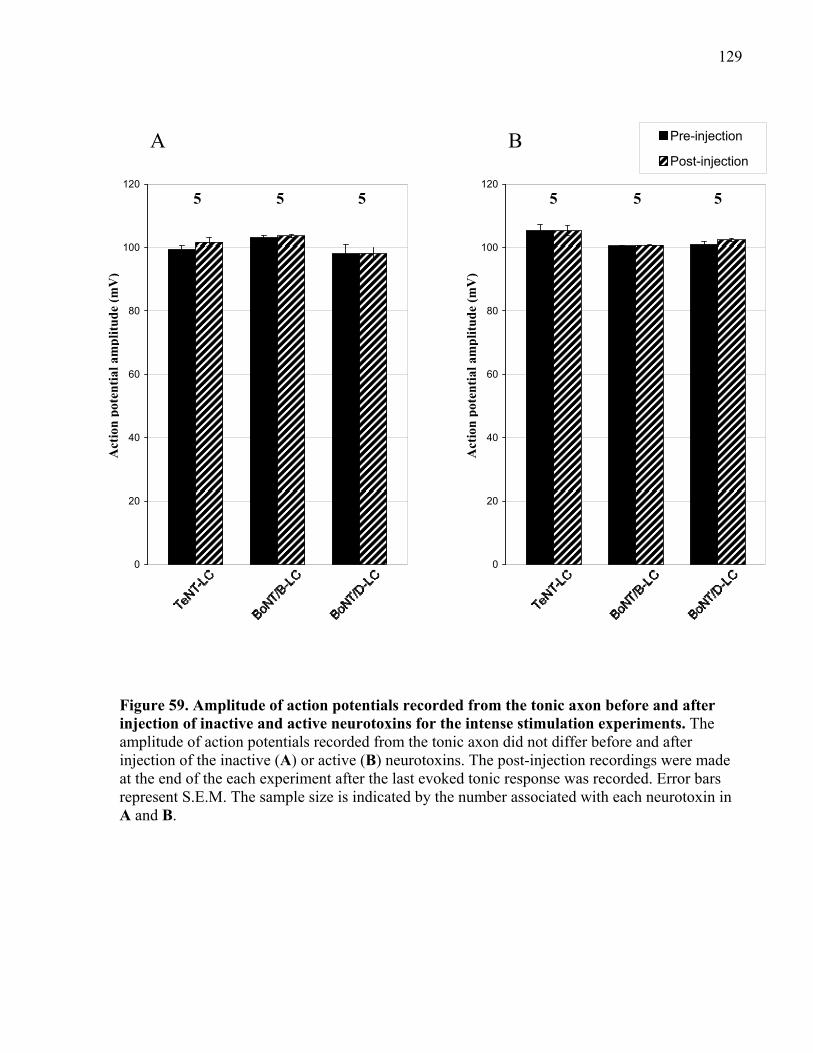
129
Figure 59. Amplitude of action potentials recorded from the tonic axon before and after injection of inactive and active neurotoxins for the intense stimulation experiments. The amplitude of action potentials recorded from the tonic axon did not differ before and after injection of the inactive (A) or active (B) neurotoxins. The post-injection recordings were made at the end of the each experiment after the last evoked tonic response was recorded. Error bars represent S.E.M. The sample size is indicated by the number associated with each neurotoxin in A and B.
0
20
40
60
80
100
120
0
20
40
60
80
100
120
Act
ion
pot
enti
al a
mp
litu
de
(mV
)
Act
ion
pot
enti
al a
mp
litu
de
(mV
)
Pre-injection
Post-injectionA B
5 5 5 5 5 5
130
Chapter 4: VAMP peptide and SNARE zippering
4 The inhibitory effect of the crayfish VAMP C-terminal peptide indicates that SNARE complexes are partially zippered at phasic and tonic synapses
The use of Clostridial neurotoxins has shown that SNARE complexes at phasic and tonic
synapses are partially zippered at the N-terminal end at rest. To complement these experiments, I
designed and used a VAMP-specific interfering peptide to help determine the zippered state of
SNARE complexes at crayfish phasic and tonic synapses.
Peptides that mimic parts or the entire SNARE motif region of VAMP can interfere with
trans-SNARE complex formation and vesicle fusion. The majority of experiments that use a
peptide made to the full cytoplasmic VAMP SNARE motif region (Vcyt) showed that the
peptide can prevent the interaction between native SNARE proteins and inhibit lipid mixing and
NT release (Hunt et al., 1994; Jung et al., 2008; Melia et al., 2002, 2006; Pobbati et al., 2006).
The peptide, however, can form non-functional, SDS-resistant complexes with Syntaxin and
SNAP-25 (Melia et al., 2002; Pobbati et al., 2006). Peptides to the N-terminal half of VAMP’s
SNARE motif region (Vn) do not readily form stable, SDS-resistant complexes with Syntaxin
and SNAP-25 but do give similar physiological results as the Vcyt peptide (Jung et al., 2008;
Melia et al., 2002; Pobbati et al., 2006). Interestingly, an opposite effect is observed using
peptides made to the C-terminal half of VAMP’s SNARE motif region (Vc), especially when
applied to in-vitro systems. In proteoliposome fusion assays, Vc peptides actually facilitate
liposome docking and fusion (Chicka et al., 2008; Cypionka et al., 2009; Holt et al., 2008; Melia
et al., 2002; Pobbati et al., 2006; Vites et al., 2008). It is suggested that the Vc peptide may
stabilize the t-heterodimer complex to create a high affinity binding site for native VAMP; the
binding of full-length VAMP to the t-heterodimer complex will displace the Vc peptide and form
the SNARE complex (Melia et al., 2002; Pobbati et al., 2006).
Some studies show that one or more of VAMP peptides do not have an effect on SNARE
complex formation and vesicle fusion. A study by Hunt et al. (1994) showed that the injection of
a Vcyt peptide into the squid giant synapse reduced evoked release, whereas injection of a Vn or
Vc peptide had no effect. Another study by Jung et al. (2008) showed that Vcyt and Vn peptides
inhibited liposome mixing, secretion from PC12 cells, and SNARE complex formation; however,
no effects were observed in the presence of a Vc peptide. Finally, Cornille et al. (1995) showed
131
that the injection of a Vcyt peptide into the Aplysia buccal ganglia had no effect on postsynaptic
responses whereas a peptide made to the proline-rich N-terminal end of the VAMP protein
reduced postsynaptic responses. The reasons for the lack of an effect using a Vc peptide are
unclear when compared to other studies that used similar peptides and observed an effect;
however, factors such as insufficient concentration, steric hindrance, non-specific binding,
binding affinity, etc., may be responsible.
The inhibitory effects of Vcyt and Vn peptides require pre-incubation of the peptides with
t-SNARE liposomes prior to liposome mixing (proteoliposome fusion assay) or stimulation of
cells, otherwise no immediate effect is observed (i.e. Jung et al., 2008; Melia et al., 2002). This
supports the evidence showing that the SNARE complex initially zippers starting at the N-
terminal end and may exist in a partially zippered state, and it demonstrates that the Vcyt and Vn
peptides cannot dissociate pre-formed SNARE complexes but can prevent complex formation
providing that the N-terminal end is exposed.
The results from the peptide studies above and my neurotoxin experiments indicate that
the trans-SNARE complex is partially zippered at the N-terminal end at rest. Therefore, using
peptides that have at least the N-terminal half of VAMP’s SNARE motif (Vcyt and Vn) should
not be capable of disrupting the partially zippered trans-SNARE complex under resting
conditions because they will not be able to penetrate the zippered N-terminal end of the trans-
SNARE complex. The peptides should not have an effect until multiple rounds of vesicle fusion
and SNARE complex re-assembly cause exposure of the SNARE proteins and their N-terminal
ends. Conversely, the C-terminal end of the SNARE complex is unzippered and exposed under
resting conditions, and therefore, a C-terminal peptide could enter this region and interfere with
the interaction between native VAMP and the other two SNARE proteins without the need for
stimulation. Therefore, I designed and used a crayfish-specific VAMP peptide to the C-terminal
half of VAMP’s SNARE motif (Vc peptide). Details of cloning and sequencing crayfish VAMP
and peptide design and synthesis are outlined in Chapter 2.8.
Under resting conditions, if trans-SNARE complexes are tightly zippered such that the C-
terminal end is not exposed, then the Vc peptide would not be able to enter this region and
interfere with SNARE zippering (see Figure 60A) and therefore have no effect on evoked release
under low synaptic activity. However, if SNARE complexes are partially zippered at rest such
that the C-terminal end is exposed as indicated by the neurotoxin results, then the Vc peptide
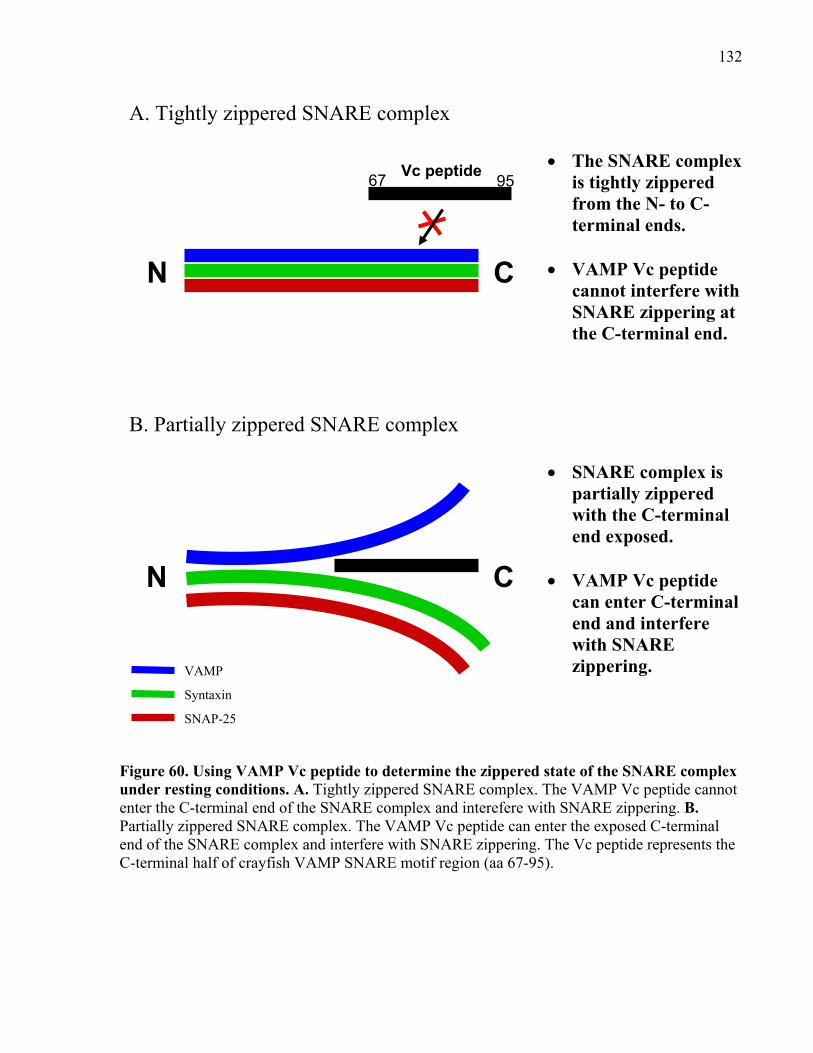
132
Figure 60. Using VAMP Vc peptide to determine the zippered state of the SNARE complex under resting conditions. A. Tightly zippered SNARE complex. The VAMP Vc peptide cannot enter the C-terminal end of the SNARE complex and interefere with SNARE zippering. B. Partially zippered SNARE complex. The VAMP Vc peptide can enter the exposed C-terminal end of the SNARE complex and interfere with SNARE zippering. The Vc peptide represents the C-terminal half of crayfish VAMP SNARE motif region (aa 67-95).
CN
N C
A. Tightly zippered SNARE complex
B. Partially zippered SNARE complex
The SNARE complex is tightly zippered from the N- to C-terminal ends.
VAMP Vc peptide
cannot interfere with SNARE zippering at the C-terminal end.
SNARE complex is partially zippered with the C-terminal end exposed.
VAMP Vc peptide
can enter C-terminal end and interfere with SNARE zippering.
Vc peptide 9567
VAMP
Syntaxin
SNAP-25
133
should be able to enter this region and interfere with SNARE zippering (see Figure 60B). In the
case of proteoliposome assays, the Vc peptide may promote SNARE zippering and enhance
release, which would indicate that the peptide can be easily displaced by native VAMP.
However, if the Vc peptide has a strong association with the t-SNAREs, native VAMP may not
be able to displace the peptide and, therefore, SNARE zippering would be blocked resulting in
impaired evoked release.
The mixed results obtained from previous studies mentioned above using variants of the
VAMP Vc peptide make it difficult to predict what effect a similar peptide would have at
crayfish phasic and tonic synapses. It is unclear as to why the Vc peptides had no effect in
studies by Cornille et al. (1995), Hunt et al. (1994), and Jung et al. (2008). There are many
possibilities as to why the Vc peptides showed no effect but this was not investigated further by
these researchers in their respective experimental systems. Conversely, the facilitatory effect of
the Vc peptides observed in-vitro may be an artifact of the artificial fusion assay, which is
missing numerous factors that constitute a real synapse. Furthermore, the artificial environment
could alter how strongly a given Vc peptide can associate with a partially zippered SNARE
complex and, therefore, how strongly the peptide can compete with VAMP for the C-terminal
end of the SNARE complex. Since I designed a Vc peptide that is based on the crayfish VAMP
sequence, and the SNARE motif regions have high mutual affinity, I predict that the crayfish-
specific Vc peptide will strongly associate with the SNARE complex and inhibit SNARE
zippering and thus inhibit release at crayfish synapses. Therefore, I hypothesize that at phasic
and tonic synapses, SNARE complexes under resting conditions are partially zippered only
at the N-terminal end and that the injection of a crayfish-specific VAMP Vc peptide into
both the phasic and tonic motor neurons will inhibit release.
134
4.1 Sequence of crayfish full-length neuronal VAMP and interfering Vc peptide
The cloning and sequencing protocol outlined in Chapter 2.8 resulted in one full-length
crayfish neuronal VAMP sequence. The crayfish VAMP sequence is homologous to VAMP
isoforms from other species, especially in the highly conserved SNARE motif region, and
contains the cleavage site for all VAMP-specific Clostridial neurotoxins except for BoNT/G
(Figure 61). It is unclear if the crayfish sequence represents the mammalian version of the
VAMP-1 or VAMP-2 isoform as it is similar to both. There is the possibility that only one
crayfish neuronal VAMP isoform exists. Further testing will be required to determine the number
of crayfish neuronal VAMP isoforms. The interfering VAMP Vc peptide was made to the C-
terminal end of crayfish VAMP’s SNARE motif sequence (see Figure 61). The sequence of the
scrambled Vc peptide used as a control can be found in Chapter 2.8.2.4, Figure 27B. The effects
of the Vc peptide on evoked phasic and tonic release are presented in the next section (4.2).
135
Figure 61. Comparison of full-length crayfish VAMP amino acid sequence with VAMP-1 and VAMP-2 isoforms from other species. Multiple protein alignment shows crayfish VAMP is similar to VAMP-1 and VAMP-2 isoforms from other species, especially in the highly conserved SNARE motif region (black bar). The type of isoform is unknown for some species. The cleavage sites of VAMP-specific neurotoxins are indicated in the alignment. Crayfish VAMP is missing only the BoNT/G cleavage site. The boxed sequence represents the interfering Vc peptide. Asterisk (“*”) indicates conserved residue; colon (“:”) indicates residues with strongly similar properties; period (“.”) indicates residues with weakly similar properties. The multiple protein sequence alignment was performed using the online ClustalW2 Multiple Sequence Alignment tool (European Molecular Biology Laboratory - European Bioinformatics Institute, http://www.ebi.ac.uk/Tools/msa/clustalw2/).
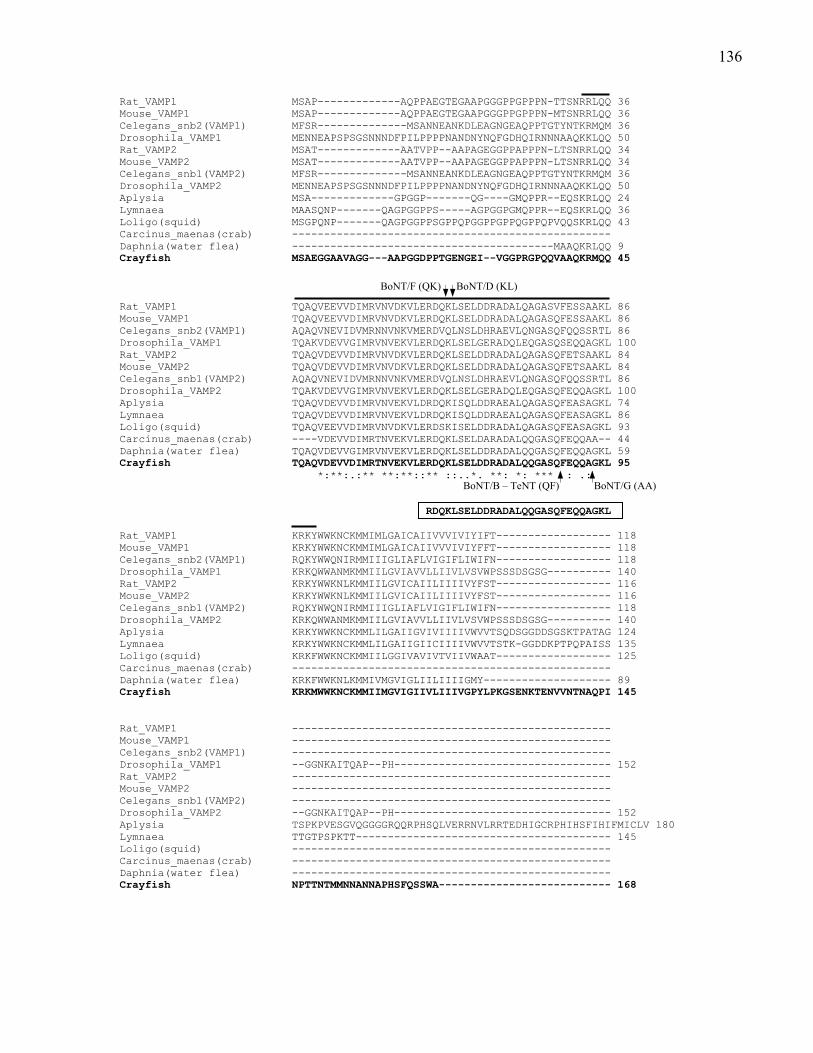
136
Rat_VAMP1 MSAP-------------AQPPAEGTEGAAPGGGPPGPPPN-TTSNRRLQQ 36 Mouse_VAMP1 MSAP-------------AQPPAEGTEGAAPGGGPPGPPPN-MTSNRRLQQ 36 Celegans_snb2(VAMP1) MFSR--------------MSANNEANKDLEAGNGEAQPPTGTYNTKRMQM 36 Drosophila_VAMP1 MENNEAPSPSGSNNNDFPILPPPPNANDNYNQFGDHQIRNNNAAQKKLQQ 50 Rat_VAMP2 MSAT-------------AATVPP--AAPAGEGGPPAPPPN-LTSNRRLQQ 34 Mouse_VAMP2 MSAT-------------AATVPP--AAPAGEGGPPAPPPN-LTSNRRLQQ 34 Celegans_snb1(VAMP2) MFSR--------------MSANNEANKDLEAGNGEAQPPTGTYNTKRMQM 36 Drosophila_VAMP2 MENNEAPSPSGSNNNDFPILPPPPNANDNYNQFGDHQIRNNNAAQKKLQQ 50 Aplysia MSA-------------GPGGP-------QG----GMQPPR--EQSKRLQQ 24 Lymnaea MAASQNP-------QAGPGGPPS-----AGPGGPGMQPPR--EQSKRLQQ 36 Loligo(squid) MSGPQNP-------QAGPGGPPSGPPQPGGPPGPPQGPPQPVQQSKRLQQ 43 Carcinus_maenas(crab) -------------------------------------------------- Daphnia(water flea) -----------------------------------------MAAQKRLQQ 9 Crayfish MSAEGGAAVAGG---AAPGGDPPTGENGEI--VGGPRGPQQVAAQKRMQQ 45 Rat_VAMP1 TQAQVEEVVDIMRVNVDKVLERDQKLSELDDRADALQAGASVFESSAAKL 86 Mouse_VAMP1 TQAQVEEVVDIMRVNVDKVLERDQKLSELDDRADALQAGASQFESSAAKL 86 Celegans_snb2(VAMP1) AQAQVNEVIDVMRNNVNKVMERDVQLNSLDHRAEVLQNGASQFQQSSRTL 86 Drosophila_VAMP1 TQAKVDEVVGIMRVNVEKVLERDQKLSELGERADQLEQGASQSEQQAGKL 100 Rat_VAMP2 TQAQVDEVVDIMRVNVDKVLERDQKLSELDDRADALQAGASQFETSAAKL 84 Mouse_VAMP2 TQAQVDEVVDIMRVNVDKVLERDQKLSELDDRADALQAGASQFETSAAKL 84 Celegans_snb1(VAMP2) AQAQVNEVIDVMRNNVNKVMERDVQLNSLDHRAEVLQNGASQFQQSSRTL 86 Drosophila_VAMP2 TQAKVDEVVGIMRVNVEKVLERDQKLSELGERADQLEQGASQFEQQAGKL 100 Aplysia TQAQVDEVVDIMRVNVEKVLDRDQKISQLDDRAEALQAGASQFEASAGKL 74 Lymnaea TQAQVDEVVDIMRVNVEKVLDRDQKISQLDDRAEALQAGASQFEASAGKL 86 Loligo(squid) TQAQVEEVVDIMRVNVDKVLERDSKISELDDRADALQAGASQFEASAGKL 93 Carcinus_maenas(crab) ----VDEVVDIMRTNVEKVLERDQKLSELDARADALQQGASQFEQQAA-- 44 Daphnia(water flea) TQAQVDEVVGIMRVNVEKVLERDQKLSELDDRADALQQGASQFEQQAGKL 59 Crayfish TQAQVDEVVDIMRTNVEKVLERDQKLSELDDRADALQQGASQFEQQAGKL 95 *:**:.:** **:**::** ::..*. **: *: *** : .: RDQKLSELDDRADALQQGASQFEQQAGKL Rat_VAMP1 KRKYWWKNCKMMIMLGAICAIIVVVIVIYIFT------------------ 118 Mouse_VAMP1 KRKYWWKNCKMMIMLGAICAIIVVVIVIYFFT------------------ 118 Celegans_snb2(VAMP1) RQKYWWQNIRMMIIIGLIAFLVIGIFLIWIFN------------------ 118 Drosophila_VAMP1 KRKQWWANMKMMIILGVIAVVLLIIVLVSVWPSSSDSGSG---------- 140 Rat_VAMP2 KRKYWWKNLKMMIILGVICAIILIIIIVYFST------------------ 116 Mouse_VAMP2 KRKYWWKNLKMMIILGVICAIILIIIIVYFST------------------ 116 Celegans_snb1(VAMP2) RQKYWWQNIRMMIIIGLIAFLVIGIFLIWIFN------------------ 118 Drosophila_VAMP2 KRKQWWANMKMMIILGVIAVVLLIIVLVSVWPSSSDSGSG---------- 140 Aplysia KRKYWWKNCKMMLILGAIIGVIVIIIIVWVVTSQDSGGDDSGSKTPATAG 124 Lymnaea KRKYWWKNCKMMLILGAIIGIICIIIIVWVVTSTK-GGDDKPTPQPAISS 135 Loligo(squid) KRKFWWKNCKMMIILGGIVAVIVTVIIVWAAT------------------ 125 Carcinus_maenas(crab) -------------------------------------------------- Daphnia(water flea) KRKFWWKNLKMMIVMGVIGLIILIIIIGMY-------------------- 89 Crayfish KRKMWWKNCKMMIIMGVIGIIVLIIIVGPYLPKGSENKTENVVNTNAQPI 145 Rat_VAMP1 -------------------------------------------------- Mouse_VAMP1 -------------------------------------------------- Celegans_snb2(VAMP1) -------------------------------------------------- Drosophila_VAMP1 --GGNKAITQAP--PH---------------------------------- 152 Rat_VAMP2 -------------------------------------------------- Mouse_VAMP2 -------------------------------------------------- Celegans_snb1(VAMP2) -------------------------------------------------- Drosophila_VAMP2 --GGNKAITQAP--PH---------------------------------- 152 Aplysia TSPKPVESGVQGGGGRQQRPHSQLVERRNVLRRTEDHIGCRPHIHSFIHIFMICLV 180 Lymnaea TTGTPSPKTT---------------------------------------- 145 Loligo(squid) -------------------------------------------------- Carcinus_maenas(crab) -------------------------------------------------- Daphnia(water flea) -------------------------------------------------- Crayfish NPTTNTMMNNANNAPHSFQSSWA--------------------------- 168
BoNT/D (KL) BoNT/F (QK)
BoNT/G (AA) BoNT/B – TeNT (QF)
137
4.2 The effects of crayfish VAMP Vc peptide on neurotransmitter release
The VAMP Vc peptide was injected into the phasic and tonic axons and its effects on the
evoked response was tested under low and intense stimulation conditions described below. The
goal was to confirm the neurotoxin results showing that SNARE complexes are partially
zippered at phasic and tonic synapses of the crayfish leg extensor muscle. Similar to the
neurotoxin experiments in Chapter 3, using the Vc peptide with the low stimulation paradigm
would help to determine the zippered state of the SNARE complex at rest. If the SNARE
complex is partially zippered at rest then the C-terminal end of the complex would be exposed
and permit the binding of the Vc peptide. The peptide should prevent zippering at the C-terminal
end and inhibit NT release. However, if the SNARE complex is more zippered beyond the zero
layer but not necessarily complete to layer +8 then this could prevent the binding of the Vc
peptide to the SNARE complex. This will initially result in normal NT release as the peptide
cannot interfere with SNARE zippering. Therefore, only after vesicle fusion in which the
SNARE complex briefly dissociates and then re-assembles would the Vc peptide be capable of
interfering with SNARE zippering. This scenario was tested immediately following the low
stimulation experiment by applying an intense stimulation paradigm unique to each axon, which
are described below.
4.2.1 VAMP peptide preparation for pressure injection
A solution consisting of 500µM crayfish VAMP Vc peptide or scrambled Vc peptide in
100mM KCl with 250µM 3kDa dextran Texas red fluorescent dye (Invitrogen) was used for
pressure injection. The solutions were stored at -20°C and used within one week after
production. In addition to the scrambled Vc peptide, a solution containing only 100mM KCl with
250µM 3kDa dextran Texas red fluorescent dye was used as a peptide-free control solution.
4.2.2 VAMP Vc peptide inhibits phasic and tonic release under low stimulation
Baseline recordings and pressure injection were performed as described in Chapter 2.6.
After peptide injection, phasic or tonic responses were recorded immediately, 30min and 60min
after injection. The stimulation and recording protocols were the same as those used for baseline
138
recordings for phasic and tonic responses. The average of three phasic or tonic responses (taken
at 0.1Hz) at each time point was used for analyses. A timeline of the protocol is given in Figure
62. Similar to the protocol in Chapter 3.2.3, the low stimulation paradigm was designed to test
the effects of the Vc peptide under resting conditions.
The crayfish VAMP Vc peptide significantly decreased both the phasic and tonic evoked
responses compared to the controls without requiring stimulation (see Figures 63 and 64 for
phasic and tonic EPSP traces, respectively; Figure 65 for tonic data; Figure 66 for phasic data).
The inhibitory effect of the Vc peptide was first apparent immediately after injection under the
low stimulation protocol. The inhibitory effect was greater on the tonic response (Figure 65) than
the phasic response (Figure 66) versus controls. Following the first response recorded after
injection, the tonic response showed only a slight decline compared to controls and even
appeared to reach a plateau at the end of the 1hr protocol (see Figure 67 for percent differences
between the Vc and scrambled Vc peptide).
The phasic response under each injected solution tested showed a decline after injection.
The stimulation-independent depression of the phasic response is responsible for this observed
effect, which is apparent in the two control traces. This depression is also present in the Vc
peptide trace; however, the Vc peptide significantly reduced the evoked response further
compared to the controls. Following the response recorded immediately after injection, the
phasic response showed little to no decline with the Vc peptide compared to controls, excluding
the stimulation-independent depression of the phasic response. In fact, when compared to the
controls, the phasic response showed a slight increase over time although the effect remained
significantly lower than controls (see Figure 67 for percent differences between the Vc and
scrambled Vc peptide). This suggests that the effect of the Vc peptide initially peaked and then
the response started to recover, perhaps as a result of a dose-dependent effect in which there was
not a sufficient amount of the peptide to interfere with all of the native VAMP proteins at the
synapses, or accessibility of SNARE complexes is limited and only a subset of complexes were
affected by the peptide under resting conditions.
The results showed that the Vc peptide is inhibitory at both phasic and tonic synapses and
the effect can be attributed to the peptide having access the C-terminal end of the trans-SNARE
complex and preventing native VAMP from interacting with the other two SNARE proteins.
This confirmed the neurotoxin results showing that trans-SNARE complexes at phasic and tonic
synapses under resting conditions are in a partially zippered state.
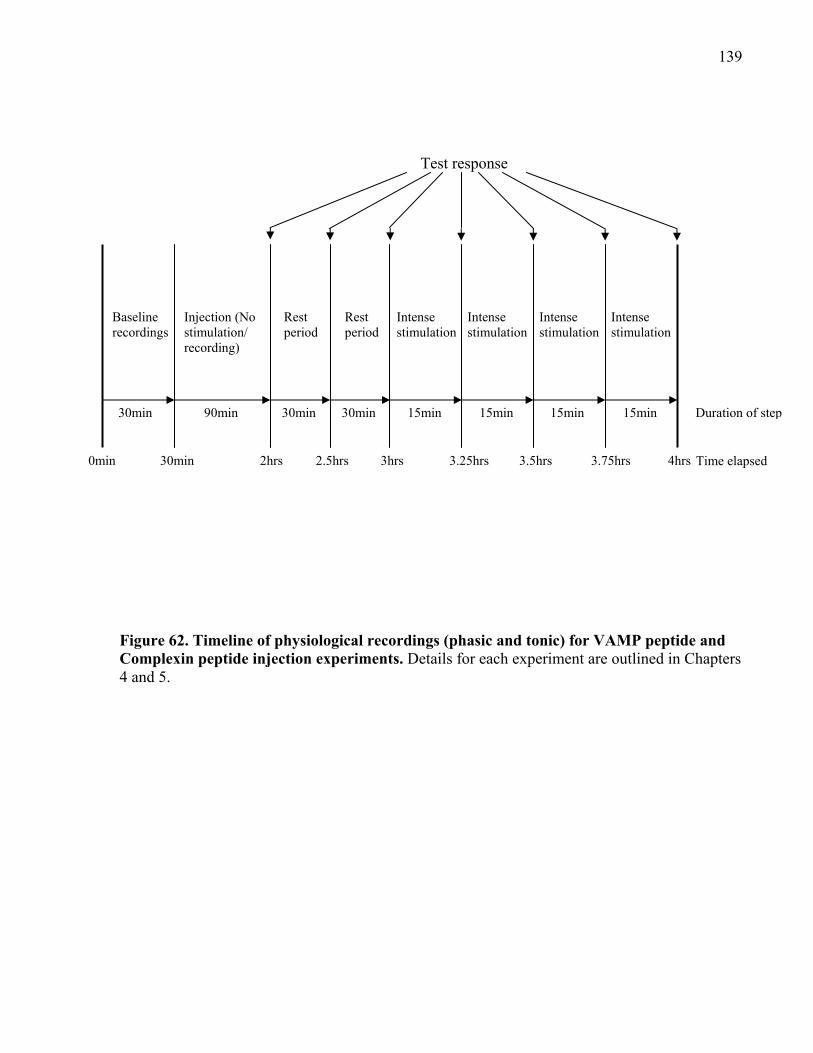
139
30min 90min 30min 30min 15min 15min 15min 15min
Baseline recordings
Injection (No stimulation/ recording)
Rest period
Rest period
Intense stimulation
Intense stimulation
Intense stimulation
Intense stimulation
0min 30min 2hrs 2.5hrs 3hrs 3.25hrs 3.5hrs 3.75hrs 4hrs
Duration of step
Time elapsed
Test response
Figure 62. Timeline of physiological recordings (phasic and tonic) for VAMP peptide and Complexin peptide injection experiments. Details for each experiment are outlined in Chapters 4 and 5.
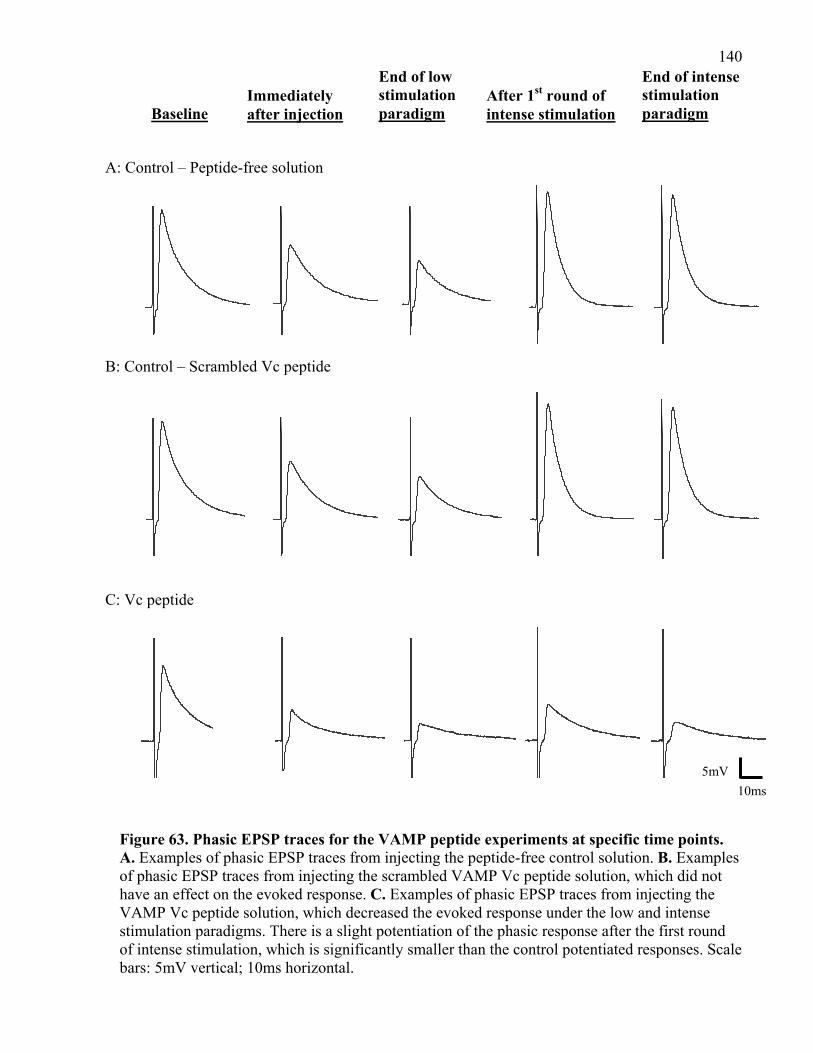
140
Figure 63. Phasic EPSP traces for the VAMP peptide experiments at specific time points. A. Examples of phasic EPSP traces from injecting the peptide-free control solution. B. Examples of phasic EPSP traces from injecting the scrambled VAMP Vc peptide solution, which did not have an effect on the evoked response. C. Examples of phasic EPSP traces from injecting the VAMP Vc peptide solution, which decreased the evoked response under the low and intense stimulation paradigms. There is a slight potentiation of the phasic response after the first round of intense stimulation, which is significantly smaller than the control potentiated responses. Scale bars: 5mV vertical; 10ms horizontal.
Baseline Immediately after injection
End of low stimulation paradigm
After 1st round of intense stimulation
End of intense stimulation paradigm
A: Control – Peptide-free solution
B: Control – Scrambled Vc peptide
C: Vc peptide
5 mV
10.00 ms
5mV
10ms
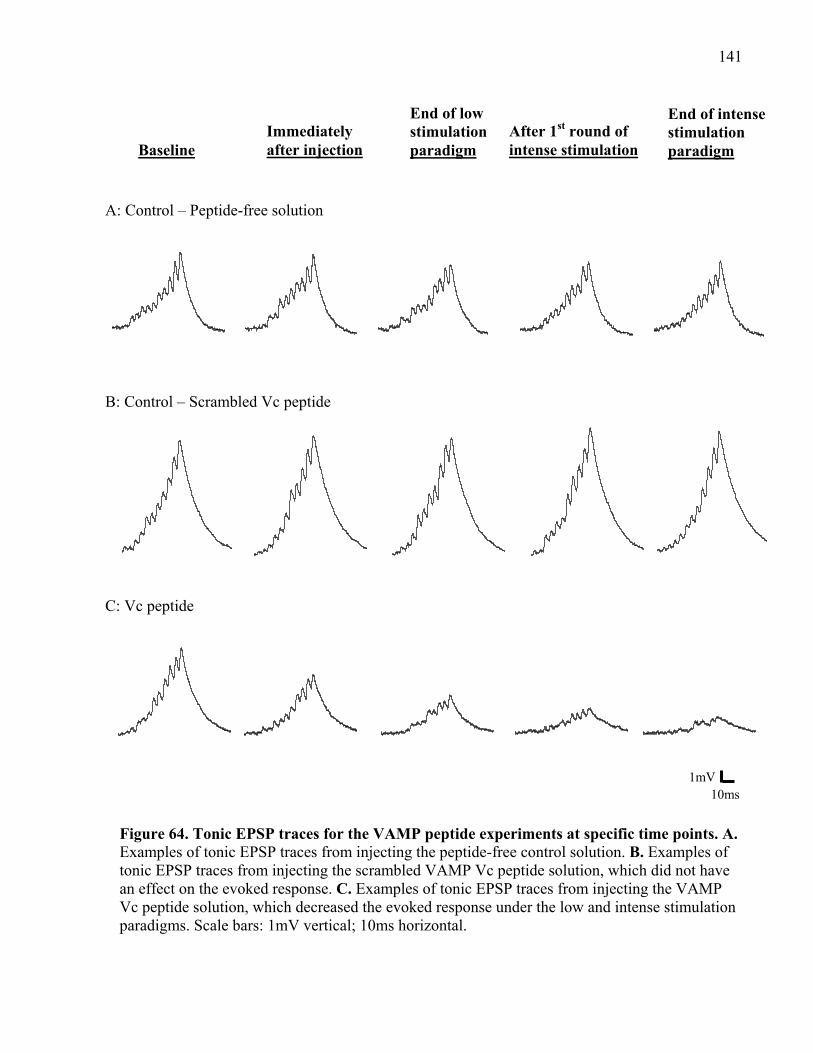
141
Figure 64. Tonic EPSP traces for the VAMP peptide experiments at specific time points. A. Examples of tonic EPSP traces from injecting the peptide-free control solution. B. Examples of tonic EPSP traces from injecting the scrambled VAMP Vc peptide solution, which did not have an effect on the evoked response. C. Examples of tonic EPSP traces from injecting the VAMP Vc peptide solution, which decreased the evoked response under the low and intense stimulation paradigms. Scale bars: 1mV vertical; 10ms horizontal.
Baseline Immediately after injection
End of low stimulation paradigm
After 1st round of intense stimulation
End of intense stimulation paradigm
A: Control – Peptide-free solution
B: Control – Scrambled Vc peptide
C: Vc peptide
1 mV
10.00 ms
1mV10ms
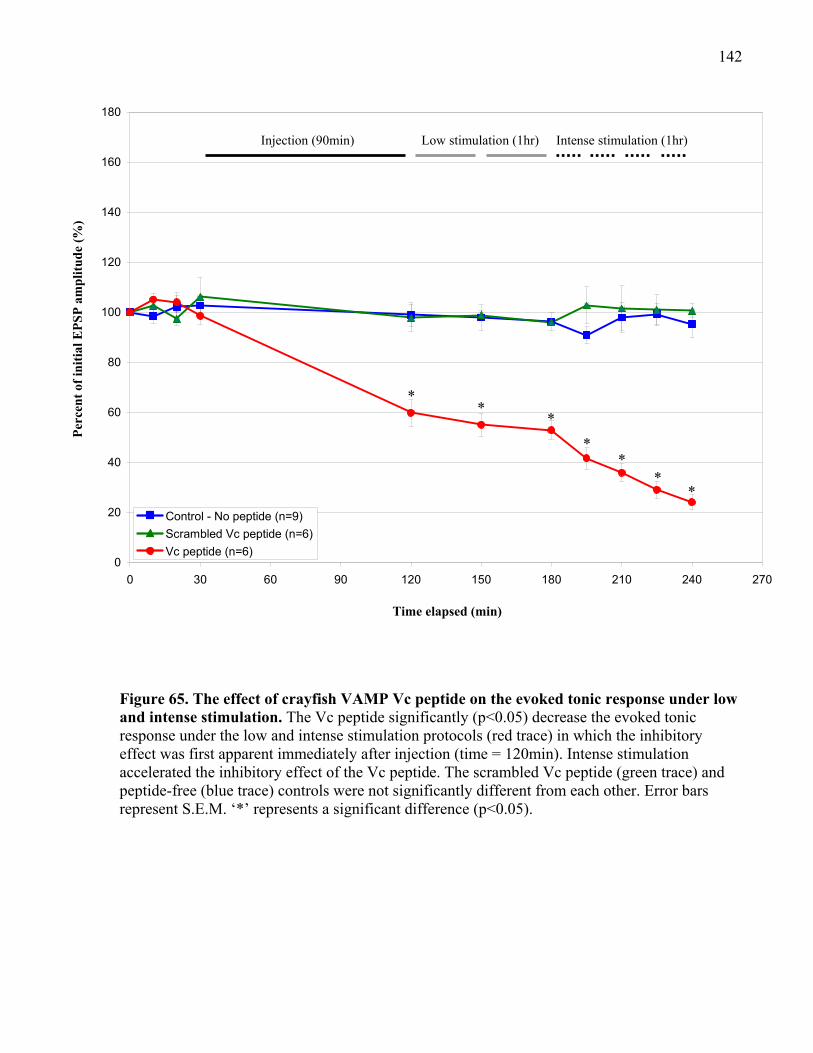
142
0
20
40
60
80
100
120
140
160
180
0 30 60 90 120 150 180 210 240 270
Per
cen
t of
init
ial E
PS
P a
mp
litu
de
(%)
Time elapsed (min)
Injection (90min) Low stimulation (1hr) Intense stimulation (1hr)
**
*
**
**
Control - No peptide (n=9)
Scrambled Vc peptide (n=6)
Vc peptide (n=6)
Figure 65. The effect of crayfish VAMP Vc peptide on the evoked tonic response under low and intense stimulation. The Vc peptide significantly (p<0.05) decrease the evoked tonic response under the low and intense stimulation protocols (red trace) in which the inhibitory effect was first apparent immediately after injection (time = 120min). Intense stimulation accelerated the inhibitory effect of the Vc peptide. The scrambled Vc peptide (green trace) and peptide-free (blue trace) controls were not significantly different from each other. Error bars represent S.E.M. ‘*’ represents a significant difference (p<0.05).
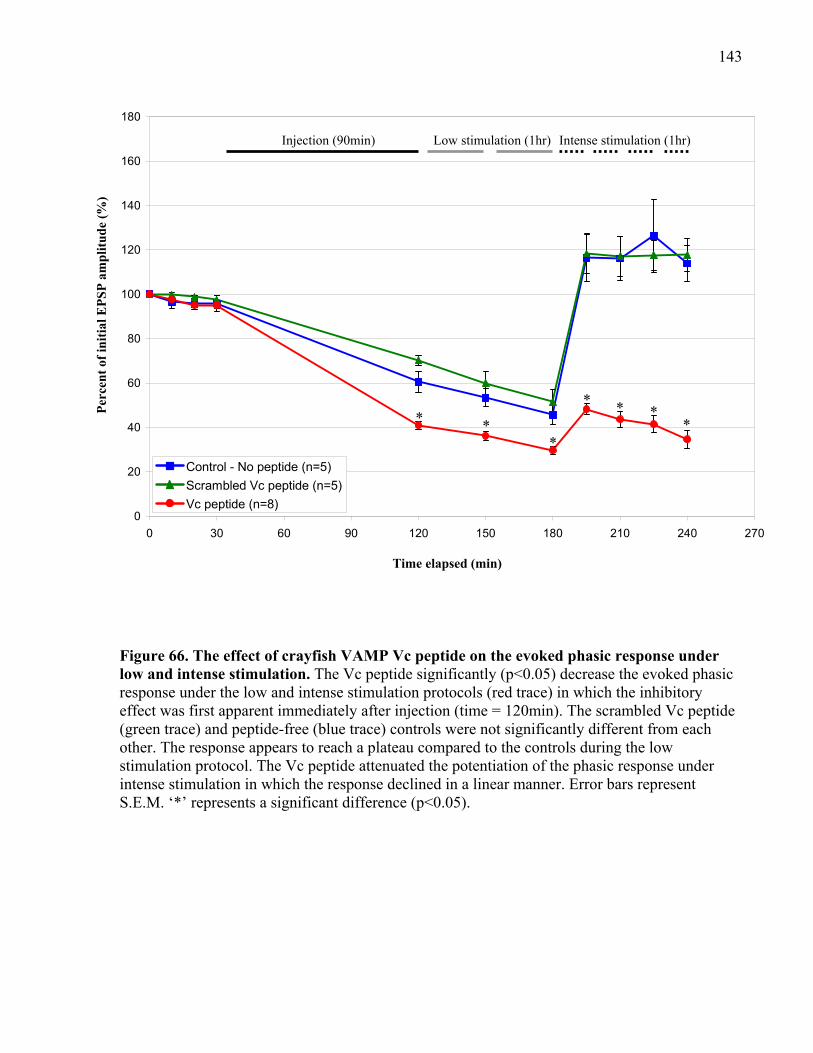
143
0
20
40
60
80
100
120
140
160
180
0 30 60 90 120 150 180 210 240 270
Per
cen
t of
init
ial E
PS
P a
mp
litu
de
(%)
Time elapsed (min)
Injection (90min) Low stimulation (1hr) Intense stimulation (1hr)
* **
* * **
Control - No peptide (n=5)
Scrambled Vc peptide (n=5)
Vc peptide (n=8)
Figure 66. The effect of crayfish VAMP Vc peptide on the evoked phasic response under low and intense stimulation. The Vc peptide significantly (p<0.05) decrease the evoked phasic response under the low and intense stimulation protocols (red trace) in which the inhibitory effect was first apparent immediately after injection (time = 120min). The scrambled Vc peptide (green trace) and peptide-free (blue trace) controls were not significantly different from each other. The response appears to reach a plateau compared to the controls during the low stimulation protocol. The Vc peptide attenuated the potentiation of the phasic response under intense stimulation in which the response declined in a linear manner. Error bars represent S.E.M. ‘*’ represents a significant difference (p<0.05).
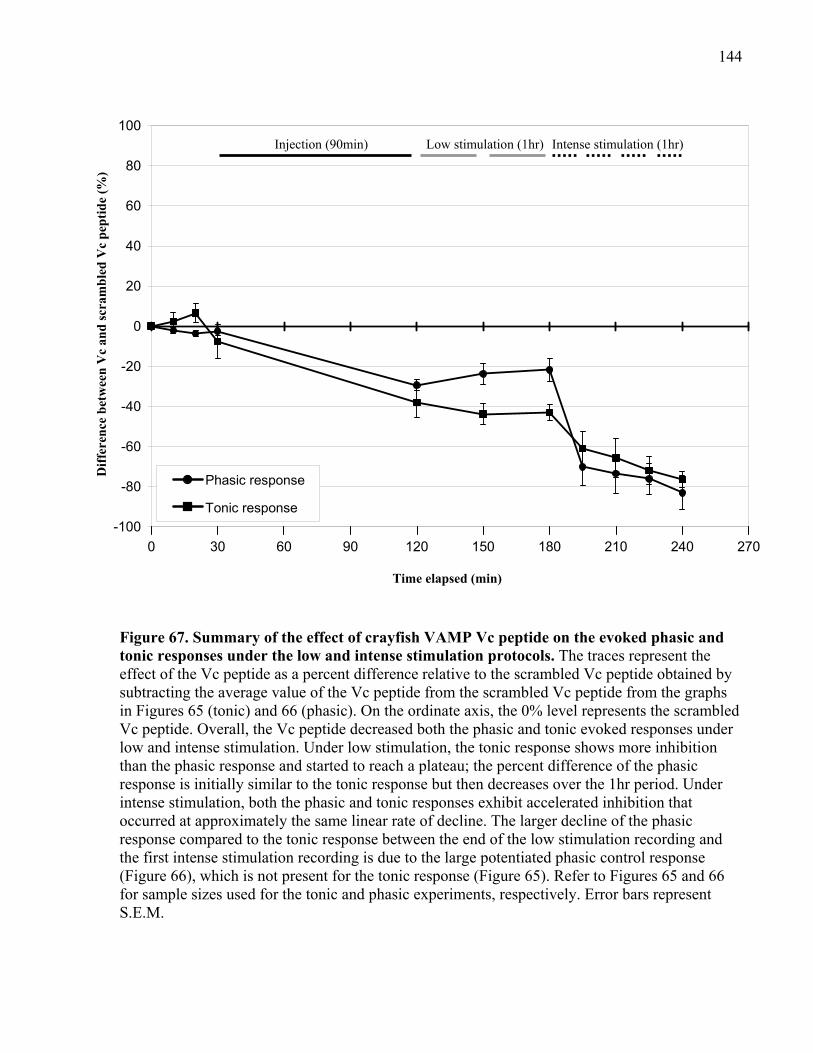
144
-100
-80
-60
-40
-20
0
20
40
60
80
100
0 30 60 90 120 150 180 210 240 270
Phasic response
Tonic response
Dif
fere
nce
bet
wee
n V
c an
d s
cram
ble
d V
c p
epti
de
(%)
Time elapsed (min)
Injection (90min) Low stimulation (1hr) Intense stimulation (1hr)
Figure 67. Summary of the effect of crayfish VAMP Vc peptide on the evoked phasic and tonic responses under the low and intense stimulation protocols. The traces represent the effect of the Vc peptide as a percent difference relative to the scrambled Vc peptide obtained by subtracting the average value of the Vc peptide from the scrambled Vc peptide from the graphs in Figures 65 (tonic) and 66 (phasic). On the ordinate axis, the 0% level represents the scrambled Vc peptide. Overall, the Vc peptide decreased both the phasic and tonic evoked responses under low and intense stimulation. Under low stimulation, the tonic response shows more inhibition than the phasic response and started to reach a plateau; the percent difference of the phasic response is initially similar to the tonic response but then decreases over the 1hr period. Under intense stimulation, both the phasic and tonic responses exhibit accelerated inhibition that occurred at approximately the same linear rate of decline. The larger decline of the phasic response compared to the tonic response between the end of the low stimulation recording and the first intense stimulation recording is due to the large potentiated phasic control response (Figure 66), which is not present for the tonic response (Figure 65). Refer to Figures 65 and 66 for sample sizes used for the tonic and phasic experiments, respectively. Error bars represent S.E.M.
145
4.2.3 The inhibitory effect of the VAMP peptide is accelerated under intense stimulation at phasic and tonic synapses
Immediately following the low stimulation protocol, intense stimulation was applied to
the phasic or tonic axon. As mentioned previously in Chapter 3.2.4, the intense stimulation
paradigm does not measure the effect under resting conditions to reflect the initial release
probability because high frequency stimulation involves fusion of vesicles in both the RRP and
RP. The phasic axon was stimulated using the cuff-stimulator at 10Hz for 2min with an inter-
stimulation interval of 2min, after which recordings were taken once every 15min (three EPSPs
at 0.1Hz) for a total of 1hr. The tonic axon was stimulated using the cuff electrode at 150Hz for
30sec with an inter-stimulation interval of 10sec. Tonic recordings were taken by injecting
current through a sharp microelectrode filled with 3M KCl (10-15MΩ in crayfish saline) used to
impale the tonic axon and stimulating once every 15min using a train of 15 stimuli at 200Hz
(three EPSPs at 0.1Hz) for a total of 1hr. Note that a 20min rest period (used in Chapter 3.2.4 for
neurotoxin injections) was not applied prior to testing the response at each time point for the
intense stimulation protocol because the potentiation of the phasic response would still appear
and, therefore, too much time would be wasted waiting for the potentiated effect to be attenuated.
As a result, this 20min rest period was no longer used for this and subsequent physiological
experiments. Timeline of this protocol is given in Figure 62.
The application of intense stimulation significantly enhanced the inhibitory effect of the
Vc peptide on the phasic and tonic responses. The tonic response showed an accelerated decline
over time (see Figure 64 for tonic EPSP traces; Figures 65 and 67 for tonic data). The phasic
response was also significantly reduced with only a small amount of potentiation observed after
which the response continued to decrease (see Figure 63 for phasic EPSP traces; Figures 66 and
67 for phasic data). This decline is the result of the Vc peptide and not simply the stimulation-
independent depression of the phasic response because the controls showed a large potentiated
response without any decline during this 1hr period. If the small potentiation of the phasic
response was not present, the phasic response may have continued to depress linearly following
the results of the low stimulation paradigm, or the response may have shown a faster rate of
depression similar to the tonic response. The tonic controls maintained baseline levels and the
phasic controls potentiated beyond the baseline, indicating that the scrambled Vc peptide had no
effect on either response.
146
At the end of the intense stimulation protocol, action potentials from the phasic and tonic
axons were recorded and found to be unaffected by the Vc peptide and control solutions
compared to baseline action potentials (Figure 68).
4.2.4 Summary of VAMP Vc peptide experiments
Overall, the Vc peptide inhibited both the phasic and tonic responses; stimulation was not
required but enhanced the effect. This indicates that trans-SNARE complexes under resting
conditions are in a partially zippered state in which the C-terminal end of VAMP is exposed.
However, the similar inhibitory effect at both phasic and tonic synapses indicates that another
factor(s) other than the zippered state of the trans-SNARE complex at rest is responsible for the
difference in the initial release probability between the two types of synapses. This finding
strengthens the conclusions drawn from the neurotoxin experiments in Chapter 3.
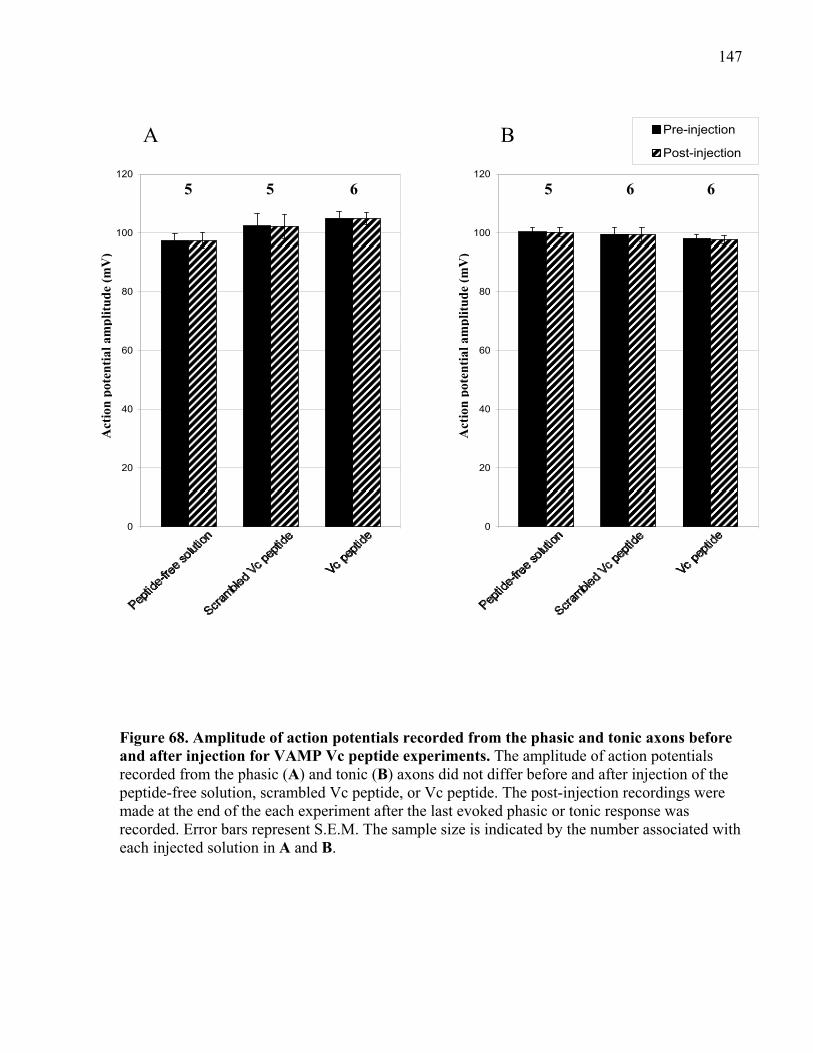
147
Figure 68. Amplitude of action potentials recorded from the phasic and tonic axons before and after injection for VAMP Vc peptide experiments. The amplitude of action potentials recorded from the phasic (A) and tonic (B) axons did not differ before and after injection of the peptide-free solution, scrambled Vc peptide, or Vc peptide. The post-injection recordings were made at the end of the each experiment after the last evoked phasic or tonic response was recorded. Error bars represent S.E.M. The sample size is indicated by the number associated with each injected solution in A and B.
Pre-injection
Post-injection
0
20
40
60
80
100
120
0
20
40
60
80
100
120
Act
ion
pot
enti
al a
mp
litu
de
(mV
)
Act
ion
pot
enti
al a
mp
litu
de
(mV
)
A B
5 5 6 5 6 6
148
Chapter 5: Complexin peptide and release probability
5 Complexin contributes to synaptic strength at phasic and tonic synapses
The results from Chapters 3 and 4 showed that the difference in release probability
between phasic and tonic synapses is not due to a difference in the zippered state of the trans-
SNARE complex at each synapse. Therefore, other factors must be responsible for this
difference. One such candidate is the presynaptic protein, Complexin.
The primary role of Complexin at the synapse is to control the zippering of the SNARE
complex and, therefore, regulate vesicle fusion (Krishnakumar et al., 2011; Li et al., 2011;
Maximov et al., 2009; Xue et al., 2009, 2010; Yang et al., 2010). Disrupting the interaction
between Complexin and the SNARE complex has a significant impact on synaptic output.
Inhibiting or knocking out Complexin decreases the initial probability of release such that Ca2+
sensitivity is reduced resulting in a decrease in the evoked response (Huntwork and Littleton,
2007; Maximov et al., 2009; Reim et al., 2001; Xue et al., 2009, 2010; Yang et al., 2010). The
decrease in evoked release appears to be due to a loss of Ca2+-dependent synchronous release
(Huntwork and Littleton, 2007; Xue et al., 2010). The exact mechanism by which Complexin
controls SNARE zippering remains elusive. The most compelling model is that Complexin has a
dual role in which the accessory α-helix inhibits (clamps) the SNARE complex and the N-
terminal domain promotes SNARE zippering (Maximov et al., 2009; Xue et al., 2009, 2010;
Yang et al., 2010). Complexin could influence release probability by controlling how many
SNARE complexes zipper up and thus how many vesicles undergo fusion in response to Ca2+
influx. Therefore, Complexin could be a significant factor responsible for the large difference in
release probability between crayfish phasic and tonic synapses.
The difference in release probability between the crayfish phasic and tonic synapses
could result if one of Complexin’s two functions is more dominating at one synapse versus the
other. For instance, Complexin could exhibit a greater clamping effect at tonic synapses to
reduce release probability, whereas it could have a weaker clamping effect or greater facilitating
effect to promote more release at phasic synapses. For example, the work of Tokumaru et al.
(2001) showed that the injection into the presynaptic terminal of the squid giant synapse (phasic-
like synapse) of a Complexin peptide based on the central α-helix sequence of squid or rat
inhibited evoked release. Furthermore, Tokumaru et al. showed in-vitro that the peptide can
149
interfere with the interaction between Complexin and Syntaxin but cannot disassemble the
SNARE complex. Therefore, a corresponding crayfish Complexin peptide may produce a similar
inhibitory effect at crayfish phasic synapses. Complexin requires its central α-helix domain to
bind to the SNARE complex to allow the accessory α-helix domain to clamp the SNARE
complex (Bracher et al., 2002; Giraudo et al., 2008, 2009; Tang et al., 2006; Xue et al., 2009).
The central α-helix domain alone cannot clamp the SNARE complex (Giraudo et al., 2008, 2009;
Xue et al., 2007, 2009). Therefore, interfering with the interaction between Complexin and the
SNARE complex should prevent Complexin from clamping the SNARE complex.
I hypothesize that Complexin is required for evoked release, in which it has a greater
facilitating effect at phasic synapses than tonic synapses to account for the larger evoked phasic
response. Therefore, I predict that the peptide will inhibit phasic release (similar to Tomukaru et
al. (2001) squid giant synapse study) and have little to no inhibitory effect at tonic synapses. To
test this hypothesis, I injected into the phasic and tonic axons an interfering peptide based on the
central α-helix domain of Complexin to prevent native Complexin from interacting with the
SNARE complex.
5.1 Complexin is present in crayfish nervous tissue
A Complexin antibody was used for immunocytochemistry and Western blot to
determine if crayfish nervous tissue contains Complexin. The results are presented in the
following two sections.
5.1.1 Immunocytochemistry
Dissected crayfish first or second walking leg extensor muscle preparations were probed
with the polyclonal rabbit Complexin antibody (1:1000; gift from Dr. J.T. Littleton, M.I.T.,
Cambridge, MA., USA) and visualized using a goat anti-rabbit Alexa 594 fluorescent antibody
(1:1000; Invitrogen). The phasic and tonic axons were co-labeled with the monoclonal mouse
Synapsin 3C11 antibody (1:100; Developmental Studies Hybridoma Bank, University of Iowa,
Iowa City, IA., USA) and visualized using a goat anti-mouse Alexa 488 fluorescent antibody
(1:1000; Invitrogen). The immunocytochemistry procedure outlined in Chapter 2.4 was followed.
The Complexin antibody was made to the antigenic full-length Drosophila Complexin protein
(Huntwork and Littleton, 2007). Unfortunately, the antibody was not affinity purified and,
therefore, contained other proteins that are native to the rabbit serum.
150
Staining was observed in both the phasic and tonic axonal terminals with high fluorescent
staining in boutons (Figure 69). Staining was diffuse throughout the phasic and tonic boutons and
overlapped with Synapsin staining, indicating that Complexin associates closely with synaptic
vesicles. However, staining was also observed in muscle fibres and more so in what appeared to
be satellite cells on the surface of the muscle fibres (Harrington and Atwood, 1995; Novotová
and Uhrίk, 1992). Staining in muscle fibres was also observed by Huntwork and Littleton (2007)
in Drosophila 3rd instar larvae preparations and likely represents non-specific interactions of the
antibody since the solution was not affinity purified. The results indicate that Complexin is
present in both phasic and tonic axonal terminals and, therefore, the difference in release
probability between the two synapses is not simply the lack of Complexin in one terminal versus
the other.
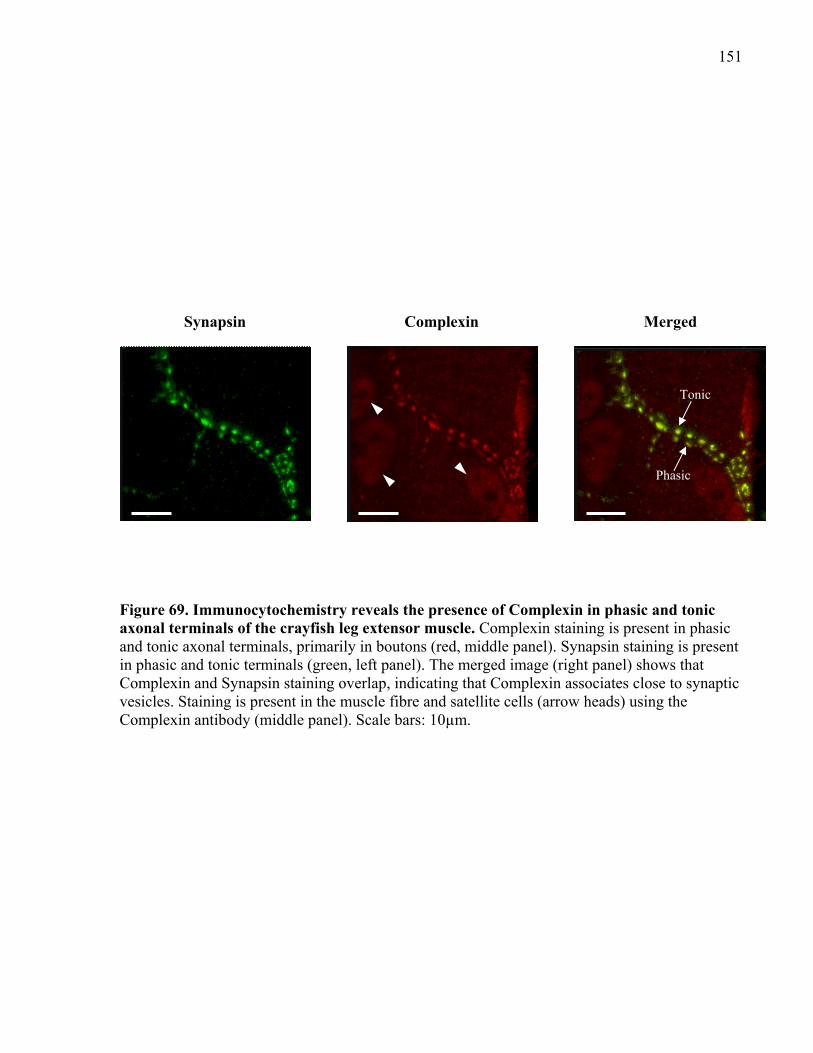
151
Merged Complexin Synapsin
Tonic
Phasic
Figure 69. Immunocytochemistry reveals the presence of Complexin in phasic and tonic axonal terminals of the crayfish leg extensor muscle. Complexin staining is present in phasic and tonic axonal terminals, primarily in boutons (red, middle panel). Synapsin staining is present in phasic and tonic terminals (green, left panel). The merged image (right panel) shows that Complexin and Synapsin staining overlap, indicating that Complexin associates close to synaptic vesicles. Staining is present in the muscle fibre and satellite cells (arrow heads) using the Complexin antibody (middle panel). Scale bars: 10µm.
152
5.1.2 SDS-PAGE and Western blot
I performed SDS-PAGE and Western blotting on protein samples extracted from 20
crayfish nerve cords and 40 leg extensor muscles, and probed each sample with the Complexin
antibody (1:1000) and visualized using a goat anti-rabbit-HRP antibody (1:1000; Jackson
ImmunoResearch, Inc.). The procedure outlined in Chapter 2.5 was followed.
The Western blot (Figure 70) showed that a single protein band of ~18kDa was identified
in the nervous tissue; however, multiple bands of higher molecular weights were identified in the
leg extensor muscle sample. This result indicates that the antibody is specific for Complexin in
nervous tissue with the expected molecular weight of ~18kDa (Ishizuka et al., 1995, 1997; Reim
et al., 2005; Xue et al., 2009). This strengthens the finding that the staining in the axonal
terminals represents Complexin. There could be more than one isoform of Complexin in the
nervous tissue; however, no evidence of this was found in which separate but closely spaced
bands would have been observed on the blot (i.e. Reim et al., 2005). Therefore, only one isoform
of Complexin may exist in crayfish nervous tissue, similar to that found in Drosophila
(Huntwork and Littleton, 2007).
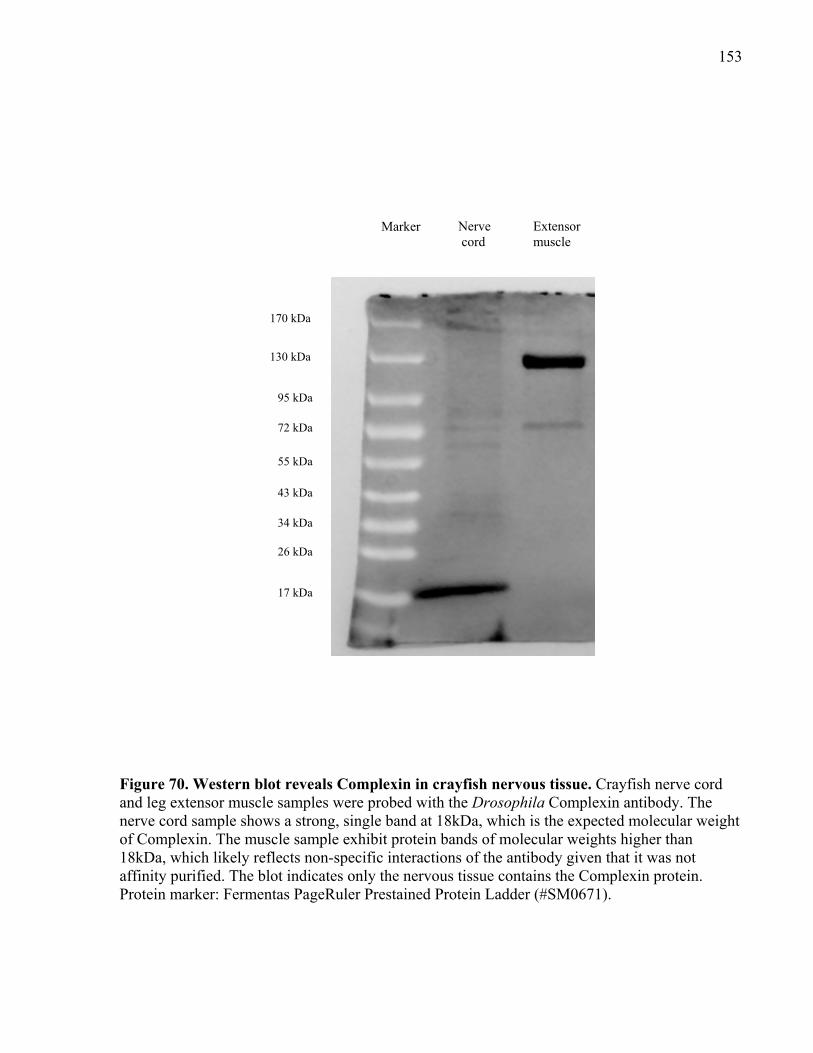
153
17 kDa
26 kDa
34 kDa
43 kDa
55 kDa
72 kDa
95 kDa
130 kDa
170 kDa
Nerve cord
Extensor muscle
Marker
Figure 70. Western blot reveals Complexin in crayfish nervous tissue. Crayfish nerve cord and leg extensor muscle samples were probed with the Drosophila Complexin antibody. The nerve cord sample shows a strong, single band at 18kDa, which is the expected molecular weight of Complexin. The muscle sample exhibit protein bands of molecular weights higher than 18kDa, which likely reflects non-specific interactions of the antibody given that it was not affinity purified. The blot indicates only the nervous tissue contains the Complexin protein. Protein marker: Fermentas PageRuler Prestained Protein Ladder (#SM0671).
154
5.2 Sequence of partial crayfish Complexin and interfering Complexin peptide
The cloning and sequencing protocol outlined in Chapter 2.9 resulted in four partial
crayfish Complexin sequences. The four sequences were similar to each other, and differences
occurred at the same residue positions between each sequence (see Figure 71). The four partial
sequences are part of the central α-helix domain required for Complexin to interact with the
SNARE complex (Pabst et al., 2000) and are homologous to the corresponding region of
Complexin in other species (see Figure 71). It is unknown whether or not each sequence
represents a different Complexin isoform or the same isoform because the full-length crayfish
Complexin sequence is presently unknown. Further testing will be required to obtain the full-
length Complexin sequence to help identify the number of Complexin isoforms in crayfish. The
interfering Complexin peptide used in this study was made to the central α-helix domain
sequence in which the alignment in Figure 71 was used to design a single peptide sequence
derived from the similarities between the four partial sequences and the corresponding region in
other species. The Complexin peptide and corresponding scrambled peptide sequences are
presented in Chapter 2.9.4, Figure 29. The effects of the Complexin peptide on evoked phasic
and tonic release are presented in the next section (5.3).
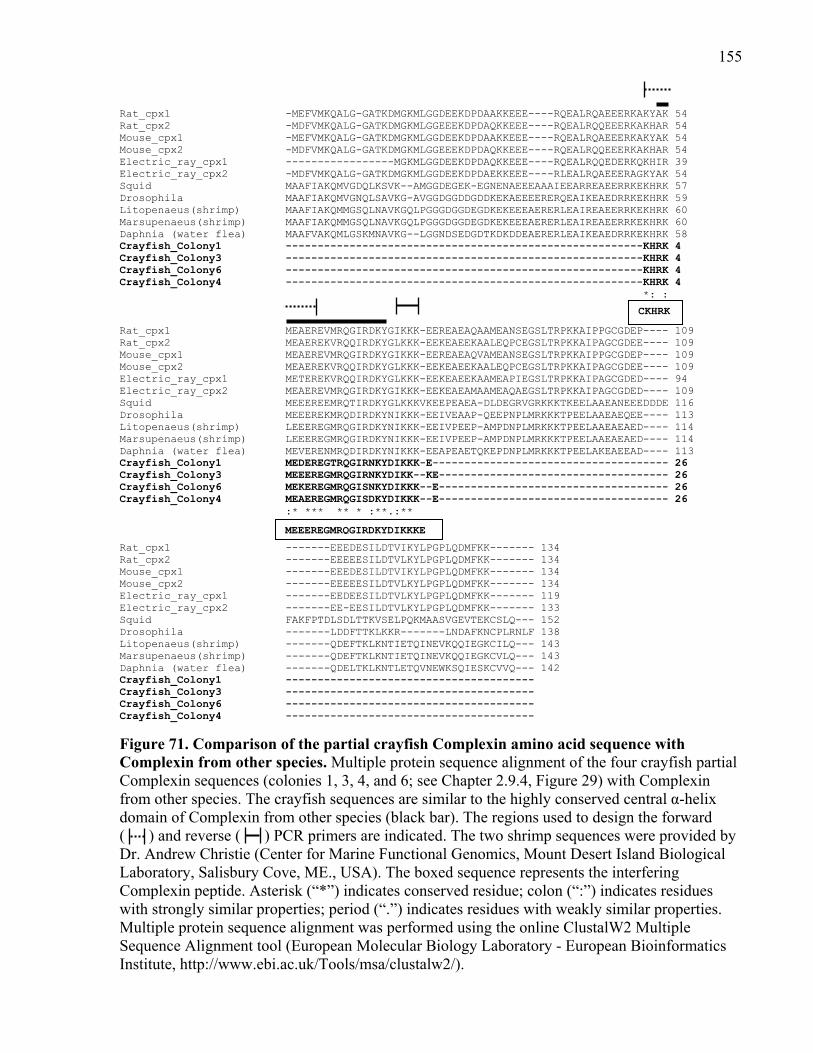
155
Rat_cpx1 -MEFVMKQALG-GATKDMGKMLGGDEEKDPDAAKKEEE----RQEALRQAEEERKAKYAK 54 Rat_cpx2 -MDFVMKQALG-GATKDMGKMLGGEEEKDPDAQKKEEE----RQEALRQQEEERKAKHAR 54 Mouse_cpx1 -MEFVMKQALG-GATKDMGKMLGGDEEKDPDAAKKEEE----RQEALRQAEEERKAKYAK 54 Mouse_cpx2 -MDFVMKQALG-GATKDMGKMLGGEEEKDPDAQKKEEE----RQEALRQQEEERKAKHAR 54 Electric_ray_cpx1 -----------------MGKMLGGDEEKDPDAQKKEEE----RQEALRQQEDERKQKHIR 39 Electric_ray_cpx2 -MDFVMKQALG-GATKDMGKMLGGDEEKDPDAEKKEEE----RLEALRQAEEERAGKYAK 54 Squid MAAFIAKQMVGDQLKSVK--AMGGDEGEK-EGNENAEEEAAAIEEARREAEERRKEKHRK 57 Drosophila MAAFIAKQMVGNQLSAVKG-AVGGDGGDDGDDKEKAEEEERERQEAIKEAEDRRKEKHRK 59 Litopenaeus(shrimp) MAAFIAKQMMGSQLNAVKGQLPGGGDGGDEGDKEKEEEAERERLEAIREAEERRKEKHRK 60 Marsupenaeus(shrimp) MAAFIAKQMMGSQLNAVKGQLPGGGDGGDEGDKEKEEEAERERLEAIREAEERRKEKHRK 60 Daphnia (water flea) MAAFVAKQMLGSKMNAVKG--LGGNDSEDGDTKDKDDEAERERLEAIKEAEDRRKEKHRK 58 Crayfish_Colony1 --------------------------------------------------------KHRK 4 Crayfish_Colony3 --------------------------------------------------------KHRK 4 Crayfish_Colony6 --------------------------------------------------------KHRK 4 Crayfish_Colony4 --------------------------------------------------------KHRK 4 *: : Rat_cpx1 MEAEREVMRQGIRDKYGIKKK-EEREAEAQAAMEANSEGSLTRPKKAIPPGCGDEP---- 109 Rat_cpx2 MEAEREKVRQQIRDKYGLKKK-EEKEAEEKAALEQPCEGSLTRPKKAIPAGCGDEE---- 109 Mouse_cpx1 MEAEREVMRQGIRDKYGIKKK-EEREAEAQVAMEANSEGSLTRPKKAIPPGCGDEP---- 109 Mouse_cpx2 MEAEREKVRQQIRDKYGLKKK-EEKEAEEKAALEQPCEGSLTRPKKAIPAGCGDEE---- 109 Electric_ray_cpx1 METEREKVRQQIRDKYGLKKK-EEKEAEEKAAMEAPIEGSLTRPKKAIPAGCGDED---- 94 Electric_ray_cpx2 MEAEREVMRQGIRDKYGIKKK-EEKEAEAMAAMEAQAEGSLTRPKKAIPAGCGDED---- 109 Squid MEEEREEMRQTIRDKYGLKKKVKEEPEAEA-DLDEGRVGRKKKTKEELAAEANEEEDDDE 116 Drosophila MEEEREKMRQDIRDKYNIKKK-EEIVEAAP-QEEPNPLMRKKKTPEELAAEAEQEE---- 113 Litopenaeus(shrimp) LEEEREGMRQGIRDKYNIKKK-EEIVPEEP-AMPDNPLMRKKKTPEELAAEAEAED---- 114 Marsupenaeus(shrimp) LEEEREGMRQGIRDKYNIKKK-EEIVPEEP-AMPDNPLMRKKKTPEELAAEAEAED---- 114 Daphnia (water flea) MEVERENMRQDIRDKYNIKKK-EEAPEAETQKEPDNPLMRKKKTPEELAKEAEEAD---- 113 Crayfish_Colony1 MEDEREGTRQGIRNKYDIKKK-E------------------------------------- 26 Crayfish_Colony3 MEEEREGMRQGIRNKYDIKK--KE------------------------------------ 26 Crayfish_Colony6 MEKEREGMRQGISNKYDIKKK--E------------------------------------ 26 Crayfish_Colony4 MEAEREGMRQGISDKYDIKKK--E------------------------------------ 26 :* *** ** * :**.:** Rat_cpx1 -------EEEDESILDTVIKYLPGPLQDMFKK------- 134 Rat_cpx2 -------EEEEESILDTVLKYLPGPLQDMFKK------- 134 Mouse_cpx1 -------EEEDESILDTVIKYLPGPLQDMFKK------- 134 Mouse_cpx2 -------EEEEESILDTVLKYLPGPLQDMFKK------- 134 Electric_ray_cpx1 -------EEDEESILDTVLKYLPGPLQDMFKK------- 119 Electric_ray_cpx2 -------EE-EESILDTVLKYLPGPLQDMFKK------- 133 Squid FAKFPTDLSDLTTKVSELPQKMAASVGEVTEKCSLQ--- 152 Drosophila -------LDDFTTKLKKR-------LNDAFKNCPLRNLF 138 Litopenaeus(shrimp) -------QDEFTKLKNTIETQINEVKQQIEGKCILQ--- 143 Marsupenaeus(shrimp) -------QDEFTKLKNTIETQINEVKQQIEGKCVLQ--- 143 Daphnia (water flea) -------QDELTKLKNTLETQVNEWKSQIESKCVVQ--- 142 Crayfish_Colony1 --------------------------------------- Crayfish_Colony3 --------------------------------------- Crayfish_Colony6 --------------------------------------- Crayfish_Colony4 ---------------------------------------
Figure 71. Comparison of the partial crayfish Complexin amino acid sequence with Complexin from other species. Multiple protein sequence alignment of the four crayfish partial Complexin sequences (colonies 1, 3, 4, and 6; see Chapter 2.9.4, Figure 29) with Complexin from other species. The crayfish sequences are similar to the highly conserved central α-helix domain of Complexin from other species (black bar). The regions used to design the forward ( ) and reverse ( ) PCR primers are indicated. The two shrimp sequences were provided by Dr. Andrew Christie (Center for Marine Functional Genomics, Mount Desert Island Biological Laboratory, Salisbury Cove, ME., USA). The boxed sequence represents the interfering Complexin peptide. Asterisk (“*”) indicates conserved residue; colon (“:”) indicates residues with strongly similar properties; period (“.”) indicates residues with weakly similar properties. Multiple protein sequence alignment was performed using the online ClustalW2 Multiple Sequence Alignment tool (European Molecular Biology Laboratory - European Bioinformatics Institute, http://www.ebi.ac.uk/Tools/msa/clustalw2/).
MEEEREGMRQGIRDKYDIKKKE
CKHRK
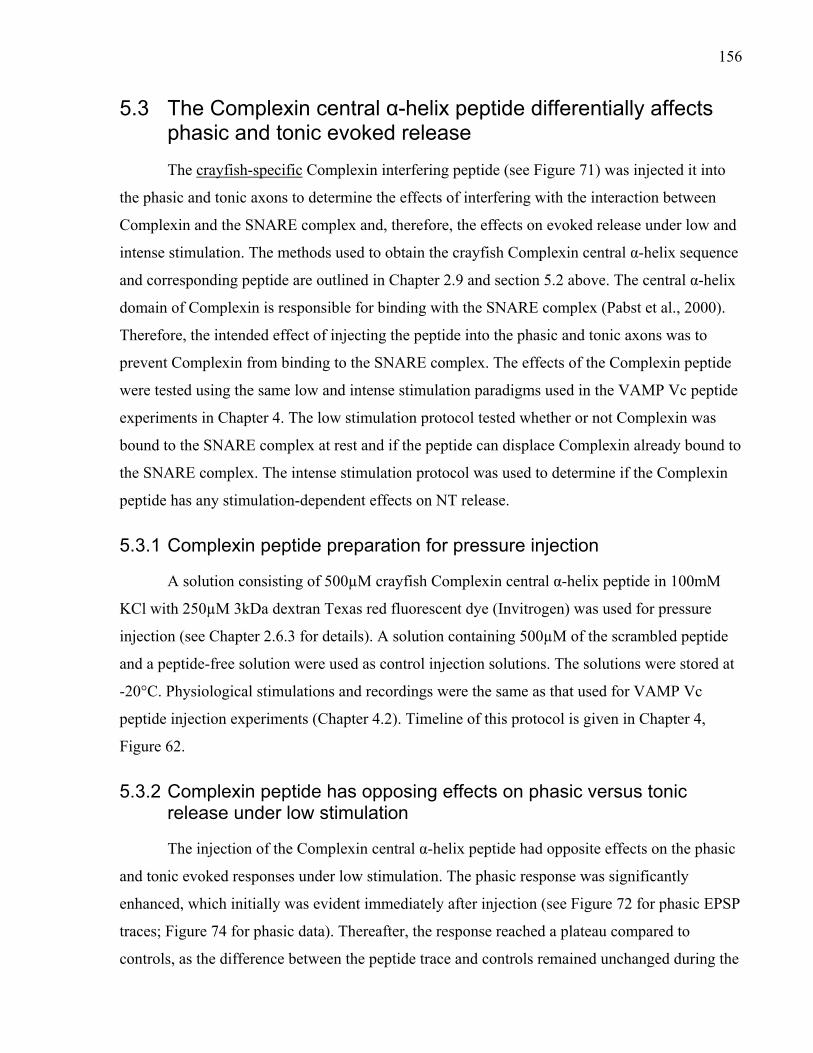
156
5.3 The Complexin central α-helix peptide differentially affects phasic and tonic evoked release
The crayfish-specific Complexin interfering peptide (see Figure 71) was injected it into
the phasic and tonic axons to determine the effects of interfering with the interaction between
Complexin and the SNARE complex and, therefore, the effects on evoked release under low and
intense stimulation. The methods used to obtain the crayfish Complexin central α-helix sequence
and corresponding peptide are outlined in Chapter 2.9 and section 5.2 above. The central α-helix
domain of Complexin is responsible for binding with the SNARE complex (Pabst et al., 2000).
Therefore, the intended effect of injecting the peptide into the phasic and tonic axons was to
prevent Complexin from binding to the SNARE complex. The effects of the Complexin peptide
were tested using the same low and intense stimulation paradigms used in the VAMP Vc peptide
experiments in Chapter 4. The low stimulation protocol tested whether or not Complexin was
bound to the SNARE complex at rest and if the peptide can displace Complexin already bound to
the SNARE complex. The intense stimulation protocol was used to determine if the Complexin
peptide has any stimulation-dependent effects on NT release.
5.3.1 Complexin peptide preparation for pressure injection
A solution consisting of 500µM crayfish Complexin central α-helix peptide in 100mM
KCl with 250µM 3kDa dextran Texas red fluorescent dye (Invitrogen) was used for pressure
injection (see Chapter 2.6.3 for details). A solution containing 500µM of the scrambled peptide
and a peptide-free solution were used as control injection solutions. The solutions were stored at
-20°C. Physiological stimulations and recordings were the same as that used for VAMP Vc
peptide injection experiments (Chapter 4.2). Timeline of this protocol is given in Chapter 4,
Figure 62.
5.3.2 Complexin peptide has opposing effects on phasic versus tonic release under low stimulation
The injection of the Complexin central α-helix peptide had opposite effects on the phasic
and tonic evoked responses under low stimulation. The phasic response was significantly
enhanced, which initially was evident immediately after injection (see Figure 72 for phasic EPSP
traces; Figure 74 for phasic data). Thereafter, the response reached a plateau compared to
controls, as the difference between the peptide trace and controls remained unchanged during the
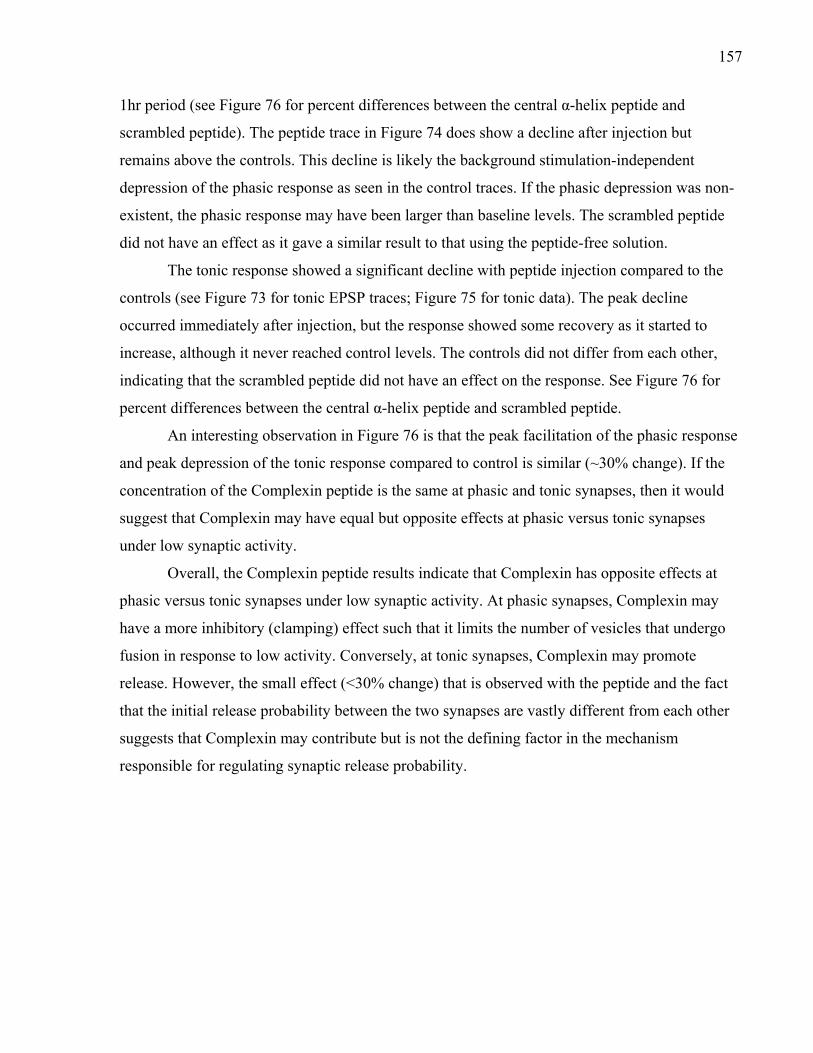
157
1hr period (see Figure 76 for percent differences between the central α-helix peptide and
scrambled peptide). The peptide trace in Figure 74 does show a decline after injection but
remains above the controls. This decline is likely the background stimulation-independent
depression of the phasic response as seen in the control traces. If the phasic depression was non-
existent, the phasic response may have been larger than baseline levels. The scrambled peptide
did not have an effect as it gave a similar result to that using the peptide-free solution.
The tonic response showed a significant decline with peptide injection compared to the
controls (see Figure 73 for tonic EPSP traces; Figure 75 for tonic data). The peak decline
occurred immediately after injection, but the response showed some recovery as it started to
increase, although it never reached control levels. The controls did not differ from each other,
indicating that the scrambled peptide did not have an effect on the response. See Figure 76 for
percent differences between the central α-helix peptide and scrambled peptide.
An interesting observation in Figure 76 is that the peak facilitation of the phasic response
and peak depression of the tonic response compared to control is similar (~30% change). If the
concentration of the Complexin peptide is the same at phasic and tonic synapses, then it would
suggest that Complexin may have equal but opposite effects at phasic versus tonic synapses
under low synaptic activity.
Overall, the Complexin peptide results indicate that Complexin has opposite effects at
phasic versus tonic synapses under low synaptic activity. At phasic synapses, Complexin may
have a more inhibitory (clamping) effect such that it limits the number of vesicles that undergo
fusion in response to low activity. Conversely, at tonic synapses, Complexin may promote
release. However, the small effect (<30% change) that is observed with the peptide and the fact
that the initial release probability between the two synapses are vastly different from each other
suggests that Complexin may contribute but is not the defining factor in the mechanism
responsible for regulating synaptic release probability.
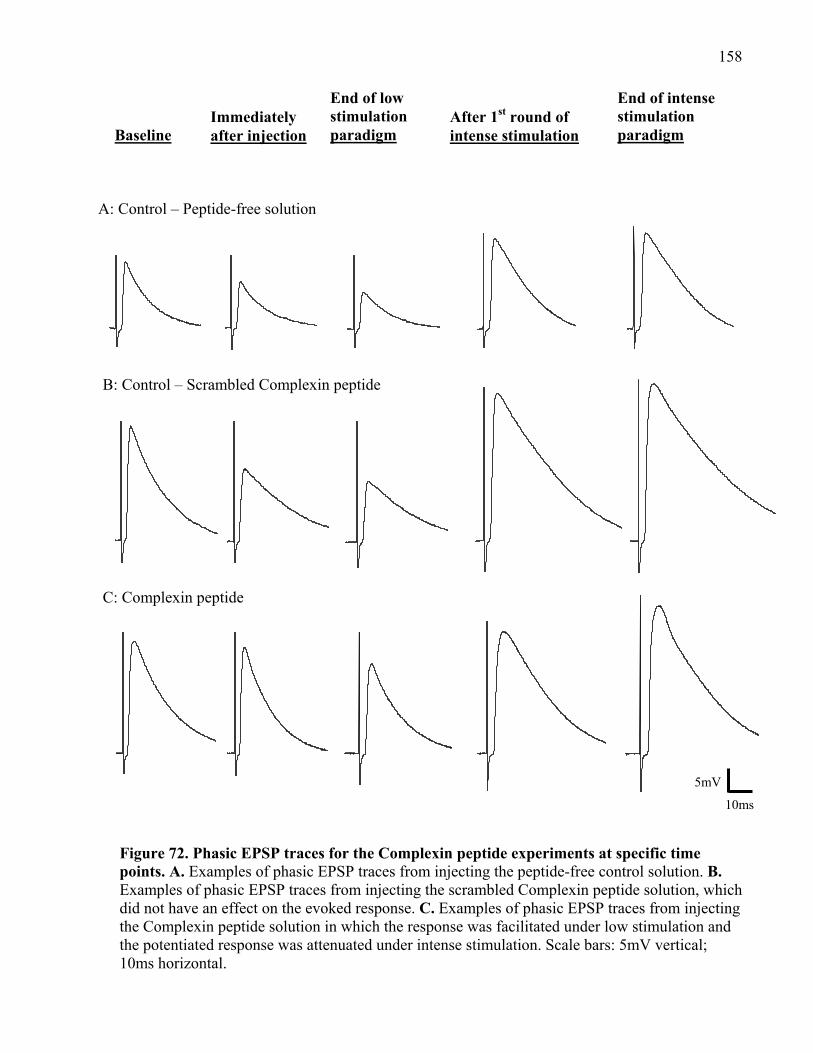
158
Figure 72. Phasic EPSP traces for the Complexin peptide experiments at specific time points. A. Examples of phasic EPSP traces from injecting the peptide-free control solution. B. Examples of phasic EPSP traces from injecting the scrambled Complexin peptide solution, which did not have an effect on the evoked response. C. Examples of phasic EPSP traces from injecting the Complexin peptide solution in which the response was facilitated under low stimulation and the potentiated response was attenuated under intense stimulation. Scale bars: 5mV vertical; 10ms horizontal.
5 mV
10.00 ms
A: Control – Peptide-free solution
B: Control – Scrambled Complexin peptide
C: Complexin peptide
Baseline Immediately after injection
End of low stimulation paradigm
After 1st round of intense stimulation
End of intense stimulation paradigm
5mV
10ms
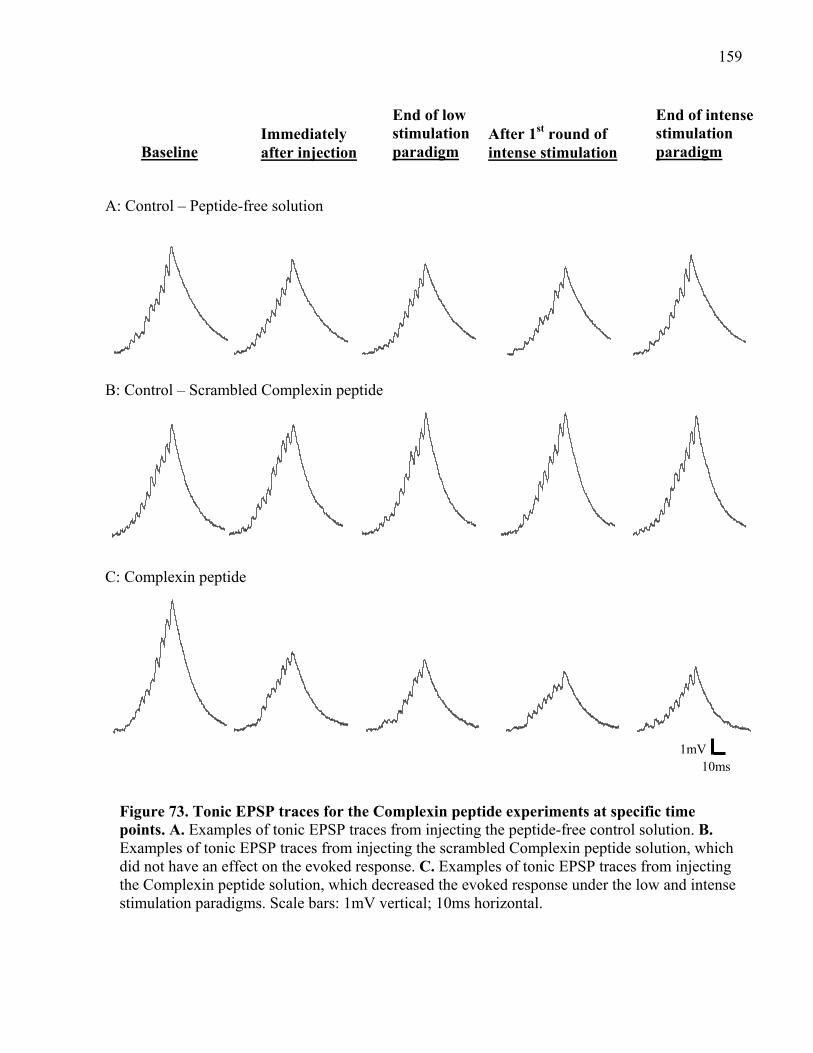
159
Figure 73. Tonic EPSP traces for the Complexin peptide experiments at specific time points. A. Examples of tonic EPSP traces from injecting the peptide-free control solution. B. Examples of tonic EPSP traces from injecting the scrambled Complexin peptide solution, which did not have an effect on the evoked response. C. Examples of tonic EPSP traces from injecting the Complexin peptide solution, which decreased the evoked response under the low and intense stimulation paradigms. Scale bars: 1mV vertical; 10ms horizontal.
Baseline Immediately after injection
End of low stimulation paradigm
After 1st round of intense stimulation
End of intense stimulation paradigm
A: Control – Peptide-free solution
B: Control – Scrambled Complexin peptide
C: Complexin peptide
1 mV
10.00 ms
1mV10ms
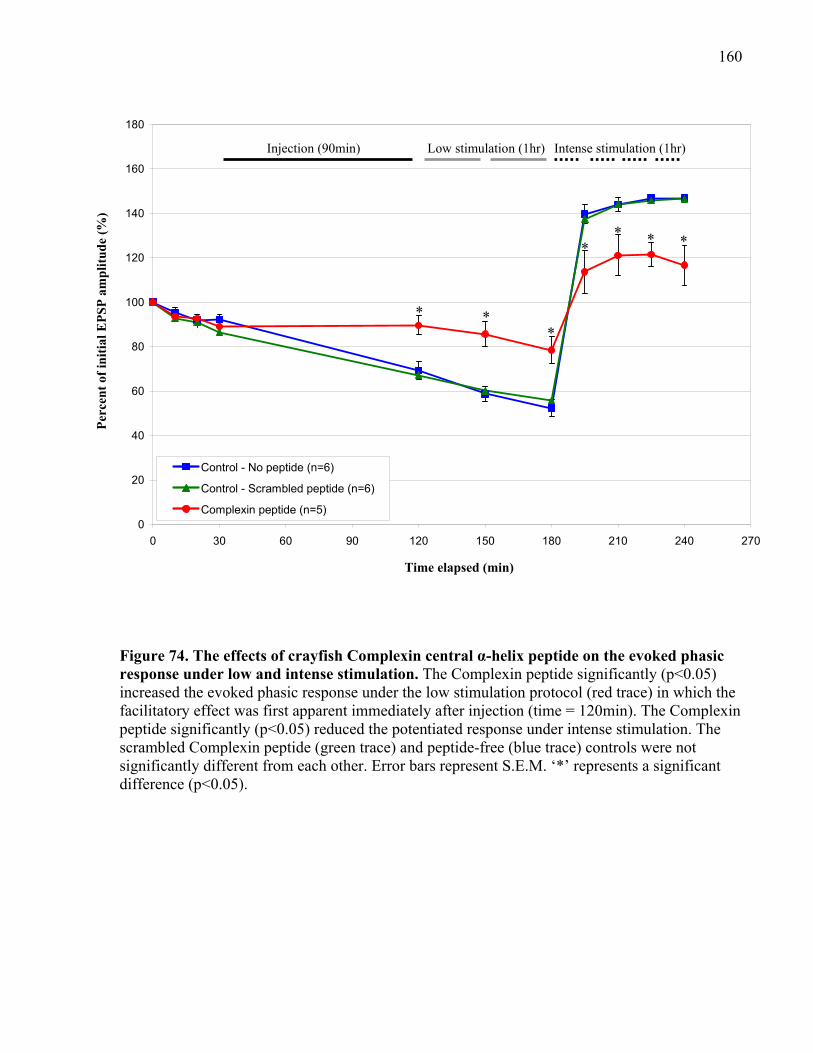
160
0
20
40
60
80
100
120
140
160
180
0 30 60 90 120 150 180 210 240 270
Per
cen
t of
init
ial E
PS
P a
mp
litu
de
(%)
Time elapsed (min)
Injection (90min) Low stimulation (1hr) Intense stimulation (1hr)
* **
** * *
Control - No peptide (n=6)
Control - Scrambled peptide (n=6)
Complexin peptide (n=5)
Figure 74. The effects of crayfish Complexin central α-helix peptide on the evoked phasic response under low and intense stimulation. The Complexin peptide significantly (p<0.05) increased the evoked phasic response under the low stimulation protocol (red trace) in which the facilitatory effect was first apparent immediately after injection (time = 120min). The Complexin peptide significantly (p<0.05) reduced the potentiated response under intense stimulation. The scrambled Complexin peptide (green trace) and peptide-free (blue trace) controls were not significantly different from each other. Error bars represent S.E.M. ‘*’ represents a significant difference (p<0.05).
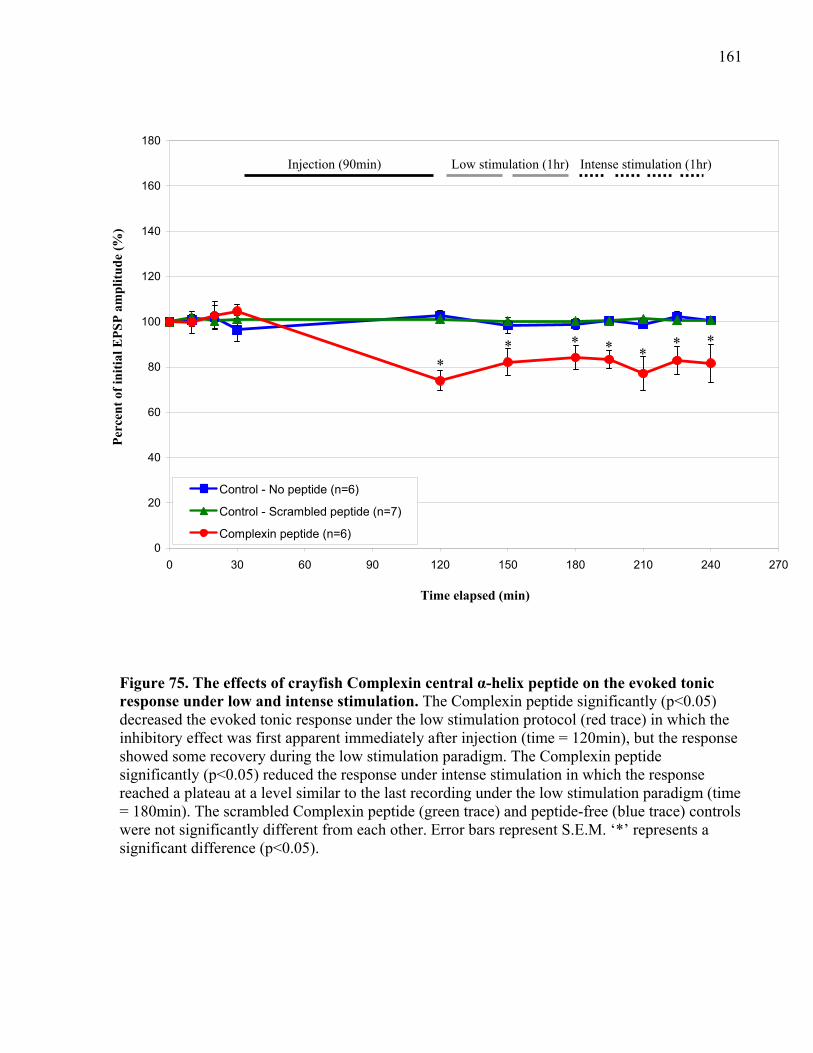
161
0
20
40
60
80
100
120
140
160
180
0 30 60 90 120 150 180 210 240 270
Per
cen
t of
init
ial E
PS
P a
mp
litu
de
(%)
Time elapsed (min)
Injection (90min) Low stimulation (1hr) Intense stimulation (1hr)
** * * *
* *
Control - No peptide (n=6)
Control - Scrambled peptide (n=7)
Complexin peptide (n=6)
Figure 75. The effects of crayfish Complexin central α-helix peptide on the evoked tonic response under low and intense stimulation. The Complexin peptide significantly (p<0.05) decreased the evoked tonic response under the low stimulation protocol (red trace) in which the inhibitory effect was first apparent immediately after injection (time = 120min), but the response showed some recovery during the low stimulation paradigm. The Complexin peptide significantly (p<0.05) reduced the response under intense stimulation in which the response reached a plateau at a level similar to the last recording under the low stimulation paradigm (time = 180min). The scrambled Complexin peptide (green trace) and peptide-free (blue trace) controls were not significantly different from each other. Error bars represent S.E.M. ‘*’ represents a significant difference (p<0.05).
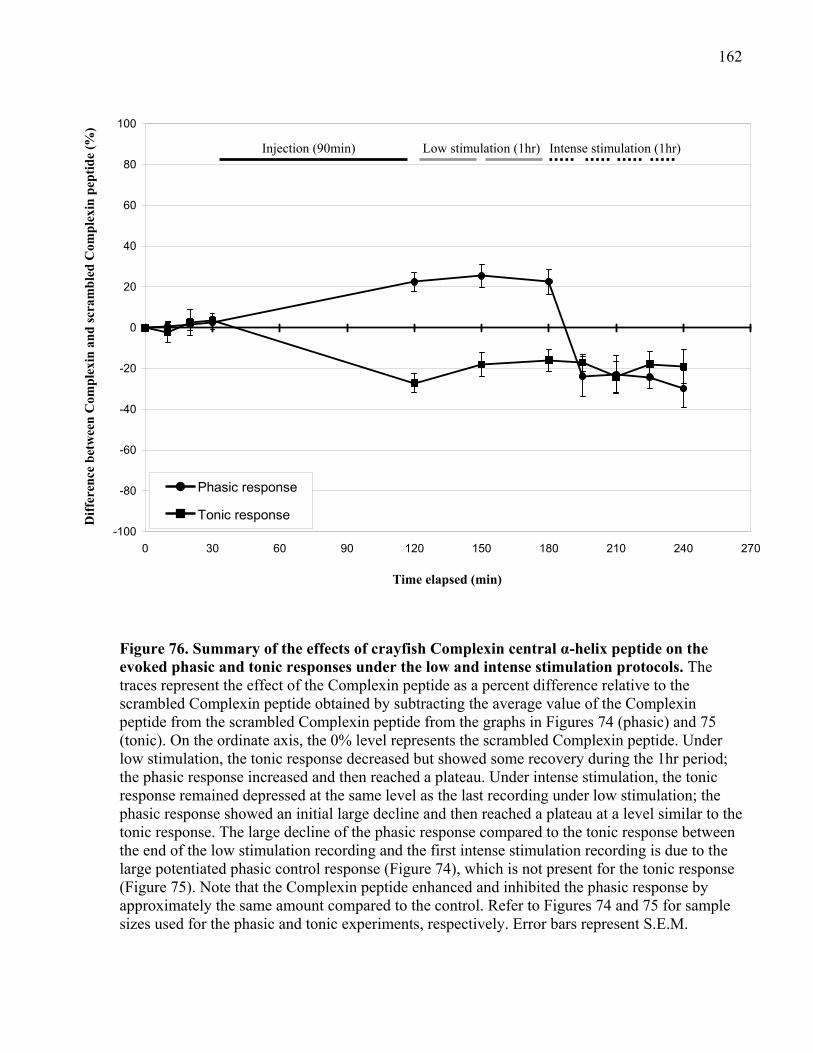
162
-100
-80
-60
-40
-20
0
20
40
60
80
100
0 30 60 90 120 150 180 210 240 270
Dif
fere
nce
bet
wee
n C
omp
lexi
n a
nd
scr
amb
led
Com
ple
xin
pep
tid
e (%
)
Time elapsed (min)
Phasic response
Tonic response
Injection (90min) Low stimulation (1hr) Intense stimulation (1hr)
Figure 76. Summary of the effects of crayfish Complexin central α-helix peptide on the evoked phasic and tonic responses under the low and intense stimulation protocols. The traces represent the effect of the Complexin peptide as a percent difference relative to the scrambled Complexin peptide obtained by subtracting the average value of the Complexin peptide from the scrambled Complexin peptide from the graphs in Figures 74 (phasic) and 75 (tonic). On the ordinate axis, the 0% level represents the scrambled Complexin peptide. Under low stimulation, the tonic response decreased but showed some recovery during the 1hr period; the phasic response increased and then reached a plateau. Under intense stimulation, the tonic response remained depressed at the same level as the last recording under low stimulation; the phasic response showed an initial large decline and then reached a plateau at a level similar to the tonic response. The large decline of the phasic response compared to the tonic response between the end of the low stimulation recording and the first intense stimulation recording is due to the large potentiated phasic control response (Figure 74), which is not present for the tonic response (Figure 75). Note that the Complexin peptide enhanced and inhibited the phasic response by approximately the same amount compared to the control. Refer to Figures 74 and 75 for sample sizes used for the phasic and tonic experiments, respectively. Error bars represent S.E.M.
163
5.3.3 Complexin peptide attenuates release at phasic and tonic synapses under intense stimulation
The injection of the Complexin peptide under intense stimulation attenuated both the
phasic (Figures 72 and 74) and tonic (Figures 73 and 75) evoked responses (percent difference
between the central α-helix peptide and scrambled peptide under intense stimulation is given in
Figure 76). At phasic synapses, post-tetanic potentiation (PTP) was observed but was
significantly smaller than both controls, which were similar to each other. At tonic synapses, the
response was significantly lower than the controls and remained at a constant level similar to the
last recording under the low stimulation paradigm, except for a small decline at time point
210min (see Figure 75). This steady-state could represent an equilibrium that is reached between
the Complexin peptide and native Complexin protein at the synapse. Comparing the traces in
Figure 76 shows that the amount of depression compared to the scrambled peptide is similar
between the phasic and tonic responses under intense stimulation. This indicates that the
Complexin peptide may induce the same level of inhibition under high activity at phasic and
tonic synapses. Furthermore, the peptide resulted in a similar amount of facilitation under low
stimulation and depression under intense stimulation of the phasic response, indicating that
Complexin may have equal but opposite effects at phasic synapses depending on the level of
activity. It is unknown if these effects are simply due to the amount of peptide present at each
type of synapse as the concentration of the peptide in the axonal terminals cannot be accurately
measured. The controls were similar to each other, indicating that the scrambled peptide did not
have an effect at either synapse. At the end of the intense stimulation protocol, action potentials
were recorded from the phasic and tonic axons and found to be unaffected by the central α-helix
peptide and control solutions compared to baseline action potentials (Figure 77).
Overall, under intense stimulation, the Complexin peptide has a moderate inhibitory
effect at both phasic and tonic synapses in which it reduces the phasic potentiation and
suppresses the tonic response such that it cannot recover back to baseline level.
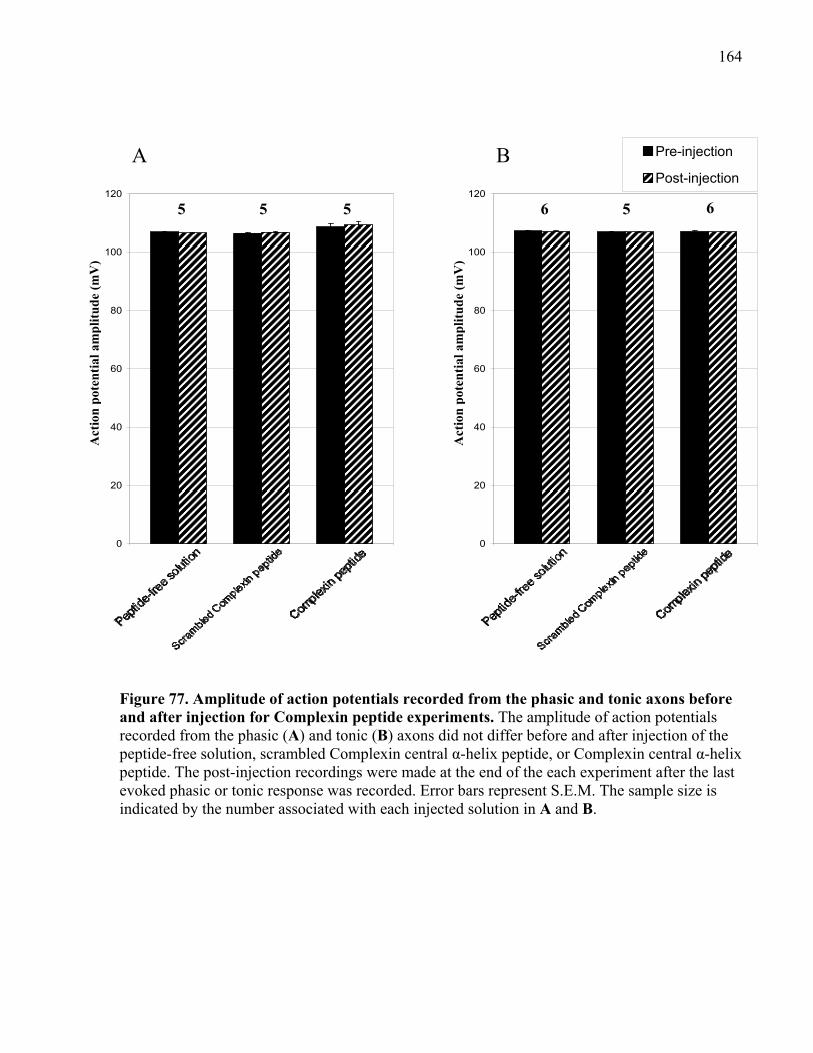
164
Figure 77. Amplitude of action potentials recorded from the phasic and tonic axons before and after injection for Complexin peptide experiments. The amplitude of action potentials recorded from the phasic (A) and tonic (B) axons did not differ before and after injection of the peptide-free solution, scrambled Complexin central α-helix peptide, or Complexin central α-helix peptide. The post-injection recordings were made at the end of the each experiment after the last evoked phasic or tonic response was recorded. Error bars represent S.E.M. The sample size is indicated by the number associated with each injected solution in A and B.
Pre-injection
Post-injection
0
20
40
60
80
100
120
0
20
40
60
80
100
120
Act
ion
pot
enti
al a
mp
litu
de
(mV
)
Act
ion
pot
enti
al a
mp
litu
de
(mV
)
A B
5 5 5 6 5 6
165
5.3.4 Summary of the effects of the Complexin peptide
The low stimulation results showed that the Complexin peptide increases release at
phasic synapses but reduces release at tonic synapses. Therefore, it appears that Complexin
exhibits a dual function in which it can both inhibit and promote release. Under low levels of
synaptic activity, Complexin’s inhibitory role is greater at phasic synapses whereas it promotes
release at tonic synapses. However, the intense stimulation results revealed that the Complexin
peptide primarily exhibits an inhibitory effect at both phasic and tonic synapses. The peptide
attenuated but did not block phasic PTP and appeared to suppress the tonic response below the
baseline and control levels. Therefore, under high synaptic activity, Complexin promotes an
increase in release, especially at phasic synapses. The tonic response normally does facilitate
under intense stimulation (see Appendix 2) but it recovers quickly and often disappears before
test recordings are made.
The dual functions of Complexin can also be observed in the phasic recordings alone.
The results in Figure 74 show that Complexin limits the amount of release under low stimulation
but helps to enhance release under intense stimulation. The tonic recording indicates that
Complexin helps to only promote release because the Complexin peptide inhibited release under
low and intense stimulation. However, it was observed that the amplitude of a single phasic
EPSP was always larger than a single tonic EPSP, even in the presence of the Complexin
interfering peptide. Therefore, Complexin is not solely responsible for the difference in the
release probability between the phasic and tonic synapses. A possible scenario is that Complexin
may be tailored to function differently at each type of synapse, perhaps by the level of
phosphorylation, or by working in concert with specific factors unique to each type of synapse
that together create a mechanism to regulate release probability.
In addition to the Complexin peptide, I also injected the Complexin antibody into the
phasic and tonic axons to test the effects of inactivating Complexin on release probability. Initial
trial experiments conducted at the end of 2009 showed that injecting the antibody facilitated the
phasic response and depressed the tonic response under low and high frequency stimulation. The
antibody produced a greater effect compared to the peptide at both phasic and tonic synapses
under low frequency stimulation. Under intense stimulation, the effect of the antibody was
opposite to that of the peptide for phasic responses but similar for tonic responses. Therefore, the
results indicate that Complexin does play a role in regulating release probability at phasic and

166
tonic synapses. However, when I tried to repeat the experiments using the same antibody in 2011
I found that the antibody had no effect at either synapse. Since I could not replicate my initial
findings, I decided not to include these experiments in the Results section. Instead, I present my
results in Appendix 3.
167
Chapter 6: Discussion
6 Discussion
The primary aim of this thesis was to determine some factors that contribute to the initial
release probability at the synapse. The phasic and tonic synapses of the crayfish walking leg
extensor muscle were used as the synaptic model system because of the large difference in
release probability between the two synapses. I tested two primary hypotheses: (1) Greater
zippering of the trans-SNARE complex confers higher release probability; and (2) Complexin
promotes vesicle fusion. The results using the VAMP-specific neurotoxins and interfering
peptide showed that SNARE complexes are partially zippered at both phasic and tonic synapses
under resting conditions. This indicated that initial release probability is not due to differences in
the zippered state of the SNARE complex, falsifying my first hypothesis. Secondly, the results of
using the interfering Complexin peptide showed that Complexin contributes to release
probability; however, its effects are small but opposite at phasic versus tonic synapses.
Therefore, Complexin may clamp the SNARE complex in the same manner at phasic and tonic
synapses but the mechanism associated with Complexin involved in removing the clamp just
prior to vesicle fusion may differ between the phasic and tonic synapses and contribute more to
the difference in release probability.
The Discussion is divided into two main sections. The first section (6.1) discusses the
results obtained from experiments that employed the VAMP-specific neurotoxins and Vc peptide
to assess the zippered state of the SNARE complex. The second section (6.2) discusses the
results obtained from experiments that employed the interfering Complexin peptide to determine
the role of Complexin in regulating release probability. Following these two sections, a summary
is provided that outlines how SNARE zippering and Complexin contribute to release at crayfish
phasic and tonic synapses (section 6.3), and what other factors may contribute to initial release
probability (section 6.4).
6.1 Partially zippered SNARE complexes at phasic and tonic synapses
The results of the neurotoxin and Vc peptide experiments indicate that trans-SNARE
complexes associated with vesicles in the RRP at phasic and tonic synapses are in a partially
zippered state under resting conditions. Therefore, the difference in the initial release probability
168
between phasic and tonic synapses is not the result of a difference in the zippered state of the
SNARE complex.
6.1.1 The use of Clostridial neurotoxins to determine the zippered state of the SNARE complex
The VAMP-specific neurotoxins (BoNT/B/D-LC and TeNT-LC) were used to assess the
zippered state of the SNARE complex based on their ability to cleave VAMP. When VAMP is
cleaved, the cytosolic domain separates from the transmembrane domain. The soluble cleaved
fragment can still form a complex with the t-SNAREs but it is not fusogenic because the vesicle
is not linked to the target membrane by the complex and cannot undergo fusion. This produces a
decrease in evoked release, which was observed under low stimulation only with BoNT/B-LC
and by all three neurotoxins under intense stimulation.
The neurotoxins revealed that the trans-SNARE complexes at phasic and tonic synapses
under resting conditions exist in a partially zippered state. This complex is estimated to be
zippered half way (N-terminal end to approximately the zero layer) such that the shared binding
site of TeNT and BoNT/D are occluded but the cleavage site of TeNT, and maybe the cleavage
site of BoNT/D, are exposed (see Figure 78). In addition, BoNT/B’s binding site and cleavage
site (shared with TeNT) are exposed.
The soluble cleaved product of VAMP can also be inhibitory as it can compete with
native VAMP for the t-SNAREs and form a non-fusogenic complex. Together the cleavage of
VAMP and the inhibitory effect of the soluble cleaved product contribute to the decrease of the
evoked response when each neurotoxin has an effect. Therefore, the decrease in the evoked
response may have been an accelerated effect which would otherwise depress at a slower rate if
the cleaved product was removed immediately from the system. In addition, the cleaved product
can sequester t-SNARE complexes at the active zone and effectively remove potential fusion
sites. Therefore, fewer sites for vesicle fusion to occur can result in a decrease of the evoked
response. I did not investigate effects of the cleavage product.
The soluble, cleaved VAMP products can inhibit the effects of the neurotoxins because
the BoNT/D-LC and TeNT-LC-BoNT/B-LC cleaved products contain the binding site for each
neurotoxin and can therefore sequester each neurotoxin (Chen et al., 2008; Sikorra et al., 2008).
This may partially explain why the neurotoxins do not completely abolish the evoked response in
Chapter 3.2.4 at phasic (Figure 40) and tonic (Figure 41) synapses.
169
6.1.2 The use of VAMP Vc peptide to determine the zippered state of the SNARE complex
The VAMP Vc peptide contains the C-terminal end of the crayfish VAMP SNARE motif
sequence. Therefore, if the C-terminal end of the partially zippered SNARE complex is exposed,
the peptide could interact with the complex in this region. The results of the Vc peptide
experiments in Chapter 4 confirmed my hypothesis showing that the Vc peptide inhibited evoked
release at both phasic and tonic synapses. This indicated that the SNARE complexes are partially
zippered at rest, thus confirming the results using the neurotoxins (see Figure 78). The peptide
likely evoked its inhibitory effect by binding to the C-terminal end of Syntaxin and SNAP-25 to
form a non-fusogenic SNARE complex. This complex likely contains the N-terminal half of
native VAMP but the peptide prevents the C-terminal half from zippering up in response to
elevated Ca2+.
The inhibitory effect of the Vc peptide was surprising because other studies have shown
that a similar peptide either has no effect when injected into intact synaptic systems (Cornille et
al., 1995; Hunt et al., 1994; Jung et al., 2008) or facilitates the rate of fusion in proteoliposomal
fusion assays in the presence of the three SNARE proteins (Chicka et al., 2008; Cypionka et al.,
2009; Holt et al., 2008; Melia et al., 2002; Vites et al., 2008). The facilitation of liposomal fusion
is believed to result from the peptide stabilizing the t-SNARE complex or the partially zippered
SNARE complex, making it easier for full-length VAMP to zipper up at the C-terminal end
(Pobbati et al., 2006). This implies that the peptide binds weakly with the SNAREs and is easily
displaced by VAMP. Therefore, the inhibitory effect of the crayfish-specific Vc peptide at phasic
and tonic synapses could be the result of the peptide binding so strongly with the t-SNAREs that
it cannot be displaced by native VAMP.
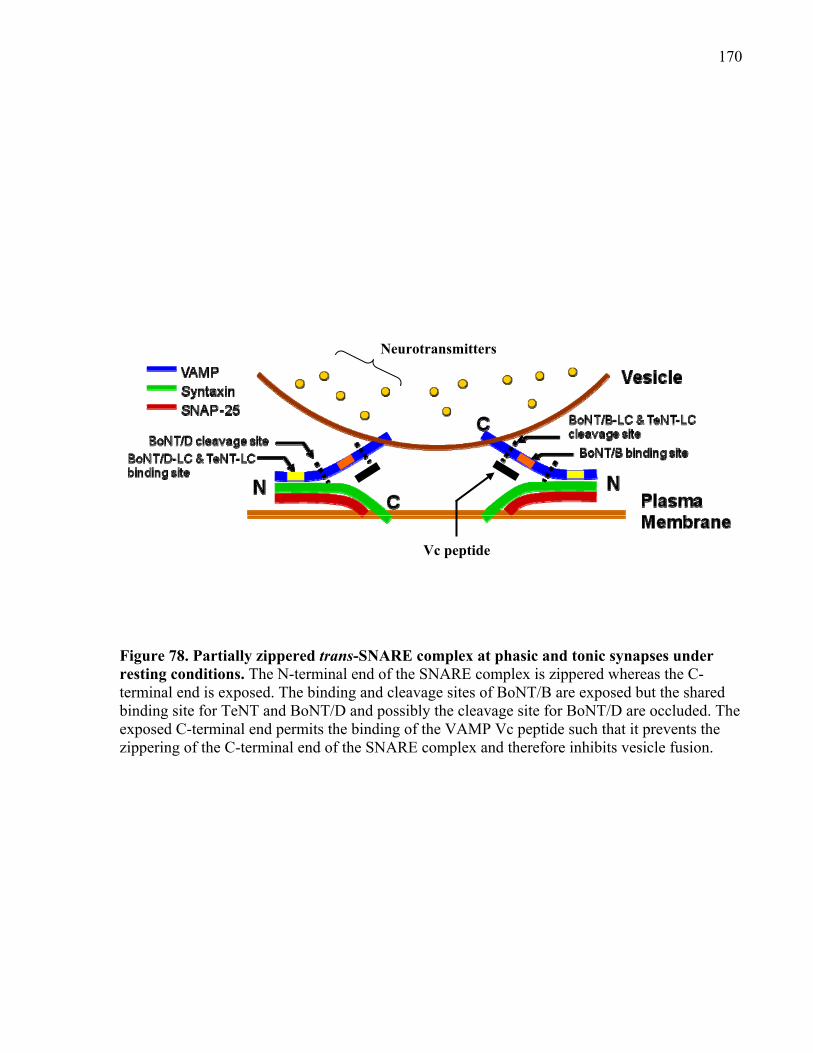
170
Figure 78. Partially zippered trans-SNARE complex at phasic and tonic synapses under resting conditions. The N-terminal end of the SNARE complex is zippered whereas the C-terminal end is exposed. The binding and cleavage sites of BoNT/B are exposed but the shared binding site for TeNT and BoNT/D and possibly the cleavage site for BoNT/D are occluded. The exposed C-terminal end permits the binding of the VAMP Vc peptide such that it prevents the zippering of the C-terminal end of the SNARE complex and therefore inhibits vesicle fusion.
Vc peptide
Neurotransmitters
171
6.1.3 The effects of neurotoxins and VAMP Vc peptide during intense stimulation
As each round of vesicle fusion occurs, the SNAREs briefly dissociate before interacting
again. When the SNAREs are free, each neurotoxin can bind to and cleave VAMP, or the Vc
peptide can block C-terminal zippering of the SNARE complex. This prevents the formation of a
fusogenic SNARE complex such that vesicles can no longer undergo fusion.
I could not continuously record the evoked responses during intense stimulation due to
strong muscle contractions. However, I did observe for each round of stimulation for a few
experiments in which I tried to record the evoked response (not shown) that both the phasic and
tonic responses do show an initial brief facilitation. Following this, the phasic response declines
to a steady-state level below the baseline, whereas the tonic response remains at a steady,
facilitated state. In the presence of the neurotoxins during each round of stimulation, the amount
of initial facilitation decreases and the overall response depresses (the phasic response declines
faster compared to controls). The effect was greater with BoNT/B-LC because the neurotoxin
was already effective (cleaved VAMP) without requiring stimulation. The Vc peptide produced a
similar effect. These observations suggest that the initial RRP is recruited first to produce the
initial facilitated response, which is then followed by the recruitment of the RP in addition to
vesicle recycling to account for the steady-state release (Millar et al., 2002; Schneggenburger et
al., 1999).
The effect of BoNT/D-LC and TeNT-LC is the result of the cleavage of VAMP when the
cis-SNARE complex unzippers to form the trans-SNARE complex either during vesicle
recycling or when the vesicles in the RP prepare for fusion once they move to the active zone.
The action of BoNT/B-LC can occur even before stimulation is applied such that VAMP in both
the RRP and RP is cleaved and, therefore, during stimulation most vesicles cannot undergo
fusion, resulting in an accelerated decline of the EPSP amplitude during intense stimulation. This
would explain why the observed facilitation of the evoked response during stimulation is smaller
for BoNT/B-LC than BoNT/D-LC and TeNT-LC. As mentioned previously, the cleaved VAMP
product can also contribute to the decline of the evoked response because it can act as an
interfering peptide. Since the cleaved fragment contains the N-terminal half of the SNARE motif,
it works by competing with native VAMP and forms a non-fusogenic SNARE complex (Jung et
al., 2008; Melia et al., 2002; Pobbati et al., 2006). During intense stimulation, the fragment
172
works in a similar manner to BoNT/D-LC and TeNT-LC in that it will only have an effect when
trans-SNARE complexes try to form between the vesicle and active zone membranes.
The accelerated inhibitory effect of the Vc peptide during intense stimulation is similar to
the effect of the cleaved VAMP product in that it will only prevent the fusion of vesicles that
originated in the RRP or RP when the trans-SNARE complex forms at the active zone. However,
unlike the cleaved VAMP fragment, a partially zippered SNARE complex can form but the Vc
peptide prevents the zippering at the C-terminal end to arrest fusion. Therefore, the accelerated
effect of the neurotoxins and Vc peptide during intense stimulation is the result of more vesicles
being trapped at the active zone such that they cannot undergo fusion because of the decline in
the formation of fusogenic trans-SNARE complexes during intense stimulation.
6.1.4 Are partially zippered SNARE complexes a trait of all chemical synapses?
The results of this thesis plus the work of Hua and Charlton (1999) indicate that crayfish
synapses contain partially zippered SNARE complexes. Partially zippered SNARE complexes
have also been detected in other cell systems such as in PC12 and chromaffin cells (Chen et al.,
2001; Jung et al., 2008; Kubista et al., 2004; Xu et al., 1999). Therefore, the existence of partially
zippered SNARE complexes may be a common trait of all chemical synapses.
There is evidence that SNAREs can zipper but do not exist in a partially zippered state at
rest. For instance, work by Xu et al. (1998) showed that infusing chromaffin cells with
Clostridial neurotoxins to cleave each of the three SNAREs decreased secretion without prior
stimulation. Xu et al. concluded that, at rest, SNAREs are not in a partially zippered complex or
may be in a very loose complex that can unzipper in seconds. The slower rate of secretion
associated with non-neuronal cell types such as chromaffin cells may require different partially
zippered SNARE complexes to better control the amount of secretion necessary for a graded
response. However, faster neuronal systems likely utilize a single partially zippered state of the
SNARE complex to prime vesicles necessary for a rapid response. Another study by Matos et al.
(2003) using VAMP interfering peptides concluded, based on the lack of an effect using a Vc
peptide in PC12 cells, that SNARE zippering is an all-or-none phenomenon without a partial
zippered complex as an intermediate under resting conditions. However, the lack of an effect of
the Vc peptide could have been due to low binding affinity, structural constraints by the partially
zippered complex, or non-specific binding that had no effect on secretion.
173
6.1.4.1 Degrees of SNARE zippering
The consensus amongst many studies using various techniques and model systems is that
there may be only one form of a partially zippered SNARE complex. The SNARE complex is
zippered from the N-terminal end (layer -7) to approximately the mid-point (layer -3 to +3) of
the SNARE motifs (Hua and Charlton, 1999; Krishnakumar et al., 2011; Li et al., 2011; Melia et
al., 2002; Schwartz and Merz, 2009). The slight difference in the amount of zippering between
studies may be the result of using different techniques that can vary in measuring the degree of
zippering. There are a few studies that indicate the presence of different degrees of zippering
under resting conditions, which can range from very loose (layers -7 to < zero layer) to almost a
fully zippered state (layers -7 to ≥ +3), and the SNARE complex can also be completely
unzippered (Chen et al., 2001; Kubista et al., 2004; Xu et al., 1998, 1999).
The SNARE complex may exist either in a single clamped state or in a dynamic
equilibrium with different zippered states under resting conditions. Fusion-competent vesicles
docked at the active zone are associated with partially zippered trans-SNARE complexes which
appear clamped in only one partially zippered state by other factors such as Complexin
(discussed in section 6.2). This can be seen in the results of this thesis using active neurotoxins
under low stimulation, in which TeNT-LC and BoNT/D-LC did not cleave VAMP and inhibit
release. The responses always remained similar to controls throughout the entire experiment. If
the SNARE complex fluctuated between different zippered states over time under resting
conditions then TeNT-LC and BoNT/D-LC would have eventually cleaved VAMP and inhibited
evoked release. Similarly, the occurrence of spontaneous release (minis) would be expected to
cause a significant turnover of SNAREs over time and, therefore, make VAMP susceptible to
cleavage by all three neurotoxins under low stimulation conditions. However, under low
stimulation, TeNT-LC and BoNT/D-LC did not inhibit release compared to controls over a 4hr
period (see Chapter 3). Crayfish phasic and tonic synapses have a spontaneous release rate of
approximately 2 quanta/min (single bouton focal recordings; Millar et al., 2005), which is
relatively lower than other mammalian (Kopp-Scheinpfluga et al., 2008; Xue et al., 2009) and
invertebrate (Hobson et al., 2011; Huntwork and Littleton, 2007) systems. Furthermore, the
average RRP size of phasic and tonic synapses is 58 and 130 vesicles, respectively (Millar et al.,
2002). Since, over a 30min period, the number of spontaneous events would be 60 quanta for
both synapses, the RRP at phasic synapses would be eliminated and depleted by almost half at
tonic synapses. However, this is not the case as 30min baseline recordings before injection for
174
physiology experiments in Chapters 3-5 are stable, indicating that a mechanism (vesicle
recycling) helps to maintain the RRP.
Over a long period of time the number of minis increases at crayfish synapses. For
example, after 4hrs, the number of spontaneous events would be 480. If mini release involves the
SNARE complex to drive full collapse fusion, then a significant number of SNAREs would be
turned over during this time and be susceptible to all three neurotoxins under low stimulation
conditions. However, as demonstrated in Chapter 3, the evoked phasic and tonic responses were
not inhibited over a 4hr period during low stimulation using active TeNT-LC and BoNT/D-LC,
indicating that VAMP was not cleaved by the two neurotoxins. There are a few scenarios that
may help to explain why TeNT-LC and BoNT/D-LC have no effect under low stimulation after a
4hr period. One possibility is that minis occur using kiss-and-run rather than full collapse fusion
and do not require the SNARE complex to completely unzipper. When the vesicle “kisses” the
active zone, the SNARE complex transitions from a partial to a tightly zippered state and
releases NTs through a fusion pore. Then, as the vesicle “runs” away from the active zone the
SNARE complex unzippers but only partially. Under both the “kiss” and “run” conditions,
VAMP would be protected from TeNT-LC and BoNT/D-LC. However, this scenario only works
if the vesicle remains associated with the membrane via the SNARE complex after NT release.
Presently, it is unknown if minis occur via kiss-and-run at crayfish synapses.
Some studies indicate that there may be a separate pool of vesicles that are responsible
for spontaneous release (Fredj and Burrone, 2009; Richards et al., 2003; Sara et al., 2005) and
this pool tends to have a higher concentration of tetanus-insensitive VAMP (TI-VAMP; also
known as VAMP-7) (Hua et al., 2011). In mammalian species, TI-VAMP is similar to neuronal
VAMP-1 and -2 isoforms but does show slight differences in the toxin binding motifs (V1 and
V2) and is missing the cleavage sites for all five VAMP-specific Clostridial neurotoxins (Galli et
al., 1998). This would make TI-VAMP resistant to cleavage by the neurotoxins. Therefore, a
VAMP isoform resistant to TeNT and BoNT/D may contribute to spontaneous release at phasic
and tonic synapses. Presently, the number of crayfish VAMP isoforms is unknown but the
cloning and sequencing of crayfish VAMP in Chapter 2.8 revealed only one VAMP sequence. In
addition, Western blots showed that active TeNT-LC and BoNT/B/D-LC cleaved VAMP present
in the protein sample with no evidence of another band that could represent another VAMP
isoform. Either the VAMP antibody cannot detect another VAMP isoform or there is only one
neuronal VAMP isoform in crayfish. Finally, work by Hua et al. (1998) showed at the tonic
175
synapses of the crayfish claw opener muscle that mini frequency was significantly reduced using
BoNT/D-LC but not TeNT-LC and BoNT/B-LC. This indicated that another isoform of VAMP
resistant to TeNT-LC and BoNT/B-LC may be responsible for spontaneous release. Future work
will be required to determine if more than one neuronal VAMP isoform exists in crayfish, and
how TeNT-LC and BoNT/B/D-LC affects minis at phasic and tonic synapses.
Therefore, SNARE complexes are clamped in a single, partially zippered state which may
be a defining feature of all chemical synapses. In response to elevated Ca2+, the trans-SNARE
complexes complete zippering to promote release.
6.1.5 Partially zippered cis-SNARE complexes are present at phasic and tonic synapses
The results of immunocytochemistry using the neurotoxins revealed that vesicles in
phasic and tonic boutons bear partially zippered cis-SNARE complexes. Evidence comes from
the observation that VAMP staining was present in phasic and tonic terminals under the low
stimulation paradigm in the presence of active TeNT-LC and BoNT/D-LC but not with BoNT/B-
LC (see Chapter 3). The majority of VAMP is located on vesicles (Takamori et al., 2006; Walch-
Solimena et al., 1995) and a greater number of vesicles are in the RP further away from the
active zones such that VAMP cannot form trans-SNARE complexes. This means that the
majority of VAMP staining in phasic and tonic boutons is attributed to VAMP in the RP.
Therefore, the most likely explanation for the majority of VAMP staining (uncleaved VAMP)
under low stimulation in the presence of TeNT-LC or BoNT/D-LC is that VAMP was protected
in cis-SNARE complexes on synaptic vesicles in the RP. This was surprising because it is
expected that cis-SNARE complexes are fully zippered, especially those that form after vesicle
fusion in which fusion requires tightly zippered SNARE complexes. This suggests that the
mechanism responsible for clamping the SNARE complex (i.e. Complexin) does not distinguish
between cis- and trans-SNARE complexes and does not discriminate between RRP and RP.
Previous work by Hua and Charlton (1999) and Hua et al. (1998) showed a similar result in the
tonic axonal terminals that innervate the crayfish opener muscle. The presence of VAMP
staining was observed using TeNT-LC and BoNT/D-LC until intense stimulation was applied.
There is a possibility that trans-SNARE complexes can form between vesicles which
could represent some of the staining observed. Since a single vesicle can come in contact with
few other vesicles, however, the majority of vesicle SNAREs would not be in the trans
176
conformation. Furthermore, other studies have shown that cis-SNARE complexes can exist in a
partially zippered state (i.e. Kubista et al., 2004; Zhang et al., 2005). Therefore, it is expected
that the majority of SNARE complexes on a vesicle are in a cis-conformation. This may indicate
that the clamping mechanism (i.e. Complexin) is in excess at each synapse and maintains both
cis- and trans-SNARE complexes in a partially zippered state.
6.1.6 Post-priming role of the partially zippered trans-SNARE complex
The bridging of two different membranes by the SNARE complex makes it an ideal
mechanism to dock vesicles at the active zone. However, the SNARE complex appears to have a
post-docking role in exocytosis because manipulations of SNAREs in order to prevent complex
formation and vesicle fusion do not interfere with the morphological docking of vesicles at the
active zone (Broadie et al., 1995; Hunt et al., 1994; Llinás et al., 1994; Low et al., 1999; Marsal
et al., 1997; O’Connor et al., 1997). Some studies indicate that the SNARE complex is involved
in vesicle docking; however, the results are derived from unphysiological proteoliposomal fusion
assays (Cypionka et al., 2009; Liu et al., 2005; Smith and Weisshaar, 2011). The conclusions
drawn from these studies are: (1) Docking is the rate-limiting step in exocytosis; (2) the SNARE
complex is required to facilitate vesicle docking and increase the rate of fusion; and (3) the
SNARE complex only triggers but does not carry out vesicle fusion. Therefore, the partially
zippered SNARE complex could dock vesicles at the target membrane. However, caution must
be taken when interpreting the results from liposomal assays. They do not represent a synapse
and are missing many factors that contribute to exocytosis. Furthermore, liposome fusion still
occurs, albeit very slow, in the absence of the SNAREs indicating that the SNARE complex is
not necessary for vesicle docking or even fusion but is required to increase the rate of vesicle
fusion.
The crayfish phasic and tonic synapses exhibit a difference in the size of their RRP,
which is inversely proportional to their initial release probability (Millar et al., 2002). The phasic
synapses have a smaller RRP size compared to the RRP of tonic synapses, but the probability of
fusion of a vesicle in the phasic RRP is 100-1000-fold higher in response to a single action
potential (Msghina et al., 1998). The RRP, as defined at hippocampal synapses by Rosenmund
and Stevens (1996), represents the number of vesicles that are primed and ready to undergo
fusion at the synapse. Rosenmund and Stevens showed that the size of the RRP can be
determined by depleting the pool using a hypertonic sucrose solution, in which only vesicles that
177
are “docked and cocked” will undergo fusion. The presence of partially zippered trans-SNARE
complexes in the RRP at both phasic and tonic synapses indicates that partially zippered
complexes may be the product of vesicle priming, which transforms a vesicle from a docked
state to a fusion-competent state. The presence of more primed vesicles with a lower release
probability in the larger RRP of tonic synapses indicates that a greater number of partially
zippered trans-SNARE complexes alone does not confer a higher probability of vesicle fusion. If
so, release probability at tonic synapses would be higher than phasic synapses. It is most likely
that post-priming factors that control the transition of the partially zippered SNARE complex to
the fully zippered state (i.e. Complexin, Syt1, CAPS) contribute more to the difference in release
probability between phasic and tonic synapses. Furthermore, the complete zippering of the
SNARE complex may be involved in only triggering fusion rather than causing it directly
because altering the SNAREs to impair zippering decreases the rate of vesicle fusion without
changing the kinetics of the fusion process itself (Broadie et al., 1995; Finley et al., 2002;
Graham et al., 2001; Stewart et al., 2000; Smith and Weisshaar, 2011; Washbourne et al., 1999).
Therefore, following the priming step of exocytosis, zippering of the SNARE complex triggers
fusion but other factors contribute to release probability by controlling the number of zippering
events and, therefore, the number of vesicles that undergo fusion.
The larger RRP at tonic synapses suggests that the priming process is more active at tonic
synapses compared to phasic synapses. However, it appears that the clamping mechanism is
more active or stronger at tonic synapses to reduce the number of full zippering events compared
to phasic synapses in response to a single action potential, which decreases vesicular release
probability. This strengthens the idea mentioned above that post-priming factors, including those
that control SNARE zippering, are responsible for the difference in vesicular release probability
at each synapse. In section 6.2, I discuss the role of Complexin in mediating release probability
at phasic and tonic synapses based on the results of using an interfering Complexin peptide.
A more active priming process at tonic synapses may also explain why the tonic response
can be sustained for a long period of time with prolonged stimulation whereas the phasic
response depresses (Bradacs et al., 1997; Msghina et al., 1998). Furthermore, tonic axonal
terminals have a greater number of mitochondria than phasic terminals, and the increase in
energy production is associated with maintaining sustained release under high frequency
stimulation (Nguyen et al., 1997). Vesicle priming is suggested to be an energy-dependent
process (i.e. requiring ATP) to convert docked vesicles into a fusion-competent state, in which
178
the use of energy keeps the vesicles locked in an irreversible primed state in the RRP at the
active zone (Chieregatti et al., 2002, 2004; Heidelberger et al., 2002; reviewed in Klenchin and
Martin, 2000). For example, at retinal bipolar ribbon synapses, replenishment of the RRP after
stimulation, but not vesicle docking, requires ATP (Heidelberger et al., 2002). Therefore, greater
energy production in tonic axonal terminals may be responsible for the greater number of primed
vesicles in the RRP.
6.1.7 The function of the partially zippered trans-SNARE complex
The zippering of the SNARE complex serves to bring two opposing membranes together
and provide the energy required to trigger vesicle fusion. Priming of docked vesicles at the active
zone results in a pool of fusion-competent vesicles in which those closest to the active zone
membrane consist of one or more partially zippered trans-SNARE complexes. The partially
zippered complexes prepare vesicles for fast, Ca2+-dependent evoked release in which control of
SNARE zippering helps to regulate the release probability of the synapse. Zippering up at the C-
terminal end of the SNARE complex in the presence of elevated Ca2+ as opposed to zippering
initially at the N-terminal end allows the SNARE complex to trigger vesicle fusion faster. This
may explain different release rates at the synapse. For example, Xu et al. (1998, 1999) showed
that chromaffin cells exhibit three different rates of secretion: fast burst, slow burst, and
sustained release. Xu et al. suggested that the difference between the fast and slow bursts is that
slow burst is associated with more “loosely” zippered trans-SNARE complexes. In addition, the
much slower sustained release is associated with vesicles without partially zippered trans-
SNARE complexes prior to stimulation. Although different degrees of SNARE zippering may
not exist at most types of synapses, the concept of vesicles with partially zippered versus
unzippered trans-SNARE complexes may explain fast versus sustained release, respectively,
during prolonged stimulation. For instance, stimulating crayfish phasic and tonic axons
continuously will first evoke fast release associated with vesicles in the RRP with partially
zippered trans-SNARE complexes formed prior to stimulation. Once the RRP is depleted,
vesicles originating in the RP or obtained via endocytosis, contribute to the slower sustained
release. The slower response may reflect the fact that more time is required to first dissociate the
cis-SNARE complexes and then form trans-SNARE complexes when the vesicles reach the
active zone, since these vesicles were not primed prior to the start of stimulation. It is unknown if
the SNARE complex is briefly clamped before zippering completely to trigger fusion during
179
intense stimulation. It is possible that the SNARE complex may bypass the partially zippered
intermediate state and directly zipper completely due to the high demand of release.
The partially zippered trans-SNARE complex is not responsible for the difference in
release probability between different synapses. However, it may serve to distinguish, at the
molecular level, primed vesicles from unprimed vesicles at the synapse. This, in turn, can define
which vesicles are involved in fast release versus sustained release during prolong stimulation.
The formation of partially zippered trans-SNARE complexes may be the end result of the
priming step in exocytosis, which may be a fundamental property of all chemical synapses.
However, other factors including those that are responsible for controlling SNARE zippering to
trigger fusion play a more significant role in determining the release probability of the synapse.
One potential candidate is Complexin, which is discussed in the next section.
6.2 Complexin influences release probability
If Complexin serves to clamp the SNARE complex in a partially zippered state at both
phasic and tonic synapses, then the effects of the interfering Complexin peptide should produce a
similar effect at both synapses. However, if Complexin has a different role at phasic versus tonic
synapses then the Complexin peptide is likely to produce different effects at each type of
synapse. The interfering Complexin peptide containing the central α-helix domain should prevent
the binding of native Complexin with the SNARE complex. Since Complexin is expected not to
interact with the SNARE complex in the presence of the interfering peptide, the observed effects
would represent a combination of removing the clamp mediated by the accessory α-helix and the
zippering of the SNARE complex mediated by the N-terminal domain of Complexin. The results
showed that the peptide produces opposing effects at phasic versus tonic synapses.
Under the low stimulation paradigm, the injection of the interfering Complexin peptide
facilitated the phasic evoked response but depressed the tonic evoked response. However, the
peptide resulted in a decline of both the phasic and tonic responses under intense stimulation, in
which the phasic potentiated response was reduced and the tonic response remained below
baseline levels. Overall, Complexin contributes to release probability.
180
6.2.1 Does the presence of multiple Complexin isoforms or difference in concentration contribute to the different effects of the Complexin peptide?
The results of immunocytochemistry revealed that both phasic and tonic axonal terminals
contained Complexin. This indicates that the difference in release probability between the two
synapses cannot simply be that one axon has Complexin and the other does not. Therefore, the
difference in phasic and tonic release could be the result of different isoforms or concentrations
of Complexin at each synapse.
The cloning and sequencing of partial crayfish Complexin resulted in four different but
similar sequences that represented the central α-helix domain required for the interaction with the
SNARE complex (see Bracher et al., 2002, Chen et al., 2002, and Pabst et al., 2000 for the
interaction between the central α-helix domain and the SNARE complex). The four different
sequences suggest the presence of more than one isoform of crayfish Complexin. However, the
difference between the sequences occurs at the same positions of the amino acid sequences
(Chapter 5.2, Figure 71). This observation suggests that there could have been errors during the
sequencing procedure which produced different nucleotides at specific positions. The nucleotide,
and therefore the corresponding amino acid, at a given position is calculated based on the
probability of what nucleotide is supposed to be present at a given position. In most cases, the
probability of one nucleotide at a given position is much higher than the other three nucleotides.
However, there are instances in which the probability for more than one nucleotide is similar at a
given position. In these cases, it requires the technician to review the sequence manually and
judge what nucleotide should be present at this position. Therefore, there is the possibility that
more than one nucleotide can be present at a specific position with equal probability.
In the Western blot (Chapter 5.1.2, Figure 70), the single band of ~18kDa in crayfish
nervous tissue suggests that there may be only one isoform of Complexin. However, it is possible
that two similar isoforms can overlap in the same position and appear as a single band. Since I do
not have the full-length crayfish Complexin sequence, I cannot determine how many isoforms
are present in neuronal tissues. Ideally, sequencing the crayfish genome plus identifying the
number of expressed transcripts (mRNA) would reveal the number of crayfish Complexin genes
and thus, isoforms. Species such as rodents, the electric ray, and C. elegans have more than one
isoform of Complexin, which can be found in the same cell type in a given species (Ishizuka et
al., 1997; Martin et al., 2011; Strenzke et al., 2009; Xue et al., 2008; see review by Brose, 2008).
181
However, other species, especially invertebrates (i.e. leech, squid, water flea, and Drosophila)
have only one Complexin isoform (Dykes and Davies, 2004; Huntwork and Littleton, 2007;
Tokumaru et al., 2001). Furthermore, in mammalian and invertebrate species that have more than
one Complexin isoform, it is often found that only one isoform has a significant functional effect
on synaptic transmission whereas the other isoforms have little to no impact on release (Hobson
et al., 2011; Martin et al., 2011; Strenzke et al., 2009; Xue et al., 2008). Therefore, crayfish may
have more than one Complexin isoform but only one is functionally significant, or there is only
one Complexin isoform common to phasic and tonic synapses.
If crayfish has only one isoform of Complexin, then another possibility is that there is a
difference in the concentration of Complexin between the synapses. Complexin has a post-
docking role (priming or later stage) in exocytosis (Cai et al., 2008; Reim et al., 2001) and
contributes to synaptic release probability, in which overall it promotes release (Maximov et al.,
2009; Reim et al., 2001; Strenzke et al., 2009; Xue et al., 2008, 2009, 2010). Therefore, the
larger evoked quantal content of phasic release compared to tonic release suggests that maybe a
higher concentration of Complexin is present at phasic synapses. This may explain why more
vesicles in the phasic RRP undergo fusion to a single action potential than vesicles in the much
larger tonic RRP. This scenario is observed, for example, in chromaffin cells in which
overexpressing Complexin-2 (only isoform expressed in these cells) increases secretion and the
RRP size, whereas knockouts show a decrease in secretion and the RPP size (Cai et al., 2008).
However, most studies that overexpress Complexin show either a decrease in evoked fusion
events (Liu et al., 2007; Xue et al., 2009) or no effect (Martin et al., 2011; Xue et al., 2007). In
addition, the Complexin peptide enhanced phasic release and decreased tonic release under low
stimulation. This suggests that the concentration of Complexin does not solely define release
probability. Furthermore, the results of the interfering peptide showed equal (~30% change) but
opposite effects on the phasic and tonic responses under low stimulation, and inhibition of the
responses under intense stimulation was also similar (difference of ~30%), which suggests that a
similar amount of Complexin is present at both synapses. Therefore, crayfish phasic and tonic
synapses likely share a common Complexin isoform that functions the same but its overall
effects are governed by a different mechanism regulating exocytosis at each synapse to either
promote or attenuate release.
182
6.2.2 Difference in the phosphorylation state of Complexin at phasic and tonic synapses
Complexin can be phosphorylated at its C-terminal end on the serine residue 115 (Ser-
115) by casein kinase 2 (CK2; Shata et al., 2007). Shata et al. showed that phosphorylation by
CK2 increases Complexin’s affinity for the SNARE complex. Furthermore, Malsam et al. (2009)
used a liposomal fusion assay to show that the C-terminal domain of Complexin that contained
Ser-115 facilitated liposome fusion, and Complexin with a mutated Ser-115 did not facilitate
fusion. Interestingly, Ser-115 is a residue that is not responsible for SNARE complex interaction,
which is mediated by Complexin’s central α-helix domain (Bracher et al., 2002; Chen et al.,
2002; Malsam et al., 2009; Pabst et al., 2002). It is possible that the phosphorylated Ser-115 may
help to prevent Complexin from dissociating with the SNARE complex and it could play a role
in mediating the interaction between Complexin, Syt1, and the SNARE complex, as Syt1 does
associate with Complexin’s C-terminal end (Tokumaru et al., 2008).
Work by Orth (2002) and Silverman-Gavrila (2005) using kinase and phosphatase
inhibitors suggested that the difference in evoked release between crayfish phasic and tonic
synapses may be the result of a difference in the level of kinase and phosphatase activity and,
therefore, the amount of proteins that are phosphorylated. In addition, a study by Hilfiker et al.
(2001) using the phasic-like squid giant synapse showed that tonic activation of protein kinase A
(PKA) is required for NT release, indicating that the squid giant terminal contains a high level of
proteins phosphorylated by PKA. Therefore, if the crayfish phasic axon has a higher level of
kinase activity compared to the tonic axon, then more Complexin at phasic synapses may be
phosphorylated by CK2 and associate with a greater number of SNARE complexes. This
difference in the phosphorylated state of Complexin could partially account for the difference in
evoked release between phasic and tonic synapses, especially if there is only one isoform of
Complexin that is present in equal amounts at both synapses. Unfortunately, the problem with
this idea is that if it is assumed that a common isoform of Complexin is present in equal amounts
at phasic and tonic synapses, the results of the interfering peptide indicate that a difference in the
phosphorylation state of Complexin is not responsible for the difference in evoked release. The
reason is that under the low stimulation paradigm, the interfering peptide caused the phasic
response to facilitate and the tonic response to depress. If increasing the number of Complexin
molecules that are phosphorylated increases the number of Complexin-SNARE complex
interactions, which would increase release, then disrupting the interaction between Complexin
183
and the SNARE complex should have depressed the phasic response. Although the
phosphorylation state of Complexin cannot be ruled out completely, it is likely that other factors
contribute more significantly to evoked release at phasic and tonic synapses.
6.2.3 The effect of Complexin on evoked release: Release probability and Ca2+-sensitivity
The effects of the Complexin peptide showed that Complexin contributes to release
probability at phasic and tonic synapses. This was clearly observed under the low stimulation
protocol in which the tonic response depressed and the phasic response facilitated. Interestingly,
the peak facilitation of the phasic response and the peak depression of the tonic response was
similar (difference of ~30%). This indicates that Complexin may contribute equally but produce
opposite effects at each synapse. However, as mentioned above, if the same isoform of
Complexin is found at each synapse then it would suggest other factors, in addition to
Complexin, contributes to the difference in release probability.
The interfering peptide resulted in the depression of the tonic evoked response
demonstrating that Complexin normally promotes release at tonic synapses. This decline can be
attributed to a decrease in release probability because the amount of release was smaller in
response to action potentials compared to controls. In addition, although apparent Ca2+
sensitivity of release was not measured, it appears that Ca2+ sensitivity was also reduced because
release was lower for the same [Ca2+]o (13.5mM) compared to controls. The effect of the peptide
at tonic synapses is similar to the results found in previous studies that interfered with the
expression or function of Complexin. At mammalian and invertebrate synapses, when
Complexin was knocked out or knocked down, or when specific domains were mutated, there
was a decrease of the evoked response (Cai et al., 2008; Hobson et al., 2011; Huntwork and
Littleton, 2007; Martin et al., 2011; Reim et al., 2001; Strenzke et al., 2009; Tang et al., 2006;
Tokumaru et al., 2001; Xue et al., 2008, 2009, 2010; Yang et al., 2010). This decrease was
associated with a decrease in the release probability and Ca2+ sensitivity of evoked release
(Strenzke et al., 2009; Xue et al, 2008, 2009, 2010). This has even been observed in liposomal
fusion assays where Complexin increases the rate of liposome fusion compared to the rate of
fusion between v-and t-liposomes without Complexin (Malsam et al., 2009; Yoon et al., 2008).
Surprisingly, some of the mammalian and invertebrate synaptic systems mentioned above are
tonic-like whereas others are phasic-like yet disrupting the function of Complexin produces a
184
similar inhibitory effect. Furthermore, the inhibitory effects in these systems are often larger than
that observed at the crayfish tonic synapses. This suggests that Complexin’s effects at crayfish
tonic synapses are relatively weaker and although Complexin can contribute to release
probability it is not the sole determinant, and other factors contribute more to synaptic strength.
Contrary to the tonic response, the phasic response was enhanced by the interfering
peptide under low stimulation, which was associated with an increase in release probability and
likely Ca2+ sensitivity in response to an action potential. This result suggests that Complexin
normally suppresses the phasic response and is therefore inhibitory, not facilitatory. This finding
does not agree with the majority of studies in mammalian and invertebrate systems mentioned
above, but there are some studies that show Complexin is inhibitory. For example, studies that
used HeLa cells (Henrietta Lacks immortal human cell line that proliferates extensively) with
flipped SNAREs showed that Complexin clamps SNARE complexes and prevents cell-to-cell
fusion, which is relieved by Ca2+-bound Syt1 (Giraudo et al., 2006, 2008, 2009; Krishnakumar et
al., 2011). Furthermore, injection of a Complexin-2 antibody into the Aplysia buccal ganglia
increased release but injection of a full-length recombinant Complexin protein decreased release,
showing that Complexin is inhibitory in Aplysia (Ono et al., 1998). Similarly, overexpressing
Complexin in PC12 cells inhibited secretion (Liu et al., 2007).
Interestingly, a study by Tokumaru et al. (2001) showed that injecting a squid-specific or
rat-specific central α-helix interfering peptide (similar to the one used in this thesis) decreased
the evoked response at the squid giant synapse. This synapse is similar to the crayfish phasic
synapse in that they both have a high initial release probability and depress under high frequency
stimulation. Therefore, it was surprising to see two similar synapses respond differently to a
similar interfering Complexin peptide. This would suggest that Complexin plays a different role
at each synapse or that at one synapse compared to the other, the peptide has non-specific effects.
The fact that both the squid and rat peptides produced the same effect at the squid giant synapse
would suggest that results with the crayfish peptide may be due to non-specific effects. However,
in Appendix 3, it can be seen that injecting the Complexin antibody into the phasic axon, in
which the antibody would presumably inactivate Complexin, also resulted in the facilitation of
the phasic response. Therefore, Complexin may have a greater inhibitory effect at crayfish phasic
synapses compared to the squid giant synapse, reflecting a difference in the function of
Complexin across species (see Xue et al. (2009) for a comparison between mammalian and
Drosophila Complexin).
185
6.2.3.1 Ca2+ sensitivity of release: Interaction between Complexin and Synaptotagmin-1
The observation that Complexin contributes to Ca2+ sensitivity at the synapse suggests
that Complexin associates with the primary Ca2+ sensor, Syt1. Complexin competes with Syt1
for the C-terminal end of the SNARE complex (Tang et al., 2006), or binds with Syt1
simultaneously to the SNARE complex (Chicka and Chapman, 2009), and Complexin and Syt1
also interact with each other (Tokumaru et al., 2008). Therefore, the association of Complexin
with Syt1 may play a role in fast, Ca2+-dependent release. It has been suggested by Tokumaru et
al. (2008) that Complexin may attract Ca2+-bound Syt1 to the partially zippered SNARE
complex such that Syt1-Ca2+ removes the Complexin clamp, allowing the SNARE complex to
zipper up at the C-terminal end and trigger vesicle fusion. Therefore, the absence of the
Complexin-Syt1 interaction or a weak association of Syt1 with the SNARE complex because
Complexin is not bound to the SNARE complex may contribute to a decrease in Ca2+ sensitivity.
In the absence of Complexin, Syt1-dependent evoked release can still occur. Therefore,
how does Syt1 evoke its effect in the absence of Complexin? The answer may lie in Syt1’s
ability to directly bind to the SNARE complex and phospholipids. Synaptotagmin-1 can bind to
the SNARE complex by interacting with SNAP-25 (Gerona et al., 2000; Lu et al., 2006; Lynch et
al., 2007), and when bound to Ca2+, Syt1’s C-terminal end with the C2A and C2B domains can
partially embed into the plasma membrane (Chapman and Davis, 1998; Fernandez et al., 2001;
Fernandez-Chacon et al., 2001). Furthermore, Syt1 can arrest SNARE zippering and vesicle
fusion in the presence of low Ca2+ (Chicka et al., 2008). Therefore, without Complexin, Syt1 may
bind more weakly with the SNARE complex, or Syt1 may encounter some difficultly detecting
and binding correctly to the C-terminal end of the SNARE complex. As a result, fast, Ca2+-
dependent release will be diminished. If Complexin helps to increase the probability of Syt1
binding to the SNARE complex, then a decrease in the probability of evoked release may reflect
a decrease in the probability of Syt1 binding to the SNARE complex when the interaction
between Complexin and the SNARE complex is disrupted.
Overall, Complexin may have opposite effects at phasic versus tonic synapses under low
activity based on the effects of the Complexin peptide. It is unclear if the effect is simply due to
the presence of a different isoform at each synapse or the result of a difference in protein
concentration or phosphorylation state. Assuming a single isoform is common to both synapses,
it would appear that Complexin may intrinsically function exactly the same at both synapses but
186
different mechanisms utilize the protein in a different way such that its overall effect is opposite
between the two synapses. However, it is clear that Complexin does play a role in regulating the
initial release probability at both synapses and may also contribute to the Ca2+ sensitivity of
evoked release by associating with Syt1.
6.2.4 The role of Complexin in vesicle priming and maintenance of the RRP
Complexin appears to have a post-docking role at the synapse because manipulating
Complexin does not alter the morphological docking of vesicles at the active zone (≤50nm from
the membrane; Cai et al., 2008; Reim et al., 2001). One exception is a study by Tokumaru et al.
(2001) that showed injecting an interfering peptide based on the central α-helix domain of
Complexin in the squid giant terminal resulted in an increase in the number of docked vesicles at
the active zone. However, the authors associated the increase to an accumulation of vesicles
during stimulation because vesicle fusion was impaired. Therefore, Complexin exerts its effects
after vesicle docking, either during vesicle priming or at a later stage of exocytosis prior to
vesicle fusion.
To determine if Complexin has a priming or post-priming role in vesicle fusion, three
factors need to be considered. First, does Complexin contribute to the initial release probability?
Second, does Complexin regulate the Ca2+ sensitivity of release? And third, does Complexin
determine the size of the RRP? As mentioned previously, Complexin does have an influence on
both the release probability and Ca2+ sensitivity of evoked release. However, there are mixed
results regarding Complexin’s role in maintaining the RRP. Some studies show that manipulating
Complexin has no effect on the size of the RRP (Reim et al., 2001; Strenzke et al., 2009; Xue at
al., 2008, 2009), whereas other studies show that Complexin governs the size of the RRP, in
which altering the expression level of or impairing Complexin’s function at the synapse
decreases the size of the RRP (Cai et al., 2008; Hobson et al., 2011; Xue et al., 2009, 2010; Yang
et al., 2010). The RRP pool size was not measured in this thesis but doing so would have
provided insight into the post-docking role of Complexin at phasic and tonic synapses.
Calculating the RRP size can help to determine if a given factor has an effect on vesicle
priming. For example, for those studies mentioned above (sections 6.2.3 and 6.2.4) in which
release probability, Ca2+ sensitivity, and RRP size were decreased by creating Complexin
knockouts, knockdowns, or mutants, Complexin is considered to have a role in vesicle priming
because the number of primed vesicles in the RRP was reduced, which would reflect the
187
decrease in initial release probability and size of the evoked response in response to Ca2+.
Conversely, for the other studies that showed a decrease in the initial release probability and Ca2+
sensitivity but the RRP size was unchanged, Complexin is considered to have a post-priming role
because the number of vesicles that are primed for fusion remained the same in the RRP.
Therefore, the decrease in release is simply a decrease in the vesicle release probability in the
RRP in response to Ca2+, which can be attributed to just a decrease in vesicular Ca2+ sensitivity.
For instance, Reim et al. (2001) showed that the double knockout of Complexin-1/2 in cultured
hippocampal cells decreased the initial release probability but the RRP was unaffected and the
response could be recovered if the [Ca2+]o was elevated. This showed that Complexin only
decreased the Ca2+ sensitivity of release without affecting vesicle priming thus, demonstrating a
post-priming role of Complexin. Unfortunately, the mixed results concerning the effect of
Complexin on the RRP size between studies makes it difficult to conclude if Complexin has a
priming or post-priming role in exocytosis.
The larger RRP of tonic synapses plus the greater number of vesicles that undergo fusion
at phasic synapses in response to an action potential would suggest that Complexin has a post-
priming role in exocytosis. This may partially explain the higher Ca2+ sensitivity of release at
phasic synapses as found by Msghina et al. (1999). If Complexin had a priming role, it would
have produced a larger RRP at phasic synapses compared to tonic synapses to correspond with
the higher probability and Ca2+ sensitivity of phasic release. However, release probability and
Ca2+ sensitivity of evoked release are inversely related to the size of the RRP between the phasic
and tonic synapses (Millar et al., 2002; Msghina et al., 1999) This comes back to the idea that
either different isoforms of Complexin or a difference in Complexin’s concentration or
phosphorylation state at each synapse could be responsible for the difference in release. A more
facilitatory Complexin isoform or a greater number of Complexin-SNARE complex interactions
could account for the larger release at phasic synapses.
The finding that primed vesicles in the RRP of phasic and tonic synapses have partially
zippered trans-SNARE complexes suggests that Complexin may be involved in the late stages of
vesicle priming so as to clamp the SNARE complex at the end of the priming step. Moreover, the
removal of Complexin’s clamp prior to fusion indicates that Complexin also has a post-priming
role in exocytosis. Therefore, Complexin may be required at more than one step of exocytosis.
The effect of the interfering Complexin peptide on the evoked phasic and tonic responses
would indicate that Complexin has a greater inhibitory effect at phasic synapses compared to
188
tonic synapses, since the peptide facilitated the phasic response but depressed the tonic response
under low stimulation. A future experiment will be required to determine if the RRP size changes
in the presence of the interfering Complexin peptide.
6.2.5 Does Complexin synchronize vesicle fusion?
The observation that Complexin can clamp the SNARE complex and prevent fusion until
the clamp is removed by Ca2+-bound Syt1 (Giraudo et al., 2008; Tang et al., 2006) to produce a
large evoked response suggests that Complexin may be responsible for synchronizing the
simultaneous fusion of many vesicles in response to Ca2+.
Work by Rothman and colleagues (Krishnakumar et al., 2011; Kümmel et al., 2011; Li et
al., 2011; reviewed by Weninger, 2011) has shown that Complexin can cross-link SNARE
complexes in a zig-zag pattern in which each Complexin protein in the array binds to one
SNARE complex via its central α-helix and its accessory α-helix bends outwards at a 45° angle
and binds to and clamps an adjacent SNARE complex in a partially zippered state. The removal
of one Complexin clamp can potentially lead to a cascade event (domino effect) in which the
other SNARE complexes become unclamped and this in turn will trigger the simultaneous
zippering of all the SNARE complexes. Rothman and colleagues have suggested that this cross-
linked array of SNARE complexes may be responsible for initiating fusion of a single vesicle.
This concept may help to explain how vesicles can overcome the energy barrier needed for
fusion. The simultaneous zippering of multiple SNARE complexes can provide the energy
needed to trigger lipid mixing and initiate vesicle fusion. If this mechanism can also cross-link
SNARE complexes between neighbouring vesicles it could be responsible for synchronizing the
fusion of multiple vesicles in the RRP in response to Ca2+ to produce a large evoked response.
The cross-linking of SNARE complexes may be more important for evoked rather than
spontaneous release because studies show that manipulating the expression or function of
Complexin decreases evoked release but often increases spontaneous release (Huntwork and
Littleton, 2007; Maximov et al., 2009; Yang et al., 2010).
It has been argued that Complexin does not synchronize vesicles for evoked release
because asynchronous release that trails an evoked response after stimulation is found to be
unaffected in studies that manipulated Complexin (Maximov et al., 2009; Reim et al., 2001;
Tang et al., 2006). If asynchronous release is increased, then it would indicate a loss of
synchronous release. The finding that Complexin does not synchronize release would not
189
validate the concept of cross-linking SNARE complexes between vesicles. However, it would
still validate Rothman and colleagues’ idea that cross-linking SNARE complexes is responsible
for single vesicle fusion. Unfortunately, asynchronous release was not measured using the
interfering peptide and, therefore, it is unknown if Complexin is responsible for synchronous
fusion events at crayfish synapses. The observation that the phasic evoked response was always
larger than the tonic evoked response under low and intense stimulation even with the interfering
peptide indicated that a larger number of vesicles underwent synchronous fusion at phasic
synapses. Furthermore, assuming that the peptide interfered with the majority of native
Complexin molecules at each synapse, the small effect of the peptide suggests that Complexin
may play a small role, if any, in synchronizing the fusion of vesicles in response to Ca2+. Future
research will be required to see how Complexin affects asynchronous release at crayfish phasic
and tonic synapses, and if Complexin can cross-link SNARE complexes between vesicles.
6.2.6 Role of Complexin in short-term plasticity
Complexin can influence short-term plasticity (STP) under high frequency stimulation, in
which it promotes short-term depression (STD). Studies that knockout (Reim et al., 2001;
Strenzke et al., 2009; Xue et al., 2008, 2009, 2010) or knockdown (Yang et al., 2010) Complexin
at the synapse show a decrease in initial release probability and Ca2+ sensitivity, which is
accompanied by short-term facilitation (STF), paired-pulse facilitation (PPF), or both. The
crayfish tonic synapses with a low initial release probability exhibit STF under high frequency
stimulation whereas the phasic synapses with a higher initial release probability exhibit STD
(Bradacs et al., 1997). The intense stimulation protocol I used, however, induced PTP rather than
depression of the phasic response. The PTP of the phasic response is similar to that observed for
the tonic response of the crayfish opener muscle in which following a prolonged form of high
frequency stimulation the tonic response is potentiated above baseline levels, which is Ca2+-
dependent and eventually declines over time (minutes) back to baseline levels (Delaney et al.,
1989; Mulkey and Zucker, 1992; Wojtowicz and Atwood, 1988; Zucker, 1974; see Appendix 2).
However, the tonic response of the extensor muscle did not demonstrate any significant form of
PTP under intense stimulation. This may have been the result of stimulating the tonic axon at
150Hz for only 30sec and using a discontinuous form of stimulation rather than applying a
continuous high frequency stimulus for an extended period of time as performed in other studies
190
using the tonic axon of the crayfish opener muscle (Delaney et al., 1989; Mulkey and Zucker,
1992; Wojtowicz and Atwood, 1988; Zucker, 1974).
The low stimulation paradigm with the interfering Complexin peptide showed that the
release probability of phasic synapses was increased but was decreased at tonic synapses.
However, under intense stimulation, the release probability was slightly lower for phasic
synapses (PTP was reduced) but the tonic release probability may have not changed because the
response remained constant at a level that represented the last response recorded under the low
stimulation paradigm (Chapter 5.3.2, Figure 75, time point = 180min). Furthermore, there was no
reversal of STP at both phasic and tonic synapses with the interfering peptide, which is observed
in other studies that interfered with Complexin (Reim et al., 2001; Strenzke et al., 2009; Xue et
al., 2008, 2009, 2010; Yang et al., 2010). This may reflect the fact that the peptide had only a
small effect at both synapses since the phasic evoked response was always larger than the tonic
evoked response, and that the phasic response still displayed PTP, although ~30% smaller than
controls. Therefore, Complexin may have a small effect on STP at the synapse in which other
factors overpowers the effect of Complexin. Perhaps it is not important to clamp the SNARE
complex in a partially zippered state and arrest vesicle fusion during intense stimulation
compared to low stimulation, since the demand for release is very high. It cannot be ruled out
that the small effect of the interfering peptide is the result of affecting only a small number of
Complexin-SNARE complex interactions, which was not sufficient to completely block the
effect of Complexin at the synapses.
A study by Cai et al. (2008) used burst stimulation in Complexin-2 knockout chromaffin
cells to examine the role of Complexin in STP. Although the burst stimulation was not exactly
like the one I used for intense stimulation, it was similar because it applied intense stimulation
with rest periods at specific intervals. Cai et al. used eight high frequency burst of stimuli (each
burst was 100ms in duration) with a 100ms rest period in between each burst. It was found that
the knockouts had a significantly lower burst response for the first four burst stimuli compared to
controls and showed a slight amount of depression. The controls had a larger burst response but
then depressed to the knockout level for the 5th-8th burst stimuli. The effect was attributed to a
reduced RRP size (fast and slow releasing pools), indicating that Complexin may be responsible
for priming vesicles in the RRP. Furthermore, the decrease in release probability in the
knockouts did not result in STF, as seen at other synapses (Reim et al., 2001; Strenzke et al.,
2009; Xue et al., 2008, 2009, 2010). Therefore, the study by Cai et al. indicates that Complexin
191
contributes to the size of the RRP, possibly by priming vesicles for fusion, but does not play a
significant role in STP using burst stimulation. These findings may apply to the crayfish phasic
and tonic synapses. Complexin may have a role in the priming or post-priming step of exocytosis
but has little effect on the induction of STP. At tonic synapses, the inhibitory effect of the
interfering peptide could simply reflect a decrease in Ca2+ sensitivity. In the presence of the
Complexin peptide, the tonic response during intense stimulation was similar to the response
under low stimulation, especially to the last response recorded under low stimulation (see
Chapter 5.3.2, Figure 75). However, the facilitatory effect of the interfering peptide at phasic
synapses under low stimulation but the inhibitory effect under intense stimulation suggests that
the effects observed at phasic synapses may be something more than a change in Ca2+ sensitivity.
Again, this suggests that Complexin plays a small role in exocytosis at phasic and tonic synapses
and other factors contribute more significantly to initial release probability and STP.
6.2.7 Summary of the role of Complexin at phasic and tonic synapses
The injection of the interfering Complexin peptide resulted in small but significant
changes to the evoked phasic and tonic responses. Complexin appears to have a greater
inhibitory role at phasic synapses and a more facilitatory role at tonic synapses under low
activity. However, Complexin may have a similar facilitatory role at both synapses under intense
stimulation. Interestingly, the amplitude of the evoked phasic response was always larger than
the tonic response, even with the interfering peptide. Therefore, Complexin may exert different
effects at each synapse to modulate release probability and Ca2+ sensitivity to regulate synaptic
output.
There are a few scenarios that may explain the differential effects of Complexin at phasic
versus tonic synapses. They include differences in the number of isoforms, concentration, and
phosphorylation states of the protein. However, the most likely scenario is that Complexin
contributes little to release probability and Ca2+ sensitivity, and other factors play a more
significant role in regulating vesicle fusion. It cannot be ruled out that the peptide disrupted only
a small number of Complexin-SNARE complex interactions, or that the peptide had a weak or
non-specific effect. This may explain the results using the interfering peptide because the
interfering peptide had a mild effect on evoked release and the phasic response was always larger
than the tonic response under low and intense stimulation. The presence of partially zippered
SNARE complexes at both phasic and tonic synapses indicate that Complexin has the same
192
function at both synapses to clamp the SNARE complexes and, therefore, arrest vesicle fusion
prior to Ca2+ influx. However, the results suggest that Complexin’s role in controlling SNARE
zippering may not be vital to the exocytotic fusion event at crayfish phasic and tonic synapses.
This contradicts most other studies showing that Complexin’s interaction with the SNARE
complex is required to mediate fast, Ca2+-dependent release, where the effects of Complexin can
contribute to 50% or more to the evoked response. However, an important caveat of Complexin
is that it is not necessary for vesicle fusion because NT release, albeit reduced, can still occur in
the absence of Complexin (Cai et al., 2008; Huntwork and Littleton, 2007; Maximov et al., 2009;
Reim et al., 2001; Xue et al., 2008, 2009, 2010). Therefore, Complexin may only modulate
release at crayfish phasic and tonic synapses.
The use of the interfering Complexin peptide provided only small clues into the function
of Complexin on Ca2+-dependent evoked release. Unfortunately, crayfish is not a powerful
genetic tool such as for example, Drosophila, to genetically manipulate Complexin to directly
study its role in vesicle fusion. Therefore, future experiments that involve injecting other
domains of Complexin (i.e. accessory α-helix) and the full-length protein, plus determining the
number of neuronal Complexin isoforms, and the concentration and phosphorylation state of
Complexin in axonal terminals will help to better understand the role of Complexin in exocytosis
at crayfish phasic and tonic synapses.
6.3 Proposed role of SNARE zippering and Complexin during exocytosis at crayfish phasic and tonic synapses
The use of VAMP-specific neurotoxins and interfering peptide revealed that both phasic
and tonic synapses have fusion-competent vesicles in the RRP with partially zippered trans-
SNARE complexes, which do not contribute to the difference in the release probability between
the two synapses. However, the interfering Complexin peptide, which prevents the interaction
between Complexin and the SNARE complex, showed that Complexin has small but possibly
opposing effects at phasic versus tonic synapses. It is likely that Complexin functions in the same
manner at both synapses but other factors contribute more to the overall response of the synapse.
A possible scenario is that during the late stage of vesicle priming, Complexin initially facilitates
the zippering of the SNAREs at their N-terminal ends and then clamps the SNAREs to form a
partially zippered SNARE complex (Li et al., 2011; Yang et al., 2010). The resulting complex
marks the end of the priming stage, producing fusion-competent vesicles in the RRP. In response
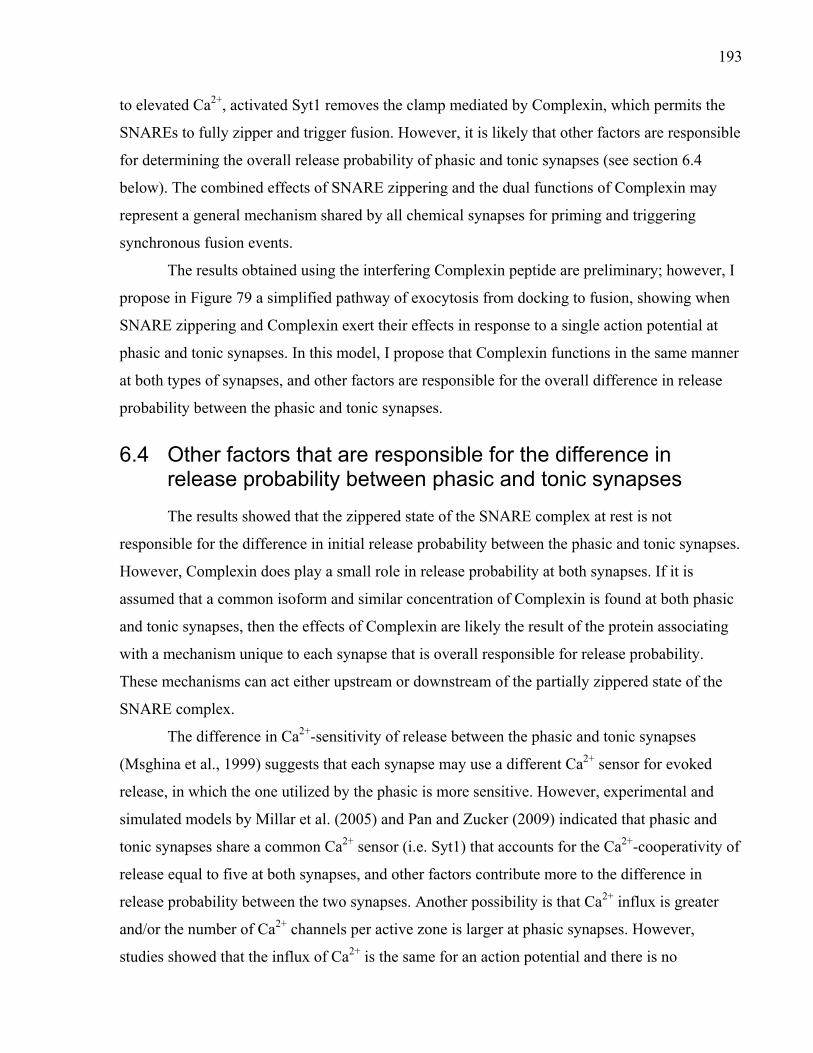
193
to elevated Ca2+, activated Syt1 removes the clamp mediated by Complexin, which permits the
SNAREs to fully zipper and trigger fusion. However, it is likely that other factors are responsible
for determining the overall release probability of phasic and tonic synapses (see section 6.4
below). The combined effects of SNARE zippering and the dual functions of Complexin may
represent a general mechanism shared by all chemical synapses for priming and triggering
synchronous fusion events.
The results obtained using the interfering Complexin peptide are preliminary; however, I
propose in Figure 79 a simplified pathway of exocytosis from docking to fusion, showing when
SNARE zippering and Complexin exert their effects in response to a single action potential at
phasic and tonic synapses. In this model, I propose that Complexin functions in the same manner
at both types of synapses, and other factors are responsible for the overall difference in release
probability between the phasic and tonic synapses.
6.4 Other factors that are responsible for the difference in release probability between phasic and tonic synapses
The results showed that the zippered state of the SNARE complex at rest is not
responsible for the difference in initial release probability between the phasic and tonic synapses.
However, Complexin does play a small role in release probability at both synapses. If it is
assumed that a common isoform and similar concentration of Complexin is found at both phasic
and tonic synapses, then the effects of Complexin are likely the result of the protein associating
with a mechanism unique to each synapse that is overall responsible for release probability.
These mechanisms can act either upstream or downstream of the partially zippered state of the
SNARE complex.
The difference in Ca2+-sensitivity of release between the phasic and tonic synapses
(Msghina et al., 1999) suggests that each synapse may use a different Ca2+ sensor for evoked
release, in which the one utilized by the phasic is more sensitive. However, experimental and
simulated models by Millar et al. (2005) and Pan and Zucker (2009) indicated that phasic and
tonic synapses share a common Ca2+ sensor (i.e. Syt1) that accounts for the Ca2+-cooperativity of
release equal to five at both synapses, and other factors contribute more to the difference in
release probability between the two synapses. Another possibility is that Ca2+ influx is greater
and/or the number of Ca2+ channels per active zone is larger at phasic synapses. However,
studies showed that the influx of Ca2+ is the same for an action potential and there is no
194
Figure 79. Simplified pathway of exocytosis from docking to fusion at crayfish phasic and tonic synapses in response to a single action potential. Complexin exerts its effects during the late stage of vesicle priming (Step #3) in which it first helps to initiate SNARE zippering and then clamps it in a partially zippered state. The clamped trans-SNARE complex marks the end of vesicle priming and denotes vesicles primed and fusion-competent in the RRP. In Step #4, the presence of a single action potential causes an influx of Ca2+, which in turn activates Syt1 to remove Complexin’s clamp and permit full zippering of the SNARE complex to trigger vesicle fusion. In addition to Complexin, other factors during the priming and post-priming steps (#2 to #5) are responsible for producing the difference in release probability between phasic and tonic synapses.
Removal of Complexin’s clamp to complete zippering of the SNARE complex
1. Docking 2. Priming
Phasic = Low (Small RRP)
Tonic = High (Large RRP)
(Priming rate)
3. Late stage of priming
Complexin
Partially zippered trans-SNARE complexes
Primed vesicle in RRP
4. Ca2+ + Syt1
Phasic = High release (Large EPSP)
Tonic = Low release (Small/No EPSP)
5. Fusion
Action Potential
Vesicle
= VAMP
= Syntaxin
= SNAP-25
Target membrane
195
significant difference in the number of putative Ca2+ channels between phasic and tonic synapses
(Govind and Pearce, 2003; Msghina et al., 1999). Furthermore, using the Ca2+ imaging data from
Msghina et al. (1999), it can be shown that a single phasic axon action potential can produce an
intracellular Ca2+ signal in a phasic bouton similar to that in a tonic bouton caused by stimulating
the tonic axon using a 200Hz, 15-pulse train of stimuli. Therefore, the difference in release
probability between the phasic and tonic synapses is the result of a molecular difference that
initially exist under resting conditions prior to Ca2+ channel activation and Ca2+ influx.
A possible difference between the phasic and tonic synapses could be the level of Ca2+
buffering by endogenous Ca2+ buffers (i.e. Calbindin and Parvalbumin)(Burnashev and Rozov,
2005). Since Ca2+ influx in response to an action potential is similar in phasic and tonic axons,
there could be a higher level of Ca2+ buffering in the tonic axon such that less Ca2+ is sensed by
the Ca2+ sensor and, therefore, result in less release at tonic synapses. This could partially explain
why intense stimulation is required to induce a significant amount of release at tonic synapses
and why the initial rate of rise of the intracellular Ca2+ signal is slower in the tonic axon
compared to the phasic axon when the same stimulus is applied to both axons (Msghina et al.,
1999). When the [Ca2+]i becomes high it can saturate the Ca2+ buffers, which would then leave a
sufficient amount Ca2+ in the cytosol to be sensed by the Ca2+ sensor to trigger release
(Burnashev and Rozov, 2005; Fioravante and Regehr, 2011). However, the caged-Ca2+ study by
Millar et al. (2005) suggests otherwise as phasic release was always larger than tonic release for
the same level of [Ca2+]i in the phasic and tonic terminals. Phasic release was larger even when
the [Ca2+]i was 10 times higher in tonic terminals compared to phasic terminals. Therefore, Ca2+
buffering may not be a significant factor responsible for the difference in release between phasic
and tonic synapses. The different types and level of expression of various Ca2+ buffers found in
phasic and tonic axons and how they contribute to Ca2+-dependent evoked release remains to be
determined. However, saturation of Ca2+ buffers may play a role during facilitation using high
frequency stimulation, especially at tonic synapses (Burnashev and Rozov, 2005; Fioravante and
Regehr, 2011; Pan and Zucker, 2009).
To date, the best concept to explain the difference in release probability between phasic
and tonic synapses is differential priming (Millar et al., 2005; Pan and Zucker, 2009). Work by
Millar et al. (2002) and Msghina et al. (1998) together showed that the size of the RRP is larger
at tonic synapses but the fraction of the pool released to a single action potential is larger at
phasic synapses. This accounted for the larger initial release probability of phasic synapses,
196
which is 100-1000-fold higher than at tonic synapses. This difference indicated that more
vesicles in the RRP at phasic synapses are primed and fusion-competent than at tonic synapses.
However, work by Neher and Sakaba (2008) suggested that the difference in release between
phasic and tonic synapses may be attributed to the distance of a primed vesicle from Ca2+
channels at the active zone in what they referred to as molecular and positional priming. At
tonic synapses, vesicles are primed further away from the Ca2+ channels (molecular priming) and
are slower to release. In addition, being further away from Ca2+ channels does not allow them to
sense the brief Ca2+ influx associated with a single action potential. On the other hand, vesicles at
phasic synapses are primed closer to Ca2+ channels (positional priming) and are faster to release
since they can sense the brief Ca2+ influx associated with a single action potential. Therefore,
both phasic and tonic synapses have fusion-competent vesicles ready for fusion in the RRP under
resting conditions but the difference in release probability may be attributed to the distance of the
vesicle from the Ca2+ channels at the active zone. This concept of molecular versus positional
priming, which was originally fitted to mammalian synapses by Neher and Sakaba (2008), may
also hold true for crayfish synapses based on the simulated models of crayfish phasic and tonic
synapses by Pan and Zucker (2009).
The concept of differential priming described above is very similar to the idea of
differences in vesicle-Ca2+ channel coupling proposed by Fedchyshyn and Wang (2005).
Fedchyshyn and Wang showed that at the calyx of Held during synaptic maturation, synaptic
vesicles become more tightly coupled to Ca2+ channels resulting in an increase in Ca2+ sensitivity
of release. This change in spatial coupling between vesicle and Ca2+ channels represented a
transition from a microdomain to a nanodomain. It is possible that molecularly primed vesicles at
tonic synapses represent a microdomain structure whereas positionally primed vesicles at phasic
synapses represent a nanodomain structure. However, work by Msghina et al. (1999) showed that
stimulating the tonic axon (>1Hz) such that the [Ca2+]i is higher than that in the phasic axon at
1Hz still results in tonic release being smaller than phasic release. Therefore, the difference in
release is more than simply a difference in the distance between the vesicle and Ca2+ channels. It
appears that there may be a greater “molecular brake” on vesicle fusion at tonic synapses. This
“molecular brake” is likely to involve proteins that are responsible for vesicle mobility (i.e.
Synapsin, Rab3a) and vesicle priming (i.e. Munc13, Munc18, RIM1, CAPS) (Atwood and
Karunanithi, 2002; Jahn and Südhof, 1999; Li and Chin, 2003; Lin and Scheller, 2000).
Therefore, future work will be required to determine if there is a difference in the level of
197
activity and expression of these and other proteins in phasic and tonic axons and how they
contribute to molecular versus positional priming, and thus differences in release probability.
6.5 Methodological considerations
This thesis utilized various methods to study the effects of SNARE zippering and
Complexin on the release probability of evoked responses. The techniques used were designed to
best suit the crayfish model system, however, there were some issues regarding their use. These
and other issues are discussed below.
A major concern in using the dissected crayfish preparation was that the saline used did
not exactly mimic the natural crayfish environment (hemolymph). Therefore, the dissected
preparation could have been slowly changing or even dying during the course of the experiment.
For example, the phasic response decreased over time in a stimulation-independent manner
whereas the tonic response was stable. This indicated that slow changes were occurring in the
phasic axonal terminals, which did not occur in the tonic terminals. Therefore, saline
composition may have induced specific changes to neuronal properties (i.e. see Macleod et al.,
2002).
Another area of concern was the use of intracellular electrodes to record evoked
responses. The post-synaptic responses recorded from muscle fibres are related to the number of
activated glutamatergic receptors, which determines the amount of depolarization of the muscle
fibre. This type of recording is an indirect measure of the amount of neurotransmitter released
and thus the number of vesicle fusion events from phasic and tonic synapses. In addition, the
recorded evoked responses represent the total synaptic response from the output of many
synapses rather than a single synapse or a single bouton from a terminal branch that innervates a
given muscle fibre. A macropatch electrode could be used to record synaptic current from a few
synapses from a single bouton, which would provide a more direct measurement of the number
of fusion events. However, muscle contractions can make it difficult to record evoked responses
using a macropatch electrode. Similarly, strong muscle contractions prevented recording evoked
responses during intense stimulation because it usually dislodged the recording electrode or even
led to muscle damage if the electrode remained in the muscle fibre. Unfortunately, I could not
find a means to stop muscle contractions.
The stimulation and recording protocols used to measure the phasic and tonic responses
were different because they reflected the difference in release probability between the two
198
synapses. The phasic response was evoked using a single action potential but evoking the tonic
response required a train of action potentials. As a result, the tonic response represented a
temporal summated response consisting of 15 overlapping EPSPs. Therefore, unlike the phasic
response, the tonic response was a form of STF. The last EPSP in the tonic response was used for
analyses (see Hua and Charlton (1999) and Hua et al. (1998)); however, this EPSP represented a
facilitated response that is more than a linear summation of successive responses (Zucker, 1974).
This means that if a single action potential could evoke a single tonic EPSP it would be smaller
than the last EPSP observed in the temporal summated response used for analyses.
Unfortunately, using a train of action potentials was the only means to obtain a tonic response. I
chose to use a train of 15 stimuli to test the tonic response because I found that the last EPSP in
the response was of consistent size for controls during the course of the experiment compared to
using a train with less than 15 stimuli, especially below 10 stimuli. Using a smaller number of
stimuli in a train would help to minimize the amount of facilitation but the amplitude of the last
EPSP in the response would fluctuate more often. The different protocols used to stimulate and
record evoked phasic and tonic responses make it difficult to directly compare the responses to
each other. However, the intent was to simply observe any changes to the responses to
investigate the underlying molecular events of exocytosis, which was the focus of this thesis.
There are other methods that can be used to decrease the phasic release to a level that is similar
to tonic release. These include decreasing the [Ca2+]o, using uncaging Ca2+ techniques to bypass
electrical stimulation of the phasic and tonic axons (see Millar et al., 2005), or even applying
continuous low frequency stimulation to the phasic axon over a period of days to weeks to
transform it into a more tonic-like synapse (reviewed in Atwood and Nguyen, 1995). However,
applying any of these methods would have altered the system such that the initial difference in
release probability between the two synapses would no longer be maintained. Therefore, this is
the reason why these techniques were not used in this thesis.
The measure of the evoked phasic and tonic responses was required to study release
probability. Another form of release that is present at phasic and tonic synapses is spontaneous
release (mini), which represents single fusion events (quantum release). Mini frequency is very
low and similar at both synapses (Hua and Charlton, 1999; Millar et al., 2005) but cannot directly
provide insight into release probability. However, mini recordings can help to determine if
specific factors (i.e. SNAREs and Complexin) are shared between evoked and spontaneous
release, and provide clues about individual fusion events. Unfortunately, I could not make
199
consistent and reliable mini recordings in the crayfish preparation. I found that mini frequency
tend to increase over time, especially after 3hrs or more following dissection. Futhermore, the
noise level also increased over time, making it difficult to record small minis. Although mini
recording would have provided some useful information, especially for the Complexin
experiments, it was not absolutely necessary as this thesis focused on the difference in release
probability between phasic and tonic evoked responses.
Finally, the use of neurotoxins and interfering peptides were indirect approaches to
examine the functional effects of protein-protein interactions at the synapse. Although the
neurotoxins used are specific for VAMP they do not provide information about the exact amount
of zippering of the SNAREs. The results of the interfering peptides could be non-specific effects
since very small peptides can have sequences found in many different proteins and, therefore,
bind to unintended targets. Furthermore, the concentration of these substances injected into
axonal terminals cannot be precisely measured at the synaptic level. The concentration of the
injected sample at the synapse is considered much smaller than that initially loaded into the
injection electrode. It is unknown if the same amount of neurotoxin or peptide was loaded in the
same axon between experiments and between the phasic and tonic axons.
6.6 Future directions
The results of this thesis pave the way for future experiments to continue to investigate
the mechanism responsible for the difference in release probability between the crayfish phasic
and tonic synapses.
6.6.1 SNARE zippering
The results showed that phasic and tonic synapses have vesicles in the RRP with partially
zippered trans-SNARE complexes. Although it would appear that the zippered state does not
contribute to the difference in release probability, there are still more experiments that can be
performed to further characterize the zippered state. One experiment involves injecting
Clostridial neurotoxins specific to SNAP-25 and Syntaxin to confirm if the SNARE complex is
partially zippered under resting conditions based on whether or not the proteins are cleaved by
the neurotoxins. Another experiment would involve injecting short peptides to different regions
of the SNARE motif of SNAP-25, Syntaxin, and VAMP to better assess the amount of zippering
of the SNARE complex. Finally, using neurotoxins and SNARE-specific peptides, determine if
200
other synaptic systems with synapses of varying strengths also have partially zippered SNARE
complexes.
6.6.2 Complexin
The results of using the interfering Complexin peptide showed that Complexin does
contribute to release probability at the synapse and, therefore, it is worth studying its role in
regulating SNARE zippering and controlling vesicle fusion in more detail. The use of the
interfering peptide is only one of many experiments that are required to thoroughly study
Complexin’s effects at the crayfish synapses.
To further study the effect of Complexin, it requires to first determine the full-length
sequence of crayfish Complexin and how many neuronal isoforms exist. Determining the number
of Complexin isoforms will require isolating all the expressed transcripts (mRNA) corresponding
to Complexin gene(s) or sequencing the crayfish genome and identifying the number of
Complexin genes.
Once the full-length Complexin sequence is found, peptides based on the other domains
of Complexin (N-terminal domain, accessory α-helix, and C-terminal domain) plus the full-
length protein can be injected into the phasic and tonic axons to determine the effect of each
domain or “overexpressing” the protein, respectively, at the synapse. A similar experiment can
be performed by also using full-length Complexin with mutations of key residues in each
domain. Using these different proteins or peptides of Complexin, mini recording can also be
made to determine if mini frequency is changed, which has been observed in previous studies
(i.e. Huntwork and Littleton, 2007).
Finally, an experiment can be performed that co-injects Complexin proteins or peptides
with either SNARE-specific neurotoxins or interfering peptides to determine if disrupting the
Complexin-SNARE complex interaction alters the zippered state of the SNARE complex under
resting conditions and the effects on release probability and size of the RRP. In addition, an in-
vitro assay can be preformed to determine if VAMP and Complexin peptides interfere with
SNARE complex formation. This involves extracting SNAREs and SNARE complexes from
neuronal tissues (i.e. nerve cord and phasic and tonic axons) under non-denaturing conditions
and mixing them with VAMP and Complexin peptides to determine if SNARE complex
formation is either disrupted or stabilized. Furthermore, the samples can be mixed with
201
Clostridial neurotoxins to the SNAREs to estimate the degree of zippering of SNARE complexes
in the presence of peptides.
6.6.3 Other experiments or techniques
The experiments used in this thesis focused on recording evoked responses. However, for
future experiments, it will be important to record other synaptic properties to more clearly
understand how different factors regulate release probability and mediate exocytosis. These
properties include mini frequency and amplitude, the size of the RRP, and even take electron
micrograph images of the synapse to determine if synaptic structure and vesicle docking are
affected. Another requirement will be to try to record the response during intense stimulation to
determine how the response changes during the course of stimulation. For example, does the
response initially facilitate and then decline or does it immediately decline when intense
stimulation is initiated?
Finally, the SNAREs and Complexin represent a small fraction of the total number of
factors that contribute to exocytosis and synaptic strength. Therefore, future experiments will
involve studying these other factors in which potential candidates includes Munc13, Munc18,
CAPS, Rab3a, and kinase and phosphatase activity.
6.7 Summary
I showed that Clostridial neurotoxins and a VAMP peptide can be used to indirectly
assess the zippered state of the SNARE complex at the synapse. The results indicated that at both
phasic and tonic synapses under resting conditions the SNARE complex (cis and trans
conformations) exists in a partially zippered state with the N-terminal end zippered and the C-
terminal end exposed, and this complex does not contribute to synaptic strength. Contrary,
Complexin’s interaction with the SNARE complex was found to contribute to release probability
but it has a small and maybe opposing effects at phasic versus tonic synapses. Complexin may
have a role in the late stages of vesicle priming such that it helps to initiate SNARE zippering
and then clamp it in a partially zippered state, which defines the end of vesicle priming and
results in fusion-competent vesicles in the RRP. However, other priming and post-priming
factors contribute more to synaptic release probability.
202
References
Abdulreda MH, Bhalla A, Chapman ER, Moy VT (2008) Atomic force microscope spectroscopy reveals a hemifusion intermediate during soluble N-ethylmaleimide-sensitive factor-attachment protein receptors-mediated membrane fusion. Biophys J 94:648-655.
Adler EM, Augustine GJ, Duffy SN, Charlton MP (1991) Alien intracellular calcium chelators attenuate neurotransmitter release at the squid giant synapse. J Neurosci 11:1496-1507.
Akbergenova Y, Bykhovskaia M (2009) Stimulation-induced formation of the reserve pool of vesicles in drosophila motor boutons. J Neurophysiol 101:2423-2433.
Akbergenova Y, Bykhovskaia M (2007) Synapsin maintains the reserve vesicle pool and spatial segregation of the recycling pool in drosophila presynaptic boutons. Brain Res 1178:52-64.
Alés E, Tabares L, Poyato JM, Valero V, Lindau M, Alvarez de Toledo G (1999) High calcium concentrations shift the mode of exocytosis to the kiss-and-run mechanism. Nat Cell Biol 1:40-44.
An SJ, Almers W (2004) Tracking SNARE complex formation in live endocrine cells. Science 306:1042-1046.
Apland JP, Adler M, Oyler GA (2003) Inhibition of neurotransmitter release by peptides that mimic the N-terminal domain of SNAP-25. J Protein Chem 22:147-153.
Arndt JW, Chai Q, Christian T, Stevens RC (2006) Structure of botulinum neurotoxin type D light chain at 1.65 A resolution: Repercussions for VAMP-2 substrate specificity. Biochemistry 45:3255-3262.
Atwood HL, Karunanithi S (2002) Diversification of synaptic strength: Presynaptic elements. Nat Rev Neurosci 3:497-516.
Atwood HL, Nguyen PV (1995) Neural adaptation in crayfish. Amer Zool 35:28-36.
Augustine GJ, Charlton MP, Smith SJ (1985) Calcium entry and transmitter release at voltage-clamped nerve terminals of squid. J Physiol 367:163-181.
Banerjee A, Barry VA, DasGupta BR, Martin TF (1996) N-ethylmaleimide-sensitive factor acts at a prefusion ATP-dependent step in Ca2+-activated exocytosis. J Biol Chem 271:20223-20226.
Baumert M, Maycox PR, Navone F, De Camilli P, Jahn R (1989) Synaptobrevin: An integral membrane protein of 18,000 daltons present in small synaptic vesicles of rat brain. EMBO J 8:379-384.
Bennett MK, Calakos N, Scheller RH (1992) Syntaxin: A synaptic protein implicated in docking of synaptic vesicles at presynaptic active zones. Science 257:255-259.
203
Bhalla A, Chicka MC, Tucker WC, Chapman ER (2006) Ca(2+)-synaptotagmin directly regulates t-SNARE function during reconstituted membrane fusion. Nat Struct Mol Biol 13:323-330.
Black JD, Dolly JO (1986) Interaction of 125I-labeled botulinum neurotoxins with nerve terminals. I. ultrastructural autoradiographic localization and quantitation of distinct membrane acceptors for types A and B on motor nerves. J Cell Biol 103:521-534.
Blanes-Mira C, Merino JM, Valera E, Fernandez-Ballester G, Gutierrez LM, Viniegra S, Perez-Paya E, Ferrer-Montiel A (2004) Small peptides patterned after the N-terminus domain of SNAP25 inhibit SNARE complex assembly and regulated exocytosis. J Neurochem 88:124-135.
Blasi J, Chapman ER, Link E, Binz T, Yamasaki S, De Camilli P, Südhof TC, Niemann H, Jahn R (1993a) Botulinum neurotoxin A selectively cleaves the synaptic protein SNAP-25. Nature 365:160-163.
Blasi J, Chapman ER, Yamasaki S, Binz T, Niemann H, Jahn R (1993b) Botulinum neurotoxin C1 blocks neurotransmitter release by means of cleaving HPC-1/syntaxin. EMBO J 12:4821-4828.
Borisovska M, Zhao Y, Tsytsyura Y, Glyvuk N, Takamori S, Matti U, Rettig J, Südhof T, Bruns D (2005) v-SNAREs control exocytosis of vesicles from priming to fusion. EMBO J 24:2114-2126.
Bracher A, Kadlec J, Betz H, Weissenhorn W (2002) X-ray structure of a neuronal complexin-SNARE complex from squid. J Biol Chem 277:26517-26523.
Bradacs H, Cooper R, Msghina M, Atwood H (1997) Differential physiology and morphology of phasic and tonic motor axons in a crayfish limb extensor muscle. J Exp Biol 200:677-691.
Breckenridge LJ, Almers W (1987) Currents through the fusion pore that forms during exocytosis of a secretory vesicle. Nature 328:814-817.
Bretou M, Anne C, Darchen F (2008) A fast mode of membrane fusion dependent on tight SNARE zippering. J Neurosci 28:8470-8476.
Broadie K, Prokop A, Bellen HJ, O'Kane CJ, Schulze KL, Sweeney ST (1995) Syntaxin and synaptobrevin function downstream of vesicle docking in drosophila. Neuron 15:663-673.
Brose N (2008) For better or for worse: Complexins regulate SNARE function and vesicle fusion. Traffic 9:1403-1413.
Brunger AT (2005) Structure and function of SNARE and SNARE-interacting proteins. Q Rev Biophys 38:1-47.
Bruns D, Engers S, Yang C, Ossig R, Jeromin A, Jahn R (1997) Inhibition of transmitter release correlates with the proteolytic activity of tetanus toxin and botulinus toxin A in individual cultured synapses of hirudo medicinalis. J Neurosci 17:1898-1910.
204
Burnashev N, Rozov A (2005) Presynaptic Ca2+ dynamics, Ca2+ buffers and synaptic efficacy. Cell Calcium 37:489-495.
Burre J, Sharma M, Tsetsenis T, Buchman V, Etherton MR, Südhof TC (2010) Alpha-synuclein promotes SNARE-complex assembly in vivo and in vitro. Science 329:1663-1667.
Cai H, Reim K, Varoqueaux F, Tapechum S, Hill K, Sørensen JB, Brose N, Chow RH (2008) Complexin II plays a positive role in Ca2+-triggered exocytosis by facilitating vesicle priming. Proc Natl Acad Sci U S A 105:19538-19543.
Cánaves JM, Montal M (1998) Assembly of a ternary complex by the predicted minimal coiled-coil-forming domains of syntaxin, SNAP-25, and synaptobrevin. A circular dichroism study. J Biol Chem 273:34214-34221.
Ceccarelli B, Hurlbut WP, Mauro A (1973) Turnover of transmitter and synaptic vesicles at the frog neuromuscular junction. J Cell Biol 57:499-524.
Ceccarelli B, Hurlbut WP, Mauro A (1972) Depletion of vesicles from frog neuromuscular junctions by prolonged tetanic stimulation. J Cell Biol 54:30-38.
Chapman ER, Davis AF (1998) Direct interaction of a Ca2+-binding loop of synaptotagmin with lipid bilayers. J Biol Chem 273:13995-14001.
Chapman ER, An S, Barton N, Jahn R (1994) SNAP-25, a t-SNARE which binds to both syntaxin and synaptobrevin via domains that may form coiled coils. J Biol Chem 269:27427-27432.
Chen S, Hall C, Barbieri JT (2008) Substrate recognition of VAMP-2 by botulinum neurotoxin B and tetanus neurotoxin. J Biol Chem 283:21153-21159.
Chen X, Tomchick DR, Kovrigin E, Arac D, Machius M, Südhof TC, Rizo J (2002) Three-dimensional structure of the complexin/SNARE complex. Neuron 33:397-409.
Chen YA, Scales SJ, Scheller RH (2001) Sequential SNARE assembly underlies priming and triggering of exocytosis. Neuron 30:161-170.
Chicka MC, Chapman ER (2009) Concurrent binding of complexin and synaptotagmin to liposome-embedded SNARE complexes. Biochemistry 48:657-659.
Chicka MC, Hui E, Liu H, Chapman ER (2008) Synaptotagmin arrests the SNARE complex before triggering fast, efficient membrane fusion in response to Ca2+. Nat Struct Mol Biol 15:827-835.
Chieregatti E, Witkin JW, Baldini G (2002) SNAP-25 and synaptotagmin 1 function in Ca2+-dependent reversible docking of granules to the plasma membrane. Traffic 3:496-511.
Chieregatti E, Chicka MC, Chapman ER, Baldini G (2004) SNAP-23 functions in docking/fusion of granules at low Ca2+. Mol Biol Cell 15:1918-1930.

205
Cho SJ, Kelly M, Rognlien KT, Cho JA, Horber JK, Jena BP (2002) SNAREs in opposing bilayers interact in a circular array to form conducting pores. Biophys J 83:2522-2527.
Cho WJ, Jeremic A, Jena BP (2005) Size of supramolecular SNARE complex: Membrane-directed self-assembly. J Am Chem Soc 127:10156-10157.
Clary DO, Griff IC, Rothman JE (1990) SNAPs, a family of NSF attachment proteins involved in intracellular membrane fusion in animals and yeast. Cell 61:709-721.
Cornille F, Deloye F, Fournie-Zaluski MC, Roques BP, Poulain B (1995) Inhibition of neurotransmitter release by synthetic proline-rich peptides shows that the N-terminal domain of vesicle-associated membrane protein/synaptobrevin is critical for neuro-exocytosis. J Biol Chem 270:16826-16832.
Critchley DR, Nelson PG, Habig WH, Fishman PH (1985) Fate of tetanus toxin bound to the surface of primary neurons in culture: Evidence for rapid internalization. J Cell Biol 100:1499-1507.
Cypionka A, Stein A, Hernandez JM, Hippchen H, Jahn R, Walla PJ (2009) Discrimination between docking and fusion of liposomes reconstituted with neuronal SNARE-proteins using FCS. Proc Natl Acad Sci U S A 106:18575-18580.
Dai H, Shen N, Arac D, Rizo J (2007) A quaternary SNARE-synaptotagmin-Ca2+-phospholipid complex in neurotransmitter release. J Mol Biol 367:848-863.
Das S, Gerwin C, Sheng ZH (2003) Syntaphilin binds to dynamin-1 and inhibits dynamin-dependent endocytosis. J Biol Chem 278:41221-41226.
DasGupta BR (1994) Structures of botulinum neurotoxin, its functional domains, and perspectives on the cristalline type A toxin. In: Therapy with botulinum toxin.(Jankovic J, Hammarlund M, eds), pp15-39. New York: Marcel Dekker.
DasGupta BR (1989) The structure of botulinum neurotoxin. In: Botulinum neurotoxin and tetanus toxin.(Simpson LL, ed), pp53-67. San Diego: Academic Press.
de Haro L, Quetglas S, Iborra C, Leveque C, Seagar M (2003) Calmodulin-dependent regulation of a lipid binding domain in the v-SNARE synaptobrevin and its role in vesicular fusion. Biol Cell 95:459-464.
de Haro L, Ferracci G, Opi S, Iborra C, Quetglas S, Miquelis R, Leveque C, Seagar M (2004) Ca2+/calmodulin transfers the membrane-proximal lipid-binding domain of the v-SNARE synaptobrevin from cis to trans bilayers. Proc Natl Acad Sci U S A 101:1578-1583.
de Wit H, Walter AM, Milosevic I, Gulyas-Kovacs A, Riedel D, Sørensen JB, Verhage M (2009) Synaptotagmin-1 docks secretory vesicles to syntaxin-1/SNAP-25 acceptor complexes. Cell 138:935-946.
206
Deák F, Shin OH, Kavalali ET, Südhof TC (2006) Structural determinants of synaptobrevin 2 function in synaptic vesicle fusion. J Neurosci 26:6668-6676.
Deinhardt K, Berninghausen O, Willison HJ, Hopkins CR, Schiavo G (2006) Tetanus toxin is internalized by a sequential clathrin-dependent mechanism initiated within lipid microdomains and independent of epsin1. J Cell Biol 174:459-471.
Deitcher DL, Ueda A, Stewart BA, Burgess RW, Kidokoro Y, Schwarz TL (1998) Distinct requirements for evoked and spontaneous release of neurotransmitter are revealed by mutations in the drosophila gene neuronal-synaptobrevin. J Neurosci 18:2028-2039.
del Castillo J, Katz B (1954) Quantal components of the end-plate potential. J Physiol 124:560-573.
Delaney KR, Zucker RS, Tank DW (1989) Calcium in motor nerve terminals associated with posttetanic potentiation. J Neurosci 9:3558-3567.
Denker A, Rizzoli SO (2010) Synaptic vesicle pools: An update. Frontiers in Synaptic Neuroscience 2:1-12.
Denker A, Krohnert K, Rizzoli SO (2009) Revisiting synaptic vesicle pool localization in the drosophila neuromuscular junction. J Physiol 587:2919-2926.
Dobrunz LE, Stevens CF (1997) Heterogeneity of release probability, facilitation, and depletion at central synapses. Neuron 18:995-1008.
Dolly JO, Black J, Williams RS, Melling J (1984) Acceptors for botulinum neurotoxin reside on motor nerve terminals and mediate its internalization. Nature 307:457-460.
Domanska MK, Kiessling V, Stein A, Fasshauer D, Tamm LK (2009) Single vesicle millisecond fusion kinetics reveals number of SNARE complexes optimal for fast SNARE-mediated membrane fusion. J Biol Chem 284:32158-32166.
Dong M, Tepp WH, Johnson EA, Chapman ER (2004) Using fluorescent sensors to detect botulinum neurotoxin activity in vitro and in living cells. Proc Natl Acad Sci U S A 101:14701-14706.
Donovan JJ, Middlebrook JL (1986) Ion-conducting channels produced by botulinum toxin in planar lipid membranes. Biochemistry 25:2872-2876.
Dreyer F, Peper K, Akert K, Sandri C, Moor H (1973) Ultrastructure of the "active zone" in the frog neuromuscular junction. Brain Res 62:373-380.
Dulubova I, Lou X, Lu J, Huryeva I, Alam A, Schneggenburger R, Südhof TC, Rizo J (2005) A Munc13/RIM/Rab3 tripartite complex: From priming to plasticity? EMBO J 24:2839-2850.
Dun AR, Rickman C, Duncan RR (2010) The t-SNARE complex: A close up. Cell Mol Neurobiol 30:1321-1326.
207
Dykes IM, Davies JA (2004) Cloning and expression of a leech complexin. Gene Expr Patterns 4:93-97.
Elferink LA, Trimble WS, Scheller RH (1989) Two vesicle-associated membrane protein genes are differentially expressed in the rat central nervous system. J Biol Chem 264:11061-11064.
Elhamdani A, Azizi F, Artalejo CR (2006) Double patch clamp reveals that transient fusion (kiss-and-run) is a major mechanism of secretion in calf adrenal chromaffin cells: High calcium shifts the mechanism from kiss-and-run to complete fusion. J Neurosci 26:3030-3036.
Ellena JF, Liang B, Wiktor M, Stein A, Cafiso DS, Jahn R, Tamm LK (2009) Dynamic structure of lipid-bound synaptobrevin suggests a nucleation-propagation mechanism for trans-SNARE complex formation. Proc Natl Acad Sci U S A 106:20306-20311.
Farrell Jr RE (2005) RNA methodologies: A laboratory guide for isolation and characterization. London, UK: Elsevier Academic Press.
Fasshauer D, Margittai M (2004) A transient N-terminal interaction of SNAP-25 and syntaxin nucleates SNARE assembly. J Biol Chem 279:7613-7621.
Fasshauer D, Antonin W, Subramaniam V, Jahn R (2002) SNARE assembly and disassembly exhibit a pronounced hysteresis. Nat Struct Biol 9:144-151.
Fasshauer D, Eliason WK, Brunger AT, Jahn R (1998a) Identification of a minimal core of the synaptic SNARE complex sufficient for reversible assembly and disassembly. Biochemistry 37:10354-10362.
Fasshauer D, Sutton RB, Brunger AT, Jahn R (1998b) Conserved structural features of the synaptic fusion complex: SNARE proteins reclassified as Q- and R-SNAREs. Proc Natl Acad Sci U S A 95:15781-15786.
Fasshauer D, Bruns D, Shen B, Jahn R, Brunger AT (1997a) A structural change occurs upon binding of syntaxin to SNAP-25. J Biol Chem 272:4582-4590.
Fasshauer D, Otto H, Eliason WK, Jahn R, Brunger AT (1997b) Structural changes are associated with soluble N-ethylmaleimide-sensitive fusion protein attachment protein receptor complex formation. J Biol Chem 272:28036-28041.
Fatt P, Katz B (1952) Spontaneous subthreshold activity at motor nerve endings. J Physiol 117:109-128.
Fedchyshyn MJ, Wang LY (2005) Developmental transformation of the release modality at the calyx of held synapse. J Neurosci 25:4131-4140.
Fengler BT, Lnenicka GA (2002) Activity-dependent plasticity of calcium clearance from crayfish motor axons. J Neurophysiol 87:1625-1628.
208
Fergestad T, Wu MN, Schulze KL, Lloyd TE, Bellen HJ, Broadie K (2001) Targeted mutations in the syntaxin H3 domain specifically disrupt SNARE complex function in synaptic transmission. J Neurosci 21:9142-9150.
Fernandez I, Arac D, Ubach J, Gerber SH, Shin O, Gao Y, Anderson RG, Südhof TC, Rizo J (2001) Three-dimensional structure of the synaptotagmin 1 C2B-domain: Synaptotagmin 1 as a phospholipid binding machine. Neuron 32:1057-1069.
Fernandez-Chacon R, Südhof TC (1999) Genetics of synaptic vesicle function: Toward the complete functional anatomy of an organelle. Annu Rev Physiol 61:753-776.
Fernandez-Chacon R, Shin OH, Konigstorfer A, Matos MF, Meyer AC, Garcia J, Gerber SH, Rizo J, Südhof TC, Rosenmund C (2002) Structure/function analysis of Ca2+ binding to the C2A domain of synaptotagmin 1. J Neurosci 22:8438-8446.
Fernandez-Chacon R, Konigstorfer A, Gerber SH, Garcia J, Matos MF, Stevens CF, Brose N, Rizo J, Rosenmund C, Südhof TC (2001) Synaptotagmin I functions as a calcium regulator of release probability. Nature 410:41-49.
Fernández-Peruchena C, Navas S, Montes MA, Alvarez de Toledo G (2005) Fusion pore regulation of transmitter release. Brain Res Brain Res Rev 49:406-415.
Ferrer-Montiel AV, Gutierrez LM, Apland JP, Cánaves JM, Gil A, Viniegra S, Biser JA, Adler M, Montal M (1998) The 26-mer peptide released from SNAP-25 cleavage by botulinum neurotoxin E inhibits vesicle docking. FEBS Lett 435:84-88.
Fesce R, Grohovaz F, Valtorta F, Meldolesi J (1994) Neurotransmitter release: Fusion or 'kiss-and-run'? Trends Cell Biol 4:1-4.
Fiebig KM, Rice LM, Pollock E, Brunger AT (1999) Folding intermediates of SNARE complex assembly. Nat Struct Biol 6:117-123.
Finley MF, Patel SM, Madison DV, Scheller RH (2002) The core membrane fusion complex governs the probability of synaptic vesicle fusion but not transmitter release kinetics. J Neurosci 22:1266-1272.
Fioravante D, Regehr WG (2011) Short-term forms of presynaptic plasticity. Curr Opin Neurobiol 21:269-274.
Fix M, Melia TJ, Jaiswal JK, Rappoport JZ, You D, Söllner TH, Rothman JE, Simon SM (2004) Imaging single membrane fusion events mediated by SNARE proteins. Proc Natl Acad Sci U S A 101:7311-7316.
Fredj NB, Burrone J (2009) A resting pool of vesicles is responsible for spontaneous vesicle fusion at the synapse. Nat Neurosci 12:751-758.
209
Fujita Y, Shirataki H, Sakisaka T, Asakura T, Ohya T, Kotani H, Yokoyama S, Nishioka H, Matsuura Y, Mizoguchi A, Scheller RH, Takai Y (1998) Tomosyn: A syntaxin-1-binding protein that forms a novel complex in the neurotransmitter release process. Neuron 20:905-915.
Furshpan EJ, Potter DD (1959) Transmission at the giant motor synapses of the crayfish. J Physiol 145:289-325.
Gaffield MA, Rizzoli SO, Betz WJ (2006) Mobility of synaptic vesicles in different pools in resting and stimulated frog motor nerve terminals. Neuron 51:317-325.
Galli T, Zahraoui A, Vaidyanathan VV, Raposo G, Tian JM, Karin M, Niemann H, Louvard D (1998) A novel tetanus neurotoxin-insensitive vesicle-associated membrane protein in SNARE complexes of the apical plasma membrane of epithelial cells. Mol Biol Cell 9:1437-1448.
Gambale F, Montal M (1988) Characterization of the channel properties of tetanus toxin in planar lipid bilayers. Biophys J 53:771-783.
Geppert M, Goda Y, Hammer RE, Li C, Rosahl TW, Stevens CF, Südhof TC (1994) Synaptotagmin I: A major Ca2+ sensor for transmitter release at a central synapse. Cell 79:717-727.
Gerona RR, Larsen EC, Kowalchyk JA, Martin TF (2000) The C terminus of SNAP25 is essential for ca(2+)-dependent binding of synaptotagmin to SNARE complexes. J Biol Chem 275:6328-6336.
Gil A, Viniegra S, Gutierrez LM (1998) Dual effects of botulinum neurotoxin A on the secretory stages of chromaffin cells. Eur J Neurosci 10:3369-3378.
Gill DM (1982) Bacterial toxins: A table of lethal amounts. Microbiol Rev 46:86-94.
Giraudo CG, Eng WS, Melia TJ, Rothman JE (2006) A clamping mechanism involved in SNARE-dependent exocytosis. Science 313:676-680.
Giraudo CG, Garcia-Diaz A, Eng WS, Yamamoto A, Melia TJ, Rothman JE (2008) Distinct domains of complexins bind SNARE complexes and clamp fusion in vitro. J Biol Chem 283:21211-21219.
Giraudo CG, Garcia-Diaz A, Eng WS, Chen Y, Hendrickson WA, Melia TJ, Rothman JE (2009) Alternative zippering as an on-off switch for SNARE-mediated fusion. Science 323:512-516.
Govind CK, Pearce J (2003) Active zones and receptor surfaces of freeze-fractured crayfish phasic and tonic motor synapses. J Neurocytol 32:39-51.
Graf CT, Riedel D, Schmitt HD, Jahn R (2005) Identification of functionally interacting SNAREs by using complementary substitutions in the conserved '0' layer. Mol Biol Cell 16:2263-2274.
210
Graham ME, Washbourne P, Wilson MC, Burgoyne RD (2001) SNAP-25 with mutations in the zero layer supports normal membrane fusion kinetics. J Cell Sci 114:4397-4405.
Graham TR, Emr SD (1991) Compartmental organization of golgi-specific protein modification and vacuolar protein sorting events defined in a yeast sec18 (NSF) mutant. J Cell Biol 114:207-218.
Grumelli C, Verderio C, Pozzi D, Rossetto O, Montecucco C, Matteoli M (2005) Internalization and mechanism of action of clostridial toxins in neurons. Neurotoxicology 26:761-767.
Gupta A, Wang Y, Markram H (2000) Organizing principles for a diversity of GABAergic interneurons and synapses in the neocortex. Science 287:273-278.
Hammarlund M, Watanabe S, Schuske K, Jorgensen EM (2008) CAPS and syntaxin dock dense core vesicles to the plasma membrane in neurons. J Cell Biol 180:483-491.
Han L, Jiang T, Han GA, Malintan NT, Xie L, Wang L, Tse FW, Gaisano HY, Collins BM, Meunier FA, Sugita S (2009) Rescue of Munc18-1 and -2 double knockdown reveals the essential functions of interaction between Munc18 and closed syntaxin in PC12 cells. Mol Biol Cell 20:4962-4975.
Han X, Jackson MB (2006) Structural transitions in the synaptic SNARE complex during Ca2+-triggered exocytosis. J Cell Biol 172:281-293.
Han X, Wang CT, Bai J, Chapman ER, Jackson MB (2004) Transmembrane segments of syntaxin line the fusion pore of Ca2+-triggered exocytosis. Science 304:289-292.
Hanson PI, Heuser JE, Jahn R (1997) Neurotransmitter release - four years of SNARE complexes. Curr Opin Neurobiol 7:310-315.
Harata N, Ryan TA, Smith SJ, Buchanan J, Tsien RW (2001) Visualizing recycling synaptic vesicles in hippocampal neurons by FM 1-43 photoconversion. Proc Natl Acad Sci U S A 98:12748-12753.
Harlow ML, Ress D, Stoschek A, Marshall RM, McMahan UJ (2001) The architecture of active zone material at the frog's neuromuscular junction. Nature 409:479-484.
Harrington CC, Atwood HL (1995) "Satellite cells" and nerve terminals in the crayfish opener muscle visualized with fluorescent dyes. J Comp Neurol 361:441-450.
Hatt H, Smith DO (1976) Non-uniform probabilities of quantal release at the crayfish neuromuscular junction. J Physiol 259:395-404.
Hayashi T, McMahon H, Yamasaki S, Binz T, Hata Y, Südhof TC, Niemann H (1994) Synaptic vesicle membrane fusion complex: Action of clostridial neurotoxins on assembly. EMBO J 13:5051-5061.
211
He L, Wu LG (2007) The debate on the kiss-and-run fusion at synapses. Trends Neurosci 30:447-455.
Heidelberger R, Sterling P, Matthews G (2002) Roles of ATP in depletion and replenishment of the releasable pool of synaptic vesicles. J Neurophysiol 88:98-106.
Hess DT, Slater TM, Wilson MC, Skene JH (1992) The 25 kDa synaptosomal-associated protein SNAP-25 is the major methionine-rich polypeptide in rapid axonal transport and a major substrate for palmitoylation in adult CNS. J Neurosci 12:4634-4641.
Heuser JE (1989) Review of electron microscopic evidence favouring vesicle exocytosis as the structural basis for quantal release during synaptic transmission. Q J Exp Physiol 74:1051-1069.
Heuser JE, Reese TS (1981) Structural changes after transmitter release at the frog neuromuscular junction. J Cell Biol 88:564-580.
Heuser JE, Reese TS, Dennis MJ, Jan Y, Jan L, Evans L (1979) Synaptic vesicle exocytosis captured by quick freezing and correlated with quantal transmitter release. J Cell Biol 81:275-300.
Hilfiker S, Czernik AJ, Greengard P, Augustine GJ (2001) Tonically active protein kinase A regulates neurotransmitter release at the squid giant synapse. J Physiol 531:141-146.
Hobson RJ, Liu Q, Watanabe S, Jorgensen EM (2011) Complexin maintains vesicles in the primed state in C. elegans. Curr Biol 21:106-113.
Hoch DH, Romero-Mira M, Ehrlich BE, Finkelstein A, DasGupta BR, Simpson LL (1985) Channels formed by botulinum, tetanus, and diphtheria toxins in planar lipid bilayers: Relevance to translocation of proteins across membranes. Proc Natl Acad Sci U S A 82:1692-1696.
Holt M, Riedel D, Stein A, Schuette C, Jahn R (2008) Synaptic vesicles are constitutively active fusion machines that function independently of Ca2+. Curr Biol 18:715-722.
Hu K, Carroll J, Fedorovich S, Rickman C, Sukhodub A, Davletov B (2002) Vesicular restriction of synaptobrevin suggests a role for calcium in membrane fusion. Nature 415:646-650.
Hua SY, Charlton MP (1999) Activity-dependent changes in partial VAMP complexes during neurotransmitter release. Nat Neurosci 2:1078-1083.
Hua SY, Raciborska DA, Trimble WS, Charlton MP (1998) Different VAMP/synaptobrevin complexes for spontaneous and evoked transmitter release at the crayfish neuromuscular junction. J Neurophysiol 80:3233-3246.
Hua Y, Scheller RH (2001) Three SNARE complexes cooperate to mediate membrane fusion. Proc Natl Acad Sci U S A 98:8065-8070.
Hua Z, Leal-Ortiz S, Foss SM, Waites CL, Garner CC, Voglmaier SM, Edwards RH (2011) v-SNARE composition distinguishes synaptic vesicle pools. Neuron 71:474-487.
212
Huang X, Kang YH, Pasyk EA, Sheu L, Wheeler MB, Trimble WS, Salapatek A, Gaisano HY (2001) Ca(2+) influx and cAMP elevation overcame botulinum toxin A but not tetanus toxin inhibition of insulin exocytosis. Am J Physiol Cell Physiol 281:C740-50.
Hui E, Johnson CP, Yao J, Dunning FM, Chapman ER (2009) Synaptotagmin-mediated bending of the target membrane is a critical step in ca(2+)-regulated fusion. Cell 138:709-721.
Hunt JM, Bommert K, Charlton MP, Kistner A, Habermann E, Augustine GJ, Betz H (1994) A post-docking role for synaptobrevin in synaptic vesicle fusion. Neuron 12:1269-1279.
Huntwork S, Littleton JT (2007) A complexin fusion clamp regulates spontaneous neurotransmitter release and synaptic growth. Nat Neurosci 10:1235-1237.
Ishizuka T, Saisu H, Odani S, Abe T (1995) Synaphin: A protein associated with the docking/fusion complex in presynaptic terminals. Biochem Biophys Res Commun 213:1107-1114.
Ishizuka T, Saisu H, Suzuki T, Kirino Y, Abe T (1997) Molecular cloning of synaphins/complexins, cytosolic proteins involved in transmitter release, in the electric organ of an electric ray (narke japonica). Neurosci Lett 232:107-110.
Ito H, Atsuzawa K, Morishita R, Usuda N, Sudo K, Iwamoto I, Mizutani K, Katoh-Semba R, Nozawa Y, Asano T, Nagata K (2009) Sept8 controls the binding of vesicle-associated membrane protein 2 to synaptophysin. J Neurochem 108:867-880.
Jahn R, Scheller RH (2006) SNAREs--engines for membrane fusion. Nat Rev Mol Cell Biol 7:631-643.
Jahn R, Südhof TC (1999) Membrane fusion and exocytosis. Annu Rev Biochem 68:863-911.
James DJ, Kowalchyk J, Daily N, Petrie M, Martin TF (2009) CAPS drives trans-SNARE complex formation and membrane fusion through syntaxin interactions. Proc Natl Acad Sci U S A 106:17308-17313.
Jung CH, Yang YS, Kim JS, Shin JI, Jin YS, Shin JY, Lee JH, Chung KM, Hwang JS, Oh JM, Shin YK, Kweon DH (2008) A search for synthetic peptides that inhibit soluble N-ethylmaleimide sensitive-factor attachment receptor-mediated membrane fusion. FEBS J 275:3051-3063.
Kaiser CA, Schekman R (1990) Distinct sets of SEC genes govern transport vesicle formation and fusion early in the secretory pathway. Cell 61:723-733.
Katz B (1971) Quantal mechanism of neural transmitter release. Science 173:123-126.
Katz B, Miledi R (1969) Spontaneous and evoked activity of motor nerve endings in calcium ringer. J Physiol 203:689-706.
213
Katz B, Miledi R (1967) A study of synaptic transmission in the absence of nerve impulses. J Physiol 192:407-436.
Katz B, Miledi R (1965) The effect of calcium on acetylcholine release from motor nerve terminals. Proc R Soc Lond B Biol Sci 161:496-503.
Katz L, Brennwald P (2000) Testing the 3Q:1R "rule": Mutational analysis of the ionic "zero" layer in the yeast exocytic SNARE complex reveals no requirement for arginine. Mol Biol Cell 11:3849-3858.
Kee Y, Scheller RH (1996) Localization of synaptotagmin-binding domains on syntaxin. J Neurosci 16:1975-1981.
Kesavan J, Borisovska M, Bruns D (2007) v-SNARE actions during ca(2+)-triggered exocytosis. Cell 131:351-363.
Kidokoro Y (2003) Roles of SNARE proteins and synaptotagmin I in synaptic transmission: Studies at the drosophila neuromuscular synapse. Neurosignals 12:13-30.
King MJ, Atwood HL, Govind CK (1996) Structural features of crayfish phasic and tonic neuromuscular terminals. J Comp Neurol 372:618-626.
Klenchin VA, Martin TF (2000) Priming in exocytosis: Attaining fusion-competence after vesicle docking. Biochimie 82:399-407.
Klingauf J, Kavalali ET, Tsien RW (1998) Kinetics and regulation of fast endocytosis at hippocampal synapses. Nature 394:581-585.
Ko CP (1984) Regeneration of the active zone at the frog neuromuscular junction. J Cell Biol 98:1685-1695.
Koenig JH, Ikeda K (1989) Disappearance and reformation of synaptic vesicle membrane upon transmitter release observed under reversible blockage of membrane retrieval. J Neurosci 9:3844-3860.
Kopp-Scheinpflug C, Tolnai S, Malmierca MS, Rubsamen R (2008) The medial nucleus of the trapezoid body: Comparative physiology. Neuroscience 154:160-170.
Kozlovsky Y, Kozlov MM (2002) Stalk model of membrane fusion: Solution of energy crisis. Biophys J 82:882-895.
Krishnakumar SS, Radoff DT, Kümmel D, Giraudo CG, Li F, Khandan L, Baguley SW, Coleman J, Reinisch KM, Pincet F, Rothman JE (2011) A conformational switch in complexin is required for synaptotagmin to trigger synaptic fusion. Nat Struct Mol Biol 18:934-940.
Kubista H, Edelbauer H, Boehm S (2004) Evidence for structural and functional diversity among SDS-resistant SNARE complexes in neuroendocrine cells. J Cell Sci 117:955-966.
214
Kümmel D, Krishnakumar SS, Radoff DT, Li F, Giraudo CG, Pincet F, Rothman JE, Reinisch KM (2011) Complexin cross-links prefusion SNAREs into a zigzag array. Nat Struct Mol Biol 18:927-933.
Kurdyak P, Atwood HL, Stewart BA, Wu CF (1994) Differential physiology and morphology of motor axons to ventral longitudinal muscles in larval drosophila. J Comp Neurol 350:463-472.
Kuromi H, Kidokoro Y (2000) Tetanic stimulation recruits vesicles from reserve pool via a cAMP-mediated process in drosophila synapses. Neuron 27:133-143.
Kuromi H, Kidokoro Y (1998) Two distinct pools of synaptic vesicles in single presynaptic boutons in a temperature-sensitive drosophila mutant, shibire. Neuron 20:917-925.
Lacy DB, Tepp W, Cohen AC, DasGupta BR, Stevens RC (1998) Crystal structure of botulinum neurotoxin type A and implications for toxicity. Nat Struct Biol 5:898-902.
Lane SR, Liu Y (1997) Characterization of the palmitoylation domain of SNAP-25. J Neurochem 69:1864-1869.
Lao G, Scheuss V, Gerwin CM, Su Q, Mochida S, Rettig J, Sheng ZH (2000) Syntaphilin: A syntaxin-1 clamp that controls SNARE assembly. Neuron 25:191-201.
Lauer JM, Dalal S, Marz KE, Nonet ML, Hanson PI (2006) SNARE complex zero layer residues are not critical for N-ethylmaleimide-sensitive factor-mediated disassembly. J Biol Chem 281:14823-14832.
Lawrence GW, Dolly JO (2002) Ca2+-induced changes in SNAREs and synaptotagmin I correlate with triggered exocytosis from chromaffin cells: Insights gleaned into the signal transduction using trypsin and botulinum toxins. J Cell Sci 115:2791-2800.
Lawrence GW, Dolly JO (2002) Multiple forms of SNARE complexes in exocytosis from chromaffin cells: Effects of ca(2+), MgATP and botulinum toxin type A. J Cell Sci 115:667-673.
Li F, Pincet F, Perez E, Giraudo CG, Tareste D, Rothman JE (2011) Complexin activates and clamps SNAREpins by a common mechanism involving an intermediate energetic state. Nat Struct Mol Biol 18:941-946.
Li F, Pincet F, Perez E, Eng WS, Melia TJ, Rothman JE, Tareste D (2007) Energetics and dynamics of SNAREpin folding across lipid bilayers. Nat Struct Mol Biol 14:890-896.
Li L, Chin LS (2003) The molecular machinery of synaptic vesicle exocytosis. Cell Mol Life Sci 60:942-960.
Li Y, Foran P, Fairweather NF, de Paiva A, Weller U, Dougan G, Dolly JO (1994) A single mutation in the recombinant light chain of tetanus toxin abolishes its proteolytic activity and removes the toxicity seen after reconstitution with native heavy chain. Biochemistry 33:7014-7020.
215
Lin RC, Scheller RH (2000) Mechanisms of synaptic vesicle exocytosis. Annu Rev Cell Dev Biol 16:19-49.
Lin RC, Scheller RH (1997) Structural organization of the synaptic exocytosis core complex. Neuron 19:1087-1094.
Link E, Edelmann L, Chou JH, Binz T, Yamasaki S, Eisel U, Baumert M, Südhof TC, Niemann H, Jahn R (1992) Tetanus toxin action: Inhibition of neurotransmitter release linked to synaptobrevin proteolysis. Biochem Biophys Res Commun 189:1017-1023.
Lisman JE, Raghavachari S, Tsien RW (2007) The sequence of events that underlie quantal transmission at central glutamatergic synapses. Nat Rev Neurosci 8:597-609.
Liu J, Guo T, Wei Y, Liu M, Sui SF (2006) Complexin is able to bind to SNARE core complexes in different assembled states with distinct affinity. Biochem Biophys Res Commun 347:413-419.
Liu J, Guo T, Wu J, Bai X, Zhou Q, Sui SF (2007) Overexpression of complexin in PC12 cells inhibits exocytosis by preventing SNARE complex recycling. Biochemistry (Mosc) 72:439-444.
Liu T, Tucker WC, Bhalla A, Chapman ER, Weisshaar JC (2005) SNARE-driven, 25-millisecond vesicle fusion in vitro. Biophys J 89:2458-2472.
Liu W, Montana V, Parpura V, Mohideen U (2008) Comparative energy measurements in single molecule interactions. Biophys J 95:419-425.
Liu W, Montana V, Bai J, Chapman ER, Mohideen U, Parpura V (2006) Single molecule mechanical probing of the SNARE protein interactions. Biophys J 91:744-758.
Liu Y, Schirra C, Edelmann L, Matti U, Rhee J, Hof D, Bruns D, Brose N, Rieger H, Stevens DR, Rettig J (2010) Two distinct secretory vesicle-priming steps in adrenal chromaffin cells. J Cell Biol 190:1067-1077.
Llinás R, Sugimori M, Silver RB (1992) Microdomains of high calcium concentration in a presynaptic terminal. Science 256:677-679.
Llinás R, Sugimori M, Simon SM (1982) Transmission by presynaptic spike-like depolarization in the squid giant synapse. Proc Natl Acad Sci U S A 79:2415-2419.
Llinás R, Steinberg IZ, Walton K (1981) Relationship between presynaptic calcium current and postsynaptic potential in squid giant synapse. Biophys J 33:323-351.
Llinás R, Sugimori M, Chu D, Morita M, Blasi J, Herreros J, Jahn R, Marsal J (1994) Transmission at the squid giant synapse was blocked by tetanus toxin by affecting synaptobrevin, a vesicle-bound protein. J Physiol 477 ( Pt 1):129-133.
Llobet A, Beaumont V, Lagnado L (2003) Real-time measurement of exocytosis and endocytosis using interference of light. Neuron 40:1075-1086.
216
Lnenicka GA, Keshishian H (2000) Identified motor terminals in drosophila larvae show distinct differences in morphology and physiology. J Neurobiol 43:186-197.
Low P, Norlin T, Risinger C, Larhammar D, Pieribone VA, Shupliakov O, Brodin L (1999) Inhibition of neurotransmitter release in the lamprey reticulospinal synapse by antibody-mediated disruption of SNAP-25 function. Eur J Cell Biol 78:787-793.
Lu X, Xu Y, Zhang F, Shin YK (2006) Synaptotagmin I and ca(2+) promote half fusion more than full fusion in SNARE-mediated bilayer fusion. FEBS Lett 580:2238-2246.
Lynch KL, Gerona RR, Larsen EC, Marcia RF, Mitchell JC, Martin TF (2007) Synaptotagmin C2A loop 2 mediates Ca2+-dependent SNARE interactions essential for Ca2+-triggered vesicle exocytosis. Mol Biol Cell 18:4957-4968.
Macleod GT, Hegstrom-Wojtowicz M, Charlton MP, Atwood HL (2002) Fast calcium signals in drosophila motor neuron terminals. J Neurophysiol 88:2659-2663.
Mahal LK, Sequeira SM, Gureasko JM, Söllner TH (2002) Calcium-independent stimulation of membrane fusion and SNAREpin formation by synaptotagmin I. J Cell Biol 158:273-282.
Malsam J, Seiler F, Schollmeier Y, Rusu P, Krause JM, Söllner TH (2009) The carboxy-terminal domain of complexin I stimulates liposome fusion. Proc Natl Acad Sci U S A 106:2001-2006.
Marsal J, Ruiz-Montasell B, Blasi J, Moreira JE, Contreras D, Sugimori M, Llinás R (1997) Block of transmitter release by botulinum C1 action on syntaxin at the squid giant synapse. Proc Natl Acad Sci U S A 94:14871-14876.
Martens S, Kozlov MM, McMahon HT (2007) How synaptotagmin promotes membrane fusion. Science 316:1205-1208.
Martin JA, Hu Z, Fenz KM, Fernandez J, Dittman JS (2011) Complexin has opposite effects on two modes of synaptic vesicle fusion. Curr Biol 21:97-105.
Martinez-Arca S, Alberts P, Zahraoui A, Louvard D, Galli T (2000) Role of tetanus neurotoxin insensitive vesicle-associated membrane protein (TI-VAMP) in vesicular transport mediating neurite outgrowth. J Cell Biol 149:889-900.
Matos MF, Mukherjee K, Chen X, Rizo J, Südhof TC (2003) Evidence for SNARE zippering during Ca2+-triggered exocytosis in PC12 cells. Neuropharmacology 45:777-786.
Matteoli M, Takei K, Perin MS, Südhof TC, De Camilli P (1992) Exo-endocytotic recycling of synaptic vesicles in developing processes of cultured hippocampal neurons. J Cell Biol 117:849-861.
Matteoli M, Verderio C, Rossetto O, Iezzi N, Coco S, Schiavo G, Montecucco C (1996) Synaptic vesicle endocytosis mediates the entry of tetanus neurotoxin into hippocampal neurons. Proc Natl Acad Sci U S A 93:13310-13315.
217
Maximov A, Tang J, Yang X, Pang ZP, Südhof TC (2009) Complexin controls the force transfer from SNARE complexes to membranes in fusion. Science 323:516-521.
McMahon HT, Missler M, Li C, Südhof TC (1995) Complexins: Cytosolic proteins that regulate SNAP receptor function. Cell 83:111-119.
Melia TJ, You D, Tareste DC, Rothman JE (2006) Lipidic antagonists to SNARE-mediated fusion. J Biol Chem 281:29597-29605.
Melia TJ, Weber T, McNew JA, Fisher LE, Johnston RJ, Parlati F, Mahal LK, Söllner TH, Rothman JE (2002) Regulation of membrane fusion by the membrane-proximal coil of the t-SNARE during zippering of SNAREpins. J Cell Biol 158:929-940.
Millar AG, Bradacs H, Charlton MP, Atwood HL (2002) Inverse relationship between release probability and readily releasable vesicles in depressing and facilitating synapses. J Neurosci 22:9661-9667.
Millar AG, Zucker RS, Ellis-Davies GC, Charlton MP, Atwood HL (2005) Calcium sensitivity of neurotransmitter release differs at phasic and tonic synapses. J Neurosci 25:3113-3125.
Montecucco C, Schiavo G (1993) Tetanus and botulism neurotoxins: A new group of zinc proteases. Trends Biochem Sci 18:324-327.
Montecucco C, Schiavo G, Pantano S (2005) SNARE complexes and neuroexocytosis: How many, how close? Trends Biochem Sci 30:367-372.
Montecucco C, Rossetto O, Schiavo G (2004) Presynaptic receptor arrays for clostridial neurotoxins. Trends Microbiol 12:442-446.
Msghina M, Govind CK, Atwood HL (1998) Synaptic structure and transmitter release in crustacean phasic and tonic motor neurons. J Neurosci 18:1374-1382.
Msghina M, Millar AG, Charlton MP, Govind CK, Atwood HL (1999) Calcium entry related to active zones and differences in transmitter release at phasic and tonic synapses. J Neurosci 19:8419-8434.
Mulkey RM, Zucker RS (1992) Posttetanic potentiation at the crayfish neuromuscular junction is dependent on both intracellular calcium and sodium ion accumulation. J Neurosci 12:4327-4336.
Neher E (2010) Complexin: Does it deserve its name? Neuron 68:803-806.
Neher E, Sakaba T (2008) Multiple roles of calcium ions in the regulation of neurotransmitter release. Neuron 59:861-872.
Ngatchou AN, Kisler K, Fang Q, Walter AM, Zhao Y, Bruns D, Sørensen JB, Lindau M (2010) Role of the synaptobrevin C terminus in fusion pore formation. Proc Natl Acad Sci U S A 107:18463-18468.
218
Nguyen PV, Marin L, Atwood HL (1997) Synaptic physiology and mitochondrial function in crayfish tonic and phasic motor neurons. J Neurophysiol 78:281-294.
Nishiki T, Tokuyama Y, Kamata Y, Nemoto Y, Yoshida A, Sekiguchi M, Takahashi M, Kozaki S (1996) Binding of botulinum type B neurotoxin to chinese hamster ovary cells transfected with rat synaptotagmin II cDNA. Neurosci Lett 208:105-108.
Novick P, Ferro S, Schekman R (1981) Order of events in the yeast secretory pathway. Cell 25:461-469.
Novotová M, Uhrίk B (1992) Structural characteristics and distribution of satellite cells along crayfish muscle fibers. Experientia 48:593-596.
O'Connor V, Heuss C, De Bello WM, Dresbach T, Charlton MP, Hunt JH, Pellegrini LL, Hodel A, Burger MM, Betz H, Augustine GJ, Schafer T (1997) Disruption of syntaxin-mediated protein interactions blocks neurotransmitter secretion. Proc Natl Acad Sci U S A 94:12186-12191.
Ono S, Baux G, Sekiguchi M, Fossier P, Morel NF, Nihonmatsu I, Hirata K, Awaji T, Takahashi S, Takahashi M (1998) Regulatory roles of complexins in neurotransmitter release from mature presynaptic nerve terminals. Eur J Neurosci 10:2143-2152.
Opazo F, Punge A, Buckers J, Hoopmann P, Kastrup L, Hell SW, Rizzoli SO (2010) Limited intermixing of synaptic vesicle components upon vesicle recycling. Traffic 11:800-812.
Orth PMR (2002) Short- and long-term phosphorylation dependent plasticity at synapses of a crayfish phasic axon. masters thesis, dept of physiology, university of toronto, canada. .
Ossig R, Schmitt HD, de Groot B, Riedel D, Keranen S, Ronne H, Grubmuller H, Jahn R (2000) Exocytosis requires asymmetry in the central layer of the SNARE complex. EMBO J 19:6000-6010.
Otto H, Hanson PI, Jahn R (1997) Assembly and disassembly of a ternary complex of synaptobrevin, syntaxin, and SNAP-25 in the membrane of synaptic vesicles. Proc Natl Acad Sci U S A 94:6197-6201.
Oyler GA, Higgins GA, Hart RA, Battenberg E, Billingsley M, Bloom FE, Wilson MC (1989) The identification of a novel synaptosomal-associated protein, SNAP-25, differentially expressed by neuronal subpopulations. J Cell Biol 109:3039-3052.
Pabst S, Margittai M, Vainius D, Langen R, Jahn R, Fasshauer D (2002) Rapid and selective binding to the synaptic SNARE complex suggests a modulatory role of complexins in neuroexocytosis. J Biol Chem 277:7838-7848.
Pabst S, Hazzard JW, Antonin W, Südhof TC, Jahn R, Rizo J, Fasshauer D (2000) Selective interaction of complexin with the neuronal SNARE complex. determination of the binding regions. J Biol Chem 275:19808-19818.
219
Pan B, Zucker RS (2009) A general model of synaptic transmission and short-term plasticity. Neuron 62:539-554.
Parlati F, Weber T, McNew JA, Westermann B, Söllner TH, Rothman JE (1999) Rapid and efficient fusion of phospholipid vesicles by the alpha-helical core of a SNARE complex in the absence of an N-terminal regulatory domain. Proc Natl Acad Sci U S A 96:12565-12570.
Parpura V, Mohideen U (2008) Molecular form follows function: (un)snaring the SNAREs. Trends Neurosci 31:435-443.
Parton RG, Ockleford CD, Critchley DR (1987) A study of the mechanism of internalisation of tetanus toxin by primary mouse spinal cord cultures. J Neurochem 49:1057-1068.
Pellegrini LL, O'Connor V, Betz H (1994) Fusion complex formation protects synaptobrevin against proteolysis by tetanus toxin light chain. FEBS Lett 353:319-323.
Pellegrini LL, O'Connor V, Lottspeich F, Betz H (1995) Clostridial neurotoxins compromise the stability of a low energy SNARE complex mediating NSF activation of synaptic vesicle fusion. EMBO J 14:4705-4713.
Pellizzari R, Rossetto O, Schiavo G, Montecucco C (1999) Tetanus and botulinum neurotoxins: Mechanism of action and therapeutic uses. Philos Trans R Soc Lond B Biol Sci 354:259-268.
Pellizzari R, Mason S, Shone CC, Montecucco C (1997) The interaction of synaptic vesicle-associated membrane protein/synaptobrevin with botulinum neurotoxins D and F. FEBS Lett 409:339-342.
Pellizzari R, Rossetto O, Lozzi L, Giovedi' S, Johnson E, Shone CC, Montecucco C (1996) Structural determinants of the specificity for synaptic vesicle-associated membrane protein/synaptobrevin of tetanus and botulinum type B and G neurotoxins. J Biol Chem 271:20353-20358.
Pennuto M, Bonanomi D, Benfenati F, Valtorta F (2003) Synaptophysin I controls the targeting of VAMP2/synaptobrevin II to synaptic vesicles. Mol Biol Cell 14:4909-4919.
Pobbati AV, Stein A, Fasshauer D (2006) N- to C-terminal SNARE complex assembly promotes rapid membrane fusion. Science 313:673-676.
Poirier MA, Xiao W, Macosko JC, Chan C, Shin YK, Bennett MK (1998) The synaptic SNARE complex is a parallel four-stranded helical bundle. Nat Struct Biol 5:765-769.
Quetglas S, Leveque C, Miquelis R, Sato K, Seagar M (2000) Ca2+-dependent regulation of synaptic SNARE complex assembly via a calmodulin- and phospholipid-binding domain of synaptobrevin. Proc Natl Acad Sci U S A 97:9695-9700.
Quigley PA, Msghina M, Govind CK, Atwood HL (1999) Visible evidence for differences in synaptic effectiveness with activity-dependent vesicular uptake and release of FM1-43. J Neurophysiol 81:356-370.
220
Rao SS, Stewart BA, Rivlin PK, Vilinsky I, Watson BO, Lang C, Boulianne G, Salpeter MM, Deitcher DL (2001) Two distinct effects on neurotransmission in a temperature-sensitive SNAP-25 mutant. EMBO J 20:6761-6771.
Reim K, Mansour M, Varoqueaux F, McMahon HT, Südhof TC, Brose N, Rosenmund C (2001) Complexins regulate a late step in Ca2+-dependent neurotransmitter release. Cell 104:71-81.
Rice LM, Brennwald P, Brunger AT (1997) Formation of a yeast SNARE complex is accompanied by significant structural changes. FEBS Lett 415:49-55.
Richards DA, Guatimosim C, Betz WJ (2000) Two endocytic recycling routes selectively fill two vesicle pools in frog motor nerve terminals. Neuron 27:551-559.
Richards DA, Guatimosim C, Rizzoli SO, Betz WJ (2003) Synaptic vesicle pools at the frog neuromuscular junction. Neuron 39:529-541.
Richmond JE, Broadie KS (2002) The synaptic vesicle cycle: Exocytosis and endocytosis in drosophila and C. elegans. Curr Opin Neurobiol 12:499-507.
Richmond JE, Weimer RM, Jorgensen EM (2001) An open form of syntaxin bypasses the requirement for UNC-13 in vesicle priming. Nature 412:338-341.
Rickman C, Medine CN, Dun AR, Moulton DJ, Mandula O, Halemani ND, Rizzoli SO, Chamberlain LH, Duncan RR (2010) t-SNARE protein conformations patterned by the lipid microenvironment. J Biol Chem 285:13535-13541.
Rizzoli SO, Jahn R (2007) Kiss-and-run, collapse and 'readily retrievable' vesicles. Traffic 8:1137-1144.
Rizzoli SO, Betz WJ (2004) The structural organization of the readily releasable pool of synaptic vesicles. Science 303:2037-2039.
Robitaille R, Adler EM, Charlton MP (1990) Strategic location of calcium channels at transmitter release sites of frog neuromuscular synapses. Neuron 5:773-779.
Rosenmund C, Stevens CF (1996) Definition of the readily releasable pool of vesicles at hippocampal synapses. Neuron 16:1197-1207.
Rossetto O, Gorza L, Schiavo G, Schiavo N, Scheller RH, Montecucco C (1996) VAMP/synaptobrevin isoforms 1 and 2 are widely and differentially expressed in nonneuronal tissues. J Cell Biol 132:167-179.
Rossetto O, Schiavo G, Montecucco C, Poulain B, Deloye F, Lozzi L, Shone CC (1994) SNARE motif and neurotoxins. Nature 372:415-416.
Rothman JE (1994) Mechanisms of intracellular protein transport. Nature 372:55-63.
221
Rummel A, Karnath T, Henke T, Bigalke H, Binz T (2004) Synaptotagmins I and II act as nerve cell receptors for botulinum neurotoxin G. J Biol Chem 279:30865-30870.
Rummel A, Hafner K, Mahrhold S, Darashchonak N, Holt M, Jahn R, Beermann S, Karnath T, Bigalke H, Binz T (2009) Botulinum neurotoxins C, E and F bind gangliosides via a conserved binding site prior to stimulation-dependent uptake with botulinum neurotoxin F utilising the three isoforms of SV2 as second receptor. J Neurochem 110:1942-1954.
Ryan TA, Smith SJ, Reuter H (1996) The timing of synaptic vesicle endocytosis. Proc Natl Acad Sci U S A 93:5567-5571.
Sakaba T, Stein A, Jahn R, Neher E (2005) Distinct kinetic changes in neurotransmitter release after SNARE protein cleavage. Science 309:491-494.
Sanyal S, Tolar LA, Pallanck L, Krishnan KS (2001) Genetic interaction between shibire and comatose mutations in drosophila suggest a role for snap-receptor complex assembly and disassembly for maintenance of synaptic vesicle cycling. Neurosci Lett 311:21-24.
Sara Y, Virmani T, Deák F, Liu X, Kavalali ET (2005) An isolated pool of vesicles recycles at rest and drives spontaneous neurotransmission. Neuron 45:563-573.
Scales SJ, Yoo BY, Scheller RH (2001) The ionic layer is required for efficient dissociation of the SNARE complex by alpha-SNAP and NSF. Proc Natl Acad Sci U S A 98:14262-14267.
Scales SJ, Hesser BA, Masuda ES, Scheller RH (2002) Amisyn, a novel syntaxin-binding protein that may regulate SNARE complex assembly. J Biol Chem 277:28271-28279.
Schiavo G, Benfenati F, Poulain B, Rossetto O, Polverino de Laureto P, DasGupta BR, Montecucco C (1992a) Tetanus and botulinum-B neurotoxins block neurotransmitter release by proteolytic cleavage of synaptobrevin. Nature 359:832-835.
Schiavo G, Matteoli M, Montecucco C (2000) Neurotoxins affecting neuroexocytosis. Physiol Rev 80:717-766.
Schiavo G, Poulain B, Rossetto O, Benfenati F, Tauc L, Montecucco C (1992b) Tetanus toxin is a zinc protein and its inhibition of neurotransmitter release and protease activity depend on zinc. EMBO J 11:3577-3583.
Schiavo G, Rossetto O, Santucci A, DasGupta BR, Montecucco C (1992c) Botulinum neurotoxins are zinc proteins. J Biol Chem 267:23479-23483.
Schiavo G, Shone CC, Bennett MK, Scheller RH, Montecucco C (1995) Botulinum neurotoxin type C cleaves a single lys-ala bond within the carboxyl-terminal region of syntaxins. J Biol Chem 270:10566-10570.
Schiavo G, Stenbeck G, Rothman JE, Söllner TH (1997) Binding of the synaptic vesicle v-SNARE, synaptotagmin, to the plasma membrane t-SNARE, SNAP-25, can explain docked vesicles at neurotoxin-treated synapses. Proc Natl Acad Sci U S A 94:997-1001.
222
Schikorski T, Stevens CF (2001) Morphological correlates of functionally defined synaptic vesicle populations. Nat Neurosci 4:391-395.
Schikorski T, Stevens CF (1997) Quantitative ultrastructural analysis of hippocampal excitatory synapses. J Neurosci 17:5858-5867.
Schmid MF, Robinson JP, DasGupta BR (1993) Direct visualization of botulinum neurotoxin-induced channels in phospholipid vesicles. Nature 364:827-830.
Schmidt JJ, Stafford RG (2005) Botulinum neurotoxin serotype F: Identification of substrate recognition requirements and development of inhibitors with low nanomolar affinity. Biochemistry 44:4067-4073.
Schneggenburger R, Neher E (2000) Intracellular calcium dependence of transmitter release rates at a fast central synapse. Nature 406:889-893.
Schuette CG, Hatsuzawa K, Margittai M, Stein A, Riedel D, Kuster P, Konig M, Seidel C, Jahn R (2004) Determinants of liposome fusion mediated by synaptic SNARE proteins. Proc Natl Acad Sci U S A 101:2858-2863.
Schwartz ML, Merz AJ (2009) Capture and release of partially zipped trans-SNARE complexes on intact organelles. J Cell Biol 185:535-549.
Searl TJ, Silinsky EM (2005) Modulation of ca(2+)-dependent and ca(2+)-independent miniature endplate potentials by phorbol ester and adenosine in frog. Br J Pharmacol 145:954-962.
Seiler F, Malsam J, Krause JM, Söllner TH (2009) A role of complexin-lipid interactions in membrane fusion. FEBS Lett 583:2343-2348.
Sharma M, Burre J, Südhof TC (2011) CSPalpha promotes SNARE-complex assembly by chaperoning SNAP-25 during synaptic activity. Nat Cell Biol 13:30-39.
Shata A, Saisu H, Odani S, Abe T (2007) Phosphorylated synaphin/complexin found in the brain exhibits enhanced SNARE complex binding. Biochem Biophys Res Commun 354:808-813.
Shen J, Tareste DC, Paumet F, Rothman JE, Melia TJ (2007) Selective activation of cognate SNAREpins by Sec1/Munc18 proteins. Cell 128:183-195.
Shone CC, Roberts AK (1994) Peptide substrate specificity and properties of the zinc-endopeptidase activity of botulinum type B neurotoxin. Eur J Biochem 225:263-270.
Siegel DP, Kozlov MM (2004) The gaussian curvature elastic modulus of N-monomethylated dioleoylphosphatidylethanolamine: Relevance to membrane fusion and lipid phase behavior. Biophys J 87:366-374.
Sikorra S, Henke T, Galli T, Binz T (2008) Substrate recognition mechanism of VAMP/synaptobrevin-cleaving clostridial neurotoxins. J Biol Chem 283:21145-21152.
223
Sikorra S, Henke T, Swaminathan S, Galli T, Binz T (2006) Identification of the amino acid residues rendering TI-VAMP insensitive toward botulinum neurotoxin B. J Mol Biol 357:574-582.
Silverman-Gavrila LB, Orth PM, Charlton MP (2005) Phosphorylation-dependent low-frequency depression at phasic synapses of a crayfish motoneuron. J Neurosci 25:3168-3180.
Simpson LL (1983) Ammonium chloride and methylamine hydrochloride antagonize clostridial neurotoxins. J Pharmacol Exp Ther 225:546-552.
Simpson LL, Coffield JA, Bakry N (1994) Inhibition of vacuolar adenosine triphosphatase antagonizes the effects of clostridial neurotoxins but not phospholipase A2 neurotoxins. J Pharmacol Exp Ther 269:256-262.
Smith EA, Weisshaar JC (2011) Docking, not fusion, as the rate-limiting step in a SNARE-driven vesicle fusion assay. Biophys J 100:2141-2150.
Söhl G, Maxeiner S, Willecke K (2005) Expression and functions of neuronal gap junctions. Nat Rev Neurosci 6:191-200.
Söllner T, Rothman JE (1994) Neurotransmission: Harnessing fusion machinery at the synapse. Trends Neurosci 17:344-348.
Söllner T, Bennett MK, Whiteheart SW, Scheller RH, Rothman JE (1993a) A protein assembly-disassembly pathway in vitro that may correspond to sequential steps of synaptic vesicle docking, activation, and fusion. Cell 75:409-418.
Söllner T, Whiteheart SW, Brunner M, Erdjument-Bromage H, Geromanos S, Tempst P, Rothman JE (1993b) SNAP receptors implicated in vesicle targeting and fusion. Nature 362:318-324.
Sørensen JB, Wiederhold K, Muller EM, Milosevic I, Nagy G, de Groot BL, Grubmuller H, Fasshauer D (2006) Sequential N- to C-terminal SNARE complex assembly drives priming and fusion of secretory vesicles. EMBO J 25:955-966.
Stewart BA, Mohtashami M, Trimble WS, Boulianne GL (2000) SNARE proteins contribute to calcium cooperativity of synaptic transmission. Proc Natl Acad Sci U S A 97:13955-13960.
Strenzke N, Chanda S, Kopp-Scheinpflug C, Khimich D, Reim K, Bulankina AV, Neef A, Wolf F, Brose N, Xu-Friedman MA, Moser T (2009) Complexin-I is required for high-fidelity transmission at the endbulb of held auditory synapse. J Neurosci 29:7991-8004.
Su Z, Ishitsuka Y, Ha T, Shin YK (2008) The SNARE complex from yeast is partially unstructured on the membrane. Structure 16:1138-1146.
Südhof TC (2004) The synaptic vesicle cycle. Annu Rev Neurosci 27:509-547.
224
Südhof TC, Baumert M, Perin MS, Jahn R (1989) A synaptic vesicle membrane protein is conserved from mammals to drosophila. Neuron 2:1475-1481.
Sun JY, Wu XS, Wu LG (2002) Single and multiple vesicle fusion induce different rates of endocytosis at a central synapse. Nature 417:555-559.
Sutton RB, Fasshauer D, Jahn R, Brunger AT (1998) Crystal structure of a SNARE complex involved in synaptic exocytosis at 2.4 A resolution. Nature 395:347-353.
Tagaya M, Wilson DW, Brunner M, Arango N, Rothman JE (1993) Domain structure of an N-ethylmaleimide-sensitive fusion protein involved in vesicular transport. J Biol Chem 268:2662-2666.
Takamori S, Holt M, Stenius K, Lemke EA, Gronborg M, Riedel D, Urlaub H, Schenck S, Brugger B, Ringler P, Muller SA, Rammner B, Grater F, Hub JS, De Groot BL, Mieskes G, Moriyama Y, Klingauf J, Grubmuller H, Heuser J, Wieland F, Jahn R (2006) Molecular anatomy of a trafficking organelle. Cell 127:831-846.
Tang J, Maximov A, Shin OH, Dai H, Rizo J, Südhof TC (2006) A complexin/synaptotagmin 1 switch controls fast synaptic vesicle exocytosis. Cell 126:1175-1187.
Taubenblatt P, Dedieu JC, Gulik-Krzywicki T, Morel N (1999) VAMP (synaptobrevin) is present in the plasma membrane of nerve terminals. J Cell Sci 112 ( Pt 20):3559-3567.
Tokumaru H, Shimizu-Okabe C, Abe T (2008) Direct interaction of SNARE complex binding protein synaphin/complexin with calcium sensor synaptotagmin 1. Brain Cell Biol 36:173-189.
Tokumaru H, Umayahara K, Pellegrini LL, Ishizuka T, Saisu H, Betz H, Augustine GJ, Abe T (2001) SNARE complex oligomerization by synaphin/complexin is essential for synaptic vesicle exocytosis. Cell 104:421-432.
Tolar LA, Pallanck L (1998) NSF function in neurotransmitter release involves rearrangement of the SNARE complex downstream of synaptic vesicle docking. J Neurosci 18:10250-10256.
Tonello F, Schiavo G, Montecucco C (1997) Metal substitution of tetanus neurotoxin. Biochem J 322 ( Pt 2):507-510.
Tonello F, Morante S, Rossetto O, Schiavo G, Montecucco C (1996) Tetanus and botulism neurotoxins: A novel group of zinc-endopeptidases. Adv Exp Med Biol 389:251-260.
Trimble WS (1993) Analysis of the structure and expression of the VAMP family of synaptic vesicle proteins. J Physiol Paris 87:107-115.
Trimble WS, Cowan DM, Scheller RH (1988) VAMP-1: A synaptic vesicle-associated integral membrane protein. Proc Natl Acad Sci U S A 85:4538-4542.
Turton K, Chaddock JA, Acharya KR (2002) Botulinum and tetanus neurotoxins: Structure, function and therapeutic utility. Trends Biochem Sci 27:552-558.
225
Ubach J, Zhang X, Shao X, Südhof TC, Rizo J (1998) Ca2+ binding to synaptotagmin: How many Ca2+ ions bind to the tip of a C2-domain? EMBO J 17:3921-3930.
Ungermann C, Sato K, Wickner W (1998) Defining the functions of trans-SNARE pairs. Nature 396:543-548.
Urdan TC (2010) Statistics in Plain English. New York, NY: Routledge.
Vaidyanathan VV, Yoshino K, Jahnz M, Dorries C, Bade S, Nauenburg S, Niemann H, Binz T (1999) Proteolysis of SNAP-25 isoforms by botulinum neurotoxin types A, C, and E: Domains and amino acid residues controlling the formation of enzyme-substrate complexes and cleavage. J Neurochem 72:327-337.
van den Bogaart G, Holt MG, Bunt G, Riedel D, Wouters FS, Jahn R (2010) One SNARE complex is sufficient for membrane fusion. Nat Struct Mol Biol 17:358-364.
Van Harreveld A (1936) A physiological solution for freshwater crustaceans. Proc Soc Exp Biol Med 34:428-432.
Varoqueaux F, Sigler A, Rhee JS, Brose N, Enk C, Reim K, Rosenmund C (2002) Total arrest of spontaneous and evoked synaptic transmission but normal synaptogenesis in the absence of Munc13-mediated vesicle priming. Proc Natl Acad Sci U S A 99:9037-9042.
Verderio C, Coco S, Bacci A, Rossetto O, De Camilli P, Montecucco C, Matteoli M (1999) Tetanus toxin blocks the exocytosis of synaptic vesicles clustered at synapses but not of synaptic vesicles in isolated axons. J Neurosci 19:6723-6732.
Verstreken P, Kjaerulff O, Lloyd TE, Atkinson R, Zhou Y, Meinertzhagen IA, Bellen HJ (2002) Endophilin mutations block clathrin-mediated endocytosis but not neurotransmitter release. Cell 109:101-112.
Vites O, Florin EL, Jahn R (2008) Docking of liposomes to planar surfaces mediated by trans-SNARE complexes. Biophys J 95:1295-1302.
Vogel K, Roche PA (1999) SNAP-23 and SNAP-25 are palmitoylated in vivo. Biochem Biophys Res Commun 258:407-410.
Vrljic M, Strop P, Ernst JA, Sutton RB, Chu S, Brunger AT (2010) Molecular mechanism of the synaptotagmin-SNARE interaction in Ca2+-triggered vesicle fusion. Nat Struct Mol Biol 17:325-331.
Walch-Solimena C, Blasi J, Edelmann L, Chapman ER, von Mollard GF, Jahn R (1995) The t-SNAREs syntaxin 1 and SNAP-25 are present on organelles that participate in synaptic vesicle recycling. J Cell Biol 128:637-645.
Washbourne P, Pellizzari R, Baldini G, Wilson MC, Montecucco C (1997) Botulinum neurotoxin types A and E require the SNARE motif in SNAP-25 for proteolysis. FEBS Lett 418:1-5.
226
Washbourne P, Bortoletto N, Graham ME, Wilson MC, Burgoyne RD, Montecucco C (1999) Botulinum neurotoxin E-insensitive mutants of SNAP-25 fail to bind VAMP but support exocytosis. J Neurochem 73:2424-2433.
Weimbs T, Low SH, Chapin SJ, Mostov KE, Bucher P, Hofmann K (1997) A conserved domain is present in different families of vesicular fusion proteins: A new superfamily. Proc Natl Acad Sci U S A 94:3046-3051.
Weimer RM, Richmond JE, Davis WS, Hadwiger G, Nonet ML, Jorgensen EM (2003) Defects in synaptic vesicle docking in unc-18 mutants. Nat Neurosci 6:1023-1030.
Weller U, Dauzenroth ME, Meyer zu Heringdorf D, Habermann E (1989) Chains and fragments of tetanus toxin. separation, reassociation and pharmacological properties. Eur J Biochem 182:649-656.
Weninger K, Bowen ME, Choi UB, Chu S, Brunger AT (2008) Accessory proteins stabilize the acceptor complex for synaptobrevin, the 1:1 syntaxin/SNAP-25 complex. Structure 16:308-320.
Weninger KR (2011) Complexin arrests a neighbor. Nat Struct Mol Biol 18:861-863.
Whiteheart SW, Brunner M, Wilson DW, Wiedmann M, Rothman JE (1992) Soluble N-ethylmaleimide-sensitive fusion attachment proteins (SNAPs) bind to a multi-SNAP receptor complex in golgi membranes. J Biol Chem 267:12239-12243.
Wiederhold K, Fasshauer D (2009) Is assembly of the SNARE complex enough to fuel membrane fusion? J Biol Chem 284:13143-13152.
Williamson LC, Neale EA (1994) Bafilomycin A1 inhibits the action of tetanus toxin in spinal cord neurons in cell culture. J Neurochem 63:2342-2345.
Wilson DW, Whiteheart SW, Wiedmann M, Brunner M, Rothman JE (1992) A multisubunit particle implicated in membrane fusion. J Cell Biol 117:531-538.
Wilson DW, Wilcox CA, Flynn GC, Chen E, Kuang WJ, Henzel WJ, Block MR, Ullrich A, Rothman JE (1989) A fusion protein required for vesicle-mediated transport in both mammalian cells and yeast. Nature 339:355-359.
Wojtowicz JM, Atwood HL (1988) Presynaptic long-term facilitation at the crayfish neuromuscular junction: Voltage-dependent and ion-dependent phases. J Neurosci 8:4667-4674.
Wojtowicz JM, Smith BR, Atwood HL (1991) Activity-dependent recruitment of silent synapses. Ann N Y Acad Sci 627:169-179.
Wright JF, Pernollet M, Reboul A, Aude C, Colomb MG (1992) Identification and partial characterization of a low affinity metal-binding site in the light chain of tetanus toxin. J Biol Chem 267:9053-9058.
227
Wu MN, Fergestad T, Lloyd TE, He Y, Broadie K, Bellen HJ (1999) Syntaxin 1A interacts with multiple exocytic proteins to regulate neurotransmitter release in vivo. Neuron 23:593-605.
Wu W, Xu J, Wu XS, Wu LG (2005) Activity-dependent acceleration of endocytosis at a central synapse. J Neurosci 25:11676-11683.
Wyatt RM, Balice-Gordon RJ (2008) Heterogeneity in synaptic vesicle release at neuromuscular synapses of mice expressing synaptopHluorin. J Neurosci 28:325-335.
Xu J, Pang ZP, Shin OH, Südhof TC (2009) Synaptotagmin-1 functions as a Ca2+ sensor for spontaneous release. Nat Neurosci 12:759-766.
Xu T, Binz T, Niemann H, Neher E (1998) Multiple kinetic components of exocytosis distinguished by neurotoxin sensitivity. Nat Neurosci 1:192-200.
Xu T, Rammner B, Margittai M, Artalejo AR, Neher E, Jahn R (1999) Inhibition of SNARE complex assembly differentially affects kinetic components of exocytosis. Cell 99:713-722.
Xu Y, Zhang F, Su Z, McNew JA, Shin YK (2005) Hemifusion in SNARE-mediated membrane fusion. Nat Struct Mol Biol 12:417-422.
Xue M, Craig TK, Xu J, Chao HT, Rizo J, Rosenmund C (2010) Binding of the complexin N terminus to the SNARE complex potentiates synaptic-vesicle fusogenicity. Nat Struct Mol Biol 17:568-575.
Xue M, Lin YQ, Pan H, Reim K, Deng H, Bellen HJ, Rosenmund C (2009) Tilting the balance between facilitatory and inhibitory functions of mammalian and drosophila complexins orchestrates synaptic vesicle exocytosis. Neuron 64:367-380.
Xue M, Stradomska A, Chen H, Brose N, Zhang W, Rosenmund C, Reim K (2008) Complexins facilitate neurotransmitter release at excitatory and inhibitory synapses in mammalian central nervous system. Proc Natl Acad Sci U S A 105:7875-7880.
Xue M, Reim K, Chen X, Chao HT, Deng H, Rizo J, Brose N, Rosenmund C (2007) Distinct domains of complexin I differentially regulate neurotransmitter release. Nat Struct Mol Biol 14:949-958.
Xu-Friedman MA, Regehr WG (2004) Structural contributions to short-term synaptic plasticity. Physiol Rev 84:69-85.
Yamasaki S, Baumeister A, Binz T, Blasi J, Link E, Cornille F, Roques B, Fykse EM, Südhof TC, Jahn R (1994) Cleavage of members of the synaptobrevin/VAMP family by types D and F botulinal neurotoxins and tetanus toxin. J Biol Chem 269:12764-12772.
Yamashita T, Hige T, Takahashi T (2005) Vesicle endocytosis requires dynamin-dependent GTP hydrolysis at a fast CNS synapse. Science 307:124-127.
228
Yang B, Steegmaier M, Gonzalez LC,Jr, Scheller RH (2000) nSec1 binds a closed conformation of syntaxin1A. J Cell Biol 148:247-252.
Yang X, Kaeser-Woo YJ, Pang ZP, Xu W, Südhof TC (2010) Complexin clamps asynchronous release by blocking a secondary ca(2+) sensor via its accessory alpha helix. Neuron 68:907-920.
Yersin A, Hirling H, Steiner P, Magnin S, Regazzi R, Huni B, Huguenot P, De los Rios P, Dietler G, Catsicas S, Kasas S (2003) Interactions between synaptic vesicle fusion proteins explored by atomic force microscopy. Proc Natl Acad Sci U S A 100:8736-8741.
Yoon TY, Okumus B, Zhang F, Shin YK, Ha T (2006) Multiple intermediates in SNARE-induced membrane fusion. Proc Natl Acad Sci U S A 103:19731-19736.
Yoon TY, Lu X, Diao J, Lee SM, Ha T, Shin YK (2008) Complexin and Ca2+ stimulate SNARE-mediated membrane fusion. Nat Struct Mol Biol 15:707-713.
Young SM,Jr (2005) Proteolysis of SNARE proteins alters facilitation and depression in a specific way. Proc Natl Acad Sci U S A 102:2614-2619.
Young SM,Jr, Neher E (2009) Synaptotagmin has an essential function in synaptic vesicle positioning for synchronous release in addition to its role as a calcium sensor. Neuron 63:482-496.
Zhang Y, Su Z, Zhang F, Chen Y, Shin YK (2005) A partially zipped SNARE complex stabilized by the membrane. J Biol Chem 280:15595-15600.
Zimmerberg J, Curran M, Cohen FS, Brodwick M (1987) Simultaneous electrical and optical measurements show that membrane fusion precedes secretory granule swelling during exocytosis of beige mouse mast cells. Proc Natl Acad Sci U S A 84:1585-1589.
Zucker RS (1974) Characteristics of crayfish neuromuscular facilitation and their calcium dependence. J Physiol 241:91-110.
Zucker RS (1973) Changes in the statistics of transmitter release during facilitation. J Physiol 229:787-810.
229
Appendix 1: Stimulation-independent depression of the crayfish phasic evoked response
The phasic evoked response (EPSP amplitude) of the walking leg extensor muscle
declines over time in a stimulation-independent manner. The response declines to 20-40% of the
initial EPSP amplitude after 4hrs has elapsed. This can be seen in the controls of the neurotoxin
experiments under the low stimulation paradigm (Chapter 3.2.3), and an example of the decline
over time is presented in Figure A1. The rate of depression over time is approximately the same
between proximal and distal surface muscle fibres (see Figure A1). Many attempts were tried to
alleviate the phasic depression but all were unsuccessful (see below). The use of okadaic acid
(serine/threonine phosphatase inhibitor) or FK506 (calcineurin phosphatase inhibitor) recovered
the depressed phasic response and even facilitated it beyond baseline but the response eventually
depressed again (Figure A2). This indicated that the depression may be the result of an increase
in phosphatase activity over time in the phasic axon. This depression is not observed for the tonic
response and could be that the tonic axon initially has a high level of phosphatase activity. The
presence of the phasic depression in experiments complicated analyses since the true effect of
any substance injected into the phasic axon was partially masked by this depression. The
presence of this depression was previously observed by Dr. Shao-Ying Hua (postdoc in Dr.
Charlton’s lab; unpublished data), which indicated that the phenomenon was a feature of the
dissected preparation itself and not necessarily a procedural problem.
Methods which were unsuccessful in suppressing phasic depression over a long period of time:
Changes to saline pH (7.6, 8.0); normally pH=7.4. Use of crayfish hemolymph, or a 1:1 mixture of saline and hemolymph, or a modified
neural basal medium. Perfusion and/or oxygenation of saline. Use of the nitric oxide scavenger carboxy-PTIO or the NOS inhibitor L-NAME. Addition of serotonin to saline - the response initially increased but then quickly declined
over time. Staurosporine (broad kinase inhibitor) - slight reduction in the rate of decline. Metabotropic glutamate receptor antagonist - 10µM of LY341495. Phospho-L-arginine (source of high-energy phosphate to convert ADPATP) – 20mM,
83mM, and 100mM. Okadaic acid (serine/threonine phosphatase inhibitor) or FK506 (calcineurin phosphatase
inhibitor). See Figure A2.
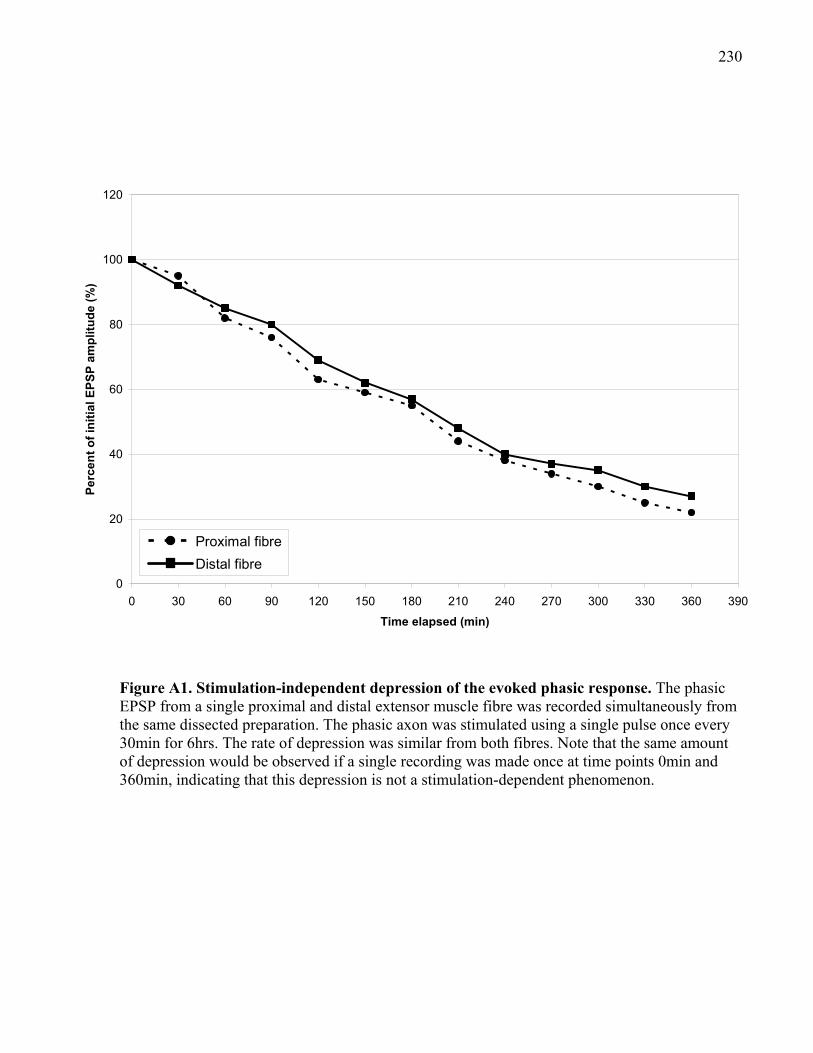
230
Figure A1. Stimulation-independent depression of the evoked phasic response. The phasic EPSP from a single proximal and distal extensor muscle fibre was recorded simultaneously from the same dissected preparation. The phasic axon was stimulated using a single pulse once every 30min for 6hrs. The rate of depression was similar from both fibres. Note that the same amount of depression would be observed if a single recording was made once at time points 0min and 360min, indicating that this depression is not a stimulation-dependent phenomenon.
0
20
40
60
80
100
120
0 30 60 90 120 150 180 210 240 270 300 330 360 390
Time elapsed (min)
Per
cen
t o
f in
itia
l E
PS
P a
mp
litu
de
(%)
Proximal fibre
Distal fibre
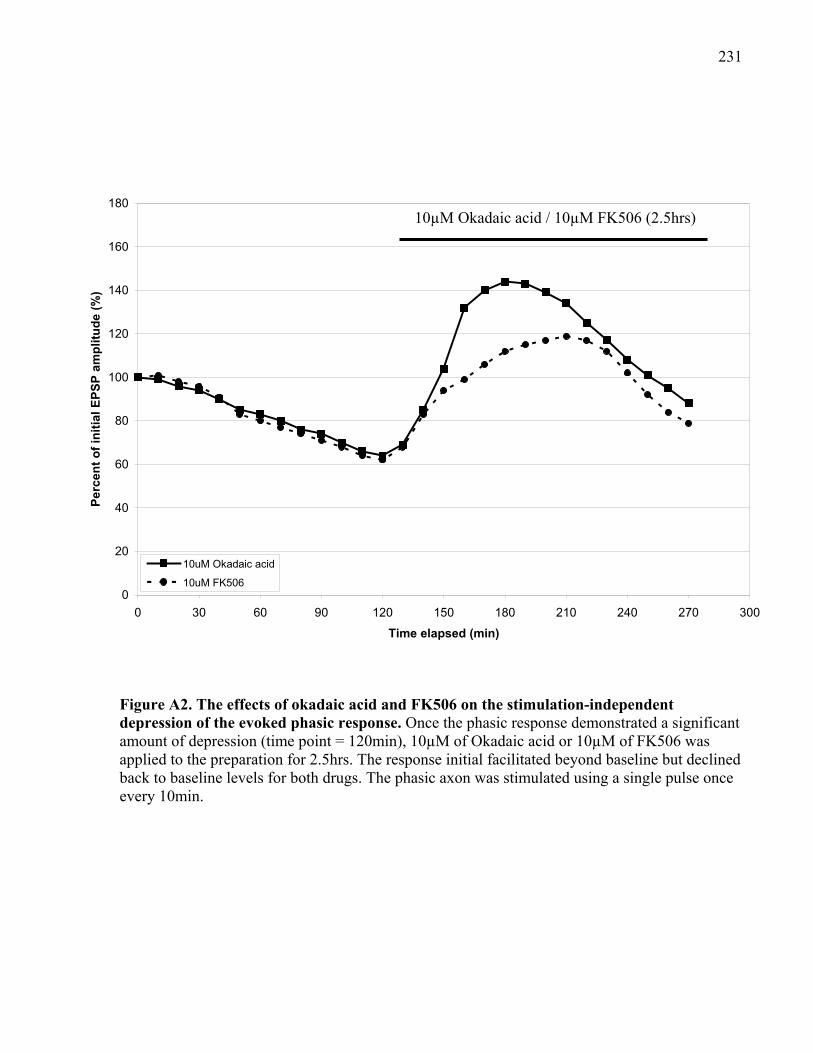
231
10uM Okadaic acid
10uM FK506
Figure A2. The effects of okadaic acid and FK506 on the stimulation-independent depression of the evoked phasic response. Once the phasic response demonstrated a significant amount of depression (time point = 120min), 10µM of Okadaic acid or 10µM of FK506 was applied to the preparation for 2.5hrs. The response initial facilitated beyond baseline but declined back to baseline levels for both drugs. The phasic axon was stimulated using a single pulse once every 10min.
0
20
40
60
80
100
120
140
160
180
0 30 60 90 120 150 180 210 240 270 300
Time elapsed (min)
Pe
rcen
t o
f in
itia
l E
PS
P a
mp
litu
de
(%
)
10µM Okadaic acid / 10µM FK506 (2.5hrs)
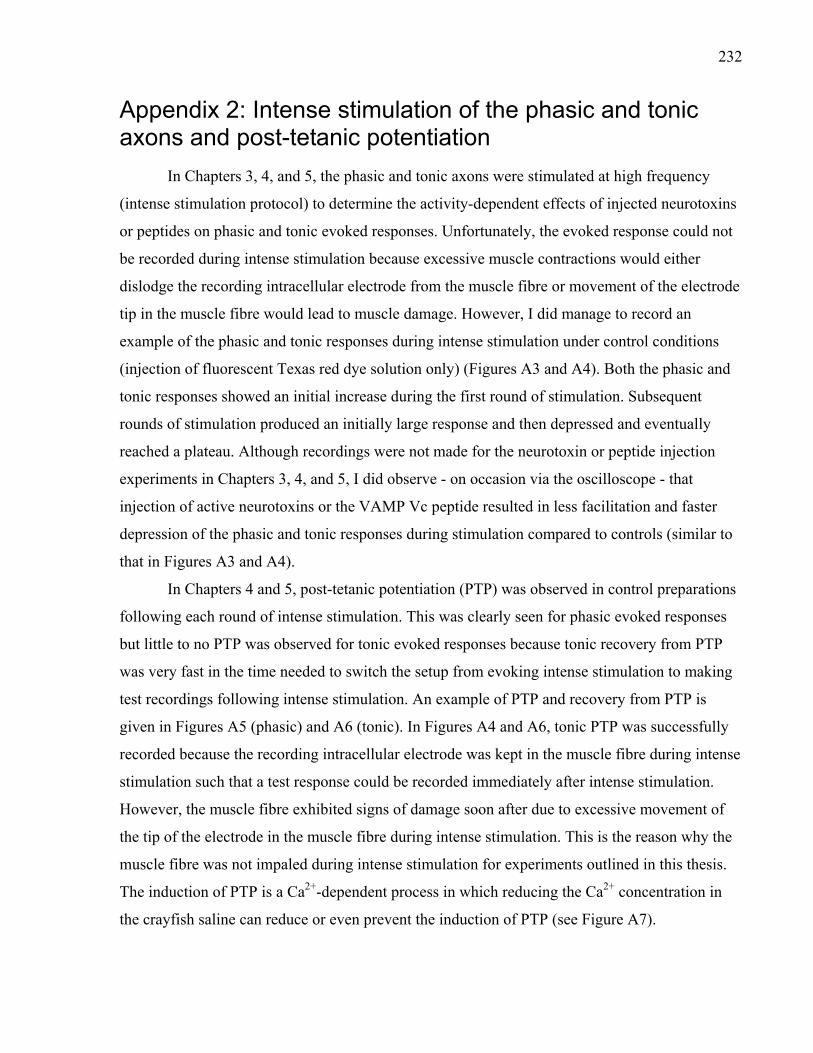
232
Appendix 2: Intense stimulation of the phasic and tonic axons and post-tetanic potentiation
In Chapters 3, 4, and 5, the phasic and tonic axons were stimulated at high frequency
(intense stimulation protocol) to determine the activity-dependent effects of injected neurotoxins
or peptides on phasic and tonic evoked responses. Unfortunately, the evoked response could not
be recorded during intense stimulation because excessive muscle contractions would either
dislodge the recording intracellular electrode from the muscle fibre or movement of the electrode
tip in the muscle fibre would lead to muscle damage. However, I did manage to record an
example of the phasic and tonic responses during intense stimulation under control conditions
(injection of fluorescent Texas red dye solution only) (Figures A3 and A4). Both the phasic and
tonic responses showed an initial increase during the first round of stimulation. Subsequent
rounds of stimulation produced an initially large response and then depressed and eventually
reached a plateau. Although recordings were not made for the neurotoxin or peptide injection
experiments in Chapters 3, 4, and 5, I did observe - on occasion via the oscilloscope - that
injection of active neurotoxins or the VAMP Vc peptide resulted in less facilitation and faster
depression of the phasic and tonic responses during stimulation compared to controls (similar to
that in Figures A3 and A4).
In Chapters 4 and 5, post-tetanic potentiation (PTP) was observed in control preparations
following each round of intense stimulation. This was clearly seen for phasic evoked responses
but little to no PTP was observed for tonic evoked responses because tonic recovery from PTP
was very fast in the time needed to switch the setup from evoking intense stimulation to making
test recordings following intense stimulation. An example of PTP and recovery from PTP is
given in Figures A5 (phasic) and A6 (tonic). In Figures A4 and A6, tonic PTP was successfully
recorded because the recording intracellular electrode was kept in the muscle fibre during intense
stimulation such that a test response could be recorded immediately after intense stimulation.
However, the muscle fibre exhibited signs of damage soon after due to excessive movement of
the tip of the electrode in the muscle fibre during intense stimulation. This is the reason why the
muscle fibre was not impaled during intense stimulation for experiments outlined in this thesis.
The induction of PTP is a Ca2+-dependent process in which reducing the Ca2+ concentration in
the crayfish saline can reduce or even prevent the induction of PTP (see Figure A7).
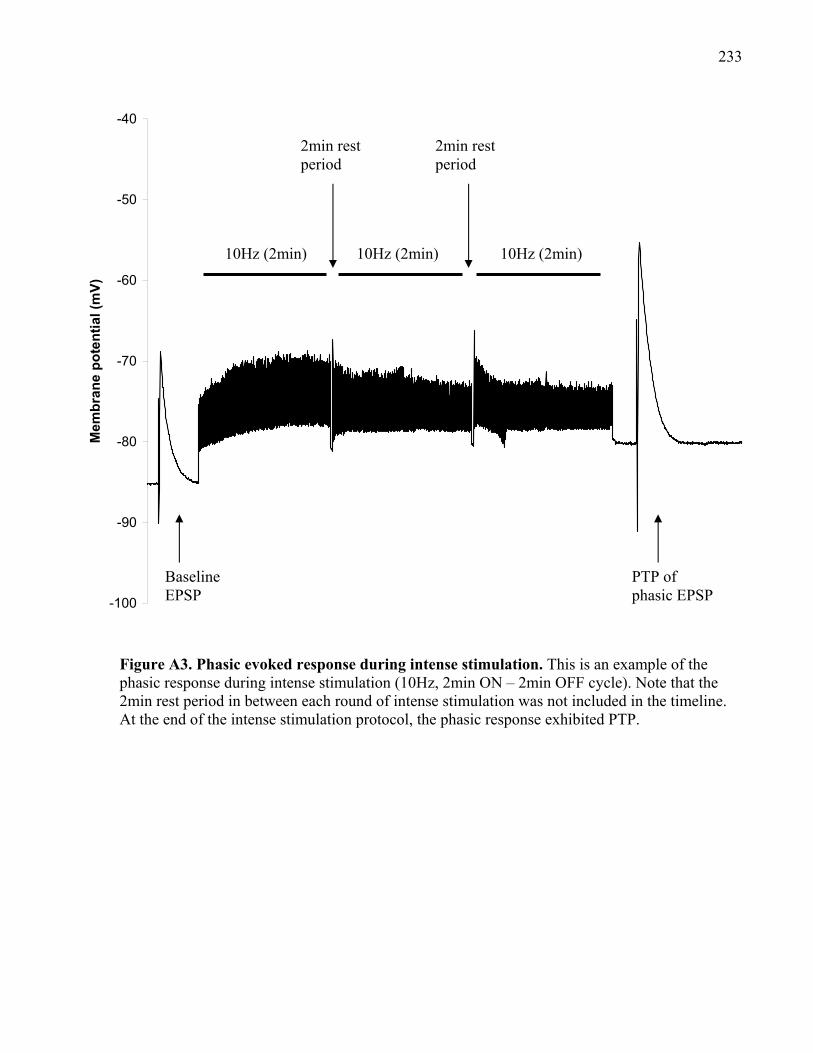
233
Figure A3. Phasic evoked response during intense stimulation. This is an example of the phasic response during intense stimulation (10Hz, 2min ON – 2min OFF cycle). Note that the 2min rest period in between each round of intense stimulation was not included in the timeline. At the end of the intense stimulation protocol, the phasic response exhibited PTP.
-100
-90
-80
-70
-60
-50
-40
Mem
bra
ne
po
ten
tial
(m
V)
10Hz (2min) 10Hz (2min) 10Hz (2min)
2min rest period
2min rest period
Baseline EPSP
PTP of phasic EPSP
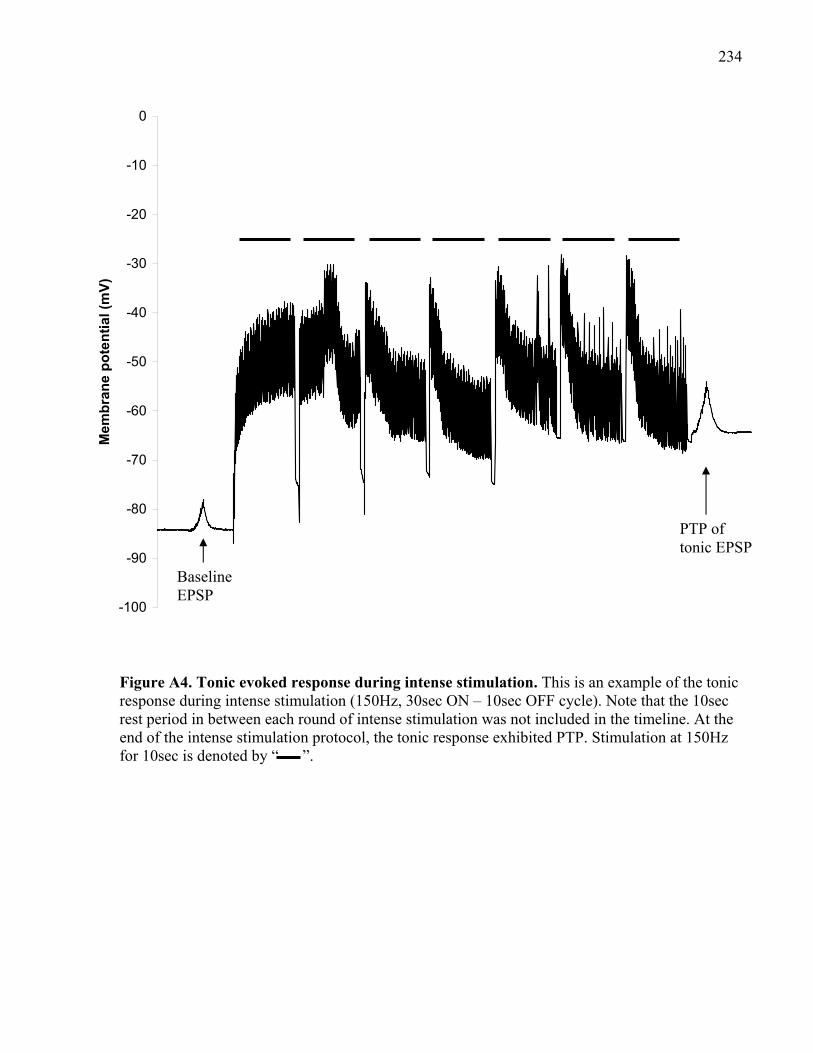
234
Figure A4. Tonic evoked response during intense stimulation. This is an example of the tonic response during intense stimulation (150Hz, 30sec ON – 10sec OFF cycle). Note that the 10sec rest period in between each round of intense stimulation was not included in the timeline. At the end of the intense stimulation protocol, the tonic response exhibited PTP. Stimulation at 150Hz for 10sec is denoted by “ ”.
-100
-90
-80
-70
-60
-50
-40
-30
-20
-10
0M
em
bra
ne
po
ten
tia
l (m
V)
Baseline EPSP
PTP of tonic EPSP
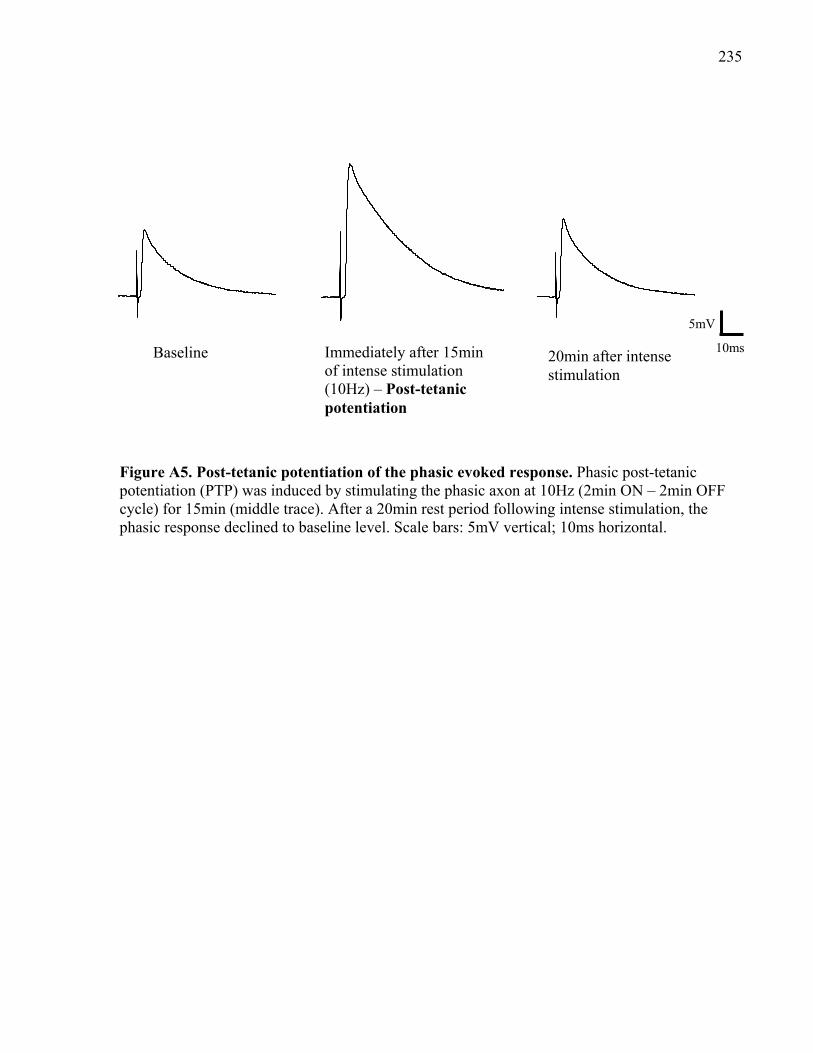
235
Figure A5. Post-tetanic potentiation of the phasic evoked response. Phasic post-tetanic potentiation (PTP) was induced by stimulating the phasic axon at 10Hz (2min ON – 2min OFF cycle) for 15min (middle trace). After a 20min rest period following intense stimulation, the phasic response declined to baseline level. Scale bars: 5mV vertical; 10ms horizontal.
Baseline Immediately after 15min of intense stimulation (10Hz) – Post-tetanic potentiation
20min after intense stimulation
5mV
10ms
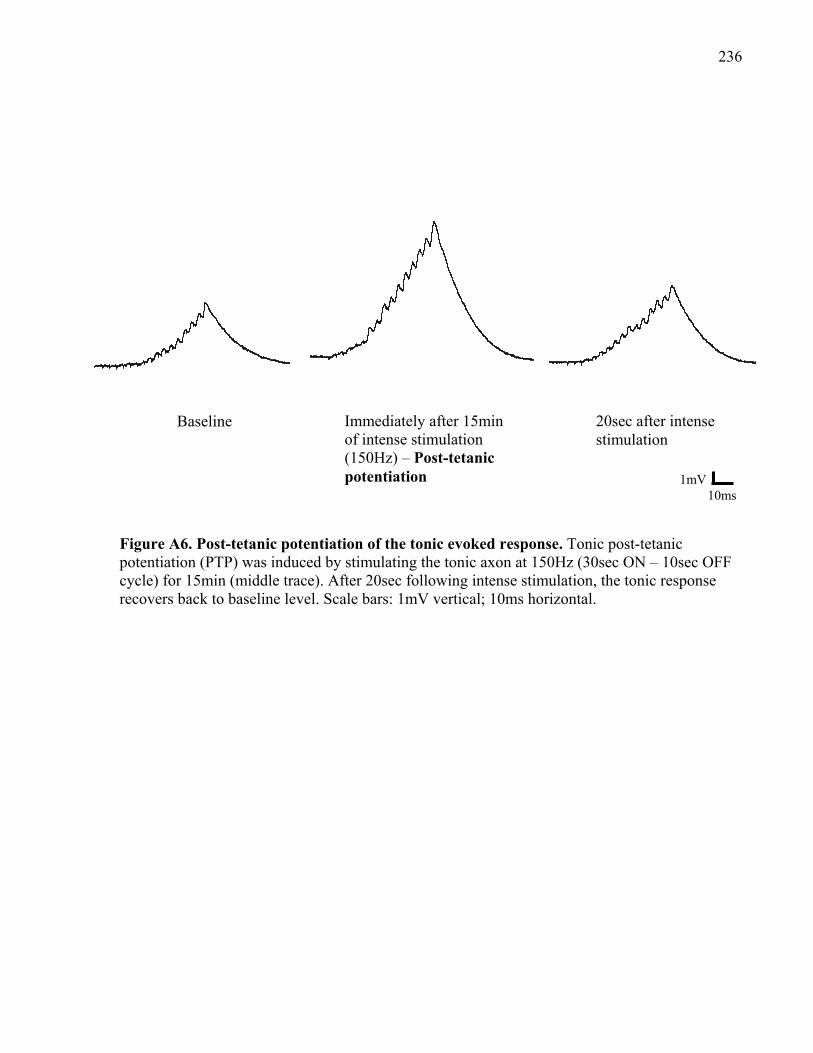
236
Figure A6. Post-tetanic potentiation of the tonic evoked response. Tonic post-tetanic potentiation (PTP) was induced by stimulating the tonic axon at 150Hz (30sec ON – 10sec OFF cycle) for 15min (middle trace). After 20sec following intense stimulation, the tonic response recovers back to baseline level. Scale bars: 1mV vertical; 10ms horizontal.
Baseline Immediately after 15min of intense stimulation (150Hz) – Post-tetanic potentiation
20sec after intense stimulation
1mV 10ms
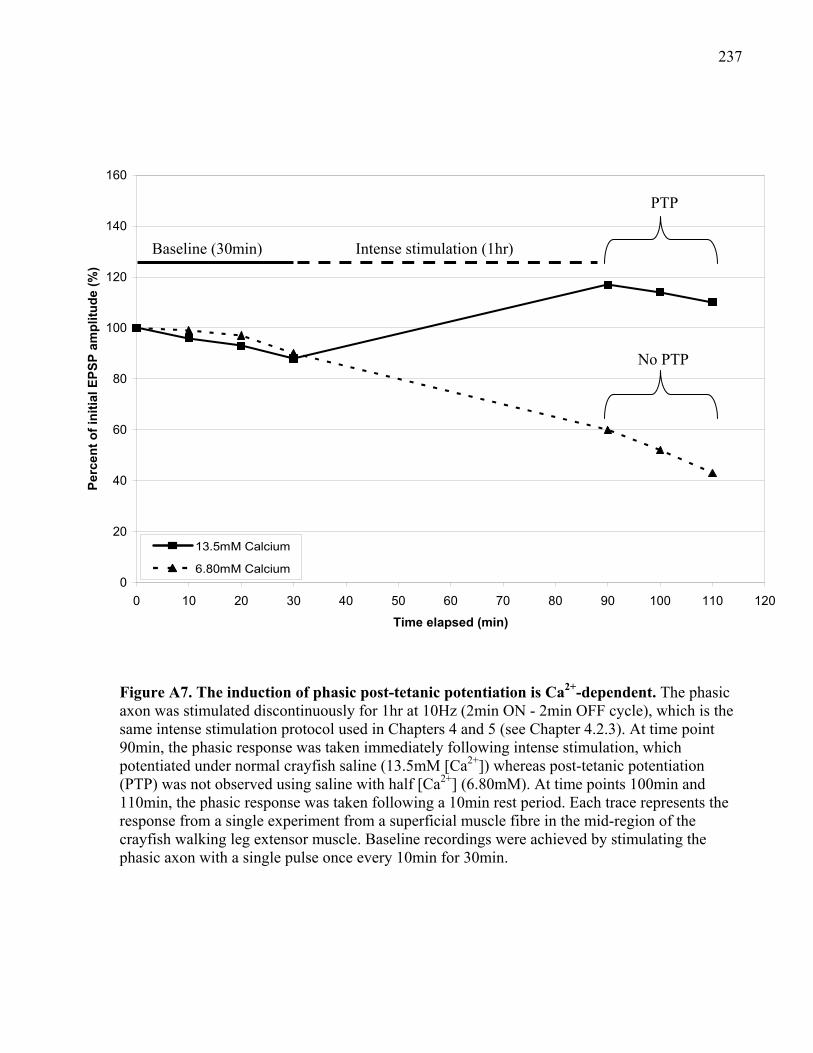
237
Figure A7. The induction of phasic post-tetanic potentiation is Ca2+-dependent. The phasic axon was stimulated discontinuously for 1hr at 10Hz (2min ON - 2min OFF cycle), which is the same intense stimulation protocol used in Chapters 4 and 5 (see Chapter 4.2.3). At time point 90min, the phasic response was taken immediately following intense stimulation, which potentiated under normal crayfish saline (13.5mM [Ca2+]) whereas post-tetanic potentiation (PTP) was not observed using saline with half [Ca2+] (6.80mM). At time points 100min and 110min, the phasic response was taken following a 10min rest period. Each trace represents the response from a single experiment from a superficial muscle fibre in the mid-region of the crayfish walking leg extensor muscle. Baseline recordings were achieved by stimulating the phasic axon with a single pulse once every 10min for 30min.
0
20
40
60
80
100
120
140
160
0 10 20 30 40 50 60 70 80 90 100 110 120
Time elapsed (min)
Pe
rce
nt
of
init
ial
EP
SP
am
pli
tud
e (
%)
Baseline (30min) Intense stimulation (1hr)
PTP
No PTP
13.5mM Calcium
6.80mM Calcium
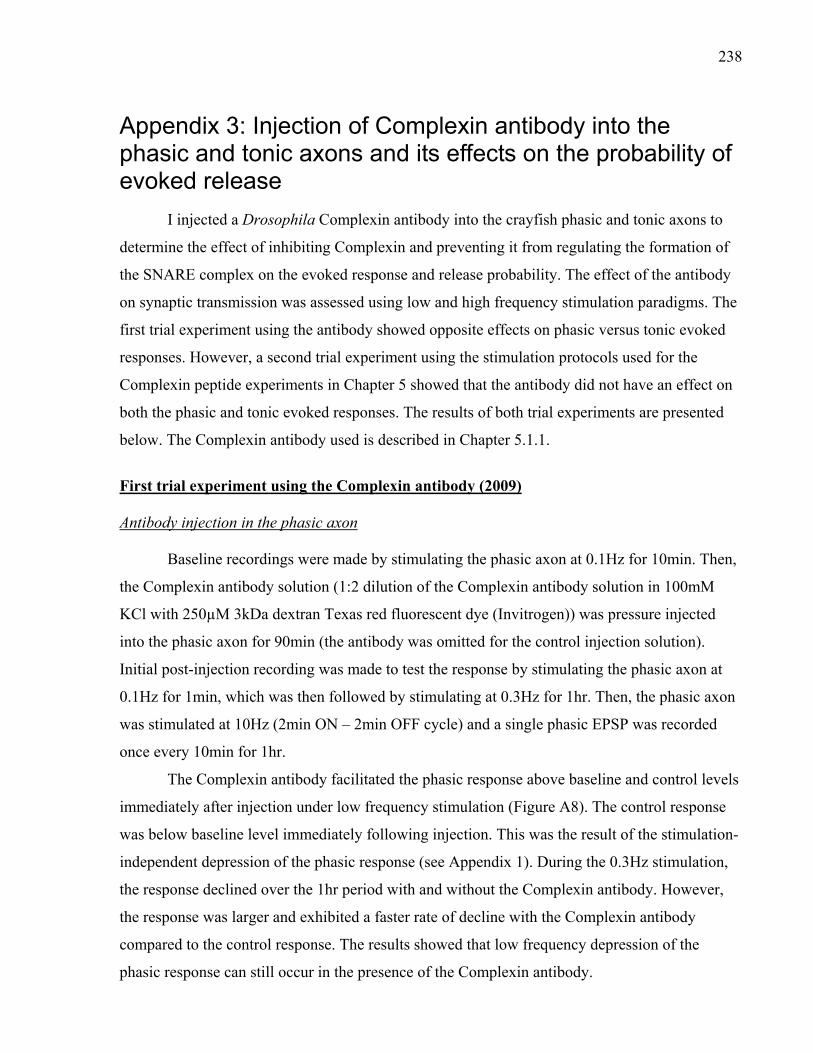
238
Appendix 3: Injection of Complexin antibody into the phasic and tonic axons and its effects on the probability of evoked release
I injected a Drosophila Complexin antibody into the crayfish phasic and tonic axons to
determine the effect of inhibiting Complexin and preventing it from regulating the formation of
the SNARE complex on the evoked response and release probability. The effect of the antibody
on synaptic transmission was assessed using low and high frequency stimulation paradigms. The
first trial experiment using the antibody showed opposite effects on phasic versus tonic evoked
responses. However, a second trial experiment using the stimulation protocols used for the
Complexin peptide experiments in Chapter 5 showed that the antibody did not have an effect on
both the phasic and tonic evoked responses. The results of both trial experiments are presented
below. The Complexin antibody used is described in Chapter 5.1.1.
First trial experiment using the Complexin antibody (2009) Antibody injection in the phasic axon Baseline recordings were made by stimulating the phasic axon at 0.1Hz for 10min. Then,
the Complexin antibody solution (1:2 dilution of the Complexin antibody solution in 100mM
KCl with 250µM 3kDa dextran Texas red fluorescent dye (Invitrogen)) was pressure injected
into the phasic axon for 90min (the antibody was omitted for the control injection solution).
Initial post-injection recording was made to test the response by stimulating the phasic axon at
0.1Hz for 1min, which was then followed by stimulating at 0.3Hz for 1hr. Then, the phasic axon
was stimulated at 10Hz (2min ON – 2min OFF cycle) and a single phasic EPSP was recorded
once every 10min for 1hr.
The Complexin antibody facilitated the phasic response above baseline and control levels
immediately after injection under low frequency stimulation (Figure A8). The control response
was below baseline level immediately following injection. This was the result of the stimulation-
independent depression of the phasic response (see Appendix 1). During the 0.3Hz stimulation,
the response declined over the 1hr period with and without the Complexin antibody. However,
the response was larger and exhibited a faster rate of decline with the Complexin antibody
compared to the control response. The results showed that low frequency depression of the
phasic response can still occur in the presence of the Complexin antibody.
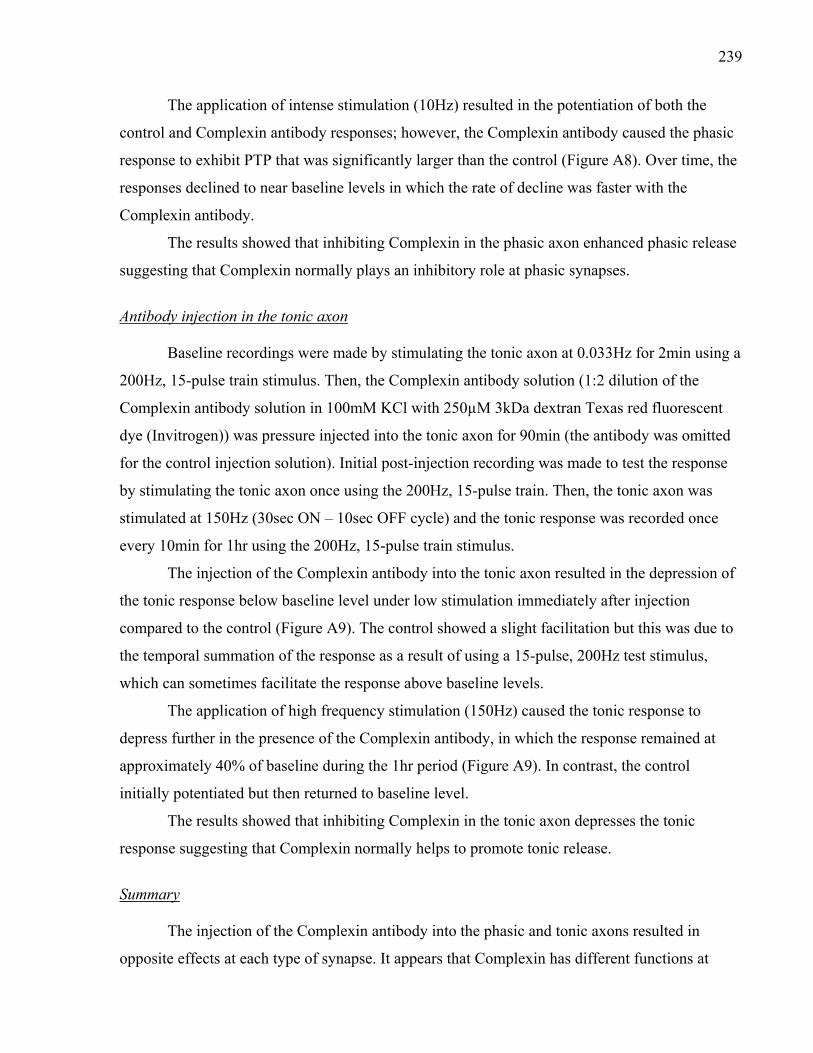
239
The application of intense stimulation (10Hz) resulted in the potentiation of both the
control and Complexin antibody responses; however, the Complexin antibody caused the phasic
response to exhibit PTP that was significantly larger than the control (Figure A8). Over time, the
responses declined to near baseline levels in which the rate of decline was faster with the
Complexin antibody.
The results showed that inhibiting Complexin in the phasic axon enhanced phasic release
suggesting that Complexin normally plays an inhibitory role at phasic synapses.
Antibody injection in the tonic axon
Baseline recordings were made by stimulating the tonic axon at 0.033Hz for 2min using a
200Hz, 15-pulse train stimulus. Then, the Complexin antibody solution (1:2 dilution of the
Complexin antibody solution in 100mM KCl with 250µM 3kDa dextran Texas red fluorescent
dye (Invitrogen)) was pressure injected into the tonic axon for 90min (the antibody was omitted
for the control injection solution). Initial post-injection recording was made to test the response
by stimulating the tonic axon once using the 200Hz, 15-pulse train. Then, the tonic axon was
stimulated at 150Hz (30sec ON – 10sec OFF cycle) and the tonic response was recorded once
every 10min for 1hr using the 200Hz, 15-pulse train stimulus.
The injection of the Complexin antibody into the tonic axon resulted in the depression of
the tonic response below baseline level under low stimulation immediately after injection
compared to the control (Figure A9). The control showed a slight facilitation but this was due to
the temporal summation of the response as a result of using a 15-pulse, 200Hz test stimulus,
which can sometimes facilitate the response above baseline levels.
The application of high frequency stimulation (150Hz) caused the tonic response to
depress further in the presence of the Complexin antibody, in which the response remained at
approximately 40% of baseline during the 1hr period (Figure A9). In contrast, the control
initially potentiated but then returned to baseline level.
The results showed that inhibiting Complexin in the tonic axon depresses the tonic
response suggesting that Complexin normally helps to promote tonic release.
Summary The injection of the Complexin antibody into the phasic and tonic axons resulted in
opposite effects at each type of synapse. It appears that Complexin has different functions at
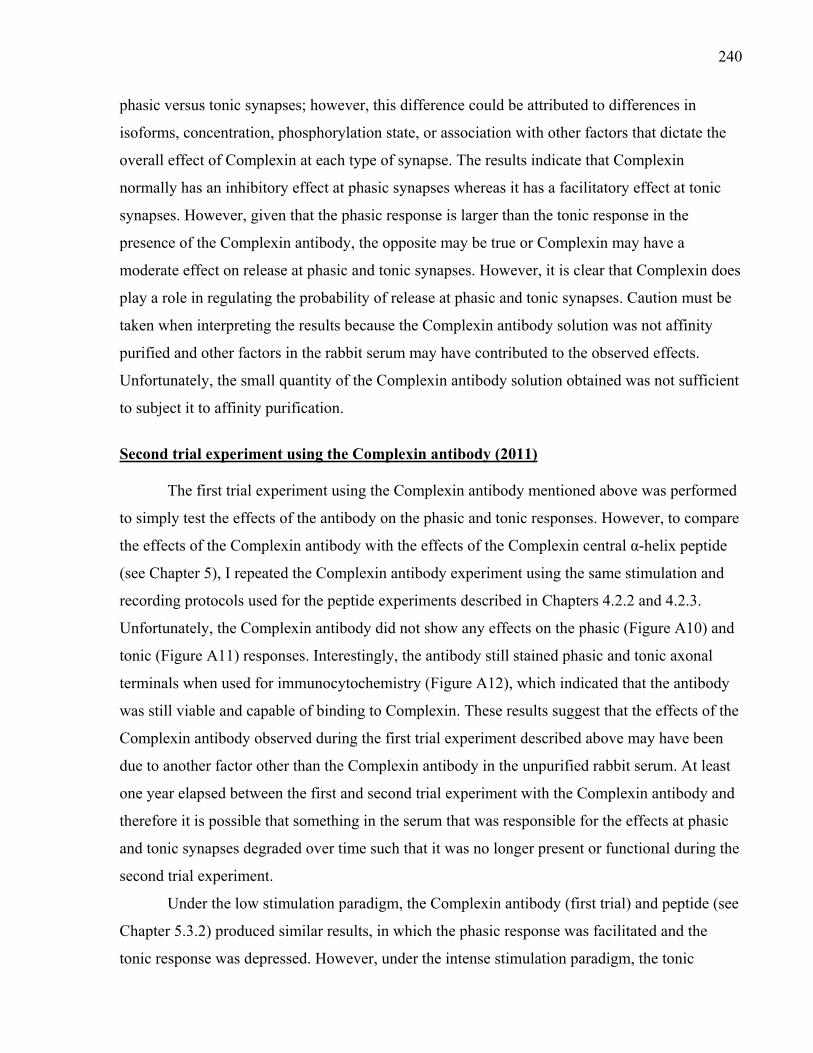
240
phasic versus tonic synapses; however, this difference could be attributed to differences in
isoforms, concentration, phosphorylation state, or association with other factors that dictate the
overall effect of Complexin at each type of synapse. The results indicate that Complexin
normally has an inhibitory effect at phasic synapses whereas it has a facilitatory effect at tonic
synapses. However, given that the phasic response is larger than the tonic response in the
presence of the Complexin antibody, the opposite may be true or Complexin may have a
moderate effect on release at phasic and tonic synapses. However, it is clear that Complexin does
play a role in regulating the probability of release at phasic and tonic synapses. Caution must be
taken when interpreting the results because the Complexin antibody solution was not affinity
purified and other factors in the rabbit serum may have contributed to the observed effects.
Unfortunately, the small quantity of the Complexin antibody solution obtained was not sufficient
to subject it to affinity purification.
Second trial experiment using the Complexin antibody (2011) The first trial experiment using the Complexin antibody mentioned above was performed
to simply test the effects of the antibody on the phasic and tonic responses. However, to compare
the effects of the Complexin antibody with the effects of the Complexin central α-helix peptide
(see Chapter 5), I repeated the Complexin antibody experiment using the same stimulation and
recording protocols used for the peptide experiments described in Chapters 4.2.2 and 4.2.3.
Unfortunately, the Complexin antibody did not show any effects on the phasic (Figure A10) and
tonic (Figure A11) responses. Interestingly, the antibody still stained phasic and tonic axonal
terminals when used for immunocytochemistry (Figure A12), which indicated that the antibody
was still viable and capable of binding to Complexin. These results suggest that the effects of the
Complexin antibody observed during the first trial experiment described above may have been
due to another factor other than the Complexin antibody in the unpurified rabbit serum. At least
one year elapsed between the first and second trial experiment with the Complexin antibody and
therefore it is possible that something in the serum that was responsible for the effects at phasic
and tonic synapses degraded over time such that it was no longer present or functional during the
second trial experiment.
Under the low stimulation paradigm, the Complexin antibody (first trial) and peptide (see
Chapter 5.3.2) produced similar results, in which the phasic response was facilitated and the
tonic response was depressed. However, under the intense stimulation paradigm, the tonic
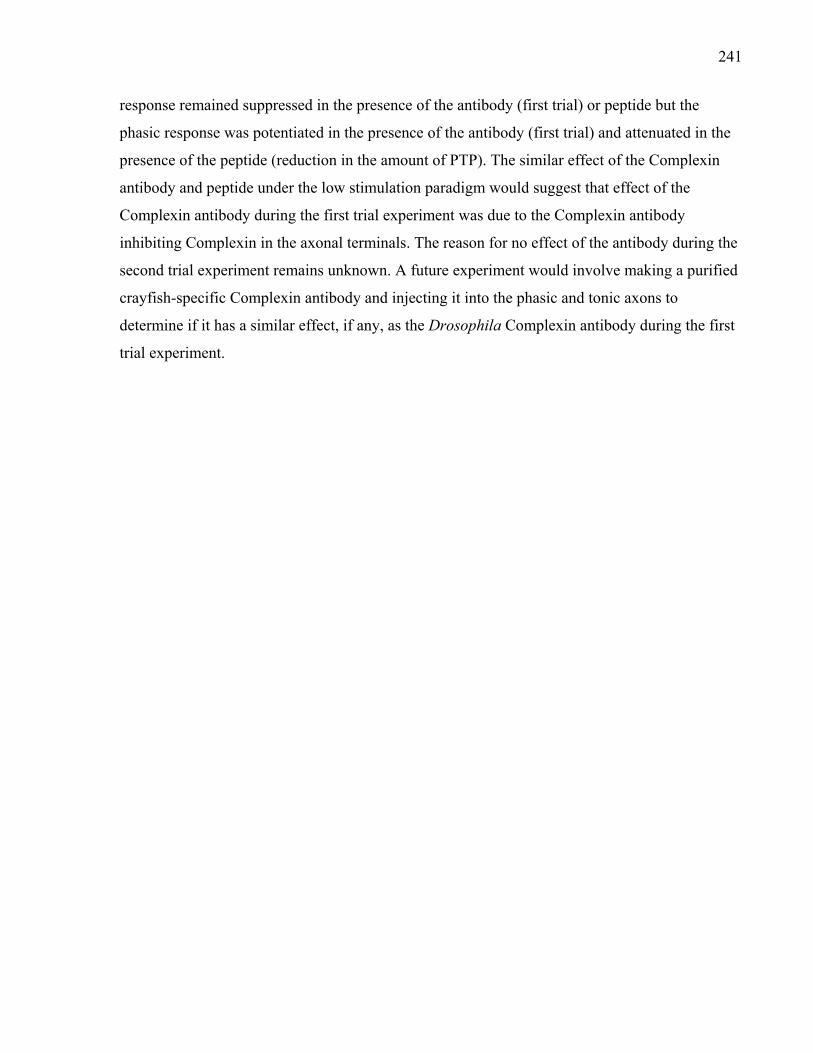
241
response remained suppressed in the presence of the antibody (first trial) or peptide but the
phasic response was potentiated in the presence of the antibody (first trial) and attenuated in the
presence of the peptide (reduction in the amount of PTP). The similar effect of the Complexin
antibody and peptide under the low stimulation paradigm would suggest that effect of the
Complexin antibody during the first trial experiment was due to the Complexin antibody
inhibiting Complexin in the axonal terminals. The reason for no effect of the antibody during the
second trial experiment remains unknown. A future experiment would involve making a purified
crayfish-specific Complexin antibody and injecting it into the phasic and tonic axons to
determine if it has a similar effect, if any, as the Drosophila Complexin antibody during the first
trial experiment.
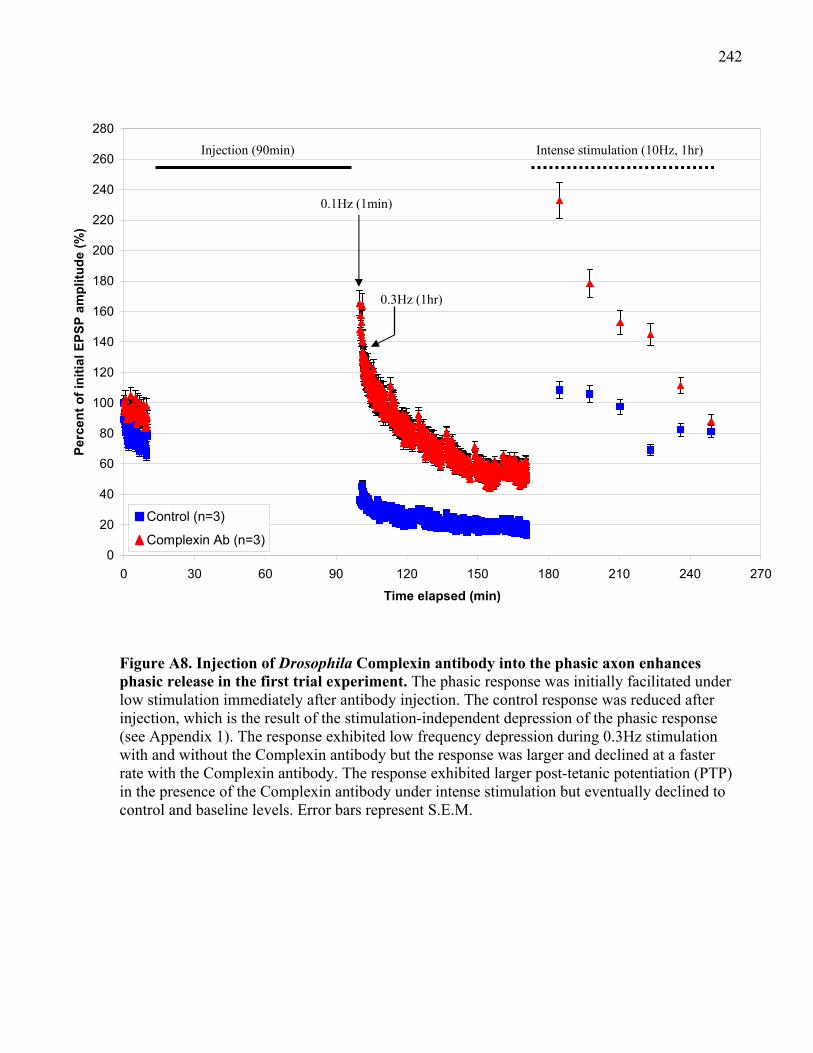
242
Figure A8. Injection of Drosophila Complexin antibody into the phasic axon enhances phasic release in the first trial experiment. The phasic response was initially facilitated under low stimulation immediately after antibody injection. The control response was reduced after injection, which is the result of the stimulation-independent depression of the phasic response (see Appendix 1). The response exhibited low frequency depression during 0.3Hz stimulation with and without the Complexin antibody but the response was larger and declined at a faster rate with the Complexin antibody. The response exhibited larger post-tetanic potentiation (PTP) in the presence of the Complexin antibody under intense stimulation but eventually declined to control and baseline levels. Error bars represent S.E.M.
0
20
40
60
80
100
120
140
160
180
200
220
240
260
280
0 30 60 90 120 150 180 210 240 270
Time elapsed (min)
Pe
rce
nt
of
init
ial
EP
SP
am
pli
tud
e (
%)
Control (n=3)
Complexin Ab (n=3)
0.1Hz (1min)
0.3Hz (1hr)
Intense stimulation (10Hz, 1hr) Injection (90min)
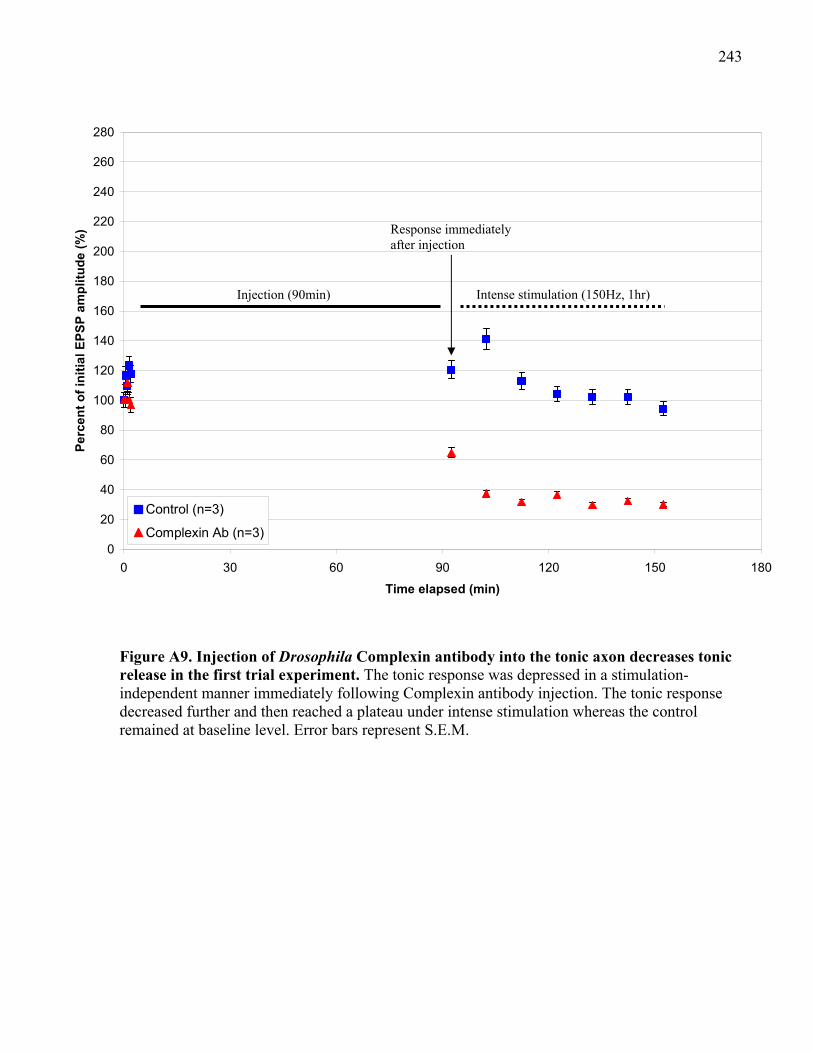
243
Figure A9. Injection of Drosophila Complexin antibody into the tonic axon decreases tonic release in the first trial experiment. The tonic response was depressed in a stimulation-independent manner immediately following Complexin antibody injection. The tonic response decreased further and then reached a plateau under intense stimulation whereas the control remained at baseline level. Error bars represent S.E.M.
0
20
40
60
80
100
120
140
160
180
200
220
240
260
280
0 30 60 90 120 150 180
Time elapsed (min)
Pe
rce
nt
of
init
ial
EP
SP
am
pli
tud
e (
%)
Control (n=3)
Complexin Ab (n=3)
Injection (90min) Intense stimulation (150Hz, 1hr)
Response immediately after injection
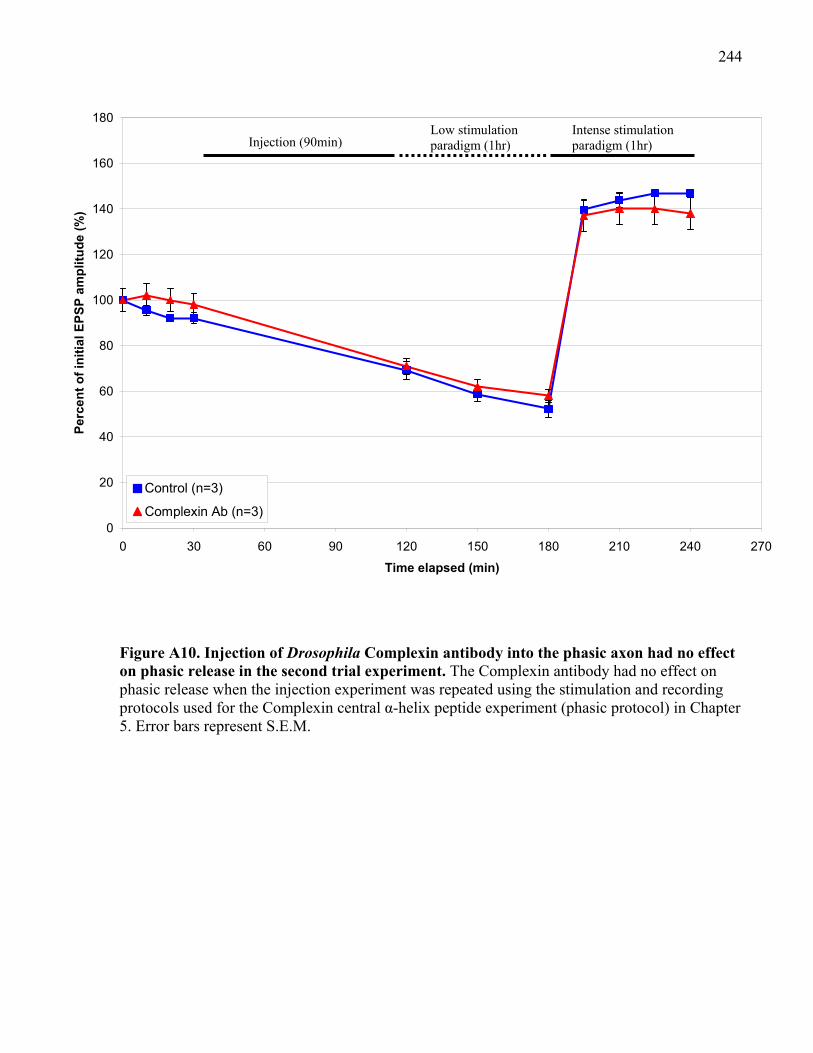
244
Figure A10. Injection of Drosophila Complexin antibody into the phasic axon had no effect on phasic release in the second trial experiment. The Complexin antibody had no effect on phasic release when the injection experiment was repeated using the stimulation and recording protocols used for the Complexin central α-helix peptide experiment (phasic protocol) in Chapter 5. Error bars represent S.E.M.
0
20
40
60
80
100
120
140
160
180
0 30 60 90 120 150 180 210 240 270
Time elapsed (min)
Pe
rce
nt
of
init
ial
EP
SP
am
pli
tud
e (
%)
Control (n=3)
Complexin Ab (n=3)
Injection (90min) Low stimulation paradigm (1hr)
Intense stimulation paradigm (1hr)
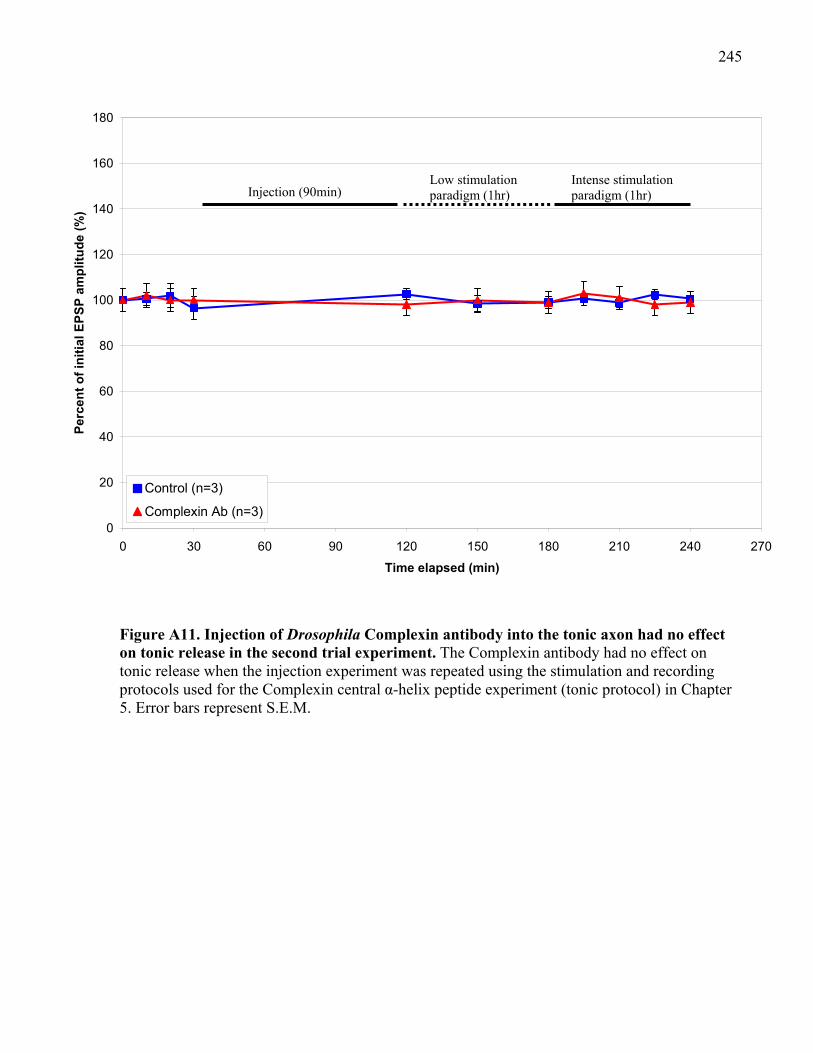
245
Figure A11. Injection of Drosophila Complexin antibody into the tonic axon had no effect on tonic release in the second trial experiment. The Complexin antibody had no effect on tonic release when the injection experiment was repeated using the stimulation and recording protocols used for the Complexin central α-helix peptide experiment (tonic protocol) in Chapter 5. Error bars represent S.E.M.
0
20
40
60
80
100
120
140
160
180
0 30 60 90 120 150 180 210 240 270
Time elapsed (min)
Pe
rce
nt
of
init
ial
EP
SP
am
pli
tud
e (
%)
Control (n=3)
Complexin Ab (n=3)
Injection (90min) Low stimulation paradigm (1hr)
Intense stimulation paradigm (1hr)
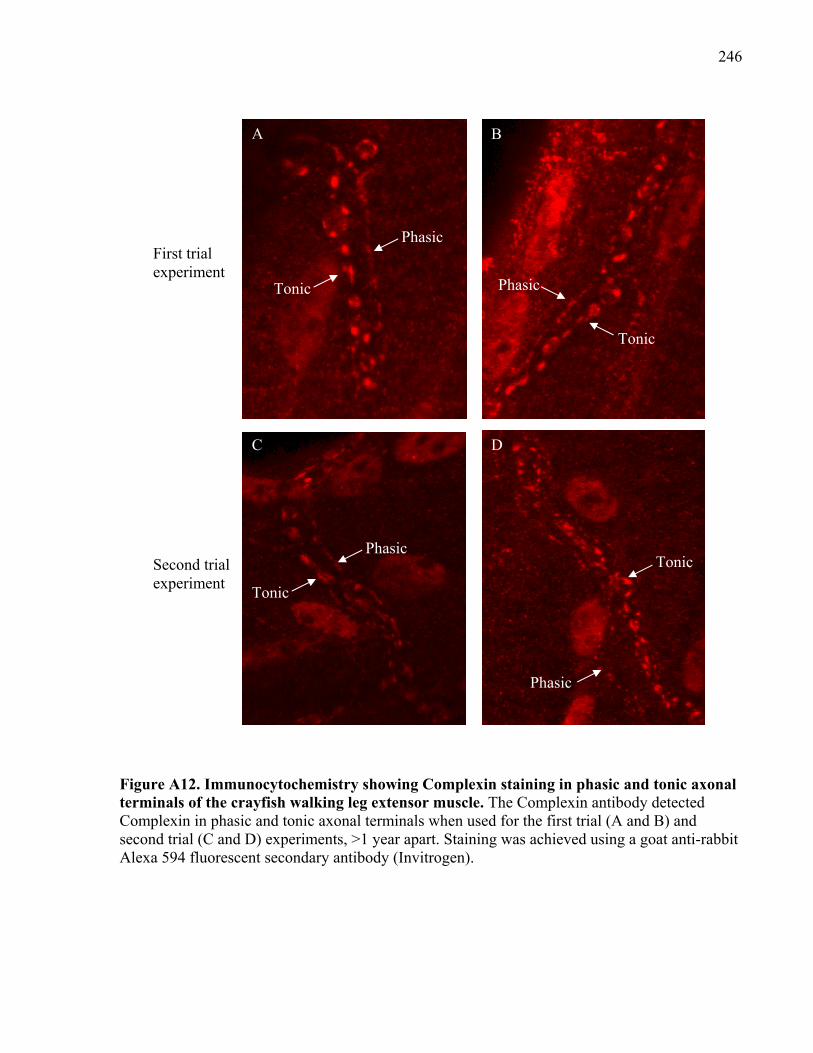
246
Figure A12. Immunocytochemistry showing Complexin staining in phasic and tonic axonal terminals of the crayfish walking leg extensor muscle. The Complexin antibody detected Complexin in phasic and tonic axonal terminals when used for the first trial (A and B) and second trial (C and D) experiments, >1 year apart. Staining was achieved using a goat anti-rabbit Alexa 594 fluorescent secondary antibody (Invitrogen).
A B
C D
Tonic
Phasic
Tonic
Phasic
Tonic
Phasic Tonic
Phasic
First trial experiment
Second trial experiment


