Primary Source Labon
Latin America’s Geography
SS6G2
SS6G3
SS6G4

CLASSROOM ACTIVITESData needs to be collected on each of these countries: Mexico, Venezuela,
Brazil, & Cuba. Then, the student needs to draw conclusions and comparisons on WHERE DO PEOPLE LIVE AND WORK? AND WHY?
1.) Complete the student packet (“Prospectus Project Ponderings”) filled with charts and questions over content for standards SS6G3 & SS6G4. (See Ms. Holcombe for the file or find it on her website unit 5.) (*If you use this
option- you will ONLY complete #1, 2, 3, and from this activity list.)
2.) Create a double-bubble thinking map comparing Venezuela & Mexico. (At a minimum, you mush include the location, climate, and natural resources of both countries and how these are alike or different.)
3.) Create a double-bubble thinking map comparing Cuba & Brazil. (At a minimum, you mush include the location, climate, and natural resources of
both countries and how these are alike or different.)
4.) Make a 3-column/ 5-row chart and list the push and pull factors for the 4 given countries within Latin America. Then write a REGS as to which one is
the better choice to live in and why?
5.) Describe the importance of education in 4 different countries of your choice. Be sure to back up your findings with evidence from the data.
6.) Complete the given 2 page handout chart titled “SS6G3” where 2 countries are compared at a time and conclusions are drawn based on it.
7.) Analyze political cartoons and primary source photos over the 3 main environmental concerns discussed in SS6G2– then discuss and write about.
8.) teacher- guided mini lessons on skills in reading a map/ charts and coming to conclusions based on content. (**VITAL ACTIVITIES**)
9.) Mini- quizzes over map/ chart skills and content in standards.

Textbook Pages to Use Also:Page # Description of map/ chart/ content
5 South Am. Economic Activity
142-3 Latin Am. Elevation, physical geog, population, & statistics
145 Latin Am. Population & Languages & facts
146-9 Data on culture & SOL for all countries
153-9 Latin Am.: weather, climates, physical features discussed for each main country
169 Rain forests in South America
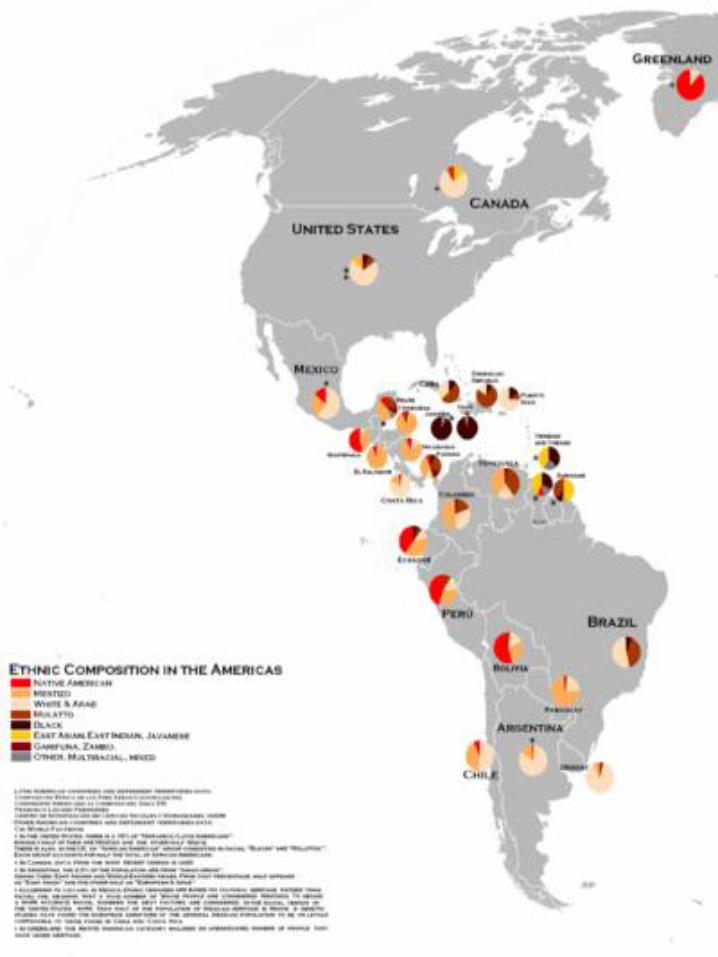
176 Mexico’s culture by population
188 Mexico’s exports
192 Mexico’s population distribution pie chart
199 Mexico’s Land usage map
210 Cuba (& all islands) tourism industry & economics info
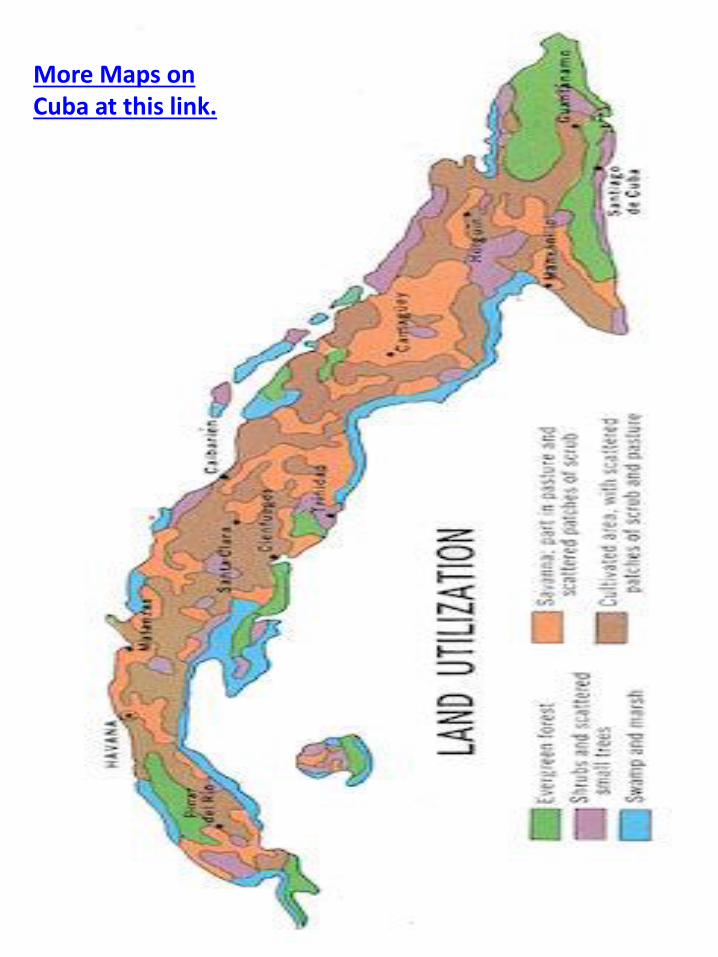
219 Cuba close up
240 South Am. Agriculture
241 Literacy rate & life expectancy data on south am. areas
244 Key Economies in south America
246 South America’s population density
248-9 Latin American Culture information.


Spanish = greenPortugeese = orangeFrench = Blue


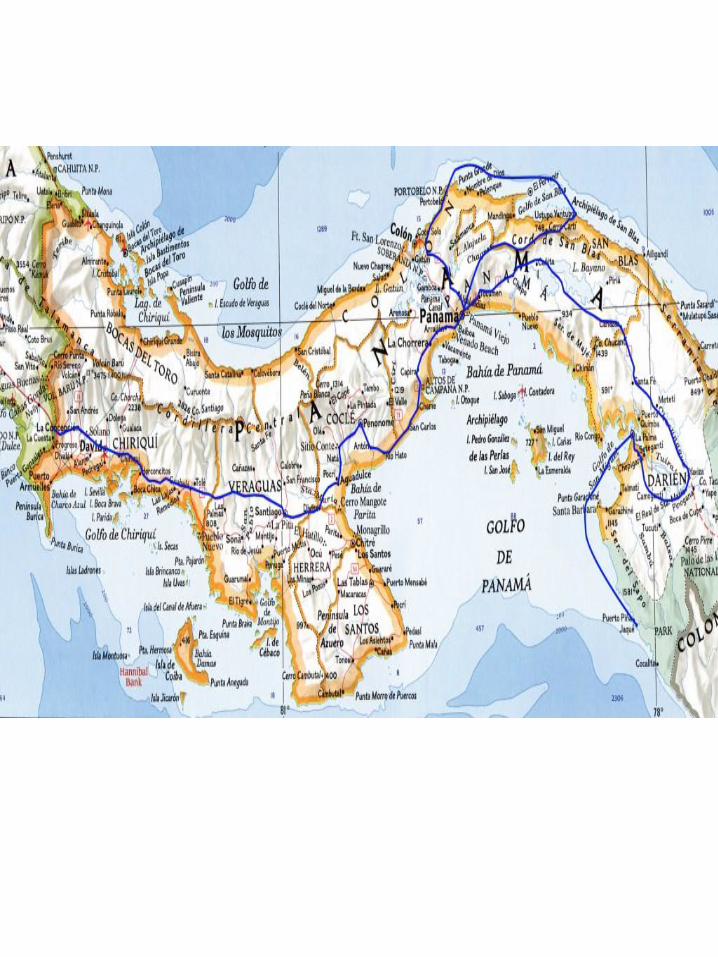


Topography (elevation) Map