
Priscila Rodrigues Tarlé Soares
“Subscribe to my Channel”: The Impact of Digital Influencers on Attitude Towards
Brand, Purchase Intention and Brand Attachment
Dissertation of Masters in Marketing, presented to the Faculty of Economics of the University of
Coimbra to obtain a Masters’ degree.
Coimbra, 2018

Image Source: PerformanceIN
Priscila Rodrigues Tarlé Soares
“Subscribe to my Channel”: The Impact of Digital
Influencers on Attitude Towards Brand, Purchase
Intention and Brand Attachment
Dissertation of Masters in Marketing, presented to the Faculty of Economics of the University
of Coimbra to obtain a Masters’ degree.
Advisor: Professor Arnaldo Coelho, PhD
Co-Advisor: Professor Cristela Bairrada, PhD
Coimbra, 2018


i
I dedicate this work to my mother.

ii
Acknowledgements
First, I would like to thank my advisors, Professor Arnaldo Coelho, for his help and guidance
throughout this process, and Professor Cristela Bairrada, for her patience and help. Without
them I couldn’t have done this research.
I extend my thanks to all of the faculty members of the Faculty of Economics of the University
of Coimbra, as they were all key parts of this journey in their own unique ways. Your knowledge
and teachings were essential, and won’t be forgotten.
I would like to thank my boyfriend, Rúdi Gualter de Oliveira, for his support and companionship
during this process.
I would also like to thank all of my colleagues and the special friends I made in this University,
namely Julia Lopes, Gabriela Sarmento, Leila Porto, Rita Cruz, Lowie Law, Jasmine Ip and
Helena Branco. I thank my friends in Brazil, who provided me with moral support even when
there were many miles between us. Thank you Isabela Conde, Bruna Reis, Luiza Vernieri, Mario
Pimenta, Maby Nyberg, Nicole Barros. You are all special and live in my heart.
Finally, my biggest thanks goes to my mother, Sonia Maria Rodrigues da Costa, without whose
guidance I would never have become the woman I am today. Thank you.

iii
"Words are, in my not-so-humble opinion, our most inexhaustible source of magic. Capable of
both inflicting injury, and remedying it."
J. K. Rowling
“Without our stories we are incomplete.”
Neil Gaiman

iv
Abstract
Purpose: This research aims to discover the links between digital influencers and three key
marketing concepts: attitude towards brand, brand attachment and purchase intention. Seeing as
digital influencers have become key aspects of online communities, and their key role in
supporting and endorsing brands, studying their role within marketing strategies is essential to
improve such strategies and develop better relationships with customers.
Design/ Methodology Approach: The methodology adopted in this dissertation is a survey.
Once the key variables were identified, and metrics for each of them were found in literature, a
questionnaire was created and shared through social media. Answers were then compiled in a
statistics software and analyzes using both IBM SPSS and IBM SPSS AMOS.
Findings: Findings indicate that customer social participation is the best predictive of positive
perceptions of influencers, from those that were considered, and that positive perceptions of
influencer credibility positively affected attitude towards brand, brand attachment and purchase
intentions. Furthermore, they also show positive connections between perceived fit, attitude
towards sponsorship and credibility.
Originality/value: Considering the lack of research on influencers and their role in marketing,
this dissertation hopes to take a step towards filling these gaps in literature. The study proves to
have an innovative take on the role these individuals have on marketing. Furthermore, it also
considers variables such as the attitude towards sponsored content, which may shed light on
different interactions between influencers and their audiences.
Practical Implications: This study contributes to the field of marketing by having an innovative
take on the role of digital influencers. Not only does this shed light on their possible roles in
marketing strategies, but also provides basis for further discussion and research on the topic.
Keywords: digital marketing, digital influencers, attitude towards brand, brand attachment,
purchase intention.

v
Resumo
Propósito: Esta pesquisa busca descobrir a correlação entre influenciadores digitais e três
conceitos-chave de marketing: attitude face a marca, brand attachment e intenção de compra.
Considerando que os influenciadores digitais se tornaram aspectos chave das comunidades
online, e seu papel fundamental no apoio e endosso às marcas, estudar sua função nas estratégias
de marketing é essencial para melhorar essas estratégias e desenvolver melhores
relacionamentos com os clientes.
Metodologia: A metodologia adotada nesta dissertação foi um questionário. Uma vez que as
variáveis principais foram identificadas, e métricas para cada uma delas foram retiradas da
literatura, um questionário foi criado e compartilhado através das mídias sociais. As respostas
foram então compiladas em um software estatístico e analisados usando o IBM SPSS e o IBM
SPSS AMOS.
Resultados: Os resultados indicam que customer social participation é a variável mais preditiva
de percepções positivas dos influenciadores. As percepções positivas da credibilidade do
influenciador afetaram positivamente a atitude em relação à marca, o brand attachment e as
intenções de compra. Os resultados mostram, ainda, conexões positivas entre perceived fit,
atitude em relação ao conteúdo patrocinado e credibilidade.
Originalidade/valor: Considerando a falta de pesquisas sobre o papel dos influenciadores no
marketing, o estudo prova ter uma visão inovadora sobre a função destes indivíduos no campo.
Ao considerar variáveis como a atitude face o conteúdo patrocinado, esta pesquisa também lança
novas questões quanto as interações entre influenciadores, marcas e seus públicos.
Implicações Práticas: Este estudo contribui para o campo de marketing por ter uma visão
inovadora sobre o papel dos influenciadores digitais. Isso não apenas esclarece seus possíveis
papéis nas estratégias de marketing, mas também fornece base para futuras discussões e
pesquisas sobre o tema.
Palavras-chave: marketing digital, influenciadores digitais, brand attachment, intenção de
compra, atitude face à marca
vi
Index of Figures
Figure 1 - Conceptual Model .................................................................................................... 34
Figure 2 - Initial Measurement Model ...................................................................................... 62
Figure 3 - Final Measurements Model ...................................................................................... 63
Figure 4 - Structural Model ....................................................................................................... 71

vii
Index of Tables
Table 1- Types of Online Interaction ........................................................................................ 21
Table 2 - Genuine vs. Sponsored Recommendations ................................................................ 25
Table 3 - Consumer Social Participation ................................................................................... 50
Table 4 - Active Participation .................................................................................................... 50
Table 5 - User Generated Content ............................................................................................. 50
Table 6 - Influencer Credibility ................................................................................................. 51
Table 7 - Influencer Similarity .................................................................................................. 51
Table 8 - Influencer Familiarity ................................................................................................ 52
Table 9 - Perceived Fit............................................................................................................... 52
Table 10 - Attitude Towards Sponsored Content ...................................................................... 52
Table 11 - Attitude Towards Brand ........................................................................................... 53
Table 12 - Brand Attachment .................................................................................................... 53
Table 13 - Purchase Intention .................................................................................................... 53
Table 14 - Age of Respondents ................................................................................................. 55
Table 15 - Completed schooling of respondents ....................................................................... 56
Table 16 - Medium income of respondents ............................................................................... 56
Table 17 - Time spent online ..................................................................................................... 57
Table 18 - KMO Values ............................................................................................................ 58
Table 19 - Cronbach's Alpha ..................................................................................................... 59
Table 20 - Exploratory Factor Analysis .................................................................................... 59
Table 21 - Model fit ................................................................................................................... 62
Table 22 – Measurements’ model fit ......................................................................................... 64
Table 23 - Confirmatory factor analysis results ........................................................................ 65
Table 24 - Standard Deviation, Correlation Matrix and Cronbach's Alpha - Final CFA .......... 67
Table 25 - Descriptive analysis ................................................................................................. 69
Table 26 - Global fit .................................................................................................................. 70
Table 27 - Hypotheses ............................................................................................................... 71

viii
Acronyms
AP Active Participation
ATB Attitude Towards Brand
AVE Average Variance Extracted
BA Brand Attachment
CFA Confirmatory Factor Analysis
CFI Comparative Fit Index
CR Composite Reliability
CRED Credibility
CSP Customer Social Participation
EFA Exploratory Factor Analysis
eWOM Electronic Word-of-Mouth
FAMI Familiarity
FTC Federal Trade Commission
IFI Incremental Fit Index
KMO Kaiser-Meyer-Olkin
PF Perceived Fit
PI Purchase Intention
PSI Parasocial Interaction
RMSEA Root Mean Square Error of Approximation
SEM Structural Equations Model´
SIMI Similarity
SPONS Attitude Towards Sponsored Content
SRW Standardized Regression Weights
TLI Tucker-Lewis Fit Index
UGC User-Generated Content
WOM Word-of-Mouth

ix
Table of Contents
Acknowledgements .................................................................................................................... ii
Abstract ....................................................................................................................................... iv
Resumo ........................................................................................................................................ v
Index of Figures .......................................................................................................................... vi
Index of Tables ......................................................................................................................... vii
Acronyms ................................................................................................................................ viii
Table of Contents ....................................................................................................................... ix
1. Introduction ......................................................................................................................... 1
1.1 Research Problem and Objectives ..................................................................................... 4
1.1.1 Main Research Objective ........................................................................................... 4
1.1.2 Secondary Research Objectives ................................................................................. 5
1.2 Research Structure ............................................................................................................. 5
2. Literature Review ................................................................................................................ 7
2.1 Digital Influencers ............................................................................................................. 7
2.1.1 Influence and Communication.................................................................................... 7
2.1.1.1 From Traditional Communities to Online Communities ......................................... 9
2.1.2 Who Are the Digital Influencers .............................................................................. 11
2.2 Perceptions about Digital Influencers ............................................................................. 14
2.2.1 Influencer Credibility ............................................................................................... 14
2.2.2 Influencer Attractiveness: Similarity ........................................................................ 16
2.2.3 Influencer Attractiveness: Familiarity ...................................................................... 17
2.3 Social Media Engagement ............................................................................................... 19
2.3.1 Customer Social Participation .................................................................................. 19

x
2.3.2 Active Participation .................................................................................................. 21
2.3.3 User Generated Social Media Content ..................................................................... 22
2.4 Sponsorship ..................................................................................................................... 23
2.4.1 Attitude Towards Sponsored Content ...................................................................... 24
2.4.2 Perceived Fit ............................................................................................................. 27
2.5 The Impacts of Digital Influencers .................................................................................. 28
2.5.1 Attitude Towards Brand ........................................................................................... 28
2.5.2 Brand Attachment .................................................................................................... 29
2.5.3 Purchase Intention .................................................................................................... 30
3. Conceptual Model and Hypotheses ................................................................................... 32
3.1 Conceptual Model ........................................................................................................... 32
3.2 Hypotheses ...................................................................................................................... 34
3.2.1 Engagement and Perceptions of Influencers ............................................................ 35
3.2.2 Sponsorship .............................................................................................................. 39
3.2.3 Impacts of Digital Influencers .................................................................................. 40
4. Methodology ..................................................................................................................... 47
4.1 Population and Sample Selection .................................................................................... 47
4.2 Data Collection Method .................................................................................................. 48
4.2.1 Questionnaire Elaboration ........................................................................................ 48
4.2.2 Question Terminology .............................................................................................. 49
4.2.3 Metrics ...................................................................................................................... 50
4.3 Pre-Testing ...................................................................................................................... 54
4.4 Data Insertion in Statistic Software ................................................................................. 55
4.5 Sample Characterization ................................................................................................. 55
4.6 Statistical Analysis .......................................................................................................... 57
xi
4.6.1 Exploratory Factor Analysis ..................................................................................... 58
4.6.2 Exploratory Factor Analysis Results ........................................................................ 59
4.6.3 Confirmatory Factor Analysis .................................................................................. 61
4.6.4 Model Fit .................................................................................................................. 62
4.6.5 Quality of the Measurement Model .......................................................................... 64
5. Results ............................................................................................................................... 69
5.1 Descriptive Analysis of Variables ................................................................................... 69
5.2 Structural Model Adjustment .......................................................................................... 70
5.3 Hypotheses Testing ......................................................................................................... 71
5.4 Discussion ........................................................................................................................ 74
5.4.1 Engagement and Perceptions of Digital Influencers ................................................ 74
5.4.2 Sponsorship .............................................................................................................. 75
5.4.3 Outcomes .................................................................................................................. 76
6. Final Considerations .......................................................................................................... 78
6.1 Contributes of the Study .................................................................................................. 79
6.2 Limitations and Recommendations for Future Research ................................................ 80
Bibliographic References .......................................................................................................... 82
Appendixes ................................................................................................................................ 92

1
1. Introduction
The impact of digital influencers on attitude towards brand, brand attachment and purchase
intention is the central theme of this dissertation. The widespread of social media as a marketing
platform, and the constant evolution of the digital space have created multiple opportunities for
companies and marketers, which have, in latest years, gathered attention from the academic
community as a field of study (Carlson & Lee, 2015; Uzunoğlu & Misci Kip, 2014). However,
trust, or rather the lack of it, has showed to be a possible issue in digital marketing and brand
generated content (Awad & Ragowsky, 2008; Brown & Hayes, 2008).
Influential members of social media platforms can become a bridge between companies and
consumers, offering a possible solution for the gap created by the lack of trust. Recognizing and
harnessing the power of such members in the online environment could prove essential for
strong social media and digital marketing strategies (Uzunoğlu & Misci Kip, 2014).
Web 2.0 was conceptualized as websites and online services that depend on its users to create
content, as opposed to having editors or hired content creators (O’Reilly, 2005). The
introduction of Web 2.0 and evolution of social networks and their functionalities has allowed
consumers, who once were merely receivers of marketing messages, to create original content
of their own. This, in turn, led to the rise of platforms such as Youtube, Instagram, Facebook
and other websites where consumers can share this content, giving way to new levels of
communication where the consumer can be informed about products, services and companies
through means other than an advertisement.
The possibilities created by content platforms have changed the relationship between consumers
and brands and created new links between content producers and online content consumers. This
new online social environment has created the electronic word-of-mouth (e-WOM), which
became an essential functionality for consumers to learn more about brands and products (Sun,
Youn, Wu, & Kuntaraporn, 2006).
In this scenario, some individuals have stood out, gathering millions of followers around the
world (Carlson & Lee, 2015). Their social media reach has allowed these people to adopt the
role of digital (or social media) influencers; consumers that, through the production of original

2
content posted in social media, can endorse and promote products and brands, thus influencing
their massive following to become potential consumers.
The two-step flow theory (Katz & Lazarsfeld, 1966) postulates that people’s opinions are
formed through the influence of “opinion leaders”, who, in turn, depend on mass media to form
their own opinions. Katz and Lazarsfeld’s (1966) study emphasizes the role of community
opinion leaders as builders of public opinion and mediators of marketing messages.
Though the theory conceptualized by these authors originally referred to offline opinion-formers
and the role of such people in local communities, one can draw parallels between their findings
and the role of digital influencers. Like offline opinion leaders, digital influencers adopt a
mediating role between marketing messages and consumers, adapting these messages in order
to present them in personal ways, which reasons with their audience (Uzunoğlu & Misci Kip,
2014).
The role of endorsement has been widely studied, especially in the context of celebrity
endorsers, and though one can find similarities between celebrities and influencers, it is
important to denote their differences and the specific impact of influencers. That is because
social media influencers are first perceived as fellow consumers (as opposed to spokespersons
for brands), which can lead to stronger ties and higher regard for their opinion on products.
Considering the possible impact of these individuals on digital marketing strategies and the
relationship between consumers and brands, three important variables were conceived as
possibly impacted outcomes: attitude towards the brand, brand attachment and purchase
intention. All of them have been widely studied in the field of marketing (Kaushal & Kumar,
2016; Park, MacInnis, Priester, Eisingerich, & Iacobucci, 2010; Spears & Singh, 2004). Attitude
towards the brand and brand attachment are considered essential in predicting and influencing
consumer behavior, while purchase intention is a conscious plan to turn such behavior into
future action (Spears & Singh, 2004).
Attitude towards brand can be defined as favorable or unfavorable feelings and beliefs towards
brands. This variable has been widely studied by researchers, as well as its relationship with
purchase intention and attitude towards advertisements. Marketing professionals use multiple
techniques to convenience consumers to form a positive attitude towards their products, as
3
researchers have found this plays a dominant role in the making of purchase decisions (Kaushal
& Kumar, 2016).
Traditional marketing states that the advertisement has a dominant role in impacting attitude
towards the brand. However, as technology evolves, traditional marketing strategies no longer
detain the same influence over customers. Counting on advertising alone to divulge a company’s
products is no longer enough, especially in a world where television and the internet both
bombard customers with marketing messages daily (Brown & Hayes, 2008).
Thus, it is important to find alternative ways to influence consumers to form a positive attitude
towards brands, incorporating new technology into marketing strategies (Brown & Hayes,
2008). Digital influencers can become possible contributors and affect this variable through their
social media endorsement and promotion of certain brands. Their role as mediators between
consumers and brands and the perception of these people as consumers can influence attitude
towards a product or brand (Uzunoğlu & Misci Kip, 2014).
Brand attachment can be seen as similar to attachment in interpersonal relationships, and refers
to a connection between the consumer and the brand and the positive feelings the consumer has
towards the brand (Yao, Chen, & Xu, 2015). This bond between the brand and the self can be a
driver of purchase and a key element in loyalty, making it an important variable in determining
customer lifetime value, as showed by (Park et al., 2010).
Purchase intention has been one of the most studied subjects by marketing researchers, as
impacting it is one of the key objectives of the field. It refers to the behavioral tendency and
possibility for consumers to attempt to purchase a product (Spears & Singh, 2004). This variable
gives valuable insight into consumer patterns.
One specific social media platform was chosen as a focus of this study: Youtube. The author
decided on this platform due to its popularity with digital influencers and content creators. It
counts with billions of users worldwide, and its growth can create a profitable environment for
the development of marketing strategies (Correia, 2016). Additionally, Youtube offers the
possibility of monetizing creators’ videos, as well as tools for the advertisement and promotion
of products within videos.

4
1.1 Research Problem and Objectives
The study of the impact of digital influencers due to the increasing importance of these
individuals for the Marketing area. Social media has become an important tool to create and
maintain relationships with consumers, and its relevancy for the Marketing world has become
increasingly important. The widespread of online opinion leaders represent an immense
opportunity for brands and the development of their relationship with consumers.
Thus, the rising importance of digital influencers, and the opportunities they present for the field
of digital marketing make the study of their contributions necessary, considering the scarcity of
existing literature and the innovative perspective that it can offer for digital marketing theory.
As consumers take on the mantle of online content creators and possible opinion leaders, they
present new opportunities and challenges for the development of Marketing, seeing as
traditional techniques rapidly become obsolete in the face of new technologies, and that the
continuous production of advertisement “noise” does little to move consumers (Brown & Hayes,
2008).
Studying the relationship between these new individuals’ influence – which stand between
consumers and companies – and consumers’ attitudes towards brands and brand attachment can
solidify and evolve companies’ communication strategies, while the impact of these individuals
on purchase intention can highlight their importance in marketing strategies.
Therefore, the research problem dealt with in this investigation is: what is the impact of digital
influencers on attitude towards brand, brand attachment and purchase intention?
1.1.1 Main Research Objective
Explore the impact of digital influencers on attitude towards brand, brand attachment and
purchase intention.
5
1.1.2 Secondary Research Objectives
Propose a conceptual model to understand the impact of digital influencers on attitude towards
brand, brand attachment and purchase intention
Explore whether active participation in social media has a positive impact on consumers’
perceptions of digital influencers, represented by the constructs: credibility, familiarity and
similarity.
Explore whether customer social participation has a positive impact on consumers’ perceptions
of digital influencers, represented by the constructs: credibility, familiarity and similarity.
Explore whether user-generated social media content has a positive impact on consumers’
perceptions of digital influencers, represented by the constructs: credibility, familiarity and
similarity.
Verify whether consumers’ attitude towards sponsored content impacts digital influencers’
credibility.
Verify whether the perceived fit between influencers and the products they endorse impacts
consumer’s attitude towards sponsored content.
Explore if the perceptions of digital influencers, represented by credibility, familiarity and
similarity, has a positive impact on attitude towards brand, brand attachment and purchase
intention.
Explore the correlations between attitude towards brand, brand attachment and purchase
intention.
1.2 Research Structure
The following investigation aims to understand the impact of digital influencers on the three
key marketing concepts discussed in this introductory chapter: brand attachment, attitude
towards brand and purchase intention. This dissertation will be divided in five chapters. The
first chapter introduces the main theme of the research and presents the research problem and
the objectives delineated by the researcher, offering an overview of what will be discussed.

6
Chapter two is a literature review, which will present relevant theoretical background for the
research, conceptualizing each of the variables of this paper, presenting previous finds on links
between the variables and the theoretical background that supports the hypotheses of this study.
Through the presentation of these concepts, chapter two will construct the theoretical basis upon
which the paper will be sustained.
Chapter three will present the conceptual model of the study. This includes a conceptual map
built to visually represent the hypotheses and key variables, as well as how they relate with one
another. It will also further discuss findings in literature that support the hypotheses proposed.
The fourth chapter will present the methodology adopted by the author. It will contain the
operationalization of variables, and explain how the research was constructed and conducted, as
well as how the data was collected, treated and calculated. It presents a detailed account of how
the research was conducted.
The fifth chapter will present the results found by the empirical research. It will detail the
statistical findings and thoroughly interpret them, as to accept or decline the validity of the
hypotheses.
Finally, the fifth chapter will present all final considerations and the research’s conclusions, its
limitations and recommendations for future studies on the topic.
7
2. Literature Review
The following chapter aims to provide a theoretical basis for the study, by analyzing previous
literature on digital influencers, brand attachment, purchase intention and attitude towards
brands, as well as all secondary variables utilized in this study. The multiple theories presented
in this chapter have become the basis for the conception of the theme of this dissertation and its
development.
In order to further elucidate the main goal of the dissertation and understand the role of each
construct, some relations between different theories were suggested and elaborated, furthering
the understanding of the role of digital influencers in marketing. Through these relations the
author has achieved a consensus on the importance of the theme and justification for its
development.
2.1 Digital Influencers
2.1.1 Influence and Communication
Influence can be broadly defined as the ability to affect a person, thing or series of events (Brown
& Hayes, 2008). Influence is an essential part of marketing, which aims to make people consume
certain products. However, according to Brown and Hayes (2008), traditional marketing has
been gradually becoming obsolete, especially when faced with new technologies and their users.
These authors have identified lack of innovation as one of the main reasons why marketing can
no longer answer its consumers’ needs. The lack of connection between the marketing and sales
departments, and the huge volume of marketing messages consumers face daily are some of the
major obstacles to obtaining good results from traditional marketing strategies (Brown & Hayes,
2008).
Additionally, commercial messages have become so abundant that consumers filter them out,
rather than listening. The constant noise generated by advertisement ends up being ignored by
consumers. Even when consumers do remember an ad, though, they often don’t recall the
products the messages are trying to sell (Brown & Hayes, 2008).
8
The development and evolution of the internet has also made interaction among users a big part
of marketing, and the spread of information stopped being a unidirectional action from
companies to users to become a multidirectional effort from users and companies alike.
Tim O’Reilly called this Web 2.0. The decentralization of information is the basis for Web 2.0,
which becomes a platform for its exchange (O’Reilly, 2005). Thus, the internet has gone from
a broadcasting medium, to an interactive one (Constantinides & Holleschovsky, 2016).
These developments made it so that the consumer was no longer a mere receptor of marketing
messages, but an individual with a voice that could be heard by millions. Marketing, then, must
adapt to the changing nature of consumer paths in the digital economy (Kotler, Kartajaya, &
Setiawan, 2017).
This also led to the evolution of Word-of-Mouth (WOM). Traditional WOM can be
characterized as “an informal behavior of informative communication about products, brands
and consumers’ experiences with them” (Kiss & Bichler, 2008). Its importance to marketing has
been highlighted by other studies in the past, as a possible driver of sales amongst social groups,
because consumers tend to rely on the opinions of their peers (Brown, Broderick, & Lee, 2007;
Erkan & Evans, 2016).
Electronic word-of-mouth (eWOM) is a natural evolution of traditional WOM. Because
technology now allows it, consumers are able to exchange experiences and recommendations,
as well as get information about brand and products through the internet. The audience leaves
behind the limitations of small, social groups and becomes available to big masses of people at
once (Kiss & Bichler, 2008).
The internet has made it possible for eWOM generated by ordinary consumers to reach a mass
audience, and consumers now have the opportunity to reach thousands and thousands of people,
sharing or seeking opinions and information on products and brands (McQuarrie, Miller, &
Phillips, 2013).
EWOM has been studied as an influential marketing instrument, since consumers search for
information posted by other customers in order to feel comfortable or informed on their purchase
decision (Erkan & Evans, 2016). Researchers have found links between eWOM and purchase
intention, and Erkan and Evans (2016) concluded that both characteristics of eWOM

9
information and the attitude of consumers towards eWOM information have a positive impact
on consumers’ purchase intentions
Social media sites are considered appropriate platforms for eWOM. These websites are made
for sharing, commenting and interacting, and these functionalities can easily be used to
communicate with brands, showcase preferences, intentionally post about brands or share
information on products, as well as leave reviews (Erkan & Evans, 2016).
2.1.1.1 From Traditional Communities to Online Communities
Muniz and O’Guinn (2001) wrote that “community is a core construct in social thought” (Muniz
& O’Guinn, 2001, p. 2). Bauman (2003) defined community as a safe, cozy space, where
individuals can relax, and count on each other’s good will. It is a space in which dialogue is
open and mutually beneficial, and wherein individuals’ trust is bilateral.
The role of communities has been studied in sociology and anthropology (e.g. Bauman, 2013;
Etzioni & Etzioni, 1999), due to its mediating role in social interaction and individual behavior.
Its conceptualization has evolved from physical communities where members meet face-to-face,
to wider, online communities.
Muñiz and O’Guinn (2001) look at this mediating role and analyze how communities can impact
consumer behavior, developing the concept of brand communities. Their findings point out that
these “imagined” communities represent a form of human association situated within a
consumption context (Muniz & O’Guinn, 2001).
However, these authors give little thought to the social aspect of brand communities (Bagozzi
& Dholakia, 2006). Bagozzi and Dholakia (2006) look at brand communities focusing on this
social aspect, searching for small groups within brand communities to conceptualize these
interactions.
“A small group brand community is a friendship group of consumers with a shared enthusiasm for the
brand and a well-developed social identity, whose members engage jointly in group actions to accomplish
collective goals and/or to express mutual sentiments and commitments. Group activities centered on the

10
brand intermingle with other social activities in these brand communities.” (Bagozzi & Dholakia, 2006,
p. 45)
Traditionally, communities were constricted by geographical barriers. Conceptualizations of
communities were often surrounded as much by the idea of physical closeness as by the notion
of emotional connection (e.g. Primo, 1997).
However, the evolution of Web 2.0 has created an environment through which consumers can
surpass geographical barriers. Physical proximity is no longer a determinant factor for the
creation of communities. This is also true for brand communities. Social media websites become
beacons for the creation of virtual brand communities, wherein consumers can exchange
information, share opinions and ideas, and continuously redefine what products and brands
mean in their lives (Schembri & Latimer, 2016).
Tsai and Bagozzi (2014) study the motivations behind participation in virtual communities and
their findings indicate that group mentality (or ‘we-intention’) can be predictive of individual
behavior. That is, a person may possess “a collective intention when they intent to act as part of
a group activity” (Tsai & Bagozzi, 2014).
For marketing, that means that virtual communities might be used as drivers of intention. Virtual
communities can also offer insights on product innovation, and help brands bond with their
consumers, creating deeper, enduring relationships with them (Tsai & Bagozzi, 2014).
However, for virtual community-based marketing to work, users must be led to actively
participate in these communities, creating and sharing brand-related content (Tsai & Bagozzi,
2014).
Conceptualizing communities is essential for the understanding of the role of digital influencers
as opinion leaders (Uzunoğlu & Misci Kip, 2014). Seeing as ties between brand communities
and consumption behavior have been previously studied (Bagozzi & Dholakia, 2006; Schembri
& Latimer, 2016), and communities form around digital influencers much like fan communities,
understanding the role of this construct in marketing is important to fully comprehend the
phenomenon of digital influencers (Brown et al., 2007).

11
2.1.2 Who Are the Digital Influencers
Digital influencers are individuals whose messages have a wider reach, due to their higher
number of social media followers. Because of that, they have the power to disseminate messages
to bigger audiences. Unlike corporate marketing messages, though, influencers’ mass-
transmitted messages are often perceived as more trustworthy and personal, due to these being
perceived as another customer’s experiences (Uzunoğlu & Misci Kip, 2014).
Connections between trust and user-generated content have been researched in the past, and
previous studies have found that it “has significant influence on consumers' brand perceptions,
brand choices, and new consumer acquisition” (Lee & Watkins, 2016, p. 5754).
McQuarrie, Miller and Phillips (2013) highlight the fact that these users are not celebrities, or
necessarily experts in their fields, but social media has provided ordinary consumers with the
opportunity to “grab the megaphone”, amassing a huge following and widely spreading their
opinions.
The trust in social media personalities comes from the perception that spontaneity and face-to-
face talks about brands are more credible than ad campaigns. Because social media offers the
possibility of worldwide communication without the interference of companies, these
interactions are perceived as honest. Social circles are one of the main sources of influence,
surpassing marketing messages and even personal preferences, which indicates that consumers
tend to follow their peers (Kotler et al., 2017)
Social media allows for individuals to create large-scale eWOM networks, sharing their
thoughts and experiences about brands, companies and products online. The traditional role of
social circles has been widened within the online space, as technology has made personal
opinions easily accessible to worldwide audiences (Kotler et al., 2017). These, in turn, may seek
out this information to support their purchase decisions (Constantinides & Holleschovsky,
2016).
Participants in Uzunoğlu and Misci Kip (2014) study also point out that reliable influencers’
recommendations can bring prestige to brands, and that social media members might become
influential due to their reliability. These authors, thus, found that trustworthiness is a major
source of power within social media.

12
Uzunoğlu and Misci Kip (2014) applied the two-step flow of communication model (Katz &
Lazarsfeld, 1966) to the digital environment, as a way to explain the emergence of digital
influencers.
According to Katz and Lazarsfeld’s (1966) model, opinion leaders are people in a community
that detain some influence over the opinions of others in that same community. That way, ideas
flow from mass media (through advertisement), to opinion leaders, to everyone else. This model
was a direct contrast with the 1930s’ model of the hypodermic needle, which suggested that an
intended message is directly received and wholly accepted by the receiver.
The adaptation made by Uzunoğlu and Misci Kip (2014) postulates that influencers adopt the
role of online opinion leaders. The authors consider the fact that digital influencers are more
information savvy and more willing to consume media content. Like Katz and Lazarsfeld’s
opinion leaders, influencers have the ability to filter messages disseminated by mass media or
brands (Uzunoğlu & Misci Kip, 2014).
Additionally, Uzunoğlu and Misci Kip (2014) state that digital influencers’ role as early
adopters gives them key roles in launching new products, and offers new marketing
opportunities in launching existing products to new markets.
Centeno and Wang (2017) study the mediating role of celebrities as human brands and their
effects on co-creation. Their study also dips into social media participation, about which they
find that:
“The comments and reactions for each post by celebrities and other instrumental stakeholders suggest that
the attraction that celebrity human brands radiate is worthy of consumers' expressions of attitudes.”
(Centeno & Wang, 2017, p. 137)
The mediating effect of celebrities can be transposed to the role of influencers, who take on the
role of “web-celebrities” (Lee & Watkins, 2016). Thus, their social media participation elicits
similar reactions to that of celebrities.
The allure of social media influencers can be explained through para-social interaction (PSI)
theories. PSI is used to explain the relationship between media personalities and media users,
and can be considered a “friendship” between a media personality and a media user (Perse &

13
Rubin, 1989 apud. Lee & Watkins, 2016). It builds upon an impression-formation process
similar to the one that happens in real-life encounters (Knoll, Schramm, Schallhorn, &
Wynistorf, 2015).
Originally used to explain the proximity felt by fans towards celebrities or media characters,
Lee and Watkins (2016) have transposed these arguments to social media and social media
influencers, highlighting the role of social media sites wherein followers can interact with
influencers as essential to the development of such connections.
Citing Labrecque (2014), Lee and Watkins (2016) define PSI as an illusionary experience,
through which consumers interact with personas as if they’re present and engaged in a reciprocal
relationship, that is, media users can create personal ties with digital influencers through their
online engagement. Some characteristics of PSI resemble interpersonal friendships, providing
companionship, and it is a strong factor in establishing relationships.
“After a media character has been categorized, PSI can start as parasocial processing including all
cognitive, affective, and behavioural reactions to a media character. In other words, PSI then functions as
some kind of interpersonal involvement encompassing the extent ‘to which the individual interacts
psychologically with a media character’” (Knoll et al., 2015, p. 723)
In a social media context, wherein users’ interaction with their favorite social media
personalities becomes more balanced due to the two-way characteristic of social media
communications, the development of PSI becomes even more swift. Repeated exposure to
vloggers or other social media influencers elicit feelings that are similar to traditional
relationship enhancers (Lee & Watkins, 2016).
PSI is essential to understanding the strength of social media influencers because continuous
strengthening of the “relationship” with influencers lead customers to seek out the opinions of
those influencers on products, brands and services (Lee & Watkins, 2016). Additionally, PSI
can influence how consumers react to brands and products, as shown by Lee and Watkins
(2016), who found that “consumers who view vloggers as similar to them will likely develop PSI
with the vlogger and have the same positive brand evaluations as the vlogger” (Lee & Watkins,
2016, p. 5759) .
14
2.2 Perceptions about Digital Influencers
Endorsement models have been created and widely studied, especially as they pertain to
celebrity endorsers (Adnan, Jan, & Alam, 2017; Jaffari & Hunjra, 2017). Like PSI theory,
though, these models can be applied to digital influencers, especially as their social media
presence grows and they acquire a status of “web-celebrities”. Two models are commonly used
to measure and infer how customers are impacted by celebrity endorsement: the source
credibility model and the physical attractiveness model (Adnan et al., 2017).
Some of these variables, such as attractiveness, are also antecedents to PSI (Lee & Watkins,
2016), meaning that they help create conditions to create or strengthen PSI between customers
and the object of PSI (e.g. influencers).
The source credibility model aims to elucidate on the trustworthiness and expertise of the
endorser. That is, the variables in this model argue that communication from a high-credibility
source has greater persuasive effects than communication from a low-credibility source
(Bergkvist, Hjalmarson, & Mägi, 2016). Trustworthiness, in particular, has been considered
essential in the digital environment, and perceiving an endorser as credible has been found to
lead to positive associations with the brands they endorse (Lu, Chang, & Chang, 2014a).
The model of physical attractiveness also valuable insight into perceptions of endorsers. Media
personalities who are socially attractive provide a better context for PSI, and perceived
similarity between a personality and the customer makes PSI more likely (Lee & Watkins,
2016). An adapted version, presented by Lee and Watkins (2016), used the concept of attitude
homophily for similarity and applied the concept of parasocial interaction to familiarity. This
model has been studied through these two variables: influencer similarity and influencer
familiarity.
2.2.1 Influencer Credibility
Credibility can influence beliefs, opinions, attitudes and behavior through internalization. It is
an attribute of believability and honesty observed by consumers (Wang, Kao, & Ngamsiriudom,
2017). Trustworthiness can be defined as "the degree of confidence in the communicator's intent

15
to communicate the assertions he considers most valid” (Hovland, Janis & Kelley, 1953 apud.
Ohanian, 1990, p. 4)
Perceived trustworthiness of an endorser leads people to believe that the messages being
conveyed by that endorser are also trustworthy. When consumers see the source of the messages
as credible, they will assume that the messages are also believable (Wang et al., 2017).
This variable has been widely studied in the celebrity endorsement context, as one of the key
variables in impacting customers’ perceptions of the endorsement and the outcomes of it, such
as purchase intention and brand attitude (Ohanian, 1990). Alongside expertise, it makes up the
source credibility model, one of two key theories utilized in literature to study the role of
celebrity endorsements (Ohanian, 1990).
Current literature supports the fact that positive evaluations of trustworthiness in endorsers
generated equally positive evaluations of the brand they were endorsing and its products
(Ohanian, 1990). Existing research has linked this variable to attitude change and persuasion,
and found that positive evaluations of trustworthiness positively impact purchase intentions and
attitude towards advertisements and brands (Choi & Rifon, 2012; Chung & Cho, 2017; Ohanian,
1990).
Chung and Cho (2017) also linked it to PSI in celebrity endorsement contexts. Their study
positively correlates celebrities’ social media usage to PSI, and finds that higher levels of PSI
have a positive outcome on perceived trustworthiness. Furthermore, their research discusses
self-disclosure, pointing out its effectiveness in forming PSI and impacting perceptions of
honesty.
Willingness to disclose personal details is “precious” (Chung & Cho, 2017) and interpreted as
an offer of friendship. Digital influencers’ social media presence is characterized by a measure
of closeness and willingness to divulge such details online (Lee & Watkins, 2016).
Participants in (Uzunoğlu & Misci Kip, 2014) study have identified trustworthiness as one of
the main sources of influencers’ power. That is, according to participants the fact that influencers
are perceived as trustworthy is what makes them potential sources of influence. Likewise,
“reliable” bloggers can bring prestige to brands.

16
Ohanian (1990) also finds that perceived honesty can generate a positive impact on endorsers’
recommendations:
“…a source who was perceived to be both an expert and trustworthy generated the most opinion change.
In fact, the trustworthy communicator was persuasive, whether an expert or not.” (Ohanian, 1990, p. 4)
Literature also finds that digital influencers are perceived as “one of us” by consumers
(Uzunoğlu & Misci Kip, 2014). These perceptions lead not only to a higher acceptance of their
recommendations, but also to more positive attitudes towards brands endorsed and
recommended by these individuals.
However, in spite of the fact that customers are already predisposed to accept digital influencers
as more trustworthy than marketing messages due to their role as fellow consumers (Lee, Lee,
& Hansen, 2017), the recent tendency towards making sponsored videos, combined with laws
that demand the disclosure of paid advertisement can negatively impact perceptions of
influencers and their credibility (Lu, Chang, & Chang, 2014b).
2.2.2 Influencer Attractiveness: Similarity
The physical attractiveness model postulates that the effectiveness of a message depends on
physical attributes of the source, one of them being similarity. Attractiveness has been widely
researched as an important factor in individuals’ judgment (Ohanian, 1990). Similarity refers to
perceived levels of commonalities between the source of the message and its receiver (Adnan
et al., 2017).
Similarity can be one of the drivers of PSI, as it requires a level of identification with the
message source. It is more likely for PSI to occur when a media user perceives the media
personality to be similar to themselves and others in their interpersonal network (Lee & Watkins,
2016).
Traditional theory relates the effectiveness of similarity to an attractive tendency towards people
who are “like” us (Adnan et al., 2017). Lee and Watkins (2016) use the term attitude homophily,
characterized as “the degree to which people who interact are similar in beliefs, education, social
status, and the like”.

17
According Lee and Watkins (2016), perceived similarities between a media user’s beliefs and
those of a media personality can generate and strengthen parasocial interaction, as well as an
increased likeliness that the media user will continue to interact with the personality.
Furthermore, their study found that this perception of similarity can also strengthen positive
brand perceptions through the development of PSI.
In social media interactions, similarity is revealed through self-disclosure (Chung & Cho, 2017).
The information digital influencers divulge in social media can become the basis for perceptions
of attitude homophily. Chung and Cho (2017) found that self-disclosure can be a strong driver
of PSI, as it makes interactions feel more personal, and enhances the sensation of closeness with
social media personalities.
Similarity, or homophily, pertains to the degree to which the media user identifies with the
influencer. Lee and Watkin’s (2016) study’s results indicate that homophily is a strong
antecedent for the development of PSI. As users perceive themselves as similar to digital
influencers, they become more likely to continue interacting with them and seeking out their
recommendations, thus driving a continuous relationship with these individuals.
This variable has been linked to purchase intention (Adnan et al., 2017) and attitude towards the
product (Bekk, Spörrle, Völckner, Spieß, & Woschée, 2017). Findings tend to point out that
perceived similarity leads to the consumer subconsciously mimicking the thoughts and feelings
of the endorser (Bekk et al., 2017).
Within the social media environment, similarity becomes more encompassing as a higher level
of information regarding the influencers is shared. That is, more personal details are disclosed,
leading to higher levels of similarity being perceived by media users (Chung & Cho, 2017).
2.2.3 Influencer Attractiveness: Familiarity
Traditionally, literature has defined familiarity as the extent that the message receiver recognizes
the endorser (Adnan, Jan, & Alam 2017). However, by applying the concept of parasocial
interaction to this construct, it has been adapted to refer to the extent that the message receiver
or media user feels familiar with a media personality and the “relationship” developed between
a media user and a media personality.
18
The development of PSI occurs when users are constantly or repeatedly exposed to a media
personality (Chung & Cho, 2017). It leads to an increasing sense of closeness, intimacy and
identification with this personality. PSI functions as an interpersonal involvement and
psychological interaction with media characters and personalities (Knoll et al., 2015).
Lee and Watkins (2016) cite Rubin, Perse and Powell (1985) to point out that PSI includes
seeking guidance from a media persona and seeing them as personal friends, wishing to meet
them or imagining being part of their social world. Knoll et. al (2015) recognize that the process
of developing PSI is comparable to real-life encounters and can start as “parasocial processing
including all cognitive, affective, and behavioral reactions to a media character” (Knoll et al.,
2015, p. 4).
The impression-formation process in PSI is considered similar what happens in real-life
encounters, and theory suggests that it is an unconscious process (Knoll et al., 2015).With
cognitive, affective and behavioral components, PSI is an encompassing variable that can be a
powerful aspect of understanding how users relate to media personalities (Knoll et al., 2015;
Lee & Watkins, 2016).
As an aspect of endorsement, familiarity has been linked to positive impacts on purchase
intentions and perceptions of brands (Adnan et al., 2017; Chung & Cho, 2017; Lee & Watkins,
2016). Both Chung and Chao (2017) and Lee and Watkins (2016) have found correlations
between social media presence (from celebrities and youtubers, respectively), PSI and brand
credibility, purchase intentions and brand perceptions.
According to Chung and Chao (2017), celebrity endorsers with social media presence that
disclose personal details (self-disclosure) tend to generate PSI, which, in turn, has positive
effects on their endorsement. Meanwhile, Lee and Watkins (2016) researched the impact of
developing PSI with Youtube vloggers and its outcomes. Their study found that PSI can
influence brand perceptions and lead to users’ perceptions of products aligning with vloggers’
reviews.
Furthermore, familiarity as a PSI construct has been found to lead users to align their opinions
with media personalities’ reviews and recommendations. That is, when a user develops PSI with

19
a media personality, their opinions tend to follow those of this media personality (Lee &
Watkins, 2016).
2.3 Social Media Engagement
This subsection will detail variables relating to social media engagement. Engagement is a key
part of the experience with digital influencers, as the relationship between users and influencers
develops from the interactions between them. Chung and Cho (2017) found that continuous
engagement through social media, mediated by self-disclosure fostered the development of
parasocial interaction between celebrities and users, and positively impacted celebrity
endorsements.
Three variables were considered for social media engagement: customer social participation,
which pertains to levels of emotional connection with social networking sites and other social
media users (Ellison, Steinfield, & Lampe, 2007), user generated content, which involves how
users interact with content provided by other users (Khan, 2017; Vickery & Wunsch-Vincent,
2007), and active participation, which pertains to how actively users engage in social media by
creating content of their own (Khan, 2017).
These have been considered an encompassing set of variables pertaining to the engagement
experience, as take into account emotional attachment, the content generated by users and the
creation of original content by users. Considering studies such as Chung and Cho’s (2017) and
Lee and Watkins’ (2016), which have connected interaction and positive impacts on
endorsement and brand perceptions.
2.3.1 Customer Social Participation
Customer social participation in offline environments has been a traditional topic of study within
marketing literature, and its role in online interaction has been a topic of increasing interest for
academic researchers (Chae & Ko, 2016). Social media is characterized by interactions between
the sender and the receiver (Chae & Ko, 2016). It provides an environment through which
people can communicate and interact, share information and create new connections in spite of
location, and it has simplified the process of participation for customers.
20
Social networking sites (SNSs) can both support the maintenance of preexisting social
connections or help the creation of new connections (Ellison et al., 2007).
Ellison et al. (2007) acknowledge that social networking sites have given way to a new
phenomenon. These websites allow communities to form around shared interests, as opposed to
shared geography, meaning that barriers previously caused by location have become less
impeding.
This has given way to a new form of socialization, which happens firstly online, then offline,
and research points out that relationships that begin online, usually develop to face-to-face
meetings (Ellison et al., 2007).
Ellison et al. (2007) also refer to customer social participation as the degree of personal
emotional connection users have with social networking sites and how integrated the usage of
these sites is in their lives.
Chae and Ko (2016) recognized the differences amongst scholars to achieve a single definition
of customer social participations. In their research, they chose to conceptualize customer social
participation with a focus on co-creation:
“…an effort to achieve co-creation of values through required but voluntary interactive participation of
the customers in service production and delivery process in social media.” (Chae & Ko, 2016, p. 3805)
Chae and Ko’s (2016) study sought to explore how customer social participation happens in
SNSs. Their findings include seven types of customer social participation, which the authors
categorized in three main groups of interactions: customer-customer, customer-brand and
customer-media.
21
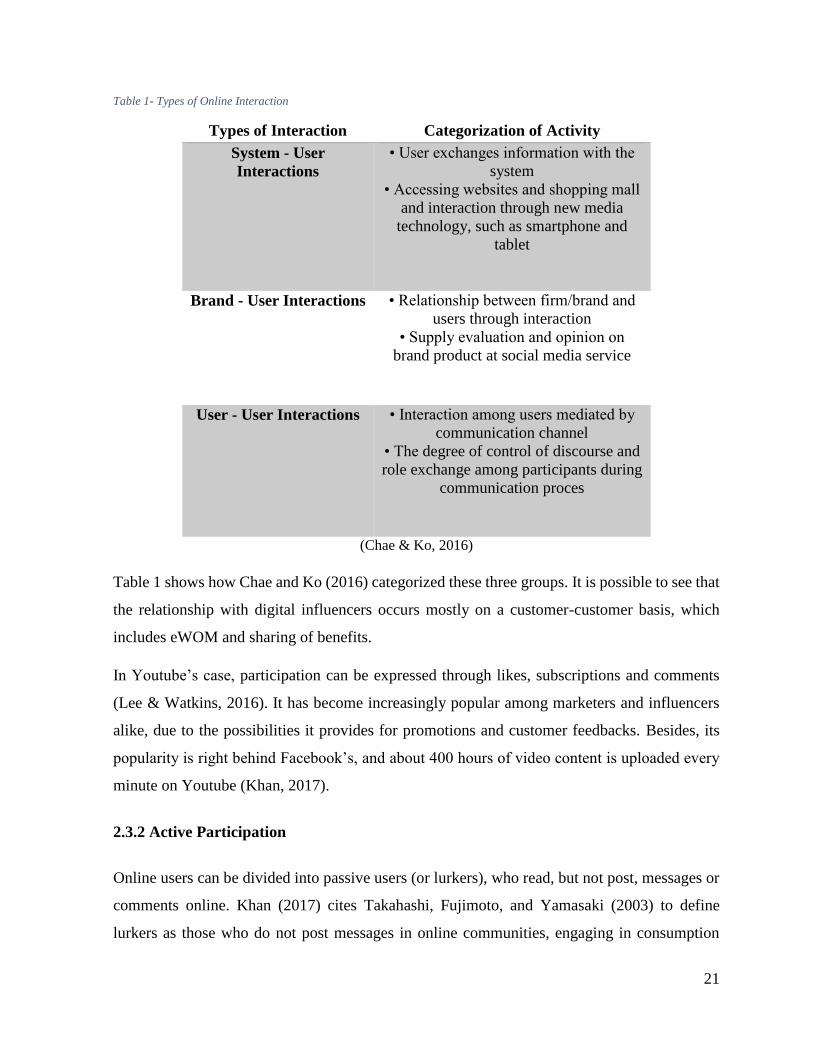
Table 1- Types of Online Interaction
Types of Interaction Categorization of Activity
System - User
Interactions
• User exchanges information with the
system
• Accessing websites and shopping mall
and interaction through new media
technology, such as smartphone and
tablet
Brand - User Interactions • Relationship between firm/brand and
users through interaction
• Supply evaluation and opinion on
brand product at social media service
User - User Interactions • Interaction among users mediated by
communication channel
• The degree of control of discourse and
role exchange among participants during
communication proces
(Chae & Ko, 2016)
Table 1 shows how Chae and Ko (2016) categorized these three groups. It is possible to see that
the relationship with digital influencers occurs mostly on a customer-customer basis, which
includes eWOM and sharing of benefits.
In Youtube’s case, participation can be expressed through likes, subscriptions and comments
(Lee & Watkins, 2016). It has become increasingly popular among marketers and influencers
alike, due to the possibilities it provides for promotions and customer feedbacks. Besides, its
popularity is right behind Facebook’s, and about 400 hours of video content is uploaded every
minute on Youtube (Khan, 2017).
2.3.2 Active Participation
Online users can be divided into passive users (or lurkers), who read, but not post, messages or
comments online. Khan (2017) cites Takahashi, Fujimoto, and Yamasaki (2003) to define
lurkers as those who do not post messages in online communities, engaging in consumption

22
(and not productive or participatory) behavior. These users make up about 90% of online
communities (Khan, 2017)
Active participation, on the other hand, involves user-to-user and user-to-content interaction,
such as commenting, sharing, liking and engaging actively in social media. Khan (2017) also
points out Shao’s (2009) study, in which the author divides active participation in participation
and production. However, active participation includes both of those constructs, and can also
refer to those who create content, such as influencers.
On Youtube, engagement is manifested through liking, disliking, commenting, sharing,
uploading and subscribing to videos (Khan, 2017). Active participation, thus, effectively
includes engagement and interaction, which are the key aspects of developing PSI (Lee &
Watkins, 2016).
2.3.3 User Generated Social Media Content
Social media has made it possible for users to create, share and view content (Ellison et al.,
2007). However, the very concept of social media makes it dependent of this content, and users
have a significant role in the maintenance and evolution of social networking sites. User
generated social media content is defined as “the various forms of media content that
are publicly available and created by end-users” (Kaplan & Haenlein, 2010).
Youtube, in particular, is characterized as a content-sharing site (Khan, 2017), which means that
it is highly dependent on the creation of this content by its users, mainly in the form of videos,
but also in comments. Khan (2017) found that leaving comments in videos is a strong predictor
of social interaction in this platform.
Vickery and Wunsch-Vincent (2007) sought to define user generated content (UGC). Their
research found that user-generated content depends on three distinct characteristics:
It must be published;
It requires creative effort;
And it is created outside professional routines and practices.
23
Kaplan and Haenlein (2010) also highlight the fact that UGC has evolved from its beginnings
in the early 80s. Social, technological and economical innovations have led to the development
of a generation of individuals who have been brought up around the internet and social media
sites, and whose content is very different from what was observed in the 80s.
Khan (2017) supports that, pointing out that Youtube, in particular, allows for both passive and
active engagement by its users. It encourages both the consumption of content, in the form of
watching videos, and participatory and interactive acts such as uploading videos, commenting,
liking and disliking.
Digital influencers are, first and foremost, content creators. However, participatory acts, such
as commenting and interacting with these individuals also generates user content (Khan, 2017).
User-generated content is, thus, both the backbone of digital influencer existence and the result
of online interactions in social networking sites.
User generated content has given way to collaborative projects and created new opportunities
for co-creation between users and companies (Ashley & Tuten, 2015). When companies
properly evaluate and understand the value of their customers, learning how to work alongside
them in social media, it creates both opportunities for collaboration and could cause positive
evaluations for the companies (Ashley & Tuten, 2015).
2.4 Sponsorship
Online reviews have been studied and proved to have an impact on swaying the opinions and
convincing possible customer of purchasing products or trying out brands, especially as they are
often seen as a fellow consumer’s opinion, therefore unbiased and honest (Hwang & Jeong,
2016). However, as social media evolves and companies become more involved in social media
platforms, there’s a rising trend of seeking out reviews, partnering up with social media
personalities and using their opinions as promotional tools.
Sponsored videos, in the case of Youtube, have become a common type of partnership between
companies and influencers. Due to the commercial nature of such partnerships, though, the
United States’ Federal Trade Commission (FTC) has mandated that sponsorship and paid

24
advertisement posts are disclosed, a demand that has been appearing on multiple other countries
as well (Hwang & Jeong, 2016).
Studies, such as Hwang and Jeong’s (2016) and Lu, Chang, and Chang's (2014) have sought to
research the effects of disclosing sponsorship, especially as it may sway perceptions of
credibility consumers have of digital influencers.
Social media personalities are highly valued for their status as “fellow consumers” (Uzunoğlu
& Misci Kip, 2014), and the commercial act of sponsorship might have negative effects on this
perception (Hwang & Jeong, 2016).
On the other hand, product fit was also chosen as a variable because it may sway the attitude
toward sponsored content. Kamins and Gupta (1994) used the matchup hypothesis to measure
the impact of product type on attitude towards celebrity sponsorship. Their findings point out
that a higher degree of congruence between the sponsor and the product improves the
believability of the sponsor.
Therefore, this section will showcase theories regarding media users’ attitude towards sponsored
content and perceived fit between influencers and products they sponsor, as both can possibly
impact consumers’ relationship with influencers.
2.4.1 Attitude Towards Sponsored Content
Reviews are a popular type of content on social media platforms. Users share their experience
and thoughts on brands, products and services, which can be widely different depending on
usage, expectation and personal preference (Lu et al., 2014). These online reviews are often seen
as more trustworthy than content created by the company, such as ads and company-generated
social media information, as they are perceived as users’ unbiased experiences (Erkan & Evans,
2016). Consumers can, then, easily access a multitude of information on products, companies,
services and brands.
The popularity of such reviews are rooted in the same kind of trust that people have in WOM,
which has been known to have a higher impact on purchase intention than commercial messages
(Awad & Ragowsky, 2008; Boerman, Willemsen, & Van Der Aa, 2017). Traditionally,
leveraging WOM has been done through press releases, expert and celebrity endorsement
25
(Forrest & Cao, 2010). However, as technology evolved and made it possible for eWOM to
develop, users’ advocacy for businesses, brands and services has acquired a new dimension,
attaining global impact.
Marketers, then, now look to social media and see new strategical opportunities (Forrest & Cao,
2010). Sponsored recommendation posts have become a popular marketing tool. Marketers
identify key users and content creators and compensate them for creating content reviewing or
using certain products.
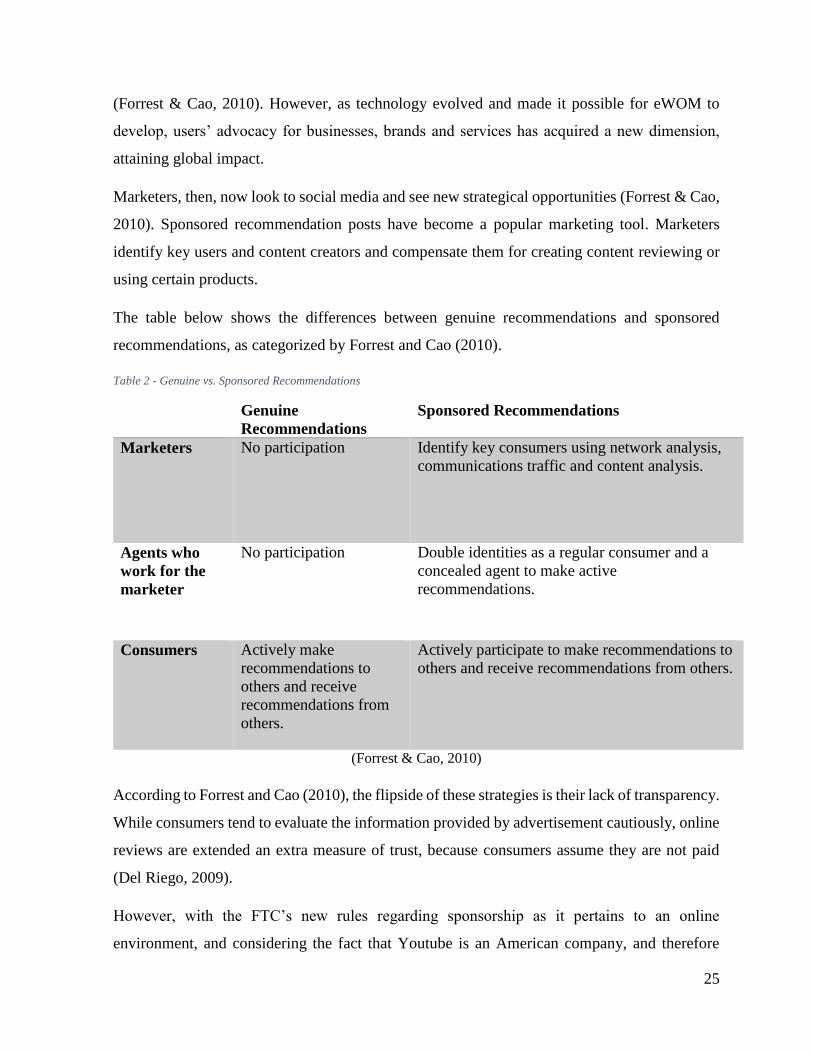
The table below shows the differences between genuine recommendations and sponsored
recommendations, as categorized by Forrest and Cao (2010).
Table 2 - Genuine vs. Sponsored Recommendations
Genuine
Recommendations
Sponsored Recommendations
Marketers No participation Identify key consumers using network analysis,
communications traffic and content analysis.
Agents who
work for the
marketer
No participation Double identities as a regular consumer and a
concealed agent to make active
recommendations.
Consumers Actively make
recommendations to
others and receive
recommendations from
others.
Actively participate to make recommendations to
others and receive recommendations from others.
(Forrest & Cao, 2010)
According to Forrest and Cao (2010), the flipside of these strategies is their lack of transparency.
While consumers tend to evaluate the information provided by advertisement cautiously, online
reviews are extended an extra measure of trust, because consumers assume they are not paid
(Del Riego, 2009).
However, with the FTC’s new rules regarding sponsorship as it pertains to an online
environment, and considering the fact that Youtube is an American company, and therefore
26
subject to implement such policies, there has been an effort to disclose sponsorship (Forrest &
Cao, 2010). This can affect media users’ perceptions of influencers, especially their perception
of influencers’ credibility and status as consumers, placing them in the same categories as
advertisers or celebrity endorsers (Boerman et al., 2017; Hwang & Jeong, 2016).
The rise of digital influencers and their popularity led to the possibility of creating online content
as a full time job, paid through the creation and publication of sponsored content, partnerships
with brand and companies, and creation of partnerships with lines and even new brands
altogether (Lee & Watkins, 2016).
However, as social media becomes a profitable business for content creators, these
compensations can generate negative perceptions of their role as advertisers and opinion leaders,
putting in jeopardy their effectiveness in endorsing, recommending and reviewing products
(Hwang & Jeong, 2016).
Hwang and Jeong (2016) sought to study the effect of sponsorship disclosure on consumers’
response to the blog post. These authors recall studies in which sponsorship disclosure has had
a negative effect on consumers’ attitude towards the sponsored brand. Meanwhile, Carr and
Hayes (2014) studied how different levels of sponsorship disclosure (partial versus total
disclosure) impacted perceived credibility of bloggers.
Carr and Hayes’ (2014) study found that partial sponsorship disclosure (e.g. implied, impartial,
inequivocal, possibly deceitful) disclosure had more negative impact on media users’ perception
of the bloggers’ credibility, as opposed to explicitly disclosed sponsorship, which made users
perceive the bloggers as more credible.
Likewise, Heang and Jeong (2016) found that the negative impact of disclosing sponsorship was
counteracted by a simultaneous disclosure of “honest opinions”. That is, while disclosing
sponsorship indeed had negative effects on perceived trustworthiness, an influencers’ claim that
the opinions disclosed were honest could counteract that, inducing more favorable attitude
towards the sponsored content.

27
2.4.2 Perceived Fit
Perceived fit is a variable which has been widely studied as relating to celebrity sponsorship,
brand extension, attitude towards advertisement and purchase intention, and has also appeared
on past studies as congruence or similarity (e.g. (Kowalczyk & Royne, 2013; Lu et al., 2014;
Srivastava & Sharma, 2012). Aaker and Keller (1990) conceptualized perceived fit as it
pertained to brand extension. According to these authors, perceived fit is how a consumer
perceives the relation between brand extension and the established brand.
In this dissertation, perceived fit refers to the perceived connection between influencers and the
products they endorse or recommend. In past studies, the relationship between celebrity
endorsers and the products they endorse has been studied through the “match-up” hypothesis, a
theory which postulates “that the visual imagery contained in the advertisement conveys
information over and above the information contained in explicit verbal arguments”
(McCormick, 2016, p. 40).
In endorsement literature, that means that when the desired image of the brand fits with what is
associated with the endorser (or when the expectations/perceptions customers have of the
celebrity fit with the desired perception of the brand or product) (McCormick, 2016).
“Ultimately, consumers’ acceptance of the endorsement starts before the celebrity is even selected, and
the acceptance of the endorsement might only occur when the consumer perceives the images of the
celebrity to be favorable” (McCormick, 2016, p. 40)
Kamins and Gupta (1994) looked at the relationship between spokesperson and product type,
using the matchup hypothesis perspective. In their study, they state that higher degrees of
congruence between the endorser and the product lead to more effective endorsements. This is
due to the fact that congruence has been found to affect both identification and internalization
processes (Kamins & Gupta, 1994). That is, the processes that lead consumers to accept, identify
with and believe in endorsers.
McCormick's (2016) study also confirms this hypothesis, adding that endorser-product fit also
has an impact on attitude towards advertisement and towards the brand, and that the matchup
hypothesis can be applied even to unfamiliar celebrities.
28
As social media influencers effectively adopt the role of endorsers, it is possible to infer that the
findings of existing literature can be applied to these individuals as well. Furthermore, existing
literature on perceived fit has found links between perceived fit and attitude towards
advertisement, which serves as a basis for a link between perceived fit and attitude towards
sponsored content, which, in spite of relaying on influencers’ opinion or usage of products, can
still be considered a type of advertisement.
2.5 The Impacts of Digital Influencers
The following section will conceptualize and present findings regarding the three variables
impacted by the presence and actions of digital influencers. Attitude towards brand, brand
attachment and purchase intention were chosen due to their role as important variables in
predicting and influencing consumer behavior (Bagozzi & Dholakia, 2006; Spears & Singh,
2004; Yao et al., 2015).
2.5.1 Attitude Towards Brand
Marketing research has long focused a lot of its attention on figuring out how to determine and
influence its customers’ attitudes (Spears & Singh, 2004). That is because attitude is a good
predictive of consumer behavior, which is ultimately what marketers want to impact (Spears &
Singh, 2004). Attitude towards the brand is one of the main topics of study within this subject,
and its importance has been amply studied by marketing researchers.
Spears and Singh (2004, p. 55) center their conceptualization of attitude towards brand around
Mitchell and Olson’s (1981, p. 318) definition of this construct: “an individual’s internal
evaluation of the brand.” This differs attitude from attachment or feelings, as it conceptualizes
this construct as an internal process of evaluative nature (i.e. it has both degrees of goodness
and badness). Posavac et al. (2014) define attitude as an integration of multiple evaluative
beliefs, but that it may be affected by a number of inputs.
Establishing favorable association with a product is how firms seek to create a positive attitude
towards the brand, because this concept is often related to two main constructs: attitude towards
advertisement, and purchase intention (Mitchell & Olson, 2000; Spears & Singh, 2004).

29
Furthermore, much of the existing research focuses on attitude towards the ad as an influencer
of attitude towards the brand, or on both of these constructs as influencers of purchase intention
(Mitchell & Olson, 2000; Spears & Singh, 2004). Suh and Yi (2006) recall Mackenzie et al.’s
research, which showed these connections through the comparison of four theoretical models of
advertisement.
Bergkvist et al., (2016) look at the relationship between attitude towards celebrity endorsers,
attitude towards endorsement and attitude towards the brand. Their findings indicate that
consumers have a more positive attitude towards endorsements that seem genuine, as opposed
to driven by money, and that attitude towards the endorser has a significant effect on attitude
towards brand.
“This suggests that consumers make an overall assessment of a particular endorsement and that it is this
assessment, rather than previously studied factors, that directly influences their brand attitudes.”
(Bergkvist et al., 2016, p. 181)
This points towards the possible existence of a significant relationship between consumers’
attitudes towards influencers and attitude towards brand. Given influencers’ role as online
spokespersons, it is possible to infer that consumers’ relationship with these people will also
influence the relationship between consumers and endorsed brands.
2.5.2 Brand Attachment
Brand attachment refers to the positive feelings and connection customers feel towards a brand
(Yao et al., 2015). Park et al. (2010) formally conceptualizes it as “the strength of the bond
connecting the brand with the self”. These feelings can generate loyalty and increase the value
of a brand, leading to willingness to pay higher prices and actively seek out a specific brand.
Yao, Chen, and Xu (2015) note the two different sides in attachment: emotional and cognitive
connection. Citing Thomson et al. (2005), Yao, Chen, and Xu (2015) note that while cognitive
links are formed between brands and customers, forming a brand-self connection, it is emotional
in nature.
30
Park et al. (2010) also use the same concepts to explain the connection between the brand and
the self, but further it, adding that this connection can elicit feelings such as anxiety from being
separated from the brand, happiness from its proximity and pride by displaying the brand.
However, these authors also point out that attachment is made up of more than emotions. That
is, there is a rich cognitive background to attachment, which includes memories, previous
experience with the brand, thoughts and mental representations of the brand.
Though attitude and attachment are both psychological in nature, attitude is characterized by its
ability to range from positive to negative, and it’s more a reaction to a brand based on personal
evaluation (Spears & Singh, 2004). Meanwhile, attachment requires a higher level of personal
connection and is comprised solely of positive feelings (Yao et al., 2015).
That means that while attitude towards the brand has been significantly linked with purchase
intention, brand attachment may also be a good predictor of it, if not a better one. Due to the
positive nature of attachment and the connection it generates, it not only means a stronger,
emotional link with a brand, but can also lead to long term loyalty, and the usage of a brand as
an expression of the self (Yao et al., 2015).
Celebrity endorsement literature has provided insight into possible connections customers find
between themselves and the endorsers, which make the endorsement more effective and
customers more likely to acquire the products (McCormick, 2016). Brand attachment thrives on
a similar identification with the brand, which elicits feelings akin to those in interpersonal
relationships (Yao et al., 2015).
Lee and Watkins (2016) found that developing PSI with digital influencers (namely Youtube
vloggers) led to more positive perceptions of luxury brands. Connections created with digital
influencers could, thus, lead to creating or harnessing strong ties of attachment with the brands
they recommend or endorse (Lee & Watkins, 2016; Yao et al., 2015).
2.5.3 Purchase Intention
Antecedents of purchase intention have been widely studied by marketing researchers, who seek
to impact more consumers through different marketing strategies. This variable is one of the key

31
subjects of Marketing, as it can be used as a predictive of sales numbers and a basis for studying
loyalty, repurchasing and finding out what actually drives customers to purchase a product.
Citing Eagly and Chaiken (1993), Bagozzi and Dholakia (2006) define intention as a motivation
(in the sense of making a conscious plan) to exert a determined action. Spears and Singh (2004)
defined purchase intention as “an individual’s conscious plan to make an effort to purchase a
brand”. Their definition is very encompassing of customers’ planning and conscious decision to
acquire a product, service or brand.
This differs from attitude or attachment in the sense that it encompasses an effort to carry out a
certain behavior (Spears & Singh, 2004). This characteristic is also what makes this variable
predictive of consumer behavior, thus, essential in understanding an important outcome for any
marketing variable.
This set of characteristics make purchase intention an essential variable in understanding
consumption behavior. Unlike the evaluation present in attitude towards the brand (Spears &
Singh, 2004) or the positive feelings found in attachment (Yao et al., 2015), purchase intention
includes a conscious plan to engage in such behavior, whether immediately or not (Bagozzi &
Dholakia, 2006).
The relationship between attitude towards brand and purchase intention was amply studied by
Spears and Singh (2004), who sought to create valid measures for these variables Their study
discusses the correlation between these variables, namely how attitude can impact intention, and
how both of these constructs have been widely discussed in marketing literature as
complementary variables.
Additionally, Park et al. (2010) analyzed the effects of brand attachment and their results point
to the existence of a relationship between attachment and purchase intention. That is because
attachment represented by both brand–self connection and prominence is a good predictor of
consumer behavioral intention (Park et al., 2010).

32
3. Conceptual Model and Hypotheses
The following chapter will present the conceptual model proposed as a basis for this empirical
study. Then, all of the hypotheses of the study will be introduced, along with the theoretical
basis that support them.
3.1 Conceptual Model
The first step in building a conceptual model was defining the main research problem. Since the
impact of influencers is a relatively new area of marketing, there is a wide variety of possibilities
regarding its study. Considering brand attachment, attitude towards brand and purchase
intentions are key variables in marketing (Park et al., 2010; Spears & Singh, 2004), these were
selected as possible outcomes of digital influencers being used in marketing.
Therefore, the main research problem was defined as: what is the impact of digital influencers
on attitude towards brand, brand attachment and purchase intention?
The author then identified key variables and studies which could support the main research
objective. Studies on celebrity endorsement (e.g. Bergkvist et al., 2016; Khan, 2017; Ohanian,
1990), consumer participation in social media (e.g. Chae & Ko, 2016; Erkan & Evans, 2016;
Khan, 2017; Vickery & Wunsch-Vincent, 2007), brand attachment (e.g. Park et al., 2010),
purchase intention and attitude towards brand (e.g. Spears & Singh, 2004), sponsorship and
sponsored content (e.g. Boerman et al., 2017; Hwang & Jeong, 2016) and, finally, influence and
influencers (e.g. Brown & Hayes, 2008; Lee & Watkins, 2016; Uzunoğlu & Misci Kip, 2014)
were then analyzed to define which variables would be taken into consideration in this research.
From this review the concepts active participation, customer social participation and user
generated social media content were identified as possible antecedents of the interaction with
digital influencers. Credibility, similarity and familiarity are used to determine customers’
perceptions of influencers. Though these variables are commonly used for celebrity endorsers,
the role of influencers as endorsers makes it possible to use the same variables to assess
consumers’ perceptions of them.
33
Sponsorship is a key part of social media marketing, and one of the most explicit types of
interactions between brands and influencers (Boerman et al., 2017; Hwang & Jeong, 2016).
Under American law, influencers are obligated to disclose when a video or post is sponsored by
a company or brand (Del Riego, 2009). However, this disclosure might sway users’ perceptions
of the influencer or the brand.
Additionally, the perceived fit between the influencer and products that appear on their pages
might also impact how users react to endorsements (Hwang & Jeong, 2016; Verhellen, Dens, &
Pelsmacker, 2016). Thus, attitude towards sponsored content and perceived fit between the
influencer and sponsored products have been added as important variables that might impact
users’ relationship with influencers.
Finally, attitude towards brand, brand attachment and purchase intention were considered as
consequences for their importance in marketing literature, and because these three variables are
considered good predictors of customer behavior.
The secondary research objectives were then defined as:
Propose a conceptual model to understand the impact of digital influencers on attitude towards
brand, brand attachment and purchase intention.
Verify whether the construct customer social participation has a positive correlation with
customers’ perceptions of influencers, represented by the constructs credibility, familiarity and
similarity.
Verify whether the construct user-generated social media content has a positive correlation with
customers’ perceptions of influencers, represented by the constructs credibility, familiarity and
similarity.
Verify whether the construct active participation has a positive correlation with customers’
perceptions of influencers, represented by the constructs credibility, familiarity and similarity.
Verify whether consumer’s attitude towards sponsored content has an impact on digital
influencers’ credibility.
Verify whether the perceived fit between influencers and the products they sponsor can
positively impact consumers’ attitude towards sponsored content.
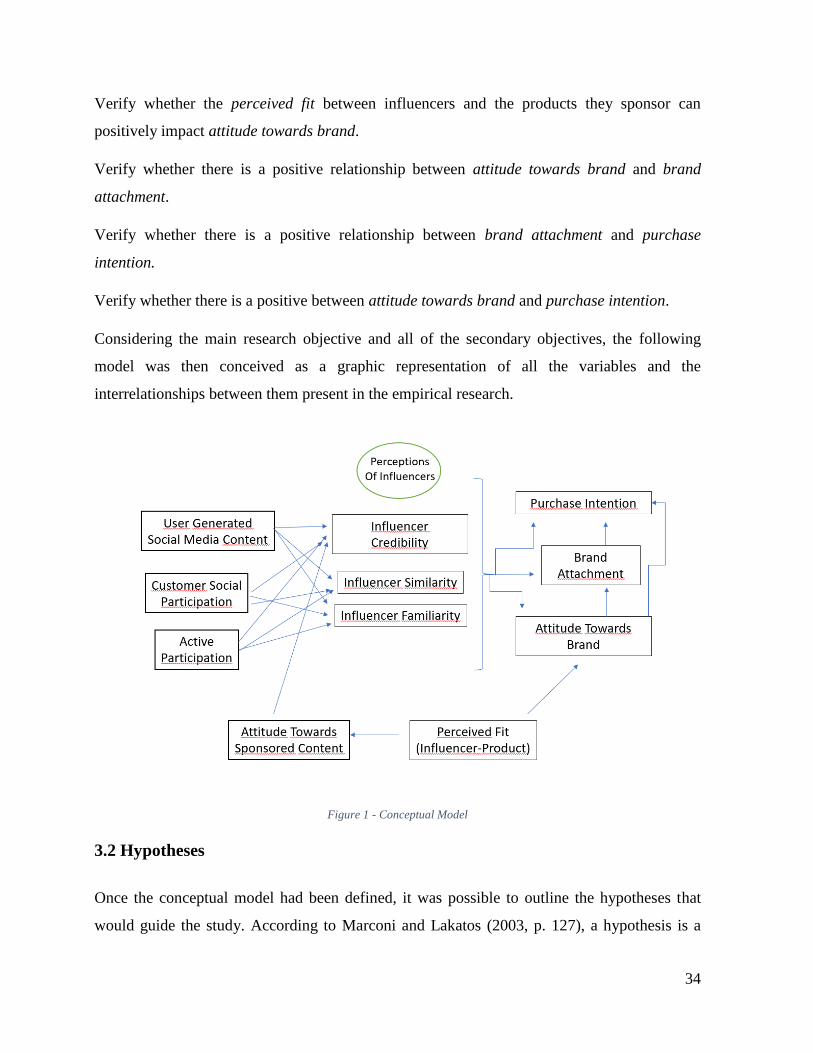
34
Verify whether the perceived fit between influencers and the products they sponsor can
positively impact attitude towards brand.
Verify whether there is a positive relationship between attitude towards brand and brand
attachment.
Verify whether there is a positive relationship between brand attachment and purchase
intention.
Verify whether there is a positive between attitude towards brand and purchase intention.
Considering the main research objective and all of the secondary objectives, the following
model was then conceived as a graphic representation of all the variables and the
interrelationships between them present in the empirical research.
Figure 1 - Conceptual Model
3.2 Hypotheses
Once the conceptual model had been defined, it was possible to outline the hypotheses that
would guide the study. According to Marconi and Lakatos (2003, p. 127), a hypothesis is a

35
“supposed, probable and provisory answer to a research problem”. Additionally, these authors
also argue that the hypotheses must have a theoretical basis that support them.
Using the directives proposed by Marconi and Lakatos (2003) and existing literature on the
theme, the author has formulated a set of hypotheses, presented below.
3.2.1 Engagement and Perceptions of Influencers
As defined in the literature review, active participation refers to users of social media who leave
comments, like/dislike content and share content (Khan, 2017). Interactivity is a major part of
social media and active participation is one of the main aspects of interaction. Chae and Ko
(2016) argued that social media interaction could be classified in three different ways, customer-
customer, customer-brand and customer-media.
According to Chae and Ko (2016), voluntary, active participation by users in social media must
be motivated. When motivated, users actively seek and provide information to other users
regarding brands and products, and this information exchange can influence their behavior and
participation activities (Chae & Ko, 2016).
Chung and Cho (2017) also found that interaction and exchanges with celebrities in social media
has a significant impact on celebrity endorsement and parasocial relationships. According to
these authors, frequent messages and exchanges in social media can strengthen the sensation of
proximity with social media personalities. This points us to the existence of a relationship
between active participation and familiarity.
H1: There is a positive relationship between active participation and influencer familiarity.
Actively participating in social media can also influence users’ perceptions of influencer
credibility. Khan (2017) sought to discover antecedents of active participation and engagement
on Youtube. The findings of this study point out that social interaction and information seeking
are two key aspects of active participation in this social media platform.
Lee et al. (2017) did find that user generated advertising was more favorably viewed than
advertising created by the company. Additionally, (Boerman et al., 2017) found that sponsored
posts that had been flagged as such on Facebook were less likely to generate eWOM.

36
These findings point towards the existence of a relationship between users’ active participation
in social media and positive perceptions of influencer credibility, which is further supported by
Chung and Cho’s (2017) findings of correlations between social media participation and
positive evaluations of source trustworthiness.
H2: There is a positive relationship between active participation and influencer credibility.
Chung and Cho (2017) found strong ties between social media interaction and positive
evaluations of celebrities present in social media. According to these authors, social media
interaction between fans and celebrities generates PSI ad strengthens users’ positive evaluations
of these celebrities and their endorsements.
Self-disclosure, or the sharing of personal information, is interpreted as a sign of friendship,
which enhances the feeling of similarity between users and celebrities in social media. Lee and
Watkins (2016) also put attitude homophily, or similarity, as an antecedent to PSI, formed by
identifying similar traits between oneself and a social media personality.
These findings point out the existence of a positive relationship between active participation and
perceptions of influencer similarity.
H3: There is a positive relationship between active participation and influencer similarity.
Customer social participation is defined as “an effort to achieve co-creation of values through
required but voluntary interactive participation of the customers in service production and
delivery process in social media” (Chae & Ko, 2016, p. 3805). According to the results found
by Chae and Ko (2016), participation motivation and customer social participation are
significantly tied.
Furthermore, Ellison et al. (2007) found links between participation intensity (i.e. the strength
of customer social participation), social capital and intensity of engagement with other users and
organizations.
Seeing as social interaction has been identified as one of the key motives behind participation
in social media (Khan 2017), and social interaction has been positively linked with PSI (Lee &
Watkins, 2016), it is possible to infer that there is a bridge between customer social participation
and influencer familiarity.

37
H4: There is a positive relationship between customer social participation and influencer
familiarity.
Social participation in social media has been tied to higher levels of engagement with other
users, which means that users with higher degrees of social participation are more likely to
engage with user generated content (Ellison et al., 2007).
Chung and Cho (2017) also found positive links between interaction in social media and positive
evaluations of source credibility. Specifically, celebrities that perform self-disclosure and
interact with users are seen as more trustworthy than those that don’t, which also influences the
response towards their endorsements.
Additionally, (Yuan, Kim, & Kim, 2016) found that motivations to use social network can
influence whether customers form PSI and influence their perceptions of celebrities.
These findings all point towards the existence of the relationship proposed in hypothesis 5.
H5: There is a positive relationship between customer social participation and influencer
credibility.
Lee and Watkins (2016) state that users tend to interact more with those who are similar to them,
as these interactions allow them to confirm their own beliefs. This dissertation proposes that
higher degrees of customer social participation lead to more positive perceptions of influencer
similarity.
Chung and Cho (2017) seem to support that correlation, as their findings indicate that exchanges
with celebrities through social media enhance the feeling of intimacy and proximity, especially
if they are mediated through self-disclosure.
Hypothesis 6 is further supported by the findings of (Yuan et al., 2016) that users who feel
strongly motivated to use social media for entertainment and building relationships are more
likely to form PSI.
H6: There is a positive relationship between customer social participation and influencer
similarity.

38
Credibility is the key variable in the source credibility model and has been proven to affect
receivers’ acceptance of messages, and one of the main aspects of credible eWOM messages
(Lee et al., 2017).
Hautz, Füller, Hutter, & Thürridl (2014) studied the role of user generated content on source
credibility and found that viewers tend to see videos made by fellow consumers as more credible
than firm-generated advertising. The ability for interaction is pointed by Lee et al. (2017) as an
aspect that facilitated the validation of the source’s credibility. Furthermore, Hautz et al. (2014)
also linked user generated content to credibility, and found a positive connection between these
variables.
The results found by Hautz et al. (2014) support the connection between user generated content
and credibility as well as the connection with expertise, especially when compared to viewers’
perceptions of these variables in agency-generated videos.
H7: There is a positive connection between user generated social media content and
influencer credibility.
Similarity is one of the key variables in the source attractiveness model, often used alongside
the source credibility model when studying celebrity endorsers. Studies state that consumers
that perceive similarities between themselves and the endorser are more likely to attract these
customers and sway their perceptions of the products being endorsed.
Lee and Watkins (2016) sought to study the role of Youtubers in influencing consumers’
perceptions of luxury brands, as used attitude homophily as one of their variables. Similarity
and attitude homophily are used interchangeably in this dissertation because attitude homophily
is defined as “the degree to which people who interact are similar in beliefs, education, social
status, and the like” (Eyal & Rubin, 2003, p. 80 apud. Lee & Watkins, 2016, p. 5755).
Though no studies were found that linked similarity to user-generated content, this dissertation
argues that there is a bridge between these two concepts, as participation in social media and
creation and consumption of UGC will most likely affect users’ perceptions of content creators,
especially in terms of how similar users see themselves to influencers.
H8: There is a positive connection between user generated social media content and
influencer similarity.
39
Parasocial interaction, or PSI, explains the interpersonal relationship between users and media
personalities (Lee & Watkins, 2016).
According to Lee and Watkins (2016) PSI is a perceived reciprocal friendship between a media
user and a media personality. It is used as a measure for familiarity because it elicits the same
kind of feeling that a user understands influencers in an intimate way, as if they were flesh and
blood friends or family.
User generated social media content is linked to familiarity because in order to elicit these
feelings, a user must consume influencers’ content and develop an ongoing relationship with
these personalities. Chung and Cho (2017) seem to support this relationship, by finding that
higher levels of social media interaction can lead to PSI forming between celebrities and users.
H9: There is a positive connection between user generated social media content and
influencer familiarity.
3.2.2 Sponsorship
Perceived fit, also called congruence, has been widely studied in marketing literature, originally
as the consistency between parent brands and brand extensions (Aaker & Keller, 1990). As it
pertains to endorsements, fit refers to the level of congruence or consistency between an
endorser and the product, brand or service they are endorsing (Bergkvist et al., 2016).
Significant ties have been found between perceived fit and purchase intentions and attitude
towards the endorsement. Meanwhile, a perceived lack of fit between the influencer and the
brand may lead to negative effects on brand evaluation (Bergkvist et al., 2016).
This dissertation argues that perceived fit also has a positive impact on attitude towards
sponsored posts. A connection between fit and endorsement effectiveness has been corroborated
by Bergkvist et al. (2016). These findings support the existence of a relationship between
positive evaluations of perceived fit between influencers and brands and users’ attitude towards
influencers’ sponsored content.
H10: There is a positive relationship between perceived fit and attitude towards sponsored
content.

40
Credibility is considered one of the key concepts that lead users to seek and follow bloggers’
recommendations (Hsu, Lin, & Chiang, 2013). Positive evaluations of a source’s credibility can
lead to increased acceptance of their recommendations and content. However, sponsorship
disclosure can affect these evaluations (Lu et al., 2014).
Lu et al. (2014) found connections between source credibility and attitude towards sponsored
recommendations, and link possible skepticism to the same kind of skeptical attitude consumers
have towards advertisement.
Hwang and Jeong (2016) found that sponsorship disclosure can negatively impact the credibility
of online recommendations, even if such impacts can be partially counteracted by a
simultaneous claim of honesty in any opinions and recommendations given in the sponsored
content.
This dissertation argues that users’ attitude towards sponsored content has an impact on
influencer credibility because it can be viewed as a non-personal, paid promotion, which, in
turn, would affect the personalized approach influencers have as fellow consumers.
H11: Media users’ attitude towards sponsored content has an impact on the influencer
credibility.
3.2.3 Impacts of Digital Influencers
Credibility has been found to have very strong ties to purchase intention (Adnan et al., 2017;
Wang et al., 2017). According to past studies, perceptions of an endorser as credible can not
only strengthen the effectiveness of their recommendations, but also translate into positive
perceptions of the brand and lead to a higher degree of trust being placed on the brand (Ohanian,
1990).
Ohanian (1990) also states that trustworthiness can have an effect on attitude changes, and that
it is the most important variable in the perception of source credibility.
For digital influencers, trustworthiness is especially important, according to Uzunoğlu and Misci
Kip (2014). Much of the effectiveness of influencers’ recommendations comes from the
perceived honesty users have of these people, as their opinions are often coded as unbiased by
social media users.

41
This, tied to the extensive positive effects of trustworthiness in purchase intention found in
literature (Adnan et al., 2017; Ilicic, Kulczynski, & Baxter, 2018; Khan, 2017; Ohanian, 1990)
support hypothesis 12.
H12: Positive perceptions of influencer credibility has a positive relationship with purchase
intention
Ties between similarity and purchase intention have been found in traditional celebrity
endorsement literature, such as Adnan, Jan, and Alam (2017). As attitude homophily, Lee and
Watkins (2016) positively correlated these two constructs, finding that not only is similarity a
good antecedent of PSI, but also a strong influencer of purchase intention.
Likewise, such findings are also supported by Bekk et al. (2017). These authors found that
similarity is an essential force of persuasion, and that perceived similarity between the audience
and the endorsers leads to positive results on purchase intention and attitude towards the
products being endorsed.
H13: Positive perceptions of influencer similarity has a positive relationship with purchase
intention
Traditional celebrity endorsement research has found strong ties between familiarity and
purchase intentions, as shown by Adnam, Jan and Alam (2017). Familiarity from a PSI
dimension has been positively linked to purchase intentions by Lee and Watkins (2016). In their
study, the development of parasocial interaction with vloggers translated to more positive
purchase intentions and receptions of their recommendations.
Likewise, social media positively impacted the development of PSI with celebrities and caused
more positive perceptions of their endorsements in Chung and Cho’s (2017) research. All of
which favorably support hypothesis 14.
H14: Positive perceptions of influencer familiarity has a positive relationship with purchase
intention
Trustworthiness in endorsement has been linked to positive evaluations of brands (Ohanian,
1990), and attitudinal changes towards the endorsement itself (Ilicic et al., 2018).
42
Brand attachment and endorser trustworthiness weren’t directly linked in any of the studies
explored, but they do offer some cues that point out to the existence of a positive relationship
between them.
The genuineness discussed by Ilicic et al. (2018) in their recent study found that perceiving
celebrities as genuine and sincere has positive effects on endorsements and can lead to better
perceptions of previously negatively perceived celebrities.
Chung and Cho (2017) found that social media also has positive effects on brand credibility and
purchase intention for celebrity endorser engagement. The existence of documented links
between perceptions of brands and trustworthiness points out to possible correlations between
attachment and trustworthiness as well.
H15: Positive perceptions of influencer credibility has a positive relationship with brand
attachment
Similarity has been linked to attitudinal change, and celebrity endorsement literature often state
that perceived similarities between the audience and a spokesperson or endorser can lead to
better acceptance of the messages emitted by these people (Adnan et al., 2017).
Brand attachment grows from a connection between the brand and the self (Park et al., 2010),
while similarity leads to perceived connections between the self and the endorser (Lee &
Watkins, 2016). Although links between perceived similarity or attitude homophily and brand
attachment weren’t directly present in any of the works researched, the existence of research
pointing out that similarity can lead to strong ties and perceptions of closeness with the endorser
(Lee & Watkins, 2016), which in turn might translate to equal feelings towards the brand.
H16: Positive perceptions of influencer similarity has a positive relationship with brand
attachment
Familiarity, as shown in this dissertation to be acting as a measure for parasocial interaction,
has been found to have significant links with attitudinal change (Chung & Cho, 2017) and brand
perceptions (Lee & Watkins, 2016).
Since parasocial interaction causes people to perceive a close relationship with influencers
through a process that is similar to the formation of face-to-face friendship (Chung & Cho,

43
2017), it is possible to infer that it could lead to the development of attachment with the brands
these influencers endorse.
Chung and Cho’s (2017) findings point out that PSI mimics interpersonal processes, and
generates a close relationship with endorsers, especially with the presence of social media.
Furthermore, their study points out that this relationship could have ramifications on how people
deal with the endorsed brands as well.
H17: Positive perceptions of influencer familiarity has a positive relationship with brand
attachment
Credibility has been found to have positive effects on attitudinal changes (Ohanian, 1990) and
perceptions of the brand (Ilicic et al., 2018). Overall, studies have found that a positive
evaluation of honesty has proportionally positive effects on how customers perceive brands,
leading to higher degrees of trust in the brand and more positive evaluations of the brand as
credible and trustworthy (Adnan et al., 2017; Ilicic et al., 2018; Ohanian, 1990).
Additionally, perceived honesty has also been linked to positive perceptions of endorsements.
According to Chung and Cho (2016), a perceived level of openness and willingness to be
vulnerable can result in the formation of parasocial relationships, which in turn leads to more
positive brand perceptions and attitude towards brands (Lee & Watkins, 2016).
H18: Positive perceptions of influencer credibility has a positive relationship with attitude
towards brand
As previously stated, perceived similarities between influencers and media users can lead to
better message acceptance and positively influence brand perceptions (Lee & Watkins, 2016).
According to Lee and Watkins (2016), perceived similarity, or attitude homophily, leads users
to continue their interactions with influencers, and a higher degree of acceptance of their
recommendations.
Chung and Cho (2016) also corroborate the existence of a relationship between perceived
similarity and positive attitude towards celebrity endorsements. According to these authors,
social media exchanges and a perceived relationship with celebrities in social media leads to
more positive receptions of endorsements, brand credibility and purchase intentions.
44
These findings point towards the existence of a positive relationship between perceived
influencer similarity and attitude towards brand.
H19: Positive perceptions of influencer similarity lead to a more positive attitude towards
brand
Parasocial interaction has been linked to positive evaluations of brands and endorsements. Lee
and Watkins (2016) found that forming PSI with vloggers positively influenced perceptions of
luxury brands and purchase intentions. Seeing as consumers’ attitudes towards brands are
internal evaluations of brands, it is possible to hypothesize that PSI, or familiarity, can influence
this variable.
Furthermore, (Labrecque, 2014) also supports the existence of such relationship, by finding a
positive correlation between parasocial interaction with brands and loyalty. According to this
author, PSI strengthens the relationship between consumers and brands, increasing loyalty
intentions and generating positive perceptions of these brands.
These findings support the existence of a correlation between familiarity and attitude towards
brand.
H20: Positive perceptions of influencer familiarity lead to a more positive attitude towards
brand
(Bergkvist et al., 2016) found that perceived celebrity-brand fit has positive effects on attitude
towards the brand. According to these authors, a perceived level of congruence between a
celebrity and a brand they endorse can lead to positive brand attributions (as opposed to lack of
fit, which leads to negative brand evaluations), which in turn affects attitude towards the brand.
It is possible to argue that influencer-brand fit is equally important, as they take on the role of
social media endorsers. The results found by Lee and Watkins (2016) have also established that
positive perceptions and PSI with vloggers leads to more positive evaluations of brands,
meaning that these individuals have an impact on brand perceptions.
These findings point towards the existence of a positive correlation between perceived fit and
attitude towards the brand, supporting hypothesis 21.
H21: Perceived fit has a positive relationship with attitude towards brand

45
Relationships between the three outcome variables will also be explored in this study. The
relationship between brand attitude and brand attachment has been discussed by Park et al.
(2010). Their study sought to differentiate the two constructs, characterizing each of them and
creating measures for future studies.
The results of this study point out that, while attitude can capture the mind of the consumer, it
can range from positive to negative, while attachment captures both the heart and minds of
consumers and are purely positive. This dissertation argues that a positive attitude towards brand
can generate attachment because it elicits positive feelings, which can grow to become a
connection between the brand and the self.
Likewise, significant links between attitude towards the brand and purchase intention were
discussed by Kaushal and Kumar (2016). This study found that positive attitude towards the
brand can positively affect purchase intentions. Though Kaushal and Kumar’s (2016) study uses
attitude towards the brand as a mediating factor, their findings support the hypothesis that
positive attitude towards the brand has a positive impact on purchase intentions.
H22: Positive attitude towards the brand has a positive effect on brand attachment.
Kaushal and Kumar (2016) found that attitude towards the brand significantly influences
purchase intentions. According to these authors, attitude towards the brand has a mediating role
on the relationship between attitude towards the advertisement and purchase intention. This
means that the brand, more than the advertisement, is a deciding factor on a customer’s purchase
intention.
Furthermore, (Spears & Singh, 2004) also support the existence of a relationship between
attitude towards the brand and purchase intentions.
These studies corroborate the existence of the relationship proposed on hypothesis 23.
H23: Positive attitude towards the brand has a positive effect on purchase intention.
Finally, the last relationship explored in this research is between brand attachment and purchase
intention. Park et al. (2010) found significant links between these variables, as their results prove
that brand attachment leads to consumers being more willing to invest personal resources, such
as time and money, into acquiring a specific brand.
46
Additionally, studies also found that attachment is a good predictor of consumer intentions in
general and purchase intentions specifically (Arya & Verma, 2018; Park et al., 2010). These
findings corroborate the existence of a positive correlation between these variables.
H24: Brand attachment has a positive impact on purchase intentions.

47
4. Methodology
This chapter will present an account of the methodology adopted in this research, detailing the
procedures and instruments employed to achieve the dissertation’s goals.
Firstly, the population and sample selection processes will be described, followed by the
methods used to collect data. The chapter will also present what went into the data collection
process, from choosing the proper metrics to developing the questionnaire. Then, the pre-testing,
data insertion and error verification stages will be introduced.
The chapter will then move on to detail all of the methodological components of the research,
presenting the steps taken to achieve final results. A brief explanation of the structural equations
model will be followed by an account of how the data collected was treated and analyzed.
4.1 Population and Sample Selection
Sampling is a process through which researchers choose a part of the population to analyze
(Marconi & Lakatos, 2003). This happens due to a lack of resources, such as time and money,
which make it impossible to analyze an entire population of subjects. Most empirical studies
utilize samples. If a sample is characteristic of the desired population, its results can be
extrapolated, and used to propose conclusions to the work and verify the validity of the
research’s hypotheses (Neuman, 2013).
Given that digital influencers on Youtube is the main theme of this dissertation, the population
was defined as people who actively follow one or more digital influencers in this platform. As
the scarcity of resources made it impossible to list or analyze the entire population, the author
decided to adopt a non-probability probabilistic convenience sampling (Marconi & Lakatos,
2003).
Though this sampling method is not considered ideal, it is commonly used for research that
lacks resources, and consists of selecting a sample based on the researcher’s accessibility
(Neuman, 2013). In this case, the questionnaire was shared through the author’s Facebook page,
and in large Facebook groups.

48
4.2 Data Collection Method
A quantitative data collection method was chosen for this research, and a survey was used to
gather data. Such a method is appropriate for this research due to the fact that existing literature
provides adequate metrics to measure the constructs present in the conceptual model, and that
it aims to verify a specific set of hypotheses. Marconi and Lakatos (2003) state that a
questionnaire is an adequate tool to acquire information on conscious or explicit actions and
opinions.
Albeit being a valid, common method for information gathering, questionnaires have the
disadvantage of having a low response rate, and the impossibility of explaining questions to
respondents. Amongst its advantages are the need for few resources, the liberty in replies, and
less risk of distortion or researcher bias (Marconi & Lakatos, 2003).
In this dissertation, the data was collected throughout the months of February, March and April
of 2018, through an online questionnaire, created through the Google Forms platform, and
shared via social media, through Facebook. The online platforms were chosen due to them being
easy to administrate, free, fast and easily shared with a large number of people.
4.2.1 Questionnaire Elaboration
In order to properly conduct the survey, a questionnaire was elaborated. Marconi and Lakatos
(2003) define a questionnaire as a data collection tool, made up of an ordered series of questions.
It is a useful instrument to verify hypotheses and requires the researcher to observe and uphold
specific norms, such as type, order and groups of questions. However, as Neuman (2013) points
out, this method is prone to confusion, thus, clarity is essential when elaborating the questions
and organizing the questionnaire. The researcher must be very familiar with the theme, which
in turn must be in line with the objectives of the research.
Taking into account the resources available, the goals of the research and the advantages of the
questionnaire, the present work chose this as its data collection tool. The questionnaire was
composed of six sections. Section one introduced the questionnaire, and asked participants for
their cooperation, and was composed by general sample characterization questions. Sections
two to six present questions related to the research’s variables. These questions were grouped
49
according to the variables and overarching topics related to each variable (social network
participation, relationship with digital influencers, trustworthiness and expertise of digital
influencers, sponsorship and outcomes).
The questionnaire was developed through the Google Forms platform, and its link was shared
through Facebook, and in Facebook groups, alongside a request for cooperation. The
questionnaire was applied in Portuguese, as most of the respondents were of Portuguese and
Brazilian origin. Answers were received throughout the months of February, March and April
of 2018.
An English version of the questionnaire can be found in Appendix I of this research.
4.2.2 Question Terminology
Questions referring to personal data, used for characterizing the sample, were all multiple choice
questions. Respondents could choose only one final answer According to Neuman (2013),
closed questions have the advantage of being easier and quicker to answer, being easier to
compare and replicate and having fewer irrelevant questions. Thus, this format offers more
precise answers that are easier to code and interpret.
All of the questions referring to variables used a 7 points Likert scale to measure respondents’
opinions, with the exception of the Brand Attachment questions, which required the use of a 1
– 10 scale. The Likert scale was coded as: 1 – totally disagree; 2 – disagree; 3 – partially
disagree; 4 – neither agree nor disagree; 5 – partially agree; 6 – agree and 7 – totally agree. The
Likert scale is thought to be one of the most used formats when researchers wish to combine
multiple ranked items, and its simplicity makes it friendly for respondents and researchers alike
(Neuman, 2013).
The questionnaire also featured one open question with a short answer, inquiring respondents
on who is their favorite youtuber. This question was used to create a basis upon which
respondents could answer further questions regarding their perception of youtubers.

50
4.2.3 Metrics
The metrics presented in this chapter were adapted from its original authors, following the needs
posed by the research and the orientation of this research’s advisor. They are presented here in
English, however their translation to Portuguese for the application of the questionnaire was
also done under the advisor’s orientation.
Presented below are the adapted versions of these measures, alongside their references.
Table 3 - Consumer Social Participation
Customer Social Participation
1. I use social networking sites
regularly
(Ellison et al., 2007) 2. Using social networking sites is a
part of my daily activities
3. I like using social networking sites
Table 4 - Active Participation
Active Participation
1. I actively participate in my favorite social
networking sites
(Casaló et al.,
2007)
2. I frequently provide useful information to other
members
3. In general, I post messages and share information
frequently in social networking sites
Table 5 - User Generated Content
User Generated Content
1. I am satisfied with users' communications
about brands on social media (Mägi, 2003)
(Tsiros et al.,
2004)
(Bruhn et al.,
2012) 2. Other users' communications level on social
media achieves my expectations

51
3. Users' communications on social media are
attractive
(Van Doorn et
al., 2010)
4. There's a feeling of human warmth in social
media
Table 6 - Influencer Credibility
Credibility
1. I believe Youtubers' recommendations to be true
(Fishbein & Ajzen, 1975) 2. I trust in the information provided by youtubers
3. Youtubers are trustworthy
Table 7 - Influencer Similarity
Similarity
1. This Youtuber thinks like me
(Lee & Watkins,
2016)
2. This Youtuber is similar to me.
3. I identifity with this Youtuber
4. This Youtuber shares my values.
5. This Youtuber has a lot in common with me.
6. This Youtuber behaves like me.
7. This Youtuber has thoughts and ideas that are similar
to mine.
8. This Youtuber could be my friend
9. I would like to have a friendly chat with this Youtuber
10. This Youtuber treats people like I do
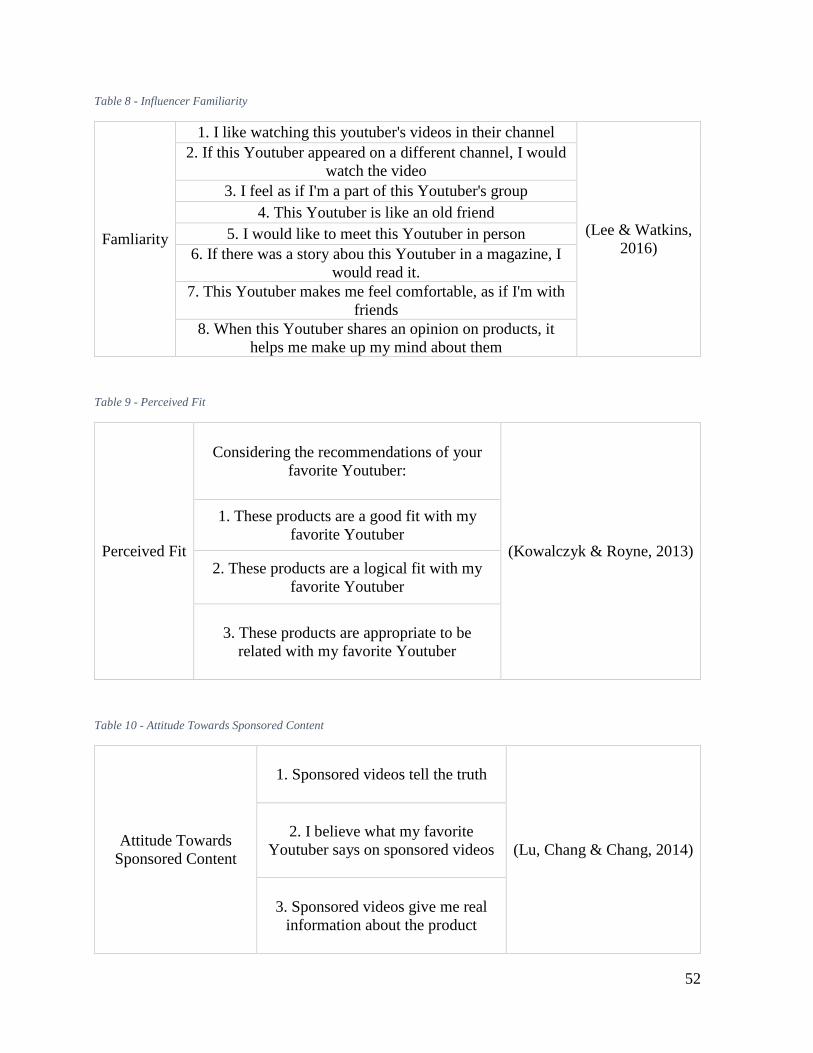
52
Table 8 - Influencer Familiarity
Famliarity
1. I like watching this youtuber's videos in their channel
(Lee & Watkins,
2016)
2. If this Youtuber appeared on a different channel, I would
watch the video
3. I feel as if I'm a part of this Youtuber's group
4. This Youtuber is like an old friend
5. I would like to meet this Youtuber in person
6. If there was a story abou this Youtuber in a magazine, I
would read it.
7. This Youtuber makes me feel comfortable, as if I'm with
friends
8. When this Youtuber shares an opinion on products, it
helps me make up my mind about them
Table 9 - Perceived Fit
Perceived Fit
Considering the recommendations of your
favorite Youtuber:
(Kowalczyk & Royne, 2013)
1. These products are a good fit with my
favorite Youtuber
2. These products are a logical fit with my
favorite Youtuber
3. These products are appropriate to be
related with my favorite Youtuber
Table 10 - Attitude Towards Sponsored Content
Attitude Towards
Sponsored Content
1. Sponsored videos tell the truth
(Lu, Chang & Chang, 2014)
2. I believe what my favorite
Youtuber says on sponsored videos
3. Sponsored videos give me real
information about the product
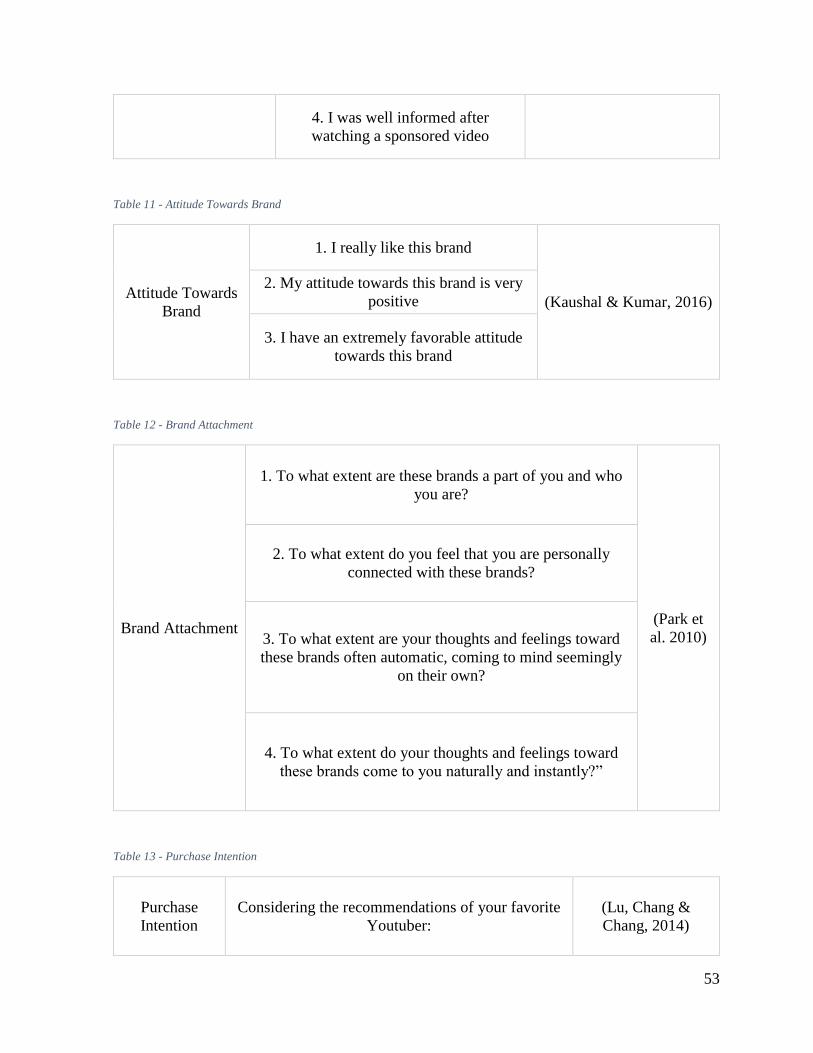
53
4. I was well informed after
watching a sponsored video
Table 11 - Attitude Towards Brand
Attitude Towards
Brand
1. I really like this brand
(Kaushal & Kumar, 2016)
2. My attitude towards this brand is very
positive
3. I have an extremely favorable attitude
towards this brand
Table 12 - Brand Attachment
Brand Attachment
1. To what extent are these brands a part of you and who
you are?
(Park et
al. 2010)
2. To what extent do you feel that you are personally
connected with these brands?
3. To what extent are your thoughts and feelings toward
these brands often automatic, coming to mind seemingly
on their own?
4. To what extent do your thoughts and feelings toward
these brands come to you naturally and instantly?”
Table 13 - Purchase Intention
Purchase
Intention
Considering the recommendations of your favorite
Youtuber:
(Lu, Chang &
Chang, 2014)
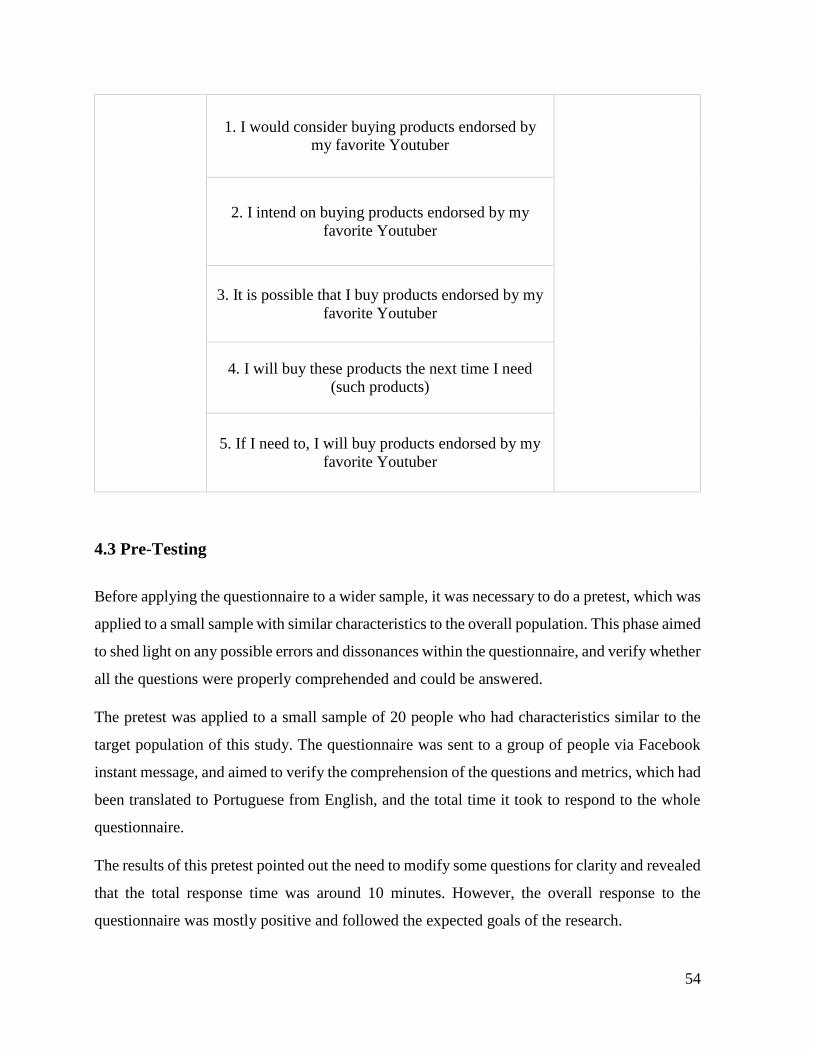
54
1. I would consider buying products endorsed by
my favorite Youtuber
2. I intend on buying products endorsed by my
favorite Youtuber
3. It is possible that I buy products endorsed by my
favorite Youtuber
4. I will buy these products the next time I need
(such products)
5. If I need to, I will buy products endorsed by my
favorite Youtuber
4.3 Pre-Testing
Before applying the questionnaire to a wider sample, it was necessary to do a pretest, which was
applied to a small sample with similar characteristics to the overall population. This phase aimed
to shed light on any possible errors and dissonances within the questionnaire, and verify whether
all the questions were properly comprehended and could be answered.
The pretest was applied to a small sample of 20 people who had characteristics similar to the
target population of this study. The questionnaire was sent to a group of people via Facebook
instant message, and aimed to verify the comprehension of the questions and metrics, which had
been translated to Portuguese from English, and the total time it took to respond to the whole
questionnaire.
The results of this pretest pointed out the need to modify some questions for clarity and revealed
that the total response time was around 10 minutes. However, the overall response to the
questionnaire was mostly positive and followed the expected goals of the research.
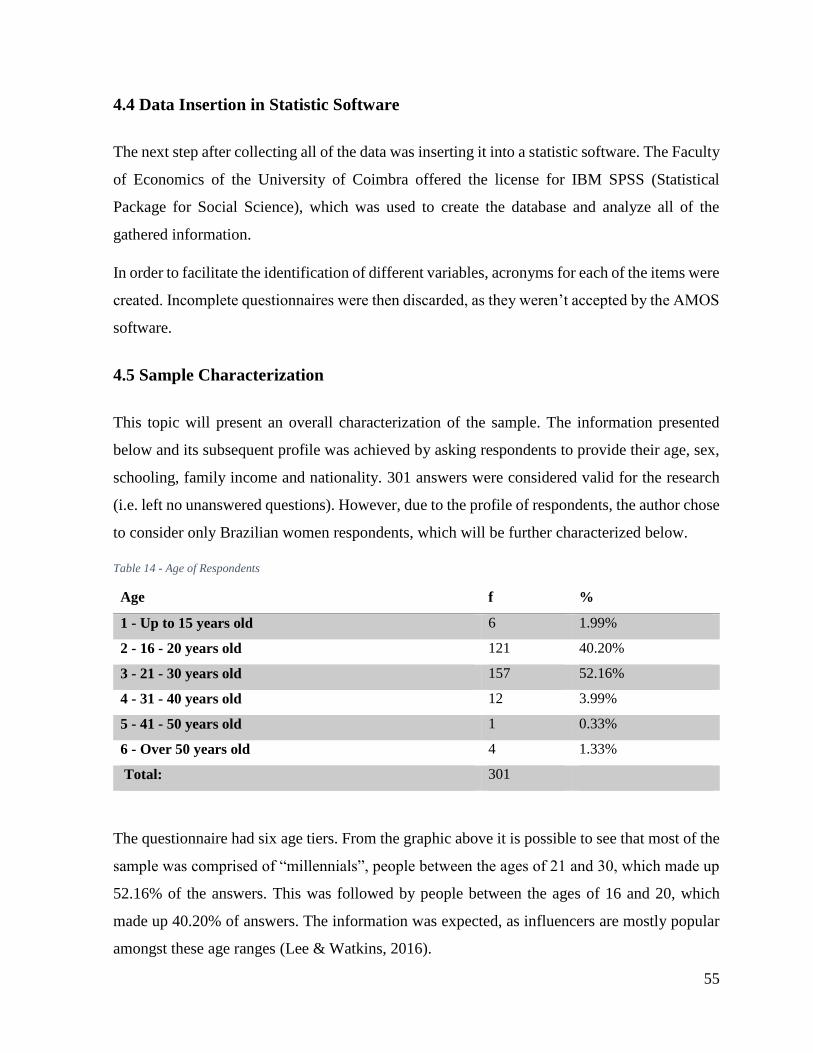
55
4.4 Data Insertion in Statistic Software
The next step after collecting all of the data was inserting it into a statistic software. The Faculty
of Economics of the University of Coimbra offered the license for IBM SPSS (Statistical
Package for Social Science), which was used to create the database and analyze all of the
gathered information.
In order to facilitate the identification of different variables, acronyms for each of the items were
created. Incomplete questionnaires were then discarded, as they weren’t accepted by the AMOS
software.
4.5 Sample Characterization
This topic will present an overall characterization of the sample. The information presented
below and its subsequent profile was achieved by asking respondents to provide their age, sex,
schooling, family income and nationality. 301 answers were considered valid for the research
(i.e. left no unanswered questions). However, due to the profile of respondents, the author chose
to consider only Brazilian women respondents, which will be further characterized below.
Table 14 - Age of Respondents
Age f %
1 - Up to 15 years old 6 1.99%
2 - 16 - 20 years old 121 40.20%
3 - 21 - 30 years old 157 52.16%
4 - 31 - 40 years old 12 3.99%
5 - 41 - 50 years old 1 0.33%
6 - Over 50 years old 4 1.33%
Total: 301
The questionnaire had six age tiers. From the graphic above it is possible to see that most of the
sample was comprised of “millennials”, people between the ages of 21 and 30, which made up
52.16% of the answers. This was followed by people between the ages of 16 and 20, which
made up 40.20% of answers. The information was expected, as influencers are mostly popular
amongst these age ranges (Lee & Watkins, 2016).
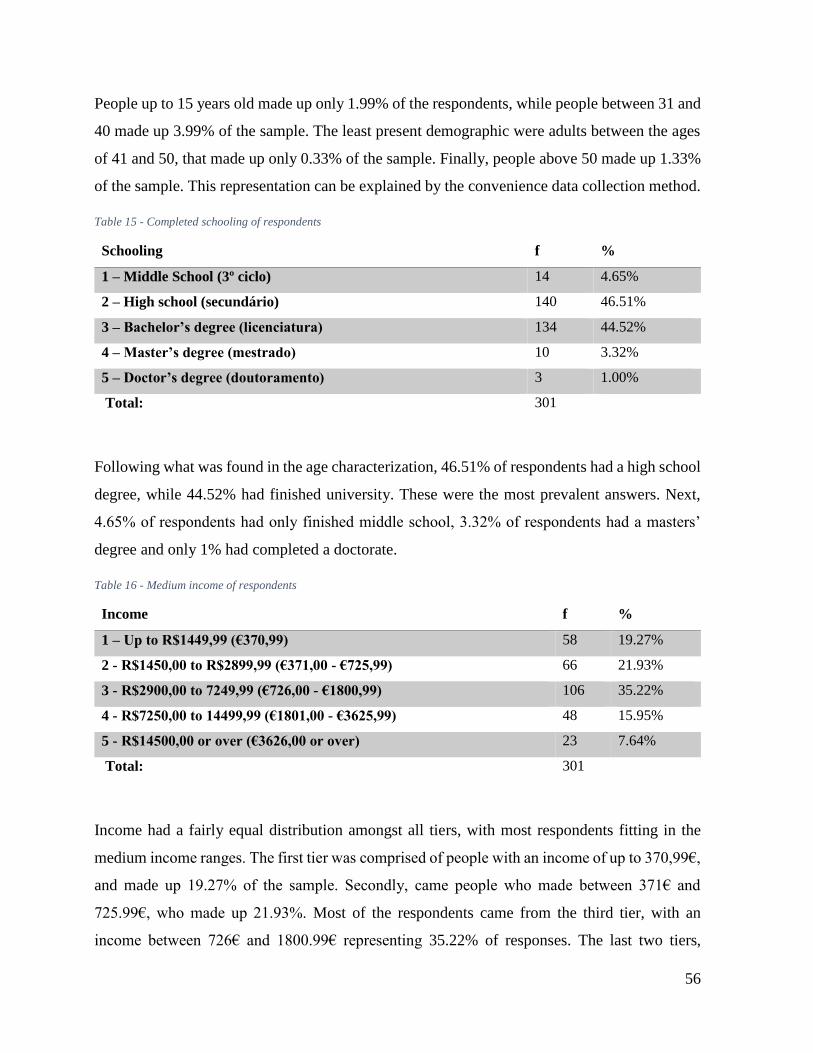
56
People up to 15 years old made up only 1.99% of the respondents, while people between 31 and
40 made up 3.99% of the sample. The least present demographic were adults between the ages
of 41 and 50, that made up only 0.33% of the sample. Finally, people above 50 made up 1.33%
of the sample. This representation can be explained by the convenience data collection method.
Table 15 - Completed schooling of respondents
Schooling f %
1 – Middle School (3º ciclo) 14 4.65%
2 – High school (secundário) 140 46.51%
3 – Bachelor’s degree (licenciatura) 134 44.52%
4 – Master’s degree (mestrado) 10 3.32%
5 – Doctor’s degree (doutoramento) 3 1.00%
Total: 301
Following what was found in the age characterization, 46.51% of respondents had a high school
degree, while 44.52% had finished university. These were the most prevalent answers. Next,
4.65% of respondents had only finished middle school, 3.32% of respondents had a masters’
degree and only 1% had completed a doctorate.
Table 16 - Medium income of respondents
Income f %
1 – Up to R$1449,99 (€370,99) 58 19.27%
2 - R$1450,00 to R$2899,99 (€371,00 - €725,99) 66 21.93%
3 - R$2900,00 to 7249,99 (€726,00 - €1800,99) 106 35.22%
4 - R$7250,00 to 14499,99 (€1801,00 - €3625,99) 48 15.95%
5 - R$14500,00 or over (€3626,00 or over) 23 7.64%
Total: 301
Income had a fairly equal distribution amongst all tiers, with most respondents fitting in the
medium income ranges. The first tier was comprised of people with an income of up to 370,99€,
and made up 19.27% of the sample. Secondly, came people who made between 371€ and
725.99€, who made up 21.93%. Most of the respondents came from the third tier, with an
income between 726€ and 1800.99€ representing 35.22% of responses. The last two tiers,
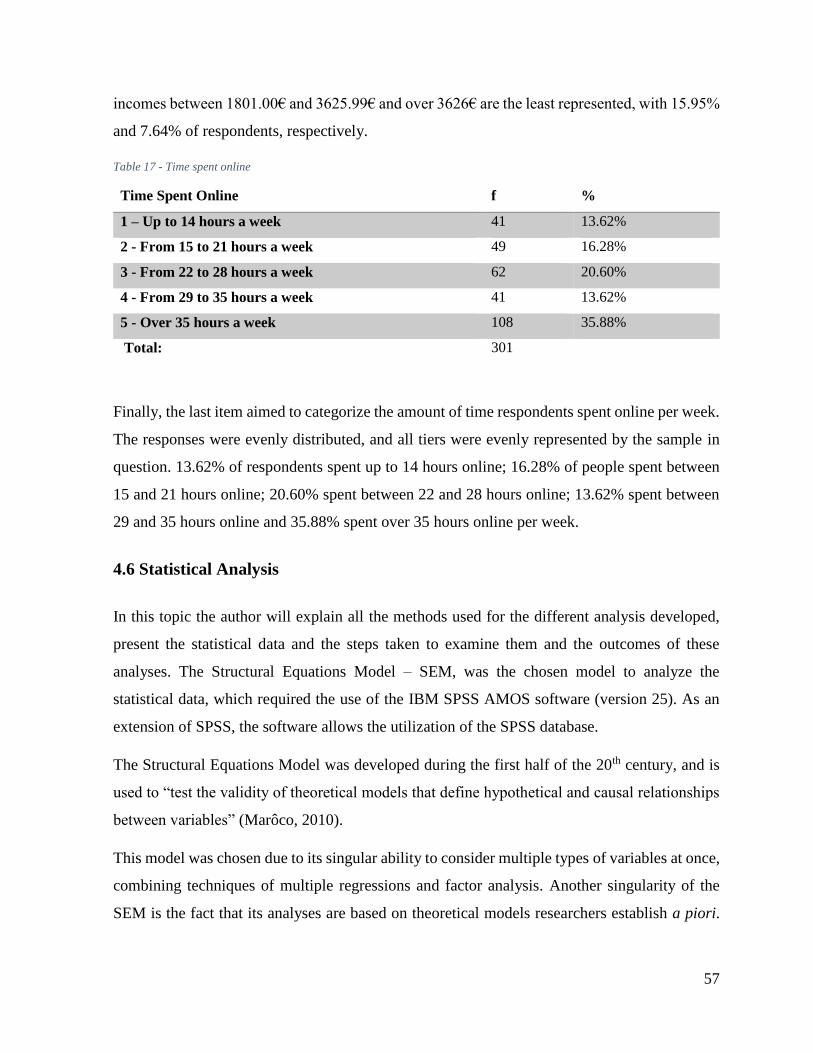
57
incomes between 1801.00€ and 3625.99€ and over 3626€ are the least represented, with 15.95%
and 7.64% of respondents, respectively.
Table 17 - Time spent online
Time Spent Online f %
1 – Up to 14 hours a week 41 13.62%
2 - From 15 to 21 hours a week 49 16.28%
3 - From 22 to 28 hours a week 62 20.60%
4 - From 29 to 35 hours a week 41 13.62%
5 - Over 35 hours a week 108 35.88%
Total: 301
Finally, the last item aimed to categorize the amount of time respondents spent online per week.
The responses were evenly distributed, and all tiers were evenly represented by the sample in
question. 13.62% of respondents spent up to 14 hours online; 16.28% of people spent between
15 and 21 hours online; 20.60% spent between 22 and 28 hours online; 13.62% spent between
29 and 35 hours online and 35.88% spent over 35 hours online per week.
4.6 Statistical Analysis
In this topic the author will explain all the methods used for the different analysis developed,
present the statistical data and the steps taken to examine them and the outcomes of these
analyses. The Structural Equations Model – SEM, was the chosen model to analyze the
statistical data, which required the use of the IBM SPSS AMOS software (version 25). As an
extension of SPSS, the software allows the utilization of the SPSS database.
The Structural Equations Model was developed during the first half of the 20th century, and is
used to “test the validity of theoretical models that define hypothetical and causal relationships
between variables” (Marôco, 2010).
This model was chosen due to its singular ability to consider multiple types of variables at once,
combining techniques of multiple regressions and factor analysis. Another singularity of the
SEM is the fact that its analyses are based on theoretical models researchers establish a piori.
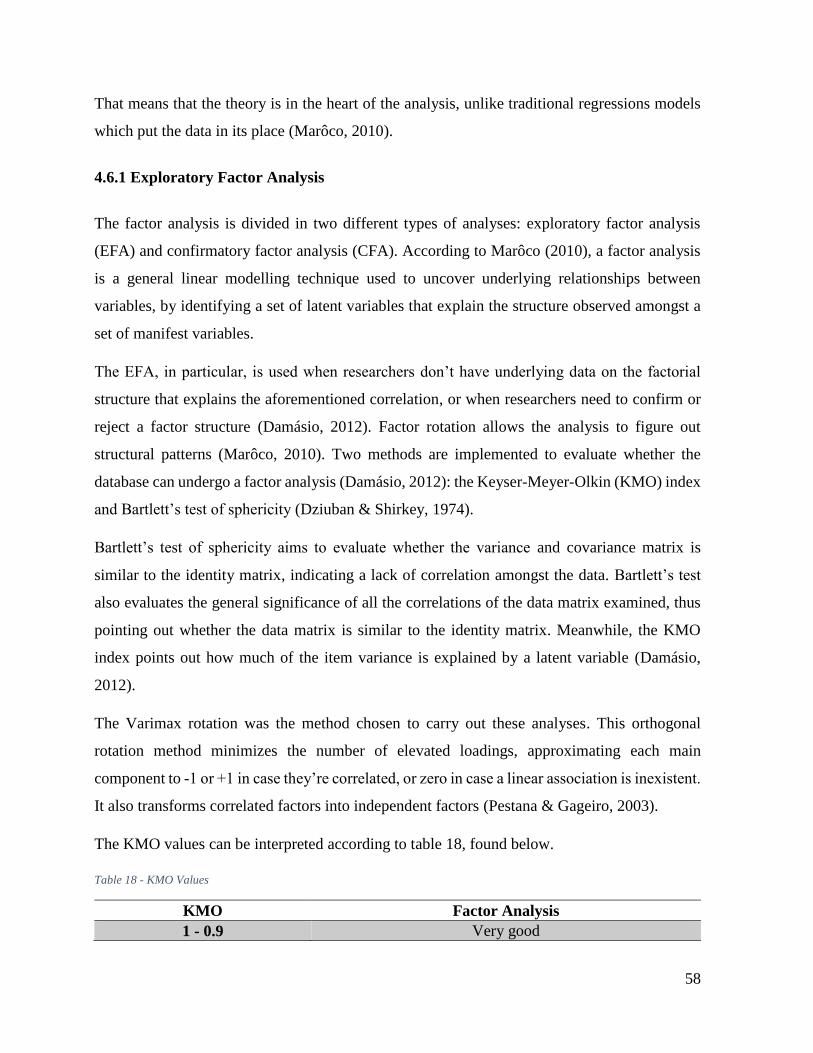
58
That means that the theory is in the heart of the analysis, unlike traditional regressions models
which put the data in its place (Marôco, 2010).
4.6.1 Exploratory Factor Analysis
The factor analysis is divided in two different types of analyses: exploratory factor analysis
(EFA) and confirmatory factor analysis (CFA). According to Marôco (2010), a factor analysis
is a general linear modelling technique used to uncover underlying relationships between
variables, by identifying a set of latent variables that explain the structure observed amongst a
set of manifest variables.
The EFA, in particular, is used when researchers don’t have underlying data on the factorial
structure that explains the aforementioned correlation, or when researchers need to confirm or
reject a factor structure (Damásio, 2012). Factor rotation allows the analysis to figure out
structural patterns (Marôco, 2010). Two methods are implemented to evaluate whether the
database can undergo a factor analysis (Damásio, 2012): the Keyser-Meyer-Olkin (KMO) index
and Bartlett’s test of sphericity (Dziuban & Shirkey, 1974).
Bartlett’s test of sphericity aims to evaluate whether the variance and covariance matrix is
similar to the identity matrix, indicating a lack of correlation amongst the data. Bartlett’s test
also evaluates the general significance of all the correlations of the data matrix examined, thus
pointing out whether the data matrix is similar to the identity matrix. Meanwhile, the KMO
index points out how much of the item variance is explained by a latent variable (Damásio,
2012).
The Varimax rotation was the method chosen to carry out these analyses. This orthogonal
rotation method minimizes the number of elevated loadings, approximating each main
component to -1 or +1 in case they’re correlated, or zero in case a linear association is inexistent.
It also transforms correlated factors into independent factors (Pestana & Gageiro, 2003).
The KMO values can be interpreted according to table 18, found below.
Table 18 - KMO Values
KMO Factor Analysis
1 - 0.9 Very good

59
0.8 - 0.9 Good
0.7 - 0.8 Average
0.6 - 0.7 Reasonable
0.5- 0.6 Bad
< 0.5 Unacceptable (Pestana & Gageiro, 2003)
In addition to these tests, an analysis of internal factor consistency was carried out, using
Cronbach’s Alpha. The internal consistency is defined as a correlation between the utilized scale
and other hypothetical scales of the same universe, and ranges from 0 to 1 (Pestana & Gageiro,
2003). Table 19, found below, presents the interpretation of the values found by this test.
Table 19 - Cronbach's Alpha
Value Internal Consistency
> 0.9 Very good
0.8 - 0.9 Good
0.7 - 0.8 Average
0.6 - 0.7 Bad
< 0.6 Inadmissable (Pestana & Gageiro, 2003)
4.6.2 Exploratory Factor Analysis Results
The final values of the EFA can be found in table 20, below.
Table 20 - Exploratory Factor Analysis
Variable Items Cronbach's
Alpha
KM
O
Bartlett's
Test
% Explained
Variance
Customer Social
Participation
CSP1 0.879 0.73 0 80.773
CSP2
CSP3
Active Participation AP1 0.812 0.70
2
0 72.652
AP2
AP3
User Generated Content UGC
1
0.833 0.76
9
0 68.363
UGC
2
UGC
3
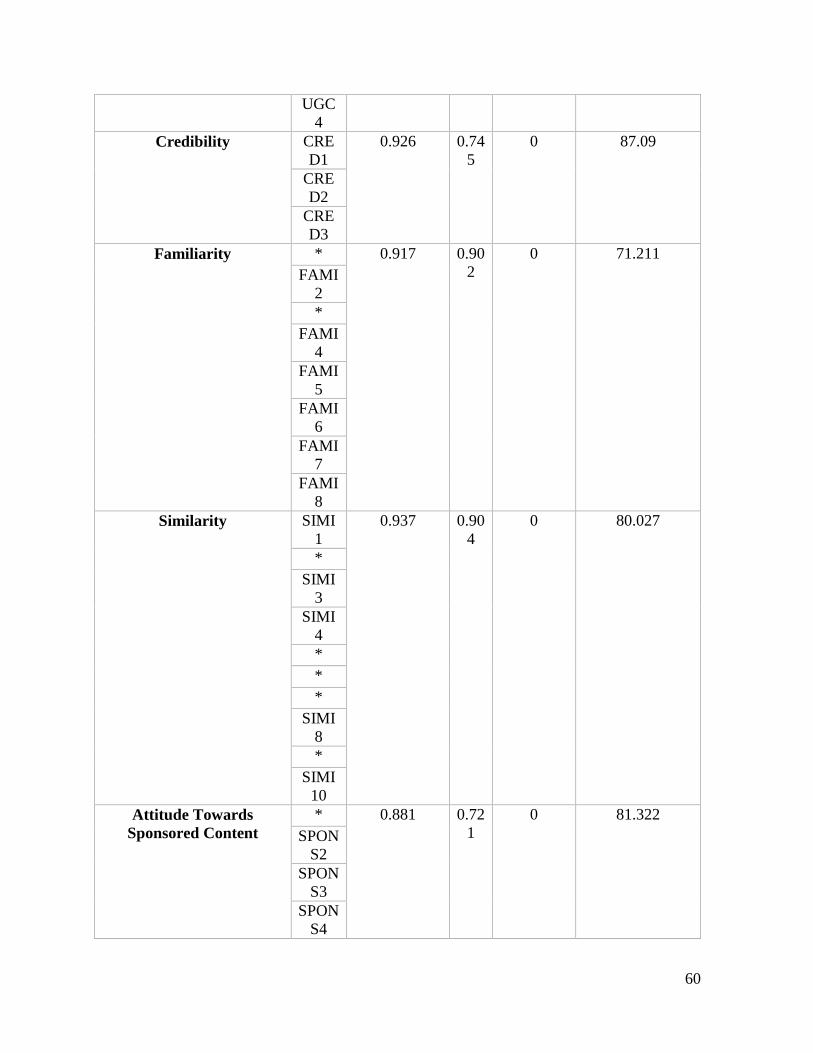
60
UGC
4
Credibility CRE
D1
0.926 0.74
5
0 87.09
CRE
D2
CRE
D3
Familiarity * 0.917 0.90
2
0 71.211
FAMI
2
*
FAMI
4
FAMI
5
FAMI
6
FAMI
7
FAMI
8
Similarity SIMI
1
0.937 0.90
4
0 80.027
*
SIMI
3
SIMI
4
*
*
*
SIMI
8
*
SIMI
10
Attitude Towards
Sponsored Content
* 0.881 0.72
1
0 81.322
SPON
S2
SPON
S3
SPON
S4

61
Perceived Fit PF1 0.971 0.76
1
0 94.512
PF2
PF3
Brand Attachment BA1 0.935 0.70
9
0 88.493
*
BA3
BA4
Attitude Towards Brand ATB1 0.976 0.77
5
0 95.526
ATB2
ATB3
Purchase Intention PI1 0.956 0.86
1
0 88.25
PI2
PI3
PI4
*
* - these items were excluded from the model during the respecification process.
Once the EFA had been conducted, the author verified that all of the variables presented
acceptable results. The KMO indexes found were all over 0,7, while the Bartlett’s sphericity
tests were all equal to 0,00. This points out to the existence of a correlation between variables.
All of the variables also presented a Cronbach’s Alpha of over 0,8, which means that their
internal consistency is good.
It is important to highlight that seven items were excluded, due to their low explanatory capacity.
4.6.3 Confirmatory Factor Analysis
Unlike the EFA, the CFA is conducted once the researcher has information on the factor
structure. It is used to confirm whether certain latent variables are responsible for the behavior
of specific manifest variables. The CFA is also used as a technique of evaluation for the quality
of the measurement model (Marôco, 2010).
SEM is comprised of two key aspects. It measures latent variables and analyzes the causality
relations amongst these variables. The measurement model represents the model achieved in the
CFA, and it defines how latent variables are operationalized by observed variables (Marôco,
2010).
Figure 2 shows the proposed initial measurement model.

62
Figure 2 - Initial Measurement Model
4.6.4 Model Fit
According to Marôco (2014), this assessment aims to evaluate how well the theoretical model
reproduces the correlational structure of the observed variables. In order to find out whether the
model fit is good, the researcher counts on certain measures, such as Chi-Square χ2,
Comparative Fit Index (CFI), Tucker-Lewis Fit Index (TLI), Incremental Fit Index (IFI) and
Root Mean Square Error of Approximation (RMSEA).
Table 21 shows the interpretations for the different values found in each of these measures.
Table 21 - Model fit
Indicator Values Reference
χ2 - The smaller, the better (Marôco, 2010)
χ2/df > 5 Bad fit
(Marôco, 2010) ]2;5] Average fit
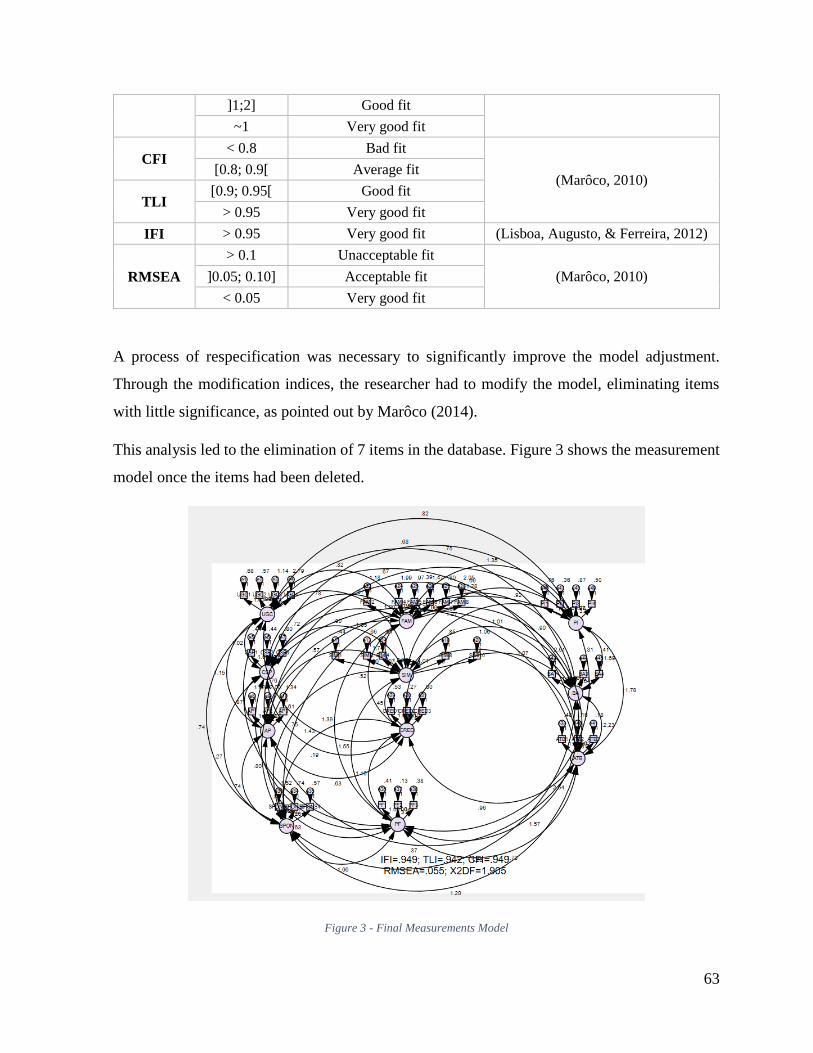
63
]1;2] Good fit
~1 Very good fit
CFI < 0.8 Bad fit
(Marôco, 2010) [0.8; 0.9[ Average fit
TLI [0.9; 0.95[ Good fit
> 0.95 Very good fit
IFI > 0.95 Very good fit (Lisboa, Augusto, & Ferreira, 2012)
RMSEA
> 0.1 Unacceptable fit
(Marôco, 2010) ]0.05; 0.10] Acceptable fit
< 0.05 Very good fit
A process of respecification was necessary to significantly improve the model adjustment.
Through the modification indices, the researcher had to modify the model, eliminating items
with little significance, as pointed out by Marôco (2014).
This analysis led to the elimination of 7 items in the database. Figure 3 shows the measurement
model once the items had been deleted.
Figure 3 - Final Measurements Model

64
Once the items had been deleted, the indicators were recalculated. Table 22 shows the values
obtained after the items were deleted.
Table 22 – Measurements’ model fit
Global Fit Sample
χ2 1305.2
Df 685
IFI 0.949
TLI 0.942
CFI 0.949
RMSEA 0.55
4.6.5 Quality of the Measurement Model
While the overall model needs to present a good global adjustment, it should also have a good
individual adjustment. In order to assess that, an evaluation of the measurement model has to be
conducted. An analysis of the discriminant validity and measurement reliability of latent
variables were the methods utilized to verify individual adjustment. The reliability of indicators
refers to the reproducibility and consistence of the indicators.
This section will present the individual-item reliability, the latent variable reliability and the
average variance extracted.
4.6.5.1 Individual Item Reliability
The multiple correlation coefficient (R²) is an evaluation of the degree of correlation squared
between latent variables and each of its indicators. A R² value of less than 0,25 means that the
factor explains less than 25% of the variance manifested by the variable, which in turn indicates
there is a problem with the variable (Marôco, 2010).
Table 23 presents all of the individual values for the Standardized Regression Weights (SRW),
which is the terminology used by the AMOS software for the individual item reliability
measures.

65
Table 23 - Confirmatory factor analysis results
Items Estimate C.R.
User Generated Content
UGC1 0.868 18.301
UGC3 0.787 15.789
UGC4 0.484 8.529
UGC2 0.894 19.167
Customer Social Participation
CSP1 0.865 18.146
CSP2 0.887 18.838
CSP3 0.786 15.736
Active Participation
AP1 0.732 13.535
AP2 0.735 13.608
AP3 0.841 16.172
Similarity
SIMI1 0.912 20.425
SIMI3 0.889 19.55
SIMI4 0.864 18.653
SIMI8 0.851 18.191
SIMI10 0.82 17.16
Familiarity
FAMI2 0.792 16.24
FAMI4 0.763 15.372
FAMI5 0.882 19.235
FAMI6 0.825 17.255
FAMI7 0.898 19.813
FAMI8 0.696 13.539
Credibility
CRED1 0.883 19.185
CRED2 0.945 21.478
CRED3 0.871 18.774
Sponsorship
SPONS2 0.786 15.827
SPONS3 0.868 18.372
SPONS4 0.905 19.625
Perceived Fit
PF1 0.945 21.902
PF2 0.983 23.592
PF3 0.949 22.08

66
Attitude Towards Brand
ATB1 0.941 21.778
ATB2 0.98 23.454
ATB3 0.977 23.343
Brand Attachment
BA1 0.785 16.238
BA3 0.977 23.152
BA4 0.972 22.904
Purchase Intention
PI1 0.898 19.984
PI2 0.955 22.28
PI3 0.883 19.422
PI4 0.938 21.559
4.6.5.2 Composite Reliability
Theory suggests that the composite reliability (CR) should have a value of over 0,7 to be found
acceptable. This indicator measures how each latent variable is measured by the indicators.
Cronbach’s Alpha is also considered in this assessment. Variables with an alpha of over 0,7 are
considered acceptable. All of the variables showed acceptable CR and alpha values, as shown
in table 24.
4.6.5.3 Average Variance Extracted
Theory suggests that the average variance extracted (AVE) value be of at least 0,5 (Marôco,
2010). It is possible to see, in table 24, that all of the variables studied had acceptable AVE
values, meaning that the reliability hypotheses have all been accepted.

67
Table 24 - Standard Deviation, Correlation Matrix and Cronbach's Alpha - Final CFA
Variable SD X1 X2 X3 X4 X5 X6 X7 X8 X9 X10 X11 C.R. AVE
User Generated Content
(X1) 1.447 0.833 0.852 0.602
Customer Social
Participation (X2) 1.147 0.617 0.879 0.884 0.718
Active Participation (X3) 1.489 0.532 0.507 0.812 0.814 0.594
Similarity (X4) 1.481 0.408 0.530 0.260 0.937 0.938 0.753
Familiarity (X5) 1.408 0.404 0.485 0.342 0.832 0.917 0.920 0.660
Credibility (X6) 1.366 0.379 0.122 0.308 0.220 0.273 0.926 0.928 0.810
Attitude Towards
Sponsorship (X7) 1.504 0.340 0.155 0.330 0.272 0.360 0.695 0.881 0.890 0.730
Perceived Fit (X8) 1.847 0.301 0.377 0.228 0.566 0.535 0.437 0.596 0.971 0.972 0.920
Attitude Towards Brand
(X9) 1.929 0.246 0.285 0.129 0.374 0.331 0.365 0.414 0.484 0.976 0.977 0.933
Brand Attachment (X10) 2.009 0.257 0.168 0.152 0.340 0.324 0.362 0.418 0.424 0.577 0.935 0.939 0.839
Purchase Intention (X11) 1.785 0.317 0.330 0.252 0.483 0.536 0.522 0.614 0.770 0.518 0.470 0.956 0.956 0.844

68
4.6.5.4 Discriminant Validity
This value indicates the extension to which independent latent variables are correlated, and how
correlated are each latent variable’s indicators. Discriminant validity also determines whether
factors (composed by a set of items) are distinct.
To determine whether the variables possess discriminant validity, there must be a comparison
between the average variance extracted (AVE) and the correlation amongst variables. The
squared value of correlation between latent variables must be lower than the average variance
extracted.
The results of this test can be found in Appendix II. All of the variables presented a squared
value of correlation lower than the AVE value, with the exception of the correlation between
the variables Similarity and Familiarity. These variables showed a correlation value of 0.832,
which, when squared, is roughly 0.69. This value proved to be bigger than the AVE value for
familiarity, which was 0.66.
Following the suggestions of (Fornell & Larcker, 1981), a new model was tested exclusively
with these variables, with their correlation fixed on 1. The researcher was then able to conclude
that the relationship between variables was significantly superior when the correlation is not
fixed on 1, therefore confirming the existence of discriminant validity, as their correlation is
statistically different from 1.

69
5. Results
This chapter will present all of the key information regarding the results of this investigation,
obtained from the statistical analysis. An introductory descriptive analysis will be presented,
followed by an estimation of the model and a hypotheses test. Finally, the last part of the chapter
will be an overall discussion of results and a summarization of them.
5.1 Descriptive Analysis of Variables
The descriptive analysis allows researchers to foresee the behavior of variables in a study, by
making the average value of answers and their standard deviations known. Such information
can help characterize sample behavior.
Table 25 - Descriptive analysis
Variable Minimum Maximum Mean Std. Deviation
Customer Social Participation 1 7 6.256 1.262
User Generated Content 1 7 4.591 1.432
Active Participation 1 7 4.405 1.783
Credibility 1 7 3.505 1.468
Similarity 1 7 5.504 1.564
Familiarity 1 7 5.131 1.721
Attitude Towards Sponsored Content 1 7 3.294 1.655
Perceived Fit 1 7 5.047 1.897
Attitude Towards Brand 1 7 4.656 1.968
Brand Attachment 1 10 4.687 2.48
Purchase Intention 1 7 4.244 1.892
A seven-point Likert scale was used for most of the variables, except for Brand Attachment,
with 1 being equivalent to “I disagree completely” and 7 to “I agree completely”. Customer
social participation had both the highest mean and the lowest standard deviation, which indicates
this variable’s importance, and a higher level of congruency amongst answers.
As for antecedents of the perceptions of influencers, both active participation and user generated
content have average means, just above 4, with active participation showing a high standard
deviation, which indicates a high level of variability in answers. Meanwhile, user generated
content shows an average standard deviation, which means answers varied slightly.

70
Amongst the perceptions of influencers, familiarity and similarity presented overall means
above 5, which could indicate a high level of importance. However, both variables also show a
high level of variability, meaning answers did not present much congruence. Meanwhile,
credibility showed a lower mean, of around 3.5, with average levels of standard deviation. This
suggests that perceptions of credibility are lower than similarity or familiarity.
Both attitude towards sponsored content and perceived fit presented high levels of standard
deviations, meaning neither of these variables showed a high degree of congruence in their
answers. While attitude towards the brand showed values just above 3, suggesting respondents
did not feel too positive about it, perceived fit presented a mean above 5, suggesting its
importance.
Attitude towards brand and purchase intention also presented average mean values and high
standard deviation values, meaning that answers had a higher level of variability.
For the Brand Attachment variable, the researcher used an eleven-point scale ranging from 0 to
10. Although this variable presented a mean of 4.687, this is considered low when taking into
account the different scale used. In contrast, this variable also presented the highest standard
deviation of all, meaning that answers varied much more than in other variables.
5.2 Structural Model Adjustment
Once the Structural Equations Model had been estimated, after the hypotheses proposed had
been established, the model fit suffered a slight decrease. However, the indexes for χ2 = 1734.5,
df = 710 χ2/gl = 2.44, IFI = 0.916, TLI = 0.907, CFI = 0.916 and RMSEA = 0.069. The values
can be seen in table 26.
Table 26 - Global fit
Global Fit Sample
χ2 1734.5
Df 710
IFI 0.916
TLI 0.907
CFI 0.916
RMSEA 0.069
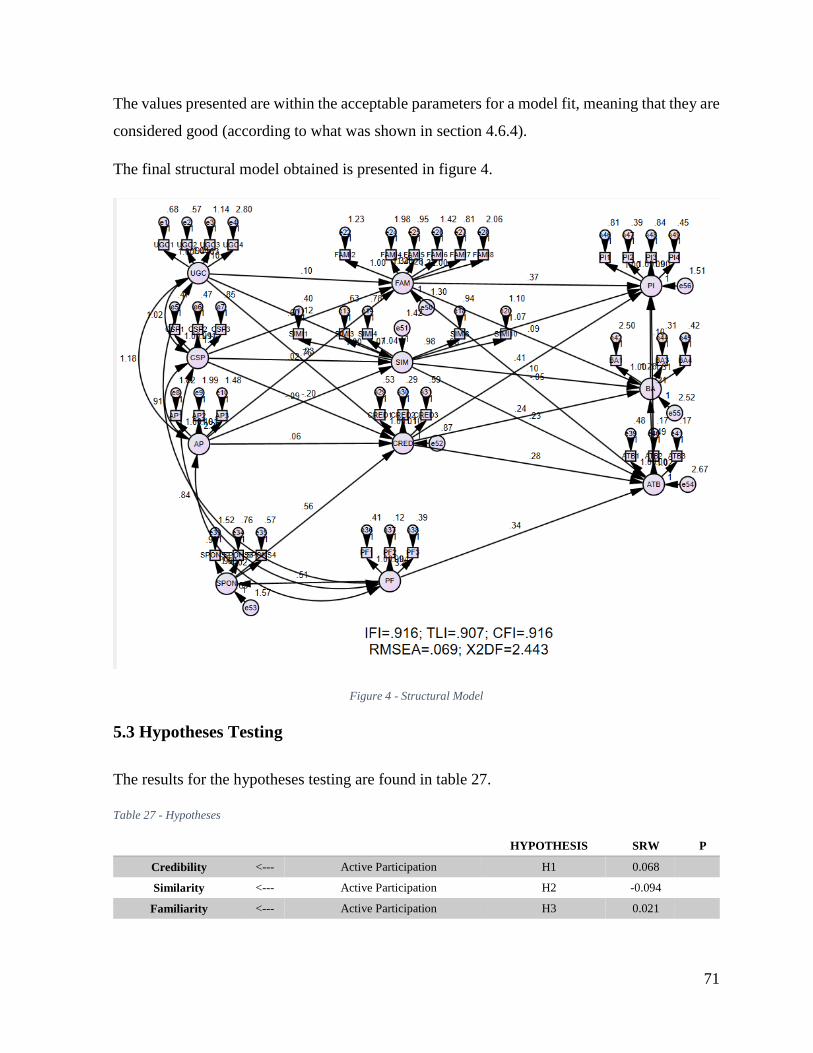
71
The values presented are within the acceptable parameters for a model fit, meaning that they are
considered good (according to what was shown in section 4.6.4).
The final structural model obtained is presented in figure 4.
Figure 4 - Structural Model
5.3 Hypotheses Testing
The results for the hypotheses testing are found in table 27.
Table 27 - Hypotheses
HYPOTHESIS SRW P
Credibility <--- Active Participation H1 0.068
Similarity <--- Active Participation H2 -0.094
Familiarity <--- Active Participation H3 0.021
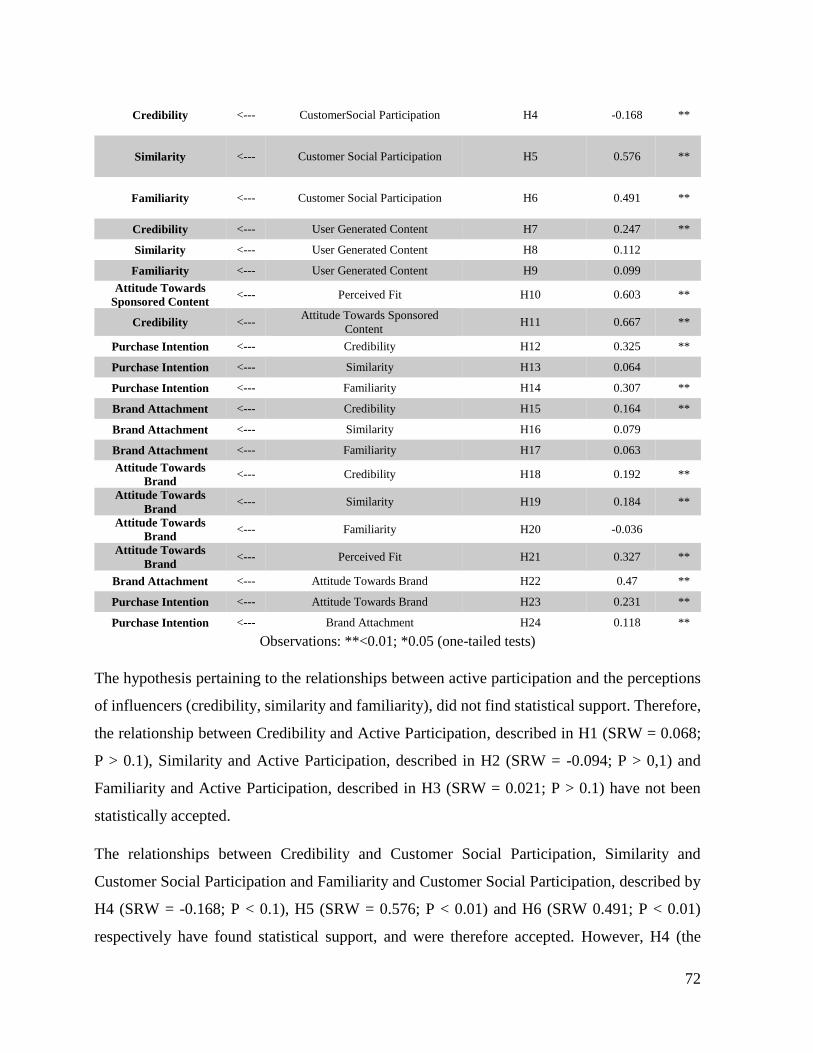
72
Credibility <--- CustomerSocial Participation H4 -0.168 **
Similarity <--- Customer Social Participation H5 0.576 **
Familiarity <--- Customer Social Participation H6 0.491 **
Credibility <--- User Generated Content H7 0.247 **
Similarity <--- User Generated Content H8 0.112
Familiarity <--- User Generated Content H9 0.099
Attitude Towards
Sponsored Content <--- Perceived Fit H10 0.603 **
Credibility <--- Attitude Towards Sponsored
Content H11 0.667 **
Purchase Intention <--- Credibility H12 0.325 **
Purchase Intention <--- Similarity H13 0.064
Purchase Intention <--- Familiarity H14 0.307 **
Brand Attachment <--- Credibility H15 0.164 **
Brand Attachment <--- Similarity H16 0.079
Brand Attachment <--- Familiarity H17 0.063
Attitude Towards
Brand <--- Credibility H18 0.192 **
Attitude Towards
Brand <--- Similarity H19 0.184 **
Attitude Towards
Brand <--- Familiarity H20 -0.036
Attitude Towards
Brand <--- Perceived Fit H21 0.327 **
Brand Attachment <--- Attitude Towards Brand H22 0.47 **
Purchase Intention <--- Attitude Towards Brand H23 0.231 **
Purchase Intention <--- Brand Attachment H24 0.118 **
Observations: **<0.01; *0.05 (one-tailed tests)
The hypothesis pertaining to the relationships between active participation and the perceptions
of influencers (credibility, similarity and familiarity), did not find statistical support. Therefore,
the relationship between Credibility and Active Participation, described in H1 (SRW = 0.068;
P > 0.1), Similarity and Active Participation, described in H2 (SRW = -0.094; P > 0,1) and
Familiarity and Active Participation, described in H3 (SRW = 0.021; P > 0.1) have not been
statistically accepted.
The relationships between Credibility and Customer Social Participation, Similarity and
Customer Social Participation and Familiarity and Customer Social Participation, described by
H4 (SRW = -0.168; P < 0.1), H5 (SRW = 0.576; P < 0.01) and H6 (SRW 0.491; P < 0.01)
respectively have found statistical support, and were therefore accepted. However, H4 (the
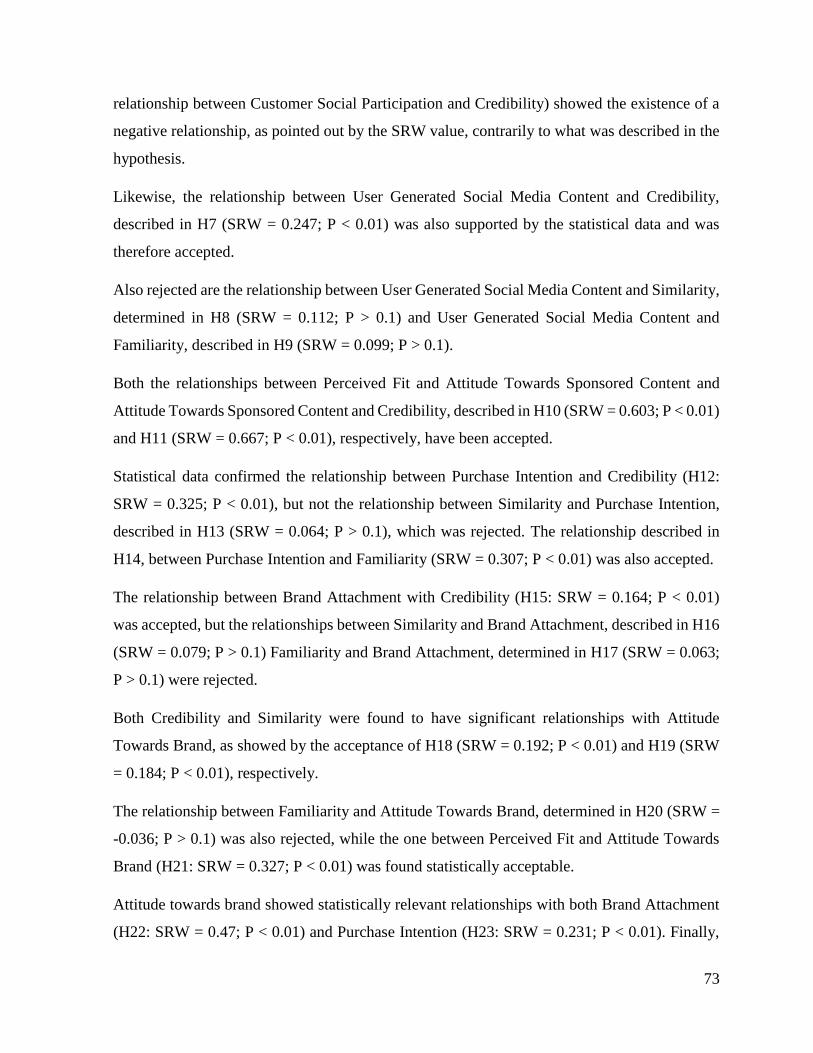
73
relationship between Customer Social Participation and Credibility) showed the existence of a
negative relationship, as pointed out by the SRW value, contrarily to what was described in the
hypothesis.
Likewise, the relationship between User Generated Social Media Content and Credibility,
described in H7 (SRW = 0.247; P < 0.01) was also supported by the statistical data and was
therefore accepted.
Also rejected are the relationship between User Generated Social Media Content and Similarity,
determined in H8 (SRW = 0.112; P > 0.1) and User Generated Social Media Content and
Familiarity, described in H9 (SRW = 0.099; P > 0.1).
Both the relationships between Perceived Fit and Attitude Towards Sponsored Content and
Attitude Towards Sponsored Content and Credibility, described in H10 (SRW = 0.603; P < 0.01)
and H11 (SRW = 0.667; P < 0.01), respectively, have been accepted.
Statistical data confirmed the relationship between Purchase Intention and Credibility (H12:
SRW = 0.325; P < 0.01), but not the relationship between Similarity and Purchase Intention,
described in H13 (SRW = 0.064; P > 0.1), which was rejected. The relationship described in
H14, between Purchase Intention and Familiarity (SRW = 0.307; P < 0.01) was also accepted.
The relationship between Brand Attachment with Credibility (H15: SRW = 0.164; P < 0.01)
was accepted, but the relationships between Similarity and Brand Attachment, described in H16
(SRW = 0.079; P > 0.1) Familiarity and Brand Attachment, determined in H17 (SRW = 0.063;
P > 0.1) were rejected.
Both Credibility and Similarity were found to have significant relationships with Attitude
Towards Brand, as showed by the acceptance of H18 (SRW = 0.192; P < 0.01) and H19 (SRW
= 0.184; P < 0.01), respectively.
The relationship between Familiarity and Attitude Towards Brand, determined in H20 (SRW =
-0.036; P > 0.1) was also rejected, while the one between Perceived Fit and Attitude Towards
Brand (H21: SRW = 0.327; P < 0.01) was found statistically acceptable.
Attitude towards brand showed statistically relevant relationships with both Brand Attachment
(H22: SRW = 0.47; P < 0.01) and Purchase Intention (H23: SRW = 0.231; P < 0.01). Finally,

74
Purchase Intention also showed a statistically relevant relationship with Brand Attachment
(H24: SRW = 0.118; P < 0.1).
5.4 Discussion
In this topic, a discussion of the results of the variables’ descriptive analysis and the hypothesis
testing will be presented, as to provide a detailed account of the relationship between internet
usage and digital influencers, sponsorship and the effects of digital influencers on attitude
towards brand, brand attachment and purchase intention.
5.4.1 Engagement and Perceptions of Digital Influencers
The analysis pertaining to online interaction and participation as antecedents to participants’
perceptions of influencers showed that customer social participation had a statistically
significant relationship with all of the perceptions of influencers, meaning that higher levels of
social participation and engagement in social media led to more positive perceptions of digital
influencers’ credibility, similarity and familiarity (H4, H5 and H6, respectively).
These findings further support previous research, such as Khan (2017), which identified social
interaction as one of the key motivations of consumption and participation on Youtube and
(Chung & Cho, 2017), who identified that continuous social interaction through social media
fostered parasocial interaction.
However, active participation was found not to have a statistically significant relationship with
any of the variables pertaining to perceptions of influencers. No relevant relationship was found
between active participation and credibility (H1), similarity (H2) or familiarity (H3) was
supported by statistical data, meaning that active engagement in social media has not been
shown to have a significant effect on how participants of the study perceived digital influencers.
Likewise, the only statistically relevant relationship found between perceptions of influencers
and user generated social media content was between this variable and credibility. Thus, neither
perceptions of familiarity (H9) or similarity (H8) were fostered by the consumption and
interaction with user generated social media content.

75
Such findings do not go directly against any of the studies researched, as direct correlations
between active participation and perceptions of influencers or user generated social media
content and perceptions of familiarity or similarity.
This study does corroborate the findings of (Hautz et al., 2014) by finding a positive relationship
between user generated social media content and credibility, though. These authors found a
connection between user generated videos and perceived source credibility, with user generated
content being perceived as more credible than advertisement created by companies.
Overall, these findings seem to point out that customer social participation is a better predictor
of perceptions of similarity, credibility and familiarity than active participation, and that the
consumption of user generated content is a good predictor of perceived credibility.
5.4.2 Sponsorship
Sponsorship was the second key element of this research. For the specific case of influencers,
sponsorship can influence how users perceive their reviews and the level of trust they put into
an influencer’s opinions. Accordingly to what was found by (Bergkvist et al., 2016), perceived
fit had a positive relationship with the attitude towards sponsored content (H10), meaning that
higher levels of perceived fit between influencers and the brands and products they endorse led
to a more positive attitude towards sponsored posts.
Partially in accordance to what was found by (Hwang & Jeong, 2016), users’ attitude towards
sponsored posts was found to have a positive relationship with the perceptions of influencer
credibility (H11). Meaning that a more positive attitude towards influencers’ sponsored content
should lead to equally positive perceptions of influencers’ credibility.
While Hwang and Jeong (2016) found that sponsorship disclosure could have negative effects
on perceptions of source credibility, but such could be counteracted by declaring that all
opinions showed in the sponsored content were honest. This dissertation found that the attitude
towards sponsored content has a role similar to the one played by attitude towards advertisement
in perceptions of source credibility.
76
5.4.3 Outcomes
Finally, the last set of hypotheses pertained to the effects of digital influencers on key marketing
concepts. From these, four relationships did not find statistical support. Contrarily to the
findings of Lee and Watkins (2016), the relationship between similarity and purchase intention
was not supported by the results of the statistical analysis.
Likewise, neither familiarity (H17) nor similarity (H16) were found to have a statistical relevant
relationship with brand attachment, thus the work does not corroborate the findings of (Arya &
Verma, 2018).
Finally, no significant relationship was found between familiarity and attitude towards the brand
(H20), contrarily to what was found by Lee and Watkins (2017), PSI did not influence
participants’ attitude towards brands or brand attachment.
However, significant relationships were found between purchase intention and credibility (H12)
and familiarity (H14), supporting the findings of (Lee & Watkins, 2016; Lee et al., 2017;
Ohanian, 1990).
The only statistically relevant relationship found with brand attachment was between this
variable and perceived credibility, which further supports the findings of Ohanian (1990), whose
study sought to validate a measuring scale for source credibility.
Attitude towards brand was found to have statistically relevant relationships with credibility
(H18) and similarity (H19), partially supporting the findings of Lee and Watkins (2016), whose
study found links between attitude homophily (similarity) and consumers’ perspective of luxury
brand items)
Finally, relationships between the three key marketing concepts, brand attachment, purchase
intention and attitude towards brand were all confirmed by the statistical analysis. Supporting
the findings of Park et al., (2010) and Spears and Singh (2004). Both brand attachment (H22)
and purchase intention (H23) were found to have positive relationships with attitude towards
brand, and brand attachment was also found to have a positive relationship with purchase
intention (H24).

77
Therefore, results confirm that the perceptions of influencer credibility are positively influenced
by customer social participation and user generates content, and have significant effects on
brand attachment, attitude towards brand and purchase intentions, being considered the most
relevant characteristic out of those explored in this study.
Furthermore, perceptions of familiarity and similarity were only influenced by customer social
participation. Similarity was only found to have a significant relationship with attitude towards
brand. Meanwhile, familiarity had a significant relationship with purchase intention.
Attitude towards sponsored posts was found to have significant relationships with perceived fit
and credibility. While perceived fit was also found to be linked with attitude towards brand.
Finally, all of the outcome variables were found to have significant relationships amongst
themselves, corroborating findings in literature that had previously linked purchase intention,
attitude towards brand and brand attachment.

78
6. Final Considerations
This research aimed to investigate the effects of digital influencers as marketing tools, namely
how consumers’ perspectives of digital influencers can impact brand attachment, attitude
towards brand and purchase intention. Adapted endorsement models were used to understand
consumers’ perceptions of influencers, and important variables such as attitude towards
sponsorship were added to fully comprehend consumers’ relationship with digital influencers.
An empirical research was done, by creating a questionnaire, which was then shared through
social media, namely through Facebook. Given the profile of respondents, the researcher
decided to focus on the answers of Brazilian women. A total of 301 women responded, forming
the sample for the investigation.
The questionnaire contained a brief introduction on the research’s theme, and the information
that the questionnaire was completely anonymous. The first questions aimed to characterize the
sample’s sociodemographic profile. These were followed by questions structured through
existing metrics for each of the variables (detailed in section 4.2.3 of this research).
After the data had been gathered, the researcher used the IBM SPSS software to create the
statistical database. Then, the IBM SPSS AMOS software was used to analyze this data using
the Structural Equations Model (SEM). Further tests, such as the EFA and the CFA were then
conducted using these two softwares, all of which presented values considered good or very
good.
Sample analysis revealed that active participation did not have significant relationships with any
of the perceptions of influencers, while user generated social media content had a statistically
significant relationship with credibility, and customer social participation had statistically
significant relationships with all of the perceptions of influencers, proving to be the most
important variable in predicting participants’ relationships with influencers.
Credibility was the most significant variable relating to the characteristics of influencers,
showing significant relationships with attitude towards brand, brand attachment and purchase
intention. These findings align with what was shown by Ohanian (1990), whose study pointed

79
out source credibility as a variable capable of influencing purchase intention and the value of
recommendations significantly.
Unlike the study made by Lee and Watkins (2016) familiarity did not present statistically
relevant relationships with brand attachment or attitude towards brand. In spite of studies which
link PSI with positive attitudinal effects (Labrecque, 2014; Lee & Watkins, 2016; Yuan et al.,
2016), such relationships were not proved by this dissertation.
The same can be concluded for similarity, as the relationship between this variable and purchase
intention or brand attachment were not proved by the analysis of statistical data.
However, the connections proposed by (Park et al., 2010; Spears & Singh, 2004) were all
confirmed, with attitude towards brand having statistical relations with both purchase intention
and brand attachment, and brand attachment also having a relevant relationship with purchase
intention.
Therefore, it can be concluded that, while not all of the relationships explored in this work were
corroborated, it has gathered promising data. Considering this, the next sections will further
discuss the contributes of the study and recommendations for future research pertaining to this
topic.
6.1 Contributes of the Study
Existing research on digital influencers is scarce, given the newness of the theme. However,
studies show, more and more, the importance of social media and eWOM for marketing (Erkan
& Evans, 2016), and digital influencers have shown a capacity to generate eWOM and endorse
brands and products through social media (Lee & Watkins, 2016; Uzunoğlu & Misci Kip, 2014).
Considering the gap found in literature on the effects of these individuals for marketing, this
research sought to empirically evaluate the impact of digital influencers on key marketing
concepts. In addition to the main relationship proposed by this dissertation, between the
perceptions of influencers and attitude towards brand, brand attachment and purchase intention,
another big contribution of this work is finding the correlation between the perceived fit between
influencers and their sponsored content and the attitude towards sponsorship, which has also
been linked to the perceptions of influencer credibility.

80
Amongst the greatest contributes of this study is the adaptation of measures historically used to
evaluate the effectiveness of celebrity endorsements to the perceptions of influencers.
Furthermore, the results point out towards the existence of an important relationship between
customer social participation and perceptions of digital influencers, and influencer credibility
and all three marketing constructs explored in this research. For companies, that means that
honesty, more than a sense of familiarity or similarity, can elicit positive responses from users
and consumers.
Another important contribution of this work was the addition of the effects of attitude towards
sponsored content on perceptions of credibility. Seeing as this has become a popular marketing
strategy, it is essential to further comprehend how the attitude towards sponsored content can
affect users’ perceptions of digital influencers.
This study has provided important contributions to marketing literature, and offers further
insight on the role of digital influencers and the outcomes of users’ perceptions of them. By
understanding how these individuals are perceived, and whether this can inspire attitudinal
changes and influence attachment, marketing professionals can strengthen their strategies and
create better relationships with both influencers and consumers alike.
For digital content creators, this research provides valuable insight on how viewers perceive
them, therefore allowing them to better tailor their recommendations, sponsored content and
strengthen their relationships with viewers.
6.2 Limitations and Recommendations for Future Research
Due to a lack of time and resources, the main limitation of this work was the use of a non-
probability convenience sample, which infers that its results cannot safely be extrapolated for
the overall population. The use of a sample composed only of Brazilian women further limits
the outcomes of this study. It is suggested that future research do studies of larger scopes, as to
properly represent a larger number of people.
The lack of inclusion of one particular brand or influencer may have influenced participants’
answers, as they were asked to base them on their favorite influencer. Further studies could

81
choose to focus on specific influencer-brand relationships. The use of an online questionnaire
also doesn’t allow the researcher to answer participants’ questions or doubts.
As for future research, beyond the aforementioned recommendations, there is a need for more
detailed studies regarding the antecedents of the perceptions of influencers. Understanding what
leads people to engage with digital influencers might further enrich existing literature and
provide insight on how to better tailor the relationship between users and digital influencers.
Finally, more studies pertaining to the perceptions of familiarity and similarity are needed, as
these have identified as key concepts in endorsement (Chung & Cho, 2017; Khan, 2017; Lee &
Watkins, 2016). Despite the results of the statistical analysis shown here, there is a need for
more detailed research regarding these variables in particular, to confirm whether they play a
part on digital influence or not.

82
Bibliographic References
Aaker, D. A., & Keller, K. L. (1990). Consumer evaluations of brand extensions. The Journal
of Marketing, 27–41.
Adnan, A., Jan, F. A., & Alam, W. (2017). Relationship between Celebrity Endorsements &
Consumer Purchase Intention. Abasyn University Journal of Social Sciences, 10(2),
356–372.
Arya, V., & Verma, H. (2018). Social Networking Sites and Brand Attachment. SCMS Journal
of Indian Management, 15(1), 96–109.
Ashley, C., & Tuten, T. (2015). Creative Strategies in Social Media Marketing: An Exploratory
Study of Branded Social Content and Consumer Engagement. Psychology & Marketing,
32(1), 15–27. https://doi.org/10.1002/mar.20761
Awad, N. F., & Ragowsky, A. (2008). Establishing Trust in Electronic Commerce through
Online Word of Mouth: An Examination across Genders. Journal of Management
Information Systems, 24(4), 101–121.
Bagozzi, R. P., & Dholakia, U. M. (2006). Antecedents and purchase consequences of customer
participation in small group brand communities. International Journal of Research in
Marketing, 23(1), 45–61. https://doi.org/10.1016/j.ijresmar.2006.01.005
Bauman, Z. (2013). Community: Seeking safety in an insecure world. John Wiley & Sons.
Bekk, M., Spörrle, M., Völckner, F., Spieß, E., & Woschée, R. (2017). What is not beautiful
should match: how attractiveness similarity affects consumer responses to advertising.
Marketing Letters, 28(4), 509–522. https://doi.org/10.1007/s11002-017-9428-3
Bergkvist, L., Hjalmarson, H., & Mägi, A. W. (2016). A new model of how celebrity
endorsements work: attitude toward the endorsement as a mediator of celebrity source

83
and endorsement effects. International Journal of Advertising, 35(2), 171–184.
https://doi.org/10.1080/02650487.2015.1024384
Boerman, S. C., Willemsen, L. M., & Van Der Aa, E. P. (2017). “This Post Is Sponsored”:
Effects of Sponsorship Disclosure on Persuasion Knowledge and Electronic Word of
Mouth in the Context of Facebook. Journal of Interactive Marketing, 38, 82–92.
https://doi.org/10.1016/j.intmar.2016.12.002
Brown, D., & Hayes, N. (2008). Influencer marketing: Who really influences your customers?
Routledge.
Brown, J., Broderick, A. J., & Lee, N. (2007). Word of mouth communication within online
communities: Conceptualizing the online social network. Journal of Interactive
Marketing, 21(3), 2–20. https://doi.org/10.1002/dir.20082
Carlson, A., & Lee, C. C. (2015). Followership and Social Media Marketing. Academy of
Marketing Studies Journal, 19(1), 80–101.
Carr, C. T., & Hayes, R. A. (2014). The Effect of Disclosure of Third-Party Influence on an
Opinion Leader’s Credibility and Electronic Word of Mouth in Two-Step Flow. Journal
of Interactive Advertising, 14(1), 38–50.
https://doi.org/10.1080/15252019.2014.909296
Centeno, D., & Wang, J. J. (2017). Celebrities as human brands: An inquiry on stakeholder-
actor co-creation of brand identities. Journal of Business Research, 74, 133–138.
https://doi.org/10.1016/j.jbusres.2016.10.024
Chae, H., & Ko, E. (2016). Customer social participation in the social networking services and
its impact upon the customer equity of global fashion brands. Journal of Business
Research, 69(9), 3804–3812. https://doi.org/10.1016/j.jbusres.2015.12.072

84
Choi, S. M., & Rifon, N. J. (2012). It Is a Match: The Impact of Congruence between Celebrity
Image and Consumer Ideal Self on Endorsement Effectiveness. Psychology &
Marketing, 29(9), 639–650. https://doi.org/10.1002/mar.20550
Chung, S., & Cho, H. (2017). Fostering Parasocial Relationships with Celebrities on Social
Media: Implications for Celebrity Endorsement. Psychology & Marketing, 34(4), 481–
495. https://doi.org/10.1002/mar.21001
Constantinides, E., & Holleschovsky, N. I. (2016). Impact of Online Product Reviews on
Purchasing Decisions. https://doi.org/10.5220/0005861002710278
Correia, M. R. de F. (2016). YouTube : um estudo sobre a influência, a decisão de compra.
YouTube : um estudo sobre a influência, a decisão de compra. Retrieved from
https://estudogeral.sib.uc.pt/handle/10316/33019
Damásio, B. F. (2012). Uso da análise fatorial exploratória em psicologia, 16.
Del Riego, A. (2009). Digest Comment–Context for the Net: A Defense of the FTC’s New
Blogging Guidelines. JOLT Digest, an Online Companion to the Harvard Journal of
Law and Technology.
Dziuban, C. D., & Shirkey, E. C. (1974). When is a correlation matrix appropriate for factor
analysis? Some decision rules. Psychological Bulletin, 81(6), 358–361.
https://doi.org/10.1037/h0036316
Ellison, N. B., Steinfield, C., & Lampe, C. (2007). The Benefits of Facebook “Friends:” Social
Capital and College Students’ Use of Online Social Network Sites. Journal of Computer-
Mediated Communication, 12(4), 1143–1168. https://doi.org/10.1111/j.1083-
6101.2007.00367.x
85
Erkan, I., & Evans, C. (2016). The influence of eWOM in social media on consumers’ purchase
intentions: An extended approach to information adoption. Computers in Human
Behavior, 61(Supplement C), 47–55. https://doi.org/10.1016/j.chb.2016.03.003
Etzioni, O., & Etzioni, A. (1999). Face-to-Face and Computer-Mediated Communities, A
Comparative Analysis. The Information Society, 15(4), 241–248.
https://doi.org/10.1080/019722499128402
Fornell, C., & Larcker, D. F. (1981). Evaluating structural equation models with unobservable
variables and measurement error. Journal of Marketing Research, 39–50.
Forrest, E., & Cao, Y. (2010). Opinions, recommendations and endorsements: The new
regulatory framework for social media. Journal of Business and Policy Research, 5(2),
88–99.
Hautz, J., Füller, J., Hutter, K., & Thürridl, C. (2014). Let Users Generate Your Video Ads? The
Impact of Video Source and Quality on Consumers’ Perceptions and Intended
Behaviors. Journal of Interactive Marketing, 28(1), 1–15.
https://doi.org/10.1016/j.intmar.2013.06.003
Hsu, C., Lin, J. C.-C., & Chiang, H. (2013). The effects of blogger recommendations on
customers’ online shopping intentions. Internet Research, 23(1), 69–88.
Hwang, Y., & Jeong, S.-H. (2016). “This is a sponsored blog post, but all opinions are my own”:
The effects of sponsorship disclosure on responses to sponsored blog posts. Computers
in Human Behavior, 62(Supplement C), 528–535.
https://doi.org/10.1016/j.chb.2016.04.026
Ilicic, J., Kulczynski, A., & Baxter, S. M. (2018). How a Smile Can Make a Difference:
Enhancing the Persuasive Appeal Of Celebrity Endorsers: Boosting Consumer
Perceptions of Celebrity Genuineness Through the Use of a “Duchenne Smile” in
86
Advertising. Journal of Advertising Research, 58(1), 51–64.
https://doi.org/10.2501/JAR-2016-003
Jaffari, S. I. A., & Hunjra, A. I. (2017). Mediating Impact of Celebrity Endorsement in
Relationship of Celebrity Characteristics and Consumers Purchase Intention. Abasyn
University Journal of Social Sciences, 10(2), 329–344.
Kamins, M. A., & Gupta, K. (1994). Congruence between Spokesperson and Product Type: A
Matchup Hypothesis Perspective. Psychology & Marketing, 11(6), 569–586.
Kaplan, A. M., & Haenlein, M. (2010). Users of the world, unite! The challenges and
opportunities of Social Media. Business Horizons, 53(1), 59–68.
Katz, E., & Lazarsfeld, P. F. (1966). Personal Influence, the Part Played by People in the Flow
of Mass Communications. Transaction Publishers.
Kaushal, S. K., & Kumar, R. (2016). Influence of Attitude Towards Advertisement on Purchase
Intention: Exploring the Mediating Role of Attitude Towards Brand Using SEM
Approach. IUP Journal of Marketing Management, 15(4), 45–59.
Khan, A. (2017). Does Celebrity Endorsement Affect Customers’ Purchase Intention? Analysis
of Findings from Delhi and Ncr. Pranjana: The Journal of Management Awareness,
20(1), 15–30. https://doi.org/10.5958/0974-0945.2017.00002.4
Khan, M. L. (2017). Social media engagement: What motivates user participation and
consumption on YouTube? Computers in Human Behavior, 66, 236–247.
https://doi.org/10.1016/j.chb.2016.09.024
Kiss, C., & Bichler, M. (2008). Identification of influencers — Measuring influence in customer
networks. Decision Support Systems, 46(1), 233–253.
https://doi.org/10.1016/j.dss.2008.06.007

87
Knoll, J., Schramm, H., Schallhorn, C., & Wynistorf, S. (2015). Good guy vs. bad guy: the
influence of parasocial interactions with media characters on brand placement effects.
International Journal of Advertising, 34(5), 720–743.
https://doi.org/10.1080/02650487.2015.1009350
Kotler, P., Kartajaya, H., & Setiawan, I. (2017). Marketing 4.0-Mudança do tradicional para o
digital. Coimbra: Conjuntura Actual Editora.
Kowalczyk, C. M., & Royne, M. B. (2013). The Moderating Role of Celebrity Worship on
Attitudes Toward Celebrity Brand Extensions. Journal of Marketing Theory & Practice,
21(2), 211–220. https://doi.org/10.2753/MTP1069-6679210206
Labrecque, L. I. (2014). Fostering Consumer–Brand Relationships in Social Media
Environments: The Role of Parasocial Interaction. Journal of Interactive Marketing,
28(2), 134–148. https://doi.org/10.1016/j.intmar.2013.12.003
Lee, J. E., & Watkins, B. (2016). YouTube vloggers’ influence on consumer luxury brand
perceptions and intentions. Journal of Business Research, 69(12), 5753–5760.
https://doi.org/10.1016/j.jbusres.2016.04.171
Lee, J. K., Lee, S.-Y., & Hansen, S. S. (2017). Source Credibility in Consumer-Generated
Advertising in Youtube: The Moderating Role of Personality. Current Psychology,
36(4), 849–860. https://doi.org/10.1007/s12144-016-9474-7
Lisboa, J. V., Augusto, M. G., & Ferreira, P. L. (2012). Estatística aplicada à gestão. Vida.
Lu, L.-C., Chang, W.-P., & Chang, H.-H. (2014a). Consumer attitudes toward blogger’s
sponsored recommendations and purchase intention: The effect of sponsorship type,
product type, and brand awareness. Computers in Human Behavior, 34, 258–266.
https://doi.org/10.1016/j.chb.2014.02.007

88
Lu, L.-C., Chang, W.-P., & Chang, H.-H. (2014b). Consumer attitudes toward blogger’s
sponsored recommendations and purchase intention: The effect of sponsorship type,
product type, and brand awareness. Computers in Human Behavior, 34(Supplement C),
258–266. https://doi.org/10.1016/j.chb.2014.02.007
Marconi, M. de A., & Lakatos, E. M. (2003). Fundamentos de metodologia científica. 5. ed.-
São Paulo: Atlas.
Marôco, J. (2010). Análise de equações estruturais: Fundamentos teóricos, software &
aplicações. ReportNumber, Lda.
McCormick, K. (2016). Celebrity endorsements: Influence of a product-endorser match on
Millennials attitudes and purchase intentions. Journal of Retailing and Consumer
Services, 32, 39–45.
McQuarrie, E. F., Miller, J., & Phillips, B. J. (2013). The Megaphone Effect: Taste and Audience
in Fashion Blogging. Journal of Consumer Research, (1), 136.
https://doi.org/10.1086/669042
Mitchell, A. A., & Olson, J. C. (2000). Are product attribute beliefs the only mediator of
advertising effects on brand attitude? Advertising & Society Review, 1(1).
Muniz, J., Albert M., & O’Guinn, T. C. (2001). Brand Community. Journal of Consumer
Research, 27(4), 412–432. https://doi.org/10.1086/319618
Neuman, W. L. (2013). Social research methods: Qualitative and quantitative approaches.
Pearson education.
Ohanian, R. (1990). Construction and Validation of a Scale to Measure Celebrity Endorsers’
Perceived Expertise, Trustworthiness, and Attractiveness. Journal of Advertising, 19(3),
39–52.
O’Reilly, T. (2005). What Is Web 2.0. Retrieved February 5, 2018, from http://oreilly.com{file}
89
Park, C. W., MacInnis, D. J., Priester, J., Eisingerich, A. B., & Iacobucci, D. (2010). Brand
Attachment and Brand Attitude Strength: Conceptual and Empirical Differentiation of
Two Critical Brand Equity Drivers. Journal of Marketing, 74(6), 1–17.
https://doi.org/10.1509/jmkg.74.6.1
Pestana, M. H., & Gageiro, J. N. (2003). Análise de dados para ciências sociais: a
complementaridade do SPSS.
Posavac, S. S., Sanbonmatsu, D. M., Seo, J. Y., & Iacobucci, D. (2014). How Attitudes Toward
Product Categories Drive Individual Brand Attitudes and Choice. Psychology &
Marketing, 31(10), 843–852. https://doi.org/10.1002/mar.20738
Schembri, S., & Latimer, L. (2016). Online brand communities: constructing and co-
constructing brand culture. Journal of Marketing Management, 32(7–8), 628–651.
https://doi.org/10.1080/0267257X.2015.1117518
Spears, N., & Singh, S. (2004). Measuring Attitude Toward the Brand and Purchase Intentions
(Vol. 26). https://doi.org/10.1080/10641734.2004.10505164
Srivastava, K., & Sharma, N. K. (2012). Consumer attitude towards brand-extension
incongruity: The moderating role of need for cognition and need for change. Journal of
Marketing Management, 28(5–6), 652–675.
https://doi.org/10.1080/0267257X.2011.558383
Suh, J.-C., & Yi, Y. (2006). When Brand Attitudes Affect the Customer Satisfaction-Loyalty
Relation: The Moderating Role of Product Involvement. Journal of Consumer
Psychology, 16, 145–155. https://doi.org/10.1207/s15327663jcp1602_5
Sun, T., Youn, S., Wu, G., & Kuntaraporn, M. (2006). Online Word-of-Mouth (or Mouse): An
Exploration of Its Antecedents and Consequences. Journal of Computer-Mediated
Communication, 11(4), 1104–1127. https://doi.org/10.1111/j.1083-6101.2006.00310.x

90
The Impact of Influencer Marketing and the Rise of Micro-influencers. (2018, January 26).
Retrieved June 29, 2018, from https://performancein.com/news/2018/01/26/impact-
influencer-marketing-and-rise-micro-influencers/
Tsai, H.-T., & Bagozzi, R. P. (2014). Contribution Behavior in Virtual Communities: Cognitive,
Emotional, and Social Influences. MIS Quarterly, 38(1), 143-A3.
Uzunoğlu, E., & Misci Kip, S. (2014). Brand communication through digital influencers:
Leveraging blogger engagement. International Journal of Information Management,
34(5), 592–602. https://doi.org/10.1016/j.ijinfomgt.2014.04.007
Verhellen, Y., Dens, N., & Pelsmacker, P. (2016). Do I know you? How brand familiarity and
perceived fit affect consumers’ attitudes towards brands placed in movies. Marketing
Letters, 27(3), 461–471. https://doi.org/10.1007/s11002-015-9347-0
Vickery, G., & Wunsch-Vincent, S. (2007). Participative Web And User-Created Content: Web
2.0 Wikis and Social Networking. Paris, France, France: Organization for Economic
Cooperation and Development (OECD).
Wang, S. W., Kao, G. H.-Y., & Ngamsiriudom, W. (2017). Consumers’ attitude of endorser
credibility, brand and intention with respect to celebrity endorsement of the airline
sector. Journal of Air Transport Management, 60, 10–17.
https://doi.org/10.1016/j.jairtraman.2016.12.007
Yao, Q., Chen, R., & Xu, X. (2015). Consistency Between Consumer Personality and Brand
Personality Influences Brand Attachment. Social Behavior & Personality: An
International Journal, 43(9), 1419–1427.
Yuan, C. L., Kim, J., & Kim, S. J. (2016). Parasocial relationship effects on customer equity in
the social media context. Journal of Business Research, 69(9), 3795–3803.
https://doi.org/10.1016/j.jbusres.2015.12.071

91

Appendixes
Appendix 1 - Survey

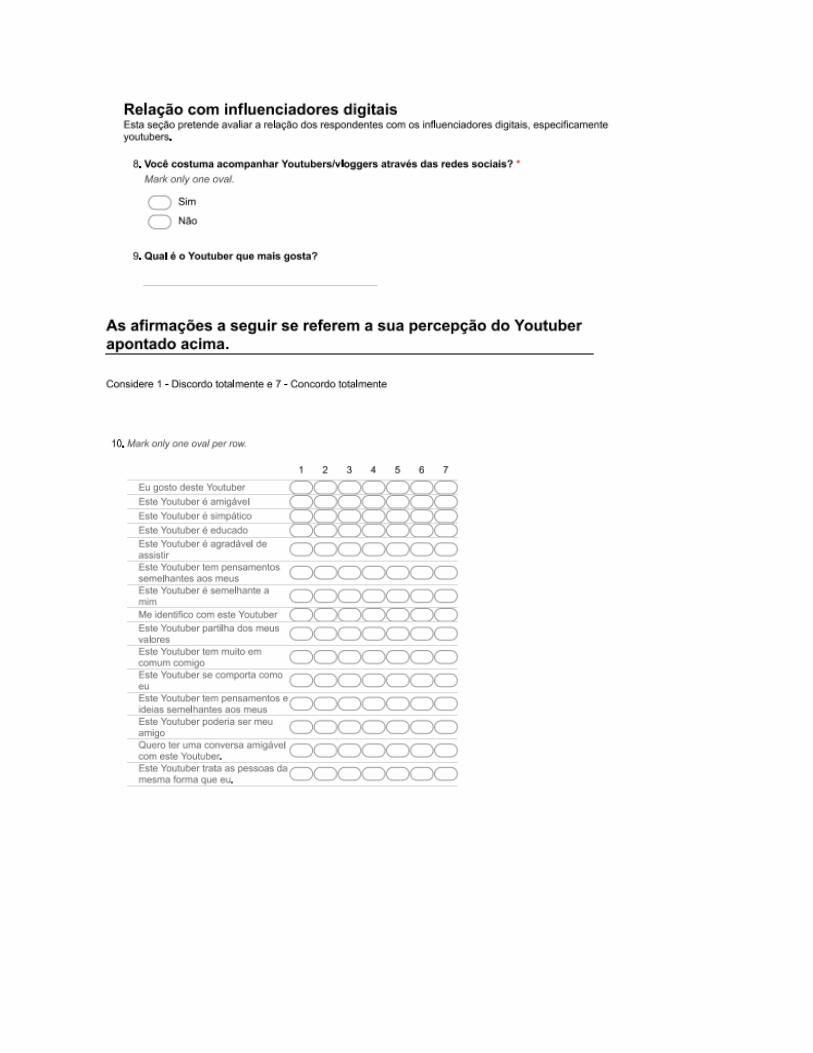


Appendix 2 - Discriminant validity
Estimate EST^2 AVE1 AVE2
UserGeneratedContent <--> CustomerSocialParticipation 0.617 0.38069 0.602 0.718
UserGeneratedContent <--> ActiveParticipation 0.532 0.28302 0.602 0.594
UserGeneratedContent <--> Similarity 0.408 0.16646 0.602 0.753
UserGeneratedContent <--> Familiarity 0.404 0.16322 0.602 0.66
UserGeneratedContent <--> Credibility 0.379 0.14364 0.602 0.81
UserGeneratedContent <--> AttitudeTowSpons 0.34 0.1156 0.602 0.73
UserGeneratedContent <--> PerceivedFit 0.301 0.0906 0.602 0.92
UserGeneratedContent <--> AttTowBrand 0.246 0.06052 0.602 0.933
UserGeneratedContent <--> BrandAtt 0.257 0.06605 0.602 0.839
UserGeneratedContent <--> PuchIntention 0.317 0.10049 0.602 0.844
CustomerSocialParticipation <--> ActiveParticipation 0.507 0.25705 0.718 0.594
CustomerSocialParticipation <--> Similarity 0.53 0.2809 0.718 0.753
CustomerSocialParticipation <--> Familiarity 0.485 0.23523 0.718 0.66
CustomerSocialParticipation <--> Credibility 0.122 0.01488 0.718 0.81
CustomerSocialParticipation <--> AttitudeTowSpons 0.155 0.02403 0.718 0.73
CustomerSocialParticipation <--> PerceivedFit 0.377 0.14213 0.718 0.92
CustomerSocialParticipation <--> AttTowBrand 0.285 0.08123 0.718 0.933
CustomerSocialParticipation <--> BrandAtt 0.168 0.02822 0.718 0.839
CustomerSocialParticipation <--> PuchIntention 0.33 0.1089 0.718 0.844
ActiveParticipation <--> Similarity 0.26 0.0676 0.594 0.753
ActiveParticipation <--> Familiarity 0.342 0.11696 0.594 0.66
ActiveParticipation <--> Credibility 0.308 0.09486 0.594 0.81
ActiveParticipation <--> AttitudeTowSpons 0.33 0.1089 0.594 0.73
ActiveParticipation <--> PerceivedFit 0.228 0.05198 0.594 0.92
ActiveParticipation <--> AttTowBrand 0.129 0.01664 0.594 0.933
ActiveParticipation <--> BrandAtt 0.152 0.0231 0.594 0.839
ActiveParticipation <--> PuchIntention 0.252 0.0635 0.594 0.844
Similarity <--> Familiarity 0.832 0.69222 0.753 0.66
Similarity <--> Credibility 0.22 0.0484 0.753 0.81
Similarity <--> AttitudeTowSpons 0.272 0.07398 0.753 0.73

Similarity <--> PerceivedFit 0.566 0.32036 0.753 0.92
Similarity <--> AttTowBrand 0.374 0.13988 0.753 0.933
Similarity <--> BrandAtt 0.34 0.1156 0.753 0.839
Similarity <--> PuchIntention 0.483 0.23329 0.753 0.844
Familiarity <--> Credibility 0.273 0.07453 0.66 0.81
Familiarity <--> AttitudeTowSpons 0.36 0.1296 0.66 0.73
Familiarity <--> PerceivedFit 0.535 0.28623 0.66 0.92
Familiarity <--> AttTowBrand 0.331 0.10956 0.66 0.933
Familiarity <--> BrandAtt 0.324 0.10498 0.66 0.839
Familiarity <--> PuchIntention 0.536 0.2873 0.66 0.844
Credibility <--> AttitudeTowSpons 0.695 0.48303 0.81 0.73
Credibility <--> PerceivedFit 0.437 0.19097 0.81 0.92
Credibility <--> AttTowBrand 0.365 0.13323 0.81 0.933
Credibility <--> BrandAtt 0.362 0.13104 0.81 0.839
Credibility <--> PuchIntention 0.522 0.27248 0.81 0.844
AttitudeTowSpons <--> PerceivedFit 0.596 0.35522 0.73 0.92
AttitudeTowSpons <--> AttTowBrand 0.414 0.1714 0.73 0.933
AttitudeTowSpons <--> BrandAtt 0.418 0.17472 0.73 0.839
AttitudeTowSpons <--> PuchIntention 0.614 0.377 0.73 0.844
PerceivedFit <--> AttTowBrand 0.484 0.23426 0.92 0.933
PerceivedFit <--> BrandAtt 0.424 0.17978 0.92 0.839
PerceivedFit <--> PuchIntention 0.77 0.5929 0.92 0.844
AttTowBrand <--> BrandAtt 0.577 0.33293 0.933 0.839
AttTowBrand <--> PuchIntention 0.518 0.26832 0.933 0.844
BrandAtt <--> PuchIntention 0.47 0.2209 0.839 0.844


