
Process improvement in an office environment using Lean Six Sigma
Finding ways to work smarter instead of harder in day-to-day
customer service operations
by
David Göransson
Arnela Tunovic
Diploma work No. 100/2012
at the Department of Materials and Manufacturing Technology
CHALMERS UNIVERSITY OF TECHNOLOGY
Gothenburg, Sweden
Diploma work in the Master’s Programme Quality and Operations Management
Performed at: Panalpina AB
Flöjelbergsgatan 18, 431 37 Mölndal
Supervisor: Anna Törmänen
Panalpina AB
Flöjelbergsgatan 18, 431 37 Mölndal
Examiner: Peter Hammersberg
Department of Materials and Manufacturing Technology
Chalmers University of Technology, SE - 412 96 Gothenburg

i
Process improvement in an office environment using Lean Six Sigma Finding ways to work smarter instead of harder in day-to-day customer service operations David Göransson & Arnela Tunovic
© DAVID GÖRANSSON & ARNELA TUNOVIC Diploma work no 100/2012 Department of Materials and Manufacturing Technology Chalmers University of Technology SE-412 96 Gothenburg Sweden
Telephone + 46 (0)31-772 1000
Chalmers Reproservice
Gothenburg, Sweden 2012
Process improvement in an office environment using Lean Six Sigma Finding ways to work smarter instead of harder in day-to-day customer service operations DAVID GÖRANSSON & ARNELA TUNOVIC
Department of Materials and Manufacturing Technology
Chalmers University of Technology

ii
Acknowledgements
This thesis is a part of the requirements for a M.Sc. degree in Quality and Operations Management at Chalmers University of Technology, and has been carried out at Panalpina AB in Mölndal, Sweden, during the spring and summer of 2012.
We would like to acknowledge and thank our supervisors, Anna Törmänen, Area Head of Business Process & Quality Northern Europe at Panalpina AB, and Peter Hammersberg, University lecturer, at the Department of Materials and Manufacturing Technology, Chalmers University of Technology, for their support throughout this project, and for giving us the opportunity to perform this thesis.
We would also like to thank the operators at the Ocean Import Department, their managers, and other employees at the Head Office for Panalpina Northern Europe for their interest in the project, and their willingness to help us whenever we had any problems or questions.
Gothenburg, August, 2012
David Göransson & Arnela Tunovic

iii

iv
Abstract
This project aims to analyze the current state and provide improvement proposals for the Ocean Import Department at Panalpina in Gothenburg, Sweden. The department is currently experiencing a heavy workload and feels that there is a need for a new way to improve their processes since they are lagging in performance when benchmarked against other departments within Panalpina. By using Lean Six Sigma the project could connect to an ongoing global continuous improvement program within Panalpina as well as the local interest for Lean Six Sigma.
The project was executed according to the DMAIC cycle known from Six Sigma theory. The first part was dominated by the measurements of the current state and different workshops, with the goal to map the process and frame problems and causes to variation in the process. During the second part of the project focus shifted towards Lean thinking as this turned out to be the appropriate course for this project.
It was realized that the greatest improvements lied in continuous improvements instead of heavy data analysis. Information and communication became the main themes in the project, both excess and lack of them is causing a stress on the operators, partly due to Panalpina´s worldwide operations which create room for many cultural differences and makes it hard to standardize processes. But even communication within the office has room for improvements, and waste is created as the customer is not always in focus.
Two models were developed that are meant to guide the future work with continuous improvements by identifying problem areas and providing guidance for how to handle them. Future measurements are recommended on variables inside the process, using process charts. This is a resource efficient way of measuring a process that gives easy analysis and a possibility to predict problems so that suitable countermeasures can be applied.

v

vi
List of abbreviations
B/L: Bill of Lading (receipt of shipment for legal and practical purposes) DMAIC: Improvement methodology used in Six Sigma FCL: Full Container Load LCL: Less then Container Load PDCA: Plan Do Check Act; improvement methodology used in Lean. PMT: Process Measurement Tool SOP: Standard Operating Procedure WIP: Work in progress (material being in production)

vii

viii
Table of Contents
1 Introduction ....................................................................................................................1
1.1 Background ..............................................................................................................1
1.2 Goal Statement ........................................................................................................2
1.3 Project planning .......................................................................................................2
2 Theory .............................................................................................................................3
2.1 Introduction to Six Sigma ..........................................................................................3
2.2 Introduction to Lean .................................................................................................4
2.3 Lean Six Sigma ..........................................................................................................7
2.4 Lean in service and administration ...........................................................................8
2.5 Six Sigma in service and administration ....................................................................8
2.6 Change management ...............................................................................................9
3 Methodology .................................................................................................................11
3.1 Literature study ......................................................................................................11
3.2 Action research ......................................................................................................11
3.3 Workshops .............................................................................................................11
3.4 Observations ..........................................................................................................11
3.5 Measurements .......................................................................................................12
3.6 Interviews ..............................................................................................................12
4 Define............................................................................................................................13
4.1 Identification of process and customer requirements.............................................13
4.2 Initial identification of problem areas .....................................................................17
4.3 Fishbone Diagram ...................................................................................................19
4.4 A defined summary ................................................................................................19
5 Measure ........................................................................................................................21
5.1 Identification and classification of process parameters ..........................................22
5.2 Detailed measurements of the process ..................................................................25
5.3 A measured summary .............................................................................................29
6 Analyze ..........................................................................................................................31
6.1 The measurements .................................................................................................31
6.2 Insight in the process – visit “Gemba” ....................................................................32
6.3 Investigate the possibilities of a reorganization ......................................................32
6.4 Areas of focus for improvements ............................................................................33
6.5 An analyzed summary ............................................................................................36
7 Improve .........................................................................................................................37

ix
7.1 Introductory workshops .........................................................................................37
7.2 Identified areas of focus for improvements ............................................................39
7.3 Model for continuous day-to-day improvement work ............................................43
7.4 Model for long-term improvements .......................................................................45
7.5 Benchmarking ........................................................................................................48
7.6 Cultural change ......................................................................................................48
7.7 An improved summary ...........................................................................................48
8 Control ..........................................................................................................................51
8.1 Control parameters ................................................................................................52
8.2 Updated FMEA .......................................................................................................55
8.3 A controlled summary ............................................................................................56
9 Results...........................................................................................................................59
10 Discussion ..................................................................................................................61
11 Conclusions ................................................................................................................63
12 References .................................................................................................................65
Appendix A: Problems that would cause a customer to change forwarder ...........................69
Appendix B: Affinity-Interrelationship Method (AIM) ...........................................................70
Appendix C: Cause and Effect Matrix ....................................................................................71
Appendix D: Process Measurement Tool (PMT) ....................................................................72
Appendix E: Detailed improvement suggestions for job costing ............................................73
Appendix F: Detailed improvement suggestions for invoicing ...............................................74
Appendix G: Current state description of the process ...........................................................76

1
1 Introduction
1.1 Background
Panalpina 1.1.1
Panalpina is a global shipping company with around 15 000 employees worldwide, represented with offices in more than 80 countries. The head office for northern Europe is located in Gothenburg, Sweden and has 40 employees. Approximately 20 employees are working directly with the day-to-day operations involved in shipping; air freight as well as ocean freight, import as well as export.
Today Panalpina has an internal continuous improvement program called PanCIP, containing elements from both Lean and Six Sigma. The goals are, among others, to move away from a fire fighting modus and standardize the way the company works with improvements. This includes involving every employee by performing daily improvements on department level. This project is partly derived from the PanCIP initiative, where identifying problems as well as improvements is central.
Global benchmarking within Panalpina shows that the productivity of the six employees at the Ocean Import Department in Gothenburg is quite moderate, at the same time as they are experiencing a high workload with much stress and a high pace in the daily work. Since the company previously has tested some Lean and Six Sigma tools it was decided to investigate how these concepts could be used to decrease the workload on the employees by raising productivity and the quality in the processes. To ease productivity benchmarking and process analysis Panalpina has developed their own Process Measurement Tool, which was thought to provide data to different Six Sigma tools. Lean was included since the initiative is well known for raising productivity and quality through focus on customer and reducing waste among other things.
Problem Description 1.1.2
Today there is a global way of working within Panalpina, associated with a standardized way of measuring efficiency in certain activities. Through international comparison with other Panalpina offices, the Gothenburg office has realized that there is a need for improvements in efficiency, since the number of handled shipments per employee is too low. At the same time, the operators are experiencing a very high workload; therefore there is a need to improve the way of working.
There will be a change in business system within Panalpina, from FOS to SAP TM in a couple of years. Therefore the local office is interested in a Lean Six Sigma improvement project for several reasons. Apart from raising productivity, a successful Lean Six Sigma project will provide a good analysis of the current state as well as the state after the improvements are implemented. A thorough description of the current state and the existing problems is an important delivery of a project like this, and suggestions about where to start with solving them will allow the company itself to start solving the problems with a longer timeframe in mind. This will create a stable growing ground for continuous work on improvements after the end of this project. This analysis of the current state will also serve as a foundation for benchmarking of SAP regarding efficiency. Thus there will be a possibility to compare the current state with an improved state and finally the future state with SAP.
2
Sustainability 1.1.3
A Lean enterprise is working in an efficient manner with as low volumes as possible of created waste, both regarding its physical products and its internal processes. Through this waste reduction it is possible to reduce the amount of resources that is needed to create a desired product. In the shipping industry, this has a great potential to reduce the environmental impact that is created when goods are sent across the globe.
Although Panalpina’s customers do not rank Environmental impact to be of major importance when choosing forwarder, it is still present in the evaluation seen in figure 4.1. The scope of this project is on the office process at Panalpina in Gothenburg, for the short-term it is thought that waste reduction will be seen as reduction in the usage of paper. But in the long-term it is thought that Lean thinking in the company has the potential to gain benefits such as those mentioned above.
1.2 Goal Statement
Purpose 1.2.1
The purpose of this master thesis is to analyze and provide a description of the current state of the ocean import process at Panalpina. This will then be used to initiate improvement work to raise the productivity of daily operations at Panalpina through decreased waste and increased process and customer focus by using the Lean Six Sigma DMAIC cycle. Ways to measure the process in a way that will capture implemented and future changes will be proposed. The measurements done during the project will also serve as a comparison to the future state that will arise after the change to SAP business system.
Scope 1.2.2
The scope of the project is to improve the processes at the Ocean Import Department. The processes that are included range from customer request to customer invoicing, including shipment booking, order processing and customs clearance. The research questions that will guide the work are as follows:
1. What factors are affecting the process at the Ocean Import Department at Panalpina’s Gothenburg office?
2. How can these factors be measured and controlled?
3. How can long-term improvement work be initiated at the department?
Delimitations 1.2.3
Only Ocean Import Department will be considered. Only processes performed by the staff at Panalpina’s Gothenburg office will be considered. The project duration is 20 weeks, which brings the limitation that any changes performed in the process cannot be measured during a longer period of time.
1.3 Project planning The Gantt-schedule was created upon experiences from previous Six Sigma projects with respect to the time required for each phase of the DMAIC cycle and adopted to this projects duration of 20 weeks. Another thing that needed consideration was the holiday period starting around project week 17, reducing the possibility to do implementations, have access to personnel and present results.
3
2 Theory
In this chapter, theory on Lean and Six Sigma is presented, as well as theory on the combination of these two initiatives, Lean Six Sigma. It is investigated how Lean and Six Sigma can be adapted to the process that is treated in this report, customer service and administration. Lastly, since this project aims at finding improvements and implementing them, studies on how to implement changes in an organization are also performed.
2.1 Introduction to Six Sigma Six Sigma was established by Motorola in 1987 as a strategic initiative. Since then, it has been deployed in a growing number of global firms. The initiative was specifically designed to attack any problems derived from variation, both by reducing variation as well as by improving the mean value, and is useful for both ongoing improvements as well as breakthrough improvements. The name Six Sigma has a specific meaning in terms of quality. When process performance is operating at a Six Sigma-level, the variation in the process or product characteristic generates a maximum of 3.4 defects per million opportunities (Magnusson, Kroslid, Bergman, 2003). An illustrative example by Spedding and Pepper (2010) describes the difference of 99 per cent quality and Six Sigma levels of quality. If the post office was operating at 99 per cent quality, there would be 3000 misdeliveries of letters for every 300 000 letters delivered, while with Six Sigma Quality there would be only one misdelivery.
Weaknesses with the Six Sigma methodology include its complexity; following the extensive problem solving methodology even for smaller problems with easy solutions is seen as overdoing it, and there is a risk of sub optimizations when the whole value chain is not considered (de Koning et al, 2006).
Variation is central in Six Sigma 2.1.1
Variation is often divided into two different types; common cause variation, which is natural variation that is connected to the system, and special cause variation, which is related to certain special conditions. Both types of variation should be addressed in order to achieve real breakthrough improvements (Magnusson, Kroslid, Bergman, 2003). According to Pojasek (2003) Six Sigma is the means of reducing variation in the process, while keeping the basic process as it is. The focus on reducing variation is motivated by excess costs, as variation is described as the main cause to dissatisfied customers, unsatisfactory margins, various delays, and poor supply chain performance among other things.
The DMAIC-cycle 2.1.2
The improvement methodology in Six Sigma for already existing processes is called DMAIC and consists of five phases, as described by Andersson et al (2006):
Define. The process or product that needs improvement is identified. The project structure is set up, and customers are identified.
Measure. Key influences of the process are identified, and ways to measure them are established.
Analyze. The factors that need improvements are analyzed.
Improve. The most effective solution is designed and implemented.
Control. Confirmation that the solution was effective and make sure it sustains over time.

4
In the Define phase, the result variable, “y”, that is to be improved is identified, and the performance of y is estimated. Moving on to the Measure phase, input factors, “x’s” that might affect the y are identified, and new detailed data on both the y’s and the x’s is gathered. In the Analyze phase, the x’s that influence the y’s are mapped, meaning that the relationship between them is established. A solution is designed in the Improve phase, based on the relationships established in Analyze, and in the Control phase it is verified that the improvements in y have been achieved (Magnusson, Kroslid, Bergman, 2003).
Measurements 2.1.3
Another central aspect in Six Sigma is having a measurement system in place for measuring the process performance. The performance is measured by monitoring critical to quality characteristics, CTQs, which can be divided into three categories of characteristics; critical-to-customer, critical-to-process and critical-to-compliance. These characteristics are identified and data is collected from the relevant processes. By calculating the mean of the results of the characteristics, the process performance can be retrieved (Magnusson, Kroslid, Bergman, 2003).
2.2 Introduction to Lean The development of Lean is derived from the Toyota Production System, which originated in Japan after the Second World War. At this point, Toyota was operating in an environment that had limited resources when it comes to land as well as technology, ironstone and financial investments. These specific circumstances made Toyota redefine efficiency in their own way, and come up with new ground principles in order to cope with the scarce resources. The basic idea of Lean is to focus on flow efficiency instead of resource efficiency and to focus on the customer, producing only what the customer wants, in the amounts the customer wants it, and at the time the customer wants it (Larsson, 2008). Lean developed to be a set of principles, practices, tools and techniques focused on reducing waste, coordinating workflows and handling variability (de Koning et al., 2006).
Continuous improvements are important 2.2.1
Continuous improvements, or “Kaizen”, is another important aspect of lean, meaning that a company should strive for improving continuously at every part of the organization. A concept within working with continuous improvements is the PDCA-cycle, which is a structured problem-solving approach. The PDCA-cycle recognizes environments as dynamic, and encourages people to deal with problems as they occur. The planning is of the essence, by identifying problems and finding root causes, countermeasures can be tested. The procedure is an iterative one; by testing countermeasures and comparing the actual results with the expected ones, the next cycle of improvements can be planned (Liker & Franz, 2011).

5
Figure 2.1 The PDCA-cycle, as described by Liker & Franz (2011)
Toyota has managed to spread the PDCA-thinking to all levels of employees; it is not just handled by Lean experts (Liker & Franz, 2011). With this standardized way of solving problems, standard operating procedures can be developed if the changes are considered to be good (Alänge, 1994). But, the work with PDCA is constantly ongoing; a project is not just closed when an appropriate countermeasure is taken. The countermeasure is only put in place until a better one is developed (Liker & Franz, 2011).
Waste is a central concept in Lean 2.2.2
All forms of non-value adding activities are seen as waste and should be eliminated. Any activity that the customer is not prepared to pay for is considered as waste, and it should therefore be removed whenever possible. A “non-value adding but necessary activity” is something that for example might be required by law. Since these activities cannot be removed, the time spent on them should be as short and efficient as possible (Liker, 2004). The seven different wastes identified by Toyota, described here by Liker (2004), can be found in any environment, in anything from product development to an office or an assembly line:
Overproduction – Producing parts that there is no customer for “in case it will be needed”
Waiting - Staff waiting for the next action, or an operator having to observe an automated machine
Unnecessary transportation - Short or long movements of goods or personnel that does not add any value
Over-processing – Producing higher quality than what is needed
Excess inventory – Too much raw material or work in progress, WIP, hides problems and reduces cash flow
Unnecessary movement – Wasted motion done by an operator such as bending, reaching, stacking or walking to get material
Plan Identify gap to
target, analyze root cause and develop countermeasures
Do Develop,
communicate and execute
implementation plan
Check Monitor
implementation plan, modify it and
monitor results
Act Evaluate results, standardize and identify further improvements

6
Figure 2.1 Visualization of lead time reduction, black lines indicate movement from one process to the next including waiting for processing. Blue boxes the time spent being processed.
Defects – Causing rework, scrap, replacement production and wasted time
Unused employee creativity – Lost involvement from and ideas generated by the employees
The flow of activities is of the essence 2.2.3
An important aspect of Lean is to map the flow of activities in order to be able to identify which activities that are creating value for the customer, and which ones that should be eliminated. The products should flow through the process at the same speed as the customers require them. This is the takt time, which sets the pace for the manufacturing system. This way, the customer needs create a pull in the organization (Bergman & Klefsjö, 2010).
Flow efficiency is reached by shifting focus from the producing unit (machine, operator etc.)
to the unit that is being processed and strive towards as short lead time as possible.
Maximizing the flow efficiency means that the product should be added value 100 % of the
time it is in production (Modig, Åhlström, 2011). This is visualized as an example in Figure 2.1
where the total lead time has been reduced by 40 %. The processes can be seen as black
boxes that have not been improved anything, instead emphasis has been on reducing the
time between processes. Although this does not give any immediate increase in capacity, it
has several benefits over the traditional way of analyzing a process. First of all, the lead time
towards customer is reduced since the product does not have to wait to be processed. The
second benefit is a better overview, since a reduced lead time gives reduced levels of
inventory that creates a better physical overview in the producing area. In an office
environment this is also creating a shorter “mental changeover”; time when the operator is
changing from one task to another. Put simply, it is easier to handle one task at the time and
to finish it properly, than to handle several tasks in parallel. Another consequence of
reduced levels of inventory is the reduced chance of making an error due to human
mistakes. If any person has to handle too many tasks in parallel and switch between them, it
is much easier to mix things up and to make a mistake (Modig & Åhlström, 2011). Liker
(2004) describes the mentality at Toyota, where the operators at the assembly line are
instructed and given the power to stop their part of the assembly line as soon as they
discover any problem or deviation. This way the consequences of errors or problems can be
reduced and no faulty products will be produced. Since mistakes are discovered in an earlier
stage, it is easier to track them back to the source, and that reduces the risk that even more
T=1000
Timeline:
T=0 T=60

7
parts will be produced with the same defect. Traditional batch production has the risk to
give an output where a large number of parts have been produced with the same error,
instead of allowing the problem to be detected and counteractions taken as soon as it
occurs. In Lean, problems are sought for and considered as something positive, in order to
be able to analyze them, learn from them and not let them happen again.
2.3 Lean Six Sigma While the two initiatives described above have innumerous success stories behind them
(Wedgewood, 2006), the question is if they can be combined in a way that provides the
same good results as the initiatives do as separate entities.
Wedgewood (2006) states that Lean and Six Sigma are ultimately both initiatives for
business process improvements. The end goals of better process improvements are the
same for the methodologies, but they focus of different elements of a process and are
therefore complementary. Six Sigma is described as the systematic methodology to find
crucial elements for the performance of a process and set them to the best levels, while
Lean is described as a systematic methodology of eliminating waste and reducing the
complexity of a process (Wedgewood, 2006).
Liker and Franz (2011) express doubts regarding the way Lean Six Sigma has been used at
some companies, with “Lean Six Sigma experts” coming in with a heavy focus on statistical
tools in order to save money. There is a risk that the experts come in, perform their project
and leave wobbly processes behind them. But it is emphasized that the tools of the Lean Six
Sigma movement are excellent if applied in the right way, by developing learning and a
cultural change at the company (Liker and Franz, 2006).
de Koning et al (2006) state that one of the strengths of Six Sigma is that it contains a strong,
organizational framework for its deployment, something that is missing in Lean. In general,
de Koning et al (2006) propose that combining Lean with Six Sigma is ideal; they complement
each other by Lean having a total system approach, while Six Sigma contributes with a
general problem solving framework and organizational structure. George (2003) states that
the two methodologies are often considered as rivaling, but argues that a merger between
Lean and Six Sigma is needed due to the fact that Lean dos not provide statistical control to a
process and Six Sigma cannot radically improve process speed. Andersson, Eriksson and
Torstensson (2006) similarly state that the concepts are complementary and that they could
be used one by one or combined. The following quote from Wedgewood (2006) describes
quite well the difference between the two strategies, as well as motivation for combining
them:
“In simple terms, Lean looks at what we shouldn’t be doing and aims to remove it; Six Sigma
looks at what we should be doing and aims to get it right the first time and every time, for all
time” (Wedgewood, 2006, p. 7)

8
2.4 Lean in service and administration During the years, Lean has developed from being a production philosophy to being used in all sorts of processes; service, health care, administration et cetera. The ideas of Lean are not different in administrative processes from production processes, but an adaption needs to be made when it comes to using examples and terminology that fits the current process. The core principles are still the same; the base consists of satisfying the customer needs in a resource-efficient way, while maintaining continuous improvements and a long-term view (Larsson, 2008). It is important to have the view that each function and employee has a customer; whether it is an internal or external one. By agreeing on clear specifications for the deliveries from supplier to customer, further quality improvements can be found. Another difference is that in a production process, the physical flow is easier to see when a stop in the production occurs, and quality defects are easier to spot. In an administrative process, it is usually more challenging to see the physical flow, which makes it more problematic to improve (Larsson, 2008).
By investigating contingencies in applying Lean production to service operations, Åhlström (2004) emphasizes that Lean production principles need to be translated and interpreted to service operations by making changes to fit the service operations, and not just merely applying them as they are. An empirical base was used where four service companies applied Lean production, and it was investigated how well Lean can be translated to service operations. A number of Lean principles were investigated; elimination of waste, zero defects, pull instead of push, multifunctional teams, decentralization of responsibilities, vertical information systems and continuous improvements. It was found that all Lean principles are applicable in service settings, but due to the nature of the service operations, involving a high involvement of the customer in the process, there are some contingencies connected. An example of this is that zero defects are not possible to achieve in service operations, therefore prioritization and recovery from failure are elements that need to be considered (Åhlström, 2004). The definition of what “waste” is might differ from a production process to an administrative process (Larsson, 2008). Another contingency is therefore that there is a risk with the principle of waste elimination, since what one customer sees as waste, another may see as something value-adding. Also, service operations are usually already characterized by pull rather than push; the service can not be stored and is produced when it is needed (Åhlström, 2004).
2.5 Six Sigma in service and administration Six Sigma has been deployed in a wide range of industries, starting in the electronic equipment business of Motorola and developing into an initiative that can be used in health care as well as service industries. Many service industries still live under the impression that Six Sigma is an initiative dedicated to the manufacturing industry. If service organizations were to deploy Six Sigma they could benefit from a number of improvements, such as increased knowledge among employees in problem solving, decisions based on data and facts, increased understanding in customer needs together with expectations and improved internal operations (Antony, 2006).
There is a challenge in the service industry of having quality data available, as well as defining defects and being able to compare defects against each other (Antony, 2006). For example, a defect of not performing an invoice on time might not be as serious as a defect of losing a customer, a similar contingency as in Lean when defining waste for services.

9
Antony et al. (2007) state that it is difficult to establish measurements of quality in service organizations. It is also described that service processes are generally not well understood or controlled due to a large amount of noise factors. Another problem with Six Sigma in service operations is described by Nakhai & Neves (2009), who states that all studies of Six Sigma applications to service industries have been done in manufacturing like settings where human interaction has been kept low and repeatability kept high. This way it has been possible to transfer the experiences from manufacturing industry to service operations. Their conclusion is that although Six Sigma comes with a useful toolbox based on the DMAIC cycle, it is clear that the nature of customer service is a challenge for Six Sigma since it has problems meeting customer expectations and variation.
2.6 Change management When performing changes in a process, a necessary aspect to take into consideration is the people that are affected by it, whether they are living the process, or if they are a supplier or customer to it. Here, it is important not to force Six Sigma initiatives on employees, but rather involve them and give them the opportunity to evaluate the methodology themselves (Magnusson et al., 2003). Cotter (2007) claims that transformation takes time, and therefore it is important to have short-term wins, in order to keep employees motivated in taking on the challenge that a long-term project implies.
Antony & Coronado (2002) have through reviewing the literature found a number of success factors when it comes to implementing Six Sigma projects. The involvement and commitment of management is listed as the most important factor; if the management is not involved, the importance of the project will weaken. Another important aspect is cultural change, since some organizational cultures are based on fear, and contain a strong resistance to change. Eckes (2000), as described by Antony & Coronado (2002), listed four factors that affect resistance to change in Six Sigma projects: technical, due to not understanding the statistics required, political, which is when the solutions are to be implemented as a loss, individual, which is when employees are stressed due to personal problems, and organizational, which is when the organization is committed to certain beliefs, usually communicated by the management. The counteractions proposed here are to involve employees, create a need for change and point out the benefits of change, and communicate these benefits to the managers. Also, if the employees are experiencing personal problems, their stress could be reduced with less workload. Delegation and empowerment of employees are also mentioned as important factors of managing resistance to change (Antony and Coronado, 2002).
Nadler and Tushman (1996) list three major problems of implementing changes in an organization, where the changes are mostly linked to changing the organizational design. The first problem is the problem of power, where a change might induce shifting of power in the organization. Based on how people perceive that their environment might change, they may take certain actions. The other problem is related to anxiety. Moving on to something unknown may create doubts in people on where their place will be in the new organization. Due to this, people may passively resist the change. The third problem is the one of organizational control, where systems of management control might be undermined during the transition period. The counteractions for these three types of problems are related to the ones described by Antony and Coronado (2002). For the first problem, it is suggested to shape the political dynamics by, among other suggestions, getting the support of key power

10
groups, and to build in stability by reducing excess anxiety, defensive reactions and conflicts. For the second problem it is suggested to motivate constructive behavior. Two actions here are to create dissatisfaction with the current state, and to encourage participation, where benefits can be seen in the form of increased motivation. The third problem can be dealt by managing the transition. Two suggestions here are to develop and communicate a clear picture of the future state, as well as obtaining feedback about the transition state (Nadler and Tushman, 1996).
In an interview with Coutu (2002) E.H. Schein argues that learning on a personal level only happens when survival anxiety (that you have to learn in order to not lose your job, a certain reward et cetera) is greater than learning anxiety (fear to abandon old and known habits, to try something new that might be difficult). In situations of harsh external conditions, the survival anxiety will increase and people will adopt to change, but the question is how to achieve these results without all the negative aspects of external pressure? E.H. Schein in Coutu (2002) sees a solution is psychological safety where people dare to learn, but this is something that is opposed the situation in many companies where frequent reorganizations rather encourage employees to settle down and adopt a wait-and-see attitude.

11
3 Methodology
The primary research framework for this report was the DMAIC-cycle of Six Sigma. This was chosen since the researchers had an understanding in the framework from previous projects and considered it to be highly suitable when it comes to executing these types of improvement projects. DMAIC is described in chapter 2.1.2 and stands for Define, Measure, Analyze, Improve and Control. The data was collected in numerous ways, both in workshops and interviews with employees of Panalpina, as well as observations and measurements of the process. The project demanded a great deal of interaction with employees of Panalpina, both the operators working in the process to be analysed, as well as management support.
3.1 Literature study In the first stages of the project, a literature study was performed in order to find theory that was applicable to the project. Literature on both Lean and Six Sigma was studied, especially literature involving the application of Lean and Six Sigma in service and administrative operations. Also, the integration of Lean and Six Sigma into one single strategy was investigated, since it was decided that the project would contain elements of both. Another parts of theory investigated was change management, as part of the project aim is to initiate improvements at the company. Change management was considered as important in order to perform smooth transitions from the current state to a future state.
3.2 Action research Action research is defined as “an approach in which the action researcher and a client collaborate in the diagnosis of a problem and in the development of a solution based on the diagnosis” (Bryman & Bell, 2007, p. 413). The aim of action research is to support the continuous learning of both the members of the organization, as well as the researchers. The researchers treat and perform experiments on a real problem, which assists the practitioners of the organization in a re-education process by forming new courses of action (Bryman & Bell, 2007). This master’s thesis was performed in the frames of action research, meaning that the researches actively diagnosed the situation at the Ocean Import Department and took great help of theory, as well as the employees at the department, in finding problems and appropriate counteractions. The counteractions were then tested as experiments in order to be accepted, discarded or further developed. Action research and the DMAIC-cycle can be seen as two very similar frameworks.
3.3 Workshops During the project, a number of workshops were performed together with the employees at Panalpina. The workshops had multiple purposes; for the first part of the project they were performed in order for the researchers to learn more about the process, and to identify problem areas. Workshops were also performed in order for employees to get a common language and understanding of the problems. For the later part of the project, workshops were performed in order to train the employees in certain tools, as well as to induce lean thinking and principles.
3.4 Observations The researchers performed observations in order to get to know the process as it is currently performed at the Ocean Import department. As a base for learning the process, internal SOPs were studied to get an introduction to how the work was performed.

12
3.5 Measurements In order to retrieve data on how the process is performing Panalpina’s internal Process Measurement Tool, PMT, was used. The PMT was designed to measure how much time that is spent on certain activities, in total and in mean time, in order to compare the results globally and find improvement areas. The tool requires one person observing the operators in work, and clicking which activity the operator is performing. Comments can be added to each activity, for example on why a certain activity in taking a long time. The tool records the times each activity is operated, and by analysing the data one can see if one process step has high deviation or high total time. The tool was initially seen as a good for analysing the variation in the process. In total, over 42 hours of measurements was performed by the researchers with the PMT.
3.6 Interviews During the course of the project, a number of interviews were performed with the operators, as well as other employees at Panalpina. The interviews were performed when the researchers felt that they needed detailed information on certain tasks, and were often qualitative and unstructured due to the fact that the researchers did not want to miss any information that could possibly be excluded if the questions were structured. Interviews were used to a large extent to discuss improvement suggestions in order to get the inputs from operators on how feasible the suggestions were, and to develop the suggestions further together with the operators.

13
4 Define
Customer focus should be the main requirement for any Six Sigma project, and an emphasis should always be put on the critical to quality characteristics (Chakrabarty et. al., 2007). Magnusson et al., (2003) describe the importance of identifying the output (y´s) of the process, its capabilities, and to define how these y´s can be improved. These critical to quality characteristics are the customer’s requirement on the process, so understanding them is very much about understanding the process. The goal of the Define phase is not only to identify the process that is to be investigated and the customers’ requirements on the output of the process, but also how the current problems are affecting the customers and other stakeholders (Antony, 2006).
The first steps that were taken in order to get to know the process was to study internal SOPs, as they describe the theoretical process in the way it has been defined by Panalpina on a global scale. This created a first structure of what the process looked like, and prepared the researchers for the next step, which was following the operators at the Ocean Import Department and Export for a couple of days in order to learn the process in detail.
No measurements were done, but rather general notes were taken about how the process is designed, and how the different steps are executed. This goes back to one of the principles described in The Toyota Way (Liker, 2004) about how understanding is created. In Japanese it is called “Genchi Genbutsu” or “visit Gemba”, which can be translated to “going to the place to see the actual situation for understanding”, Gemba being “the actual place”. This means that facts about the process can be observed and are found in the real process, and should be known by anyone that is involved in it.
By following the operators’ day-to-day work, the researchers gained a thorough understanding in the process, which was considered necessary in order to be able to perform the consecutive steps properly. Having knowledge in the process, as well as using the same language as the operators, facilitates the communication with the operators and helps the researchers gain more acceptance in the improvement work.
The Define phase was also used to specify the project regarding resources, planning, goals, scope and expected outcome. This was done to ensure that everyone involved had the same expectations of the project, and that it met the requirements from Chalmers (planning report for Master´s Thesis) as well as Panalpina (Project Order chart).
4.1 Identification of process and customer requirements Panalpina is doing regular customer surveys to track which customer requirements that are seen as most important. Speed, quality, cost, documentation and attitude are five of the highest scoring KPI´s, and all of them, except for cost, are very connected to the information flow handled by the operators at the Ocean Import department (see Figure 4.1). Good response times to questions sent by e-mail, good look ahead for the planned delivery, and being updated with required documents and information are examples of activities that enhance customers’ perception of the service. A failure to fulfill any of these KPI`s can be seen as a defect in the process, which in this case has the potential to cause a dissatisfied customer (Antony, 2004a). Worth to notice is also that lack of information, or faulty information, is seen as the third most important scenario that would cause a customer to change forwarder (see Appendix A). This could be the case if Panalpina (or the operator,

14
being the contact towards the customer) fails to provide accurate information regarding the status of a delivery when needed by the customer. This indicates how important the aspect of communication is to the customers.
SIPOC 4.1.1
The purpose of a SIPOC (see figure 4.2) is to identify the suppliers, the requirements put on them, the customer, and the customer’s requirement on the output of the process. The customer in this project is the operator which is performing the day to day operations that are to be improved. By increasing the quality of the processes and the identified input requirements as seen in the SIPOC, it is thought that the output of the project will be a smoother and faster process which will allow the produced unit (the file) to be handled faster. An investigation of how to measure this process and how to achieve measurable improvements of the process is therefore connected to the other goals of this project.
The process in focus for this project is defined to start when the operator is receiving a request to ship (upper left corner in figure 4.3) and defined as over when the goods have been delivered, invoices have been paid and the associated file in the business system at Panalpina can be closed (upper right corner in figure 4.3).
The inputs to the process can be seen as related to information or retrieving information, showing the importance of having information accessible when needed and personnel being updated on how to use data systems. The output indicates the importance of correct information handling as well.
Speed
Cost
Attitude
Documentation
Flexibility of service
Health & Safety
Environment
Quality
Figure 4.1 Rating of importance by the customers

15
Figur 4.2 SIPOC
Value Stream Map (VSM) 4.1.2
The aim of the process VSM is to visualize the process and to identify major process steps, as well as the flow of information. This first VSM will also serve as a benchmark for those more detailed VSMs that will be created later on in the project.
4.1.2.1 Components of the VSM The VSM consists of three major components. The first is the flow of information (lightning arrows in figure 4.3) that connects all involved actors, often by usage of internet, e-mail or phone. It is initiated already when the shipper contacts Customer Service with a request to ship, and is lasting until the consignee has paid its invoices and the file has been closed.
The second component is the physical file that is connected to each shipment. It is created at the Ocean Import Department in the “File creation” process and is then expanded along the horizontal axis in figure 4.3 with more information and documents as the process is progressing until it is closed and archived at “File closing”. This file will then contain copies of all required documents such as invoices, B/L, customs declaration etc.
The third component is the shipment itself. It is visualized at the bottom of figure 4.3, representing the shipments way from sender to final receiver. As the shipment itself is not in the main scope of this project, the level of detail has been kept at an overall level.
4.1.2.2 Description of the process The VSM below shows the process in an overall view, where the details have been kept out in order to increase the overview. It starts with a shipment initiation, which has different channels to reach the operators, but it is usually the shipper from the shipping country that contacts the operators. The operators in their turn contact the receivers of the shipment (consignees) to verify that they are prepared to receive goods from the shipper. The operator then gives green light to the Panalpina office at the shipping country (the origin) and asks them to proceed with the handling of the shipment. The origin sends documents to the operators, which are then used in order to create a file. A file is created for each shipment, and can be described as a set of documents that are needed during different points of the shipment. The file exists in two versions; a physical and a digital one.

16
The goods are then shipped, and when the shipment is a few days away from the port, the operator starts to gather details regarding further shipment out to consignee. When the goods arrive, the operator performs customs clearance, book delivery by truck to consignee and updates the shipment status in a track & trace-tool. For these steps, the procedure looks different for an LCL-shipment and an FCL-shipment. FCL stands for Full Container Load and marks containers that are loaded with one customer’s goods only, and can be shipped out to the customer directly after arriving at the port. LCL stands for Less than Container Load and marks containers where goods from several different customers are loaded. These containers must be taken to Panalpina’s terminal in order to get “stripped”, which means that they are opened and the goods are divided according to who their receiver is. When this step is performed, the shipment from terminal to customer can be booked. Since this is not done for the FCL-shipments, the FCL-shipments are generally less complicated for the operators to handle and require less work. A more detailed process description can be found in Appendix G.
When the shipment is booked, the operator creates an invoice which is sent to the customer. When the invoice is paid and the expenses and incomes for the shipment are as expected, the file is closed automatically.
Through the work with setting up the VSM, a few causes to the variation in the process could be detected. The first is whether is there is an established standard operating procedure (SOP) and available information on how to handle the shipment for this customer. For some customers more information needs to be retrieved, which increases the interaction with the
Figure 4.3 Values stream map (VSM)

17
shipper and the customer. For other cases the need for information is low, which highly reduces the “Customer Service” loop that can be seen in the upper left corner in figure 4.3.
The second major cause to variation is whether the shipment is an FCL or an LCL. As described earlier, an FCL can be delivered directly from port to customer while an LCL is requiring more coordination and paperwork before delivery. This is a part of the process that was investigated at later stages in the project since in holds a potential to split harder and easier shipments into different flows, something that could speed up the throughput of shipments.
Today the work is divided so that one operator is responsible for those parts of the process that are highlighted in blue circles in Figure 4.3. This is because great coordination effects can be achieved when one operator has the overview of all the vessels that are arriving and can gather information for all those consolidation shipments (LCL) that would otherwise be spread across the department. The other operators handle the shipments from the initial contact to the file closing, where they have certain customers assigned to them. It will also have the effect that the other operators can focus on the tasks that are connected to the shipment process, while the operator responsible for the tasks in the blue circles in Figure 4.3 is handling tasks of administrative nature.
4.1.2.3 Work tasks As seen in figure 4.4, an operator’s work is divided between a forwarding role, which consists of activities directly involved in the shipping of goods, and an administrative role, which includes invoicing, approving incoming invoices, and creating and closing of files. Through observations and interviews, it was noted that the tasks that have a high level of inventory, that is, tasks that have “piles” waiting to be handled, are mostly tasks belonging to the administrative role. This is since the administrative tasks are usually not involved in direct customer contact; the customers will not be affected if these tasks are postponed, and tasks that affect the customer service are therefore prioritized.
Figur 4.4 Illustration of the two roles of each operator
4.2 Initial identification of problem areas When identification of the process and customer requirements had been performed, the next step was to identify areas with problems and to create a common understanding for them. This was done by the usage of the Affinity-Interrelationship Method (AIM) and the Fishbone diagram. The AIM was used mainly to describe the problem areas in a common language for the operators, their manager, and the researchers, while the Fishbone diagram was used to find problems at a more detailed level.
Forwarding role: Contact with
customers Book
shipments/transportations
Customs clearence
Administrative role: Invoicing & job costing Closing non-closed
files Approving
subcontractor's invoices
Creating files
Operator Ocean Import

18
Affinity-Interrelationship Method (AIM) 4.2.1
The AIM workshop was executed with two operators, one researcher and the head of the Ocean Import Department. The main question was phrased to “What are the biggest obstacles for efficient work at the Ocean Import Department?”. This was thought to be wide enough not to exclude any important part of the problem, yet narrow enough not to catch external problems that are outside the scope of this project. Many interesting problems were visualized during the workshop, among other the problem that many employees are afraid of taking decisions on their own, believed to be a result of cultural differences across the globe. This is mainly true for over-seas offices, but is causing large amounts of e-mails with requests to confirm different actions, and was found to affect three out of four main groups of problems identified in the workshop. An interesting discussion arose regarding the internal communication at the office, both specific and general problems were highlighted and provided a good foundation for further investigation and discussion on this issue.
Figure 4.5 Simplified AIM chart
The main sentence coming out from the workshop was “The system is not designed for the current distribution of work, and lack of communication between departments is causing for example the invoicing process to be delayed, which is causing inefficient work at the Ocean Import Department”. A simplified version of the AIM chart can be seen in figure 4.5 and the complete AIM chart can be seen in Appendix B.
Internal communication is bad; things are lost along the
way (4p)
Invoicing process is too
complicated (7p)
Too vague formulations in
e-mail conversations
(3p)
The system is not designed for the current workload (8p)
Many people are afraid of taking a decision (origin)
Figure 4.6 Main part of the process

19
The discussion about how the system is designed was something that came up during the workshop and concerned how the division of work should be done. This is something that has been discussed in the department for a long time, and the main topic has been whether one operator should handle the whole process, or if each operator should handle a specific part of the process. This is illustrated in Figure 4.6 where suitable potential points for handover from one person to another are marked with a red line. They are possible in a number of different combination, all of them with their pros and cons, and will be discussed more in detail later on throughout this report.
The sentence from the AIM workshop, as well as the four main groups of problem areas, were all found to represent the problem by the participants in the workshop at the time it was created. What was more impressive was the accuracy that the phrases turned out to have during the whole project. Almost every time that a tool was used, or an analysis of a measurement was finished, the conclusion could be found to correspond to a part of the AIM.
4.3 Fishbone Diagram The Fishbone diagram was created in a workshop together with employees from the Ocean Import Department, the problem being scoped as “High workload at the Ocean Import Department”. The purpose was to highlight problems in the process and to define them from the operators’ point of view; several of the things that came up are not included in the process as seen in the VSM but are still very important to take into consideration. These things are various side activities that are distracting the employees from their work with shipping related activities. This can be anything from mal-functioning IT-systems, to customers calling or e-mailing with requests for information, to sorting of papers and folders. The most important outcome from this workshop was the visualization of the large amounts of small things that occur quite frequently, although they not are taking many minutes or even seconds to fix, they are considerable time-thieves altogether. In general they are of a non-value adding nature and hence to be considered as waste that should be removed or reduced, but they are also important to analyze since they are disturbing the flow of the main process. Overall, the job costing and invoicing tasks received most attention in the Fishbone diagram.
4.4 A defined summary In the Define phase, the researchers got to know the process, and were able to identify the areas with biggest improvement potential. The area that got the biggest attention was the extensive mailing/phoning which takes a lot of time and distracts the operators while they are performing other tasks. A fast response to e-mail is often crucial for the process, but puts high stress on the operators. Although there is a high frequency of communication with customers and subcontractors, the internal communication is seen as not that good, handovers are not properly done and information is lost on the way. Through the AIM method it was also possible to describe the process and these problems in a new and more precise way then what has been done before. It was also shown that there are many administrative tasks that the operators need to perform. These tasks are sometimes possible to set aside for a few days until more time is available, but this is causing piles of work waiting to be done which is very stressful.

20
SOPs (Standard Operating Procedure) and various data on historical performance for different sub processes could be retrieved in this phase. This eased the learning of how the process is working and also provided a good foundation for later measurements and analyzes. Although there were uncertainties regarding which parameters that could be used to benchmark the process, the availability of data was seen as a good start.
For Panalpina there are several benefits of this project, one is of course to achieve a better working environment for the operators. On an economic level there are several incitements for this project, the first is the quick wins and short to medium term improvements thought to be the output of this project. In a longer time perspective there is a great interest for Lean and Six Sigma at the company. For this purpose, the project is thought to investigate and suggest ways to start Lean/Six Sigma initiatives. The identified customer of this project is the operator that is performing the day to day operations at Ocean Import Department.

21
5 Measure
The purpose of the Measure phase is to identify the inputs of the process (described as x´s) which can be classified as either control factors (parameters that can be affected) or noise factors (uncontrollable, too costly to control, or not desirable to control), and to visualize how they are affecting the outcome of the process (y´s) (Magnusson et al., 2003).
The Measure phase in this project consisted of two main tracks, the first containing various Lean and Six Sigma tools that can quantify the output from the tools used during the Define phase (as seen in figure 5.1), and the second consisting of time measurements and observations done while the operators are working. The aim of the tools in the Measure phase is to give a higher level of detail, better insight, and more quantifiable descriptions compared to the basic process descriptions created during the Define phase. The Process Measurement Tool (PMT) that was used for the time measurements was introduced to the researchers by Panalpina in the beginning of this phase. They were educated on the tool and a few test measurements were performed to ensure that there was consistency between the researchers in how to measure and use the tool.
One of the ways to measure and compare performance within Panalpina on a global level is to count the number of files (shipments) handled by a department, and to then divide this by the number of employees at the department. This gives the “Files per full Time Employee” (Files/FTE) performance measure. The drawback is that this takes no consideration to local settings of the size of the handled shipments.
The phase was started with investigating all possible inputs to the process with a Process Map, and then grading their importance to the process in the Cause and Effect Matrix. This way it was possible to conclude which inputs are worth investigating further. The rest are considered to be noise of the process, either because of their low impact on the process, or because their cause is beyond the range of what can be changed in this project due to for example global restrictions. This evaluation of the process is of course very important to do as accurate as possible since it is setting the direction for the whole project, and mistakes here might lead to a faulty focus of the project due to missed opportunities for improvements. This is why these tools are done stepwise together with the operators throughout the Measure phase until the phase is finalized with the FMEA, which is the most precise and detailed analysis of the input factors.
Figure 5.1: Flow chart for tools used in Define and Measure phase to identify and classify potential problems
Process map (chapter 5.1.1)
Cause and effect matrix (chapter
5.1.2)
Failure mode and effect analysis (Chapter 5.1.3)
Fishbone diagram
(Chapter 4.3)

22
5.1 Identification and classification of process parameters
Process Map 5.1.1
The process map was created from the process steps of the Value Stream Map with the purpose to identify all relevant inputs to, and outputs from, each process step. The goal is to identify all variables that can affect the process and eventually the outcome of the process. Hence it is important to take major as well as minor inputs into account, as those left out in this step will be excluded from the following analysis tools as well. An input to the process is any type of information, knowledge or document that is required for the process to work. Also, the operators’ knowledge and experiences are very important to the process, which is why they were quantified in a similar way. One of the most important outcomes from the process map, apart from all the inputs to the system, is an insight in how much information and other prerequisites that are required for each process step. Some shipments are handled on a routine basis, while some require a lot of attention and special care due to various reasons.
Cause and Effect Matrix (C&E matrix) 5.1.2
In the Cause and Effect Matrix the inputs from the Process Map are rated against characteristics of the process. The aim is to narrow down the number of inputs (x´s) that affect the process, rather than to prioritize them according to highest importance (Wedgewood, 2006). They will then be further evaluated and analyzed in the potential Failure Mode and Effect Analysis – p-FMEA. These characteristics can be seen as the customer requirements on the output of the process and are weighted according their importance to the customer. To align the C&E matrix with the goal of the process, the characteristics of the process were set to be the seven wastes known from Lean methodology, complemented by five parameters derived from customer surveys and internal benchmarking projects done by Panalpina, described in chapter 4.1 “Identification of process and customer requirements”.
After setting scores for each interaction (see appendix C) the inputs were sorted according to their score and the project team had to set a limit for which of them were suitable for further analysis. Apart from a high or moderate score, a possibility for the project team to affect the input was seen as necessary, some things are simply out of the scope for what is possible to affect. This might be due to cultural differences between different offices in different parts of the world, or a major storm that is delaying a vessel with goods.
The outputs from the Cause and Effect Matrix are mainly focused on the later section of the process, covering the approving of incoming invoices, job costing, invoicing and file closing tasks. These tasks are seen as demanding for the operators for various reasons; lack of gathered information and a high chance that the task will have to be re-done being the most obvious ones.
By analyzing which characteristics that received the highest scores, it is seen that “Quality of Service” is something that is tightly connected to the whole process and given high importance. Also “Over processing” and “Waiting” scored high, which is pointing out the long lead times and the lack of knowledge regarding what is required in the next process step. This is also including the lack of definitions of what each person/department/company is requiring from a specific task.

23
Apart from the waiting that is a result of the goods being in transit, there are several process steps where the file spends a long time waiting:
File closing: The file waits for all invoices to arrive and the operator to have time to close it. There is also a risk that the file will have to wait for a re-closing if the first closing was done without the correct information.
File registration: After the information about a shipment has been available in e-file, it takes quite some time before the file is created.
Customs payment: When the customer has to pay customs fee in advance (e.g. customers that rarely send goods), without being aware of the process of doing so.
Arrival of B/L: For some shipments the Bill of Lading must be physically in the domain of the Ocean Import Department before the shipment can be forwarded. If the customer is not aware of this there is a risk for a stalled shipment.
Potential-Failure Mode and Effect Analysis (p-FMEA) 5.1.3
A potential Failure Mode and Effect Analysis is done to create awareness for, and prioritization of, different risks in the process. This is done by assigning scores to the risks of failure, the effects of failure and the chance of detection before failure occurs in different sub processes. For this project two p-FMEAs were created, one covering the inputs from the Fishbone diagram, and one covering the results from the Cause and Effect Matrix.
The p-FMEA separated noise of the process from factors that are causing problems, giving the direction and focus areas for the project. The key findings are summarized in table 5.1 and table 5.2 which show high scores for the administrative tasks at the end of the process
in the same way as in the C&E matrix, but also problems with communication and re-entering of information. Some of them are of minor nature but of high frequency and could be solved quite easily, while others, like the problem with external invoices, would require
changes in working methods for a large portion of the suppliers.
Table 5.1 p-FMEA based on C&E matrix
Potential Failure mode Potential Failure Effect
Potential Failure Cause RPN
File not closed/closed with wrong amount
Re-work Expense was forgotten or had to be estimated
196
Invoices received after file closing
Re-opened files Suppliers are slow on sending invoices
144
Received invoices do not match estimations in
jobcosting
File cannot be closed Faulty estimations in job costing
144
Customer offer is not updated Customer is billed wrong amount, and credit note has to be
created
Seller /Operator has not updated Customer Offer
140
Not updated information listed in SOP
Work is delayed and/or performed
incorrectly
Customer does not notify changes
120

24
The failure modes originating from the Fishbone diagram are derived from what the operators experience as being problems today, and the failure modes from the C&E matrix are derived from general inputs to the process. This could be a reason as to why the failure modes from the Fishbone generally scored higher in the p-FMEA.
Potential Failure mode Potential Failure Effect
Potential Failure Cause RPN
Step two declaration is not done within 11 days
Fines from customs authority
Stressed operator has not noticed deadline
300
Operator misses an important e-mail
Delay in delivery Group mail distributes mail to everyone
270
Shipment missed feeder Delay to customer Bad weather, peak in workload at port, etc
224
Misses in communication Double work/re-work/frustration
Misses in communication since agents do not have
access to FOS
216
Operator has to do repetitive task all over again
Re-work Information in many places 210
Table 5.2 p-FMEA based on Fishbone-diagram
One group of potential failures derived from the Fishbone diagram was hard to evaluate in the p-FMEA, since it stated an inherent problem with the current process, rather than a potential failure. This resulted in extremely high scores in Occurrence but low in Detection Rate (normally “1”). Those process failures that received a high score in Severity were therefore selected for further investigation although their total score were not among the highest in their respective p-FMEA, presented in table 5.3.
The top scoring failure modes can be seen as the most important problems in the process to be dealt with, and are therefore very important to investigate further in the Analyze phase. The goal there is to investigate them one by one from the top and to take actions against those where it is possible to do so, this will then give that the problems are dealt with in order of importance, the most important first and then lesser and lesser critical issues.
Potential Failure mode Potential Failure Effect
Potential Failure Cause Severity* Occurrence
Peak in workload at end of month
Stressed operator Monthly invoicing 100
Different systems are not connected to each other
Operator has to re-enter information
System design 100
Stressed operator during some part of the day
Huge amount of e-mail in the morning
Colleagues in different time-zones
90
Deconsolidation list has to be done manually
Extra work Deconsolidation list cannot be created
automatically
81
Estimations for job costing will not be good enough
Re-work One operator receives more the 800
invoices/month
70
Table 5.3 FMEA for failure modes that occur very frequently as a result of bad process design

25
5.2 Detailed measurements of the process Detailed measurements of the current process give data that visualize the current system and shows how long time each step normally takes. By gathering solid data it is also possible to show how often there is a deviation in a process, and to what extent a process is stable or not. A stable process is continuously delivering cycle times with only small amounts of variation for each process step; this is something that can be shown with help of various statistical tools being applied to the results from the process measurement tool (PMT) used by Panalpina.
Using the PMT is a quantitative, as well as qualitative, way to describe the process, and is also a great complement to the more qualitative description created by the tools in the Measure phase. Although the other tools are based on some numerical evaluation, the input is often based on the judgment of someone who knows the process rather than solid data. This is since it is often hard to give a number on how many times a day someone has to open Outlook or how often they is distracted by a colleague that needs help. The problem in service processes such as the one at the Ocean Import Department is however that the process flow is not as clearly defined as those in manufacturing industries (Antony et al., 2007). Hensley and Dobie (2005) conclude four potential difficulties when using Six Sigma in service settings, two of them describing the problem to identify sub processes and to gather data, and that data collection often has to be done manually in face to face interactive situations instead of automatically.
Klassen et al.(1998, page 13) state that ”while productivity and efficiency are common terms, there seems to be little agreement on what they should measure”, and continue with how the intangible nature of services makes them hard to quantify. Further there are some differences when analyzing a service process compared to typical manufacturing industries. One is that they are intangible, making them hard to quantify for measurements and capability determinations. Another described problem is the heterogeneity of services; each delivery is different from the next since each customer is different, which makes it difficult to count services as equivalent units. But one can argue that the reversed is seen in many fast food chains, where standardized components can satisfy a variety of needs from different customers. Curtis and Coffey (1990) pinpoint another problem; knowing whether the service is performing at its maximum capacity or not. This is happening when the organization is lacking control over customer arrival and therefore it cannot schedule staff to meet customer demand. The solution to this problem is in the Lean methodology described as Heijunka, or Workload leveling (Liker 2004). Transferred to this project it describes the problem of knowing how good each sub process is performing, and how different tasks are prioritized against each other since some tasks have to be solved ad-hoc, while other are possible to set aside for some time.
As well as being used for identification of problem areas, the gathered data can later on be used for evaluation of different improvements proposals, as additional help to the theoretical support for process changes that can be found in Lean methodology et cetera.
A third benefit of the measurements is the fact that a lot of time is being spent observing the process. This is of course a great possibility to get to know the process, and to find improvement opportunities in the everyday work. Much insight and also a few improvement proposals could be retrieved from these observations, since sometimes a pair of fresh eyes are needed in order to be able to question process steps or ways of working.

26
The measurements are performed by one researcher recording one operator at a time with the Process Measurement Tool. In order not to affect the measurements, it was important that the researchers knew the process from before, minimizing the need to interact with the operators. Before the measurements were started there was a presentation of the purpose of the measurements and the tools. There was also a discussion regarding privacy issues connected to observations and measuring done on operators while working. Emphasis was put on explaining that the identities of the measured operators are not noted anywhere in the tool, and that all information that can be used to track the performance of a single operator (name of customer, file number etc.) easily can be removed. No unprocessed (traceable) data will be shown for anyone except the researcher, their supervisor, and those that are analyzing data on an international level for Panalpina.
Measurement System Analysis (MSA) 5.2.1
While measuring a process it is important to keep the validity of the measurements in mind. Any process is varying over time due to various causes, but when measuring a process there will also be variation due to the way the system is measured. This insight is important in order to avoid that the analysis about the system is done on something that is a result of a biased measurement system, not a result of what actually happened in the process (Wedgwood, 2006).
Wedgwood (2006) has divided this test of the measurement system into three different phases. The first is the integrity of the data. The researcher must be able to confirm that the data is available and useable, that the data is suitable for the project, and that the data is trustworthy. The integrity is proven in two steps; the first is to ensure the validity of the measurements by showing that the “right” aspect of the process is being measured. Otherwise there is a risk that the measurements will measure something that is not relevant for the project. A question to ask is weather the data contains intended information and if it can discriminate between different items that will be analyzed later on. Finally the reliability of the measurement system has to be ensured. Here the measurement system has to prove that the data produced can be precise, consistent and accurate over time. This is reducing the risk that the measurement system itself will affect the outcome of the measurements.
Laureani & Douglas (2010) have done a case study of a call center in a service industry setting connected to a Lean Six Sigma project, where they have observed how difficult it is to set up an appropriate MSA in service settings. Their problem was that the measurements were biased by the researcher’s possibility to distinguish between different types of incoming calls. Different types of calls were received by the same operator but the researcher had a hard time to distinguish between them, thus giving low reproducibility.
The Process Measurement Tool (PMT) 5.2.2
The Process Measurement Tool has been developed centrally by Panalpina to allow global benchmarking of performance between offices. The tool has been developed for two main reasons; the first is to allow benchmarking between different offices on a global scale with the goal to identify process improvements opportunities. The second objective is to measure how efficient the current business system FOS is, to serve as a benchmark for the upcoming change to SAP in a few years.
The tool is designed to measure all the process steps done by the operators during a normal shipment, from the first request to send a shipment, all the way to invoicing and archiving of

27
documents. The measurements are also including side activities such as sorting of papers and answering e-mails, which are all part of the work although they are not always specified to a certain shipment. The layout of the tools can be seen in Appendix D.
The usage of the tool was central to the project, since it allows international benchmarking against other Panalpina offices to identify areas for improvement. It was also found to be very useful since the purpose of the master’s thesis was very similar to the purpose of the benchmarking project coordinated by Panalpina globally.
The Measurements 5.2.3
The goal of the measurements was to have enough observations of each process step to allow statistical analysis and benchmarking, and to catch the deviations that exist in the process. Part of the goal was also to be able to track different activities connected to a single file, for the calculations of value adding/non-value adding time and to measure the overall lead-time. Therefore it would have been desirable to catch the same shipment in as many of the different process steps as possible, from initial creation to final closing. This was however found to be problematic since each shipment takes more than a month to complete; with many small steps taken with some time in between, making it unlikely that the operator is being measured while doing all these steps for one specific shipment. A counteraction to this problem was to focus on a few operators, increasing the chance that the same shipment would be measured at several different process steps.
Initial data analysis 5.2.4
Although the process is defined and supposed to be quite equal for most of the shipments, there still exists a great variation in the process; it can be customer specific requests, deviations related to different handling procedures in the shipping country, or any unexpected problem arising along the way. This is the nature of all service business, however it is causing problems when the process is about to be measured (Antony et al., 2007, Nakhai et al., 2009). Despite that, some direct observations could be seen in the measurements:
22 % of all time is spent updating activities that cannot be connected to a specific process step, it could be answering e-mails and phone calls from customers, searching for information or forwarding updates/information to customers. The main part of this, 18 % out of the total time measured, was spent only in the mailbox. This includes every time that the operator is writing, sorting or handling an e-mail, but does not include the time that is spent in the mail browsing for specific information since that normally is included in a main process step.
Another 6 % is spent on printing, scanning, forwarding and handling physical papers. Once again, this is only the time that is not included in a main process step, which means that the true value is higher, although the detail level of the PMT makes it difficult to state exactly how much higher.
On average it takes 50 % longer time to create an invoice in Gothenburg compared to the weighted global average (3:30 min compared to 5:18, seen in figure 5.2), which is correlating to the perceived problems with the invoicing process as described in the AIM chart. The samples are following a Poisson’s distribution with only a minor number of outliers, the problem is rather that the process in general takes too long time which is to be investigated further later on in the project.

28
Figure 5.2 Time to create an invoice
An example of an unstable process is the process to book a delivery from port to final receiver, as seen in figure 5.3, where the spread is much larger. Although the sample is limited to 15 measurements the spread is from 1:33 minutes up to 9:30 minutes, with an outlier on 22:40 minutes. The analysis of the associated comments showed an explanation in mal-functioning data system for some of the measurements. The rest of the deviations could only be traced to different needs and access to data (delivery address etc.), but nothing that could explain why the larger values are five times bigger than the smaller values.
Figure 5.3 Book delivery from port
The measurements done with the PMT had the limitation that they not could prove any reliable data on lead time, or time between different process steps. Some files could be followed throughout a few consecutive steps but they were too few to be useful. Instead, old files were reviewed to gather data for time between processes and total lead time. This was possible since many documents stored in the physical file have a time or date notation, indicating when they were processed. The drawback is that most of the timestamps only state date for the action, not during what part of day it was done. This is not anything dramatic for the overall process, but since the time from arrival to port until delivery is so short it makes the analysis of this part less useful.
Among the findings from reviewing old files, several observations could be made:
33% of all pre-advices with estimated arrival date that is sent to the customer will have to be re-adviced due to changed arrival data. This means that there is a 50 % chance for rework of the initial advice.
The average time from when the shipment leaves the port until it is delivered to its customer is 35 days.
0:15:300:12:300:09:300:06:300:03:300:00:30
14
12
10
8
6
4
2
0
C1
Fre
qu
en
cy
Histogram of C1
0:20:000:16:000:12:000:08:000:04:00
7
6
5
4
3
2
1
0
C1
Fre
qu
en
cy
Histogram of C1

29
After the shipment has left the port, it takes on average ten days until the file is created, while the necessary information to create the file is normally available in e-file after three to five days.
Once the goods arrive to the final port, the shipment is handled very fast and is normally booked for delivery within two days (including stripping of LCL containers).
5.3 A measured summary The Measure phase gathered detailed information about the process, both regarding what information is required to keep the process running, but also raw data about how long time different process steps are taking. In the same way it became possible to exclude some noises of the process using process mapping and p-FMEA, putting focus on things that are having larger impact on the process or greater room for improvement. Examples of this is the administrative tasks that have a tendency to be put aside, the frequent re-entering of data into different systems, and the communication problems that had surfaced, both internal, as well as external via e-mail. It was also possible to surface some of the waste that exists in the process, both from the usage of Lean thinking and different tools, and from observations made during the measurements. Apart from the mentioned wastes, some things that later on became concrete improvement proposals were identified during the Measure phase. Examples are the fact that a calculator was used as a complement to Excel, and how extensive the e-mail via the group mail is. The time spent doing the measurements also became very useful during the Analyze phase whenever the questions “Is this really done this way?” or “Is this really valid?” came up.

30

31
6 Analyze
In the Measure phase, the factors influencing the process were further analyzed in order to increase the detail level of the problems. An extensive amount of information was gathered by the researchers, both qualitative and quantitative. With the help of FMEA, the most crucial factors were chosen, and the researchers could further look for root causes of problems at the department. The PMT was also heavily used in the Measure phase, and large amounts of data could be retrieved, which were analyzed in the Analyze phase.
In the Analyze phase, the factors and problem areas found from the Lean/Six Sigma tools and the PMT were merged, and concrete problem formulations started to take place. Also, it was investigated what effects a reorganization at the department would have. This was not an outcome from the various tools used in the Measure-phase, rather it was mentioned in the AIM-chart, and it was a wish from the company to perform such an investigation. Reorganization was by stakeholders at the company believed to have an impact on the problems inherent at the Ocean Import Department, therefore it was decided that this factor should be investigated as well.
6.1 The measurements The data from the PMT-measurements can be seen as both qualitative and quantitative, since the quantitative part comes from the time measurements, and the comments accompanying the time measurements can be seen as qualitative. About 42 hours of measurements were gathered, which exceeds Panalpina’s recommendation of 40 hours of measurements in order to be able to detect improvement areas. The analysis of the measurements were quite extensive, looking at both the mean time in each process step, the variation, how much time each process step took in total, comparison with the world average, and also analyzing the comments in order to be able to detect why certain steps took “too long” time at some points. During the analysis of the data, the researchers encountered a number of difficulties:
A number of process steps were, despite the extensive amount of measurement time, occurring seldom in the compilation of the data; some were only occurring 5-8 times. This makes it more difficult to draw any conclusions from the data.
Due to Panalpina’s regulations concerning the PMT, the data should not be traced back to a certain operators. This brings benefits in forms of protecting personal integrity, but has the downside of not making it possible to detect where tasks are not standardized, and it adds the operator as a noise parameter in the measurements.
Due to the tool being quite rough when it comes to dividing the process steps, some process steps contained various tasks, making them difficult to compare within the step.
The comments were often short, due to the fact that the researchers did not want to interfere in the operators’ work too much when measuring. The thin comments made it difficult to draw conclusions on why there was variation in a certain process step.
It is difficult to catch a whole shipment in each stage from start to stop, since one shipment usually lasts for more than one month, and is processed by the operators fragmentally during this period.

32
The PMT catches random problems depending on what is being measured during that time. Even if it is measuring something that could be improved, it is not certain that the researchers are following, and thereby they risk missing the improvement opportunity.
The comparison to the world average is to an extent irrelevant. Some process steps are surely done in a similar manner worldwide, but some steps are highly country dependent, for example customs formalities or delivery bookings.
These difficulties show the complexity in measuring an administrative process in this way; the process steps are not as defined as in for example a manufacturing process, and each shipment can be seen as unique regarding how it is handled, making it difficult to compare to other shipments. These observations can bring uncertainties regarding PMT being an appropriate measurement tool to be used for the current process, a subject that will be discussed later on in the report.
6.2 Insight in the process – visit “Gemba” Although the researchers encountered a number of difficulties in analyzing the measurements, the usage of the PMT gave positive effects. More insight in the process and how it works, as well as insight in some of the problems that can occur, were gained. The “visit Gemba” (see Chapter 4, Define) aspect of the measurements was obvious; measuring the process by being where it happens rather than to analyze reports from a database was seen as a great advantage as the researchers could identify problems by following the day-to-day work. The comments from the measurements, although not too extensive, gave some hints on improvement potential in the process.
The researchers identified great potential for continuous improvements at the department. By using the operators’ process knowledge together with the researchers knowledge in searching for root causes, positive affects can be achieved. The challenge is to create an organization that is searching for root causes, instead of curing the symptoms to problems.
”Kaizen” is the term for step-by-step improvements for a process that already has a developed and defined structure (Larsson, 2008). The nature of the administrative ocean import process is that it is depending on the logistics process; at what stage the shipment is located physically determines the work tasks that need to be done by the administrative process. Therefore, it can be seen as a structurally defined process, where an approach with continuous improvements is suitable.
6.3 Investigate the possibilities of a reorganization Some years prior to this research, the work at the Ocean Import Department was organized differently than it is today. During the project the researchers understood that there could be some benefits of reorganizing the tasks between the operators. During the AIM-workshop, one of the highest scoring problem areas was that the system is not designed for the work division that is in place today.
In order to explore this, it was decided that a simulation model should be set up by using the data that was gathered in the Measure phase. It would then be possible to test different divisions of the work in order to achieve the optimal flow for the file. As shortly described in Chapter 4.2.1, there are several ways to divide the work; some of them have been tried before, and some have been discussed for a long time. They all have their pros and cons, but

33
a common principle is that the discussion has focused on whether one person should to a specific activity for the whole department, or if everyone should do that step for their own shipments. An example is if one person should approve all the incoming invoices and then become experts in that area with good overview, or if everyone should approve their own incoming invoices, for which they have the more precise knowledge about since they know the history of their shipment. Another example that was recurring in the discussions was to divide the LCL and FCL flows, described in chapter 4.1.2.2, by letting different operators handle the shipments. This idea was brought up due to the fact that the FCL flow was less complicated than the LCL flow, and by dividing the flows, synergy effects could be achieved if the LCL shipments were not “blocking” the FCL shipments. It was decided that in order to compare different combinations of work task changes, a Design of Experiments (DoE) should be performed, where possible synergy effects could be detected.
Design of Experiments is used in order to gain understanding of how different factors affect and interact with each other, and what impact this is having on the output of the process. This is done by having a list of potential factors whose variation is thought to affect the system; by adjusting them according to a predefined pattern it will be possible to tweak the system towards higher output (Sheehy et al., 2006).
This possibility to set up the work flow so that either one person or the whole department is doing each task was used as a baseline for the DoE, which is based on “high” (here: task done by each operator) and “low” (here: task done by one operator) settings for each trial. For each trial three outputs were chosen to measure the different setups; how many files that run through the system for a given amount of time, the lead-time for a file, and to what extent queues were building up in the process. By choosing these outputs, the researchers could detect if there were any bottlenecks in the process. What was also investigated was the utilization of each operator, in order to retrieve an equal work division among the operators.
From the simulations, three alternatives had advantages over the others, where the one with the best results was the current state. The other two alternatives with good results were discussed with two operators in order to detect if they were feasible in reality. Even if the simulations showed good results, they could not be trusted solely; they had to be evaluated in other ways in order to see if they could be performed. One of the alternatives turned out to be non-feasible, since it would generate more work in terms of organizing tasks, and was therefore discarded. The other alternative was determined feasible, but was not showing any specific advantages over the current state.
During the discussions and analysis of the reorganizations, the researchers, as well as the operators, realized that any alternative of reorganizing the department would be just “shoveling” tasks around, with no direct synergy effects regarding productivity, and no real advantages gained. The nature of the tasks, where e.g. certain tasks have a clear advantage of being performed by one person, brings difficulties in changing the structure. Changing these tasks would just add extra work, such as the coordination of information. Therefore, the researchers will not suggest any reorganization of the department.
6.4 Areas of focus for improvements By analyzing the information retrieved from the various tools, observations, workshops and talks with the employees, a number of problem areas were identified and therefore found

34
suitable to begin implementing continuous improvements on. As mentioned before, the researchers found that the AIM-tool, see Appendix B, that was performed in the beginning of the project was highly accurate in terms of identifying the problem areas. Both the measurements as well as the p-FMEA showed improvement potential regarding the invoicing/jobcosting tasks, the extensive e-mailing and paper handling, and the communication between different departments. An analysis was performed in these three areas in order to find improvement potential.
Invoicing and job costing 6.4.1
A detailed VSM was performed for the invoicing/jobcosting task, and together with the results from the p-FMEA and observations it was suspected that lack of information could be an essential reason for the complicated task. Prices were not always easily available for operators, and non-updated customer offers could be a problem. When performing an invoice the operators also had the choice of using templates, but the use of templates was not as extensive as it could be, which was causing the invoicing task to take longer time. Another aspect of the invoicing was that it was performed with the help of a calculator. Although the customer offer itself was available in Excel, the different costs were calculated and summed up on the calculator.
Expenses Incomes
Expense 1 Income 1
Expense 2 Income 2
Expense 3 Income 3
Earning =Sum of Incomes – Sum of Expenses
Figure 6.1 Job costing performed at Ocean Import Department
The job costing is performed together with the invoicing, in order to see how much revenue each shipment will render for Panalpina. When the invoice is created, the incomes from the invoice are listed in a column, and in the column right next to it the expenses are listed. The earnings are calculated by subtracting the expenses from the incomes. If the earning is negative, this can be an indicator that something is wrong, e.g. that an income has been forgotten or that a customer is billed with a too small amount. The job costing is a prediction of what expenses and incomes the company will have; usually the expenses have not yet been billed by the subcontractors. The predicted expenses are gathered by the operators from several places in their internal systems.
The job costing is later on matched in the systems with the real incomes and expenses, i.e. when customers pay their invoices and subcontractors send their invoices. If the actual amounts are according to the prediction, the file is automatically closed and is not handled by the operator any more. If the amounts differ outside of a specific range, the file is not closed and the operators have to detect which expenses and/or incomes that not are correct, whether it is the predicted ones or the actual ones. This detective work in discovering why files are not closed is time-consuming for the operators, and causes extensive rework. Unfortunately, no data could be retrieved on how many files not automatically closed, or the reasons why. The amount of files not automatically closed was

35
by the operators estimated to 30 % of all files. 50 % of these are estimated to have external reasons for being incorrect (e.g. subcontractors sending invoices with wrong amounts) and the remaining 50 % were estimated to have internal reasons for being incorrect (e.g. operators writing the wrong numbers in the costing or internal systems not being updated with the correct expenses). Here it was discovered that there is a lack of information that causes rework later on in the process. The job costing was also specified in detail, and it shows that there is not always a straight forward path for finding expenses. The reasons for the job costings not being correct (and files not being closed) are many. Through interviews with operators and their managers the most common reasons were found to be:
1. Certain expenses forgotten by the operators
2. The expenses from one of Panalpina’s internal systems does not provide the correct charges, leading to incorrect estimations in the job costing
3. Sub-contractors send invoices with wrong amounts charged
4. Costs are put on the wrong file by the economic department in the Philippines
It was decided that the two first reasons were to be started an investigation around, since they appear to be the most frequent ones. The first reason is a human error reason, and a proper investigation here is how control systems could be established in order to make it difficult to forget expenses. The second reason was that expenses from Panalpina’s internal system were not correct, which turned out have several causes. One was that the system was not updated correctly, something that was done in China. The other one was that the operators had not received enough education when the system was launched, leading to the operators having their own solutions when it comes to using the system. A standardized way of retrieving expenses did not exist, and could be causing rework when it was leading to faulty job costings.
Communication barriers 6.4.2
As shown in the AIM as well as the FMEA, the communication between the departments at Panalpina had not been working optimally. This was an aspect that was difficult to catch in the measurements, since poor communication is not always obvious in the day-to-day activities. During interviews with the operators, the subject was investigated in order to map the problems. Communication barriers were detected in several areas:
Between the Ocean Import Department and the sales department. When a new customer is brought in by sales, the handover from sales to the ocean import is insufficient. This leads to operators not having details on how to handle certain customers.
Between the Ocean Import Department and the sales department. Updating customer offers was not standardized, leading to customer offers that needed to be updated were not being updated, and vice versa.
Between operators at the department. Frequent customers usually had internal SOPs on how their shipments should be handled, which made it easier when customers are transferred between different operators, or when an operator was absent from work and the department have to handle his or her shipments. Non-frequent customers usually did not have internal SOPs, which caused rework for the operators every time they handled a shipment for a non-frequent customer.

36
E-mailing and paper handling 6.4.3
Several tools indicated that the e-mailing for each operators was extensive, and a considerable time-thief. From the data it was detected that around 18 % of working time is spent e-mailing. This number, already considered high, is probably higher in reality due to the fact that the PMT is too rough to capture every time the e-mail is being used. During interviews with the operators it was obvious that the volume, as well as urgency, of e-mails was considered to be stressful. An important factor here is that each operator receives e-mails from two addresses; their personal one and the group e-mail. The e-mails to the group e-mail are usually only directed to one operator, but all the operators receive them and scan through them, to see if they need to take any action or if it was directed to a colleague. Hence, large volumes of the incoming e-mails are not directed to an operator, but still need to be read by them. The number of incoming e-mails to the group mail can be close to 100 per day, which means that each operator can receive around 50-80 e-mails per day which they have no interest in reading.
Due to the administrative nature of the work at the ocean import, many documents are handled and processed at the same time. Since the lead-time for an ocean shipment is relatively long, approximately a month, many documents are waiting and piling up during the shipments. The data from the PMT showed that 6 % of the working time is spent paper scanning and archiving. This is not including the time consumed by printing and getting papers at the printer, which is not revealed due to the roughness of the PMT. The printing activities are usually included in other tasks in the PMT, which makes them difficult to extract.
6.5 An analyzed summary In the Analyze phase, the factors in the process that were considered as important were further investigated, and root causes for problems were sought for. Through identifying factors that affect the process, problem formulations could be initiated.
The extensive amounts of data that had been gathered through the PMT were analyzed, and some problem areas could be identified. The PMT, and the international comparisons, were however considered to be too rough in order to provide an effective framework to drive improvements. Instead, the tools from the Six Sigma and Lean initiatives were of great help in finding improvement potential.
A factor that was found not to affect the process was a reorganization of the department. It was found that reorganization would not bring any certain benefits, since it would only shovel tasks around without any synergy effects.

37
7 Improve
When the Improve phase was entered, the researchers had realized that there lay great potential in working with continuous improvements at the department. The PMT was judged to be a too time-consuming and rough tool to be able to be used efficiently in a continuous improvement work. Instead, the operators themselves should be engaged in such a work.
Factors influencing the process were identified through various tools, and problem formulations were formed. In the Improve phase, areas of focus for improvements started to take form, and ways of measuring the influencing factors started to develop. By measuring these factors, a system could be developed were these factors that affect the output can be controlled, and they can give a direct measurement of how the process is doing.
In the Improve phase, two frameworks also started to develop regarding how the department should work with continuous improvements, enabling them to drive the improvement work further. The first framework is connected to smaller improvements, which could be pursued by the operators. The second framework is connected to a more strategic level where management commitment is of the essence.
Finding concrete areas where waste is present was a great leap in the project, and could be done due to a thorough work in the initial phases. Especially, getting to know the process and involving the operators was considered as a pre-requisite in finding relevant problem areas to target the focus on. In the Improve phase, specific countermeasures were found and are here presented according to the three categories described in the Analyze phase.
7.1 Introductory workshops Improvement opportunities identified in the Analyze phase were developed to concrete improvement suggestions, and to some extent implemented and evaluated in the Improve phase. A strategic decision was taken to implement the changes stepwise. This was done in order to be able to detect improvements related to a specific change, and to facilitate the changes for the employees.
It was communicated that the suggestions that were to be implemented had been evaluated thoroughly and were introduced in order to facilitate the work; any suggestion that the operators found was complicating their work could be modified or removed. The iterative work of Lean was emphasized, even if a solution looks good on paper it needs to be tested before it can be validated completely. Some suggestions have benefits that are easy to identify, while others might need some testing and time to sink in, before the benefits are realized.
As a complement to the suggestions that were to be implemented, it was seen as important to create an understanding and acceptance of Lean thinking. Therefore, the researchers decided to perform two workshops with the operators, “The Lean game” and “5S”.
The Lean game 7.1.1
The Lean-game is a tool that is used by Panalpina in order to increase the employees understanding in Lean and the benefits that can be derived from working in a Lean way. The Lean game starts with the participants working in an airplane factory, where airplanes are built by folding A4 sheets of paper. Each participant is assigned to a specific task, and receives firm instructions on how to fold the airplanes. A material handler shuffles the

38
planes between each workstation (each operator) in batches of three. Defective paper is sometimes given to the participants, but without instructions on how to handle it. A couple of minutes after the game start it is obvious that some of the workstations have become bottlenecks, and that the material handler is a busy workstation. The WIP and the lead-time become very high. It takes a long time to find the airplanes with the defective material in an inspection, since it is important that they do not reach the customer.
In the next round, the participants are given the opportunity to change and decide work roles themselves. A new system is developed, where a number of improvements have been made. The defective material is sorted out before the folding begins, in order to avoid the time-consuming inspections later on in the process. The role of the material handler is removed; instead the participants are arranged in a line where they can easily pass the material to each other. The last work station, which is the most complicated and time consuming one, is divided by two participants, where they take from a common pile which comes from the earlier work stations. The batch work is also removed for a more even and smooth flow of the process.
The improvements from the first round were obvious. By receiving instructions (defective paper is not good) and increasing the co-operations between the work stations by eliminating the barrier of the material handler, as well as letting the participants plan their work themselves, a number of improvements were identified:
More planes reached the customer
The WIP was heavily reduced
The time spent on searching for defective plans was eliminated
Besides the measurable changes that occurred, the participants experienced a higher motivation in planning and organizing the work themselves. It was obvious that they were working to the best of their ability to get the work done.
The Lean game is a simple and visual way of demonstrating the benefits of using Lean methods. The group experienced some form of aha-feeling, and some elements of the game could be directly tied to their everyday work. The researchers’ hopes was that this was the introduction to a Lean journey for the division, which in an easy and straight forward way explained what Lean is and why it should be used.
Implementing 5S 7.1.2
The next action that was decided on was to implement 5S at the Ocean Import Department. 5S is an important concept in Lean, and a prerequisite for work related to minimizing waste in processes. Since the work at the department is heavily focused on handling information and papers, the workshop in 5S was considered through an office environment perspective, organizing the desk workspace in order to minimize waste.
There are five key words in 5S, where sorting means throwing away everything that is unnecessary, and keeping only the things that are related to work. Straighten is related to putting everything in an assigned place, so that it can be found easily and facilitate the workflow. Shine refers to creating a clean workplace, and maintaining it that way for example by taking pictures of the clean workplace. Standardize means adopting best practice as standardized work procedures, and using visual management such as color-coding in order to identify irregularities in the environment. The last one is sustain, which is

39
described as the most difficult one to put into practice. It involves sustaining the other four Ss, and that personnel practices them by their own initiative by eliminating bad habits and replacing them with good ones (Bergman & Klefsjö, 2010).
Due to the administrative nature of the work at the Ocean Import Department, where many documents are processed daily, it was considered as a natural starting point to implement 5S. The implementation was performed in two steps, first with a workshop with the researchers where the theory was explained, and then by the group going through the desk of a volunteer, and all the operators getting the “homework” of performing 5S in their workplaces.
5S worked as a type of introduction to Lean thinking. Some of the Ss were found to be applicable at the department, while others were not. It was important to have in mind to perform the workshop with the current workplace in mind; talking about cleaning the workplace was irrelevant here. Another important aspect of the workshop is to remember that the workplace is to an extent a private sphere, where it is important that the operators understand the principles of 5S, and then perform the 5S as standardized as possible, but in their own way.
7.2 Identified areas of focus for improvements After performing these introductory workshops, improvement suggestions were either implemented for a test period, or discussed with the operators in order to develop as elaborated suggestions as possible. Unfortunately, due to the vacation period, some suggestions could not be tested, but the goal was to hand over suggestions to the company that could be implemented when the department was back to normal conditions.
Invoicing and job costing improvements 7.2.1
The improvements developed for the invoicing and job costing tasks are listed in table 7.1. For more extensive explanations of the proposals see Appendix E and F.
Process step Problem Improvement suggestions
Invoicing It is often postponed and tends to pile up quickly
- Visualization system with an incentive in order to stimulate the operators to perform invoicing directly
Invoicing Complicated invoicing process
- Higher usage of templates
- Updated customer offer
Job costing The job costing is incorrect and causes rework
- Keep a log-file over wrong job costings, in order to attack root causes
- Organize regular work shops where the operators’ knowledge in systems can be updated
Table 7.1 Problems and improvement suggestions for the invoicing and job costing

40
7.2.1.1 Invoicing improvements The invoicing process was generally considered as complicated by the operators, which was shown in various tools used in the Measure phase, as well as in the measurements with the PMT. The fact that the invoicing step often was postponed when it could be performed straight away had two main reasons:
Due to shortage of time, the operators prioritized tasks that were related to customer service rather than administration.
The invoicing process was considered as complicated, which further led to the operators postponing it.
The improvement suggestions connected to the invoicing aimed at both making the invoicing process less complicated, as well as creating an incentive for the operators to perform the invoicing directly. Åhlström (2004) describes how one way of reducing waste is to avoid switching between tasks too often in order not to loose concentration, and instead try to perform a task with larger blocks of time. By performing the invoicing straight away, the operators would hopefully not have to loose time by having to gain insight into a case again several weeks later, as well as having the psychological stress of invoices piling up. The incentive system would be a visual one, where the whole department receives a reward together when they reach certain goal of invoices performed straight away. The detailed description of the improvement suggestions can be viewed in Appendix F.
The other improvement suggestion connected to the invoicing was to promote a higher usage of templates when performing an invoice, since this would prevent re-entering information when performing an invoice.
The last, but not least, suggestion was an updated customer offer, where costs that would be charged to customers could directly be retrieved by clicking in a few boxes on what is to be charged. This was a significant improvement from before, when the operators noted the charges on a piece of paper and added them together with a calculator. This would facilitate the invoicing task and hopefully contribute to lowering the resistance of performing the invoice straight away.
7.2.1.2 Job costing improvements The job costing task battled several problems, which were causing extensive rework at the department. What was considered as important here was to find root causes of what is causing the incorrect job costing. The suggestion is that the department should implement a log-file where the operators note the reasons to why files are not automatically closed. By gathering concrete data on this problem, root causes can be mapped and attacked as they are identified.
Another aspect of the job costings was to introduce standardized ways of performing them. During the mapping of the process step it was obvious that that one internal system that was central in the job costings was used in different ways by the operators. A workshop was performed with the operators and a person highly knowledgeable in the system in order to perform standardized working ways. This would contribute to lowering the amount of incorrect job costings due to non-standardized ways of using internal systems. What is also important is to follow up on the results from the workshop on the internal system, and track

41
if there have been any improvements in the amount of incorrect job costings, which the log file gives great opportunities to do.
Communication barriers 7.2.2
Communication barriers were found to exist between several departments, summarized in table 7.2.
Table 7.2 Problem description and proposed solutions for various communication problems
7.2.2.1 Handover of new customers to the operators at the Ocean Import Department The hand-over of new customers between sales and the import department was found to be insufficient, leading to the operators having to spend time finding information on how the shipments for new clients should be handled. The counteraction proposed here is to establish a more formal handover, with the manager of the Ocean Import Department, and the responsible sales person and operator. A document already exists with the necessary information that the operators need from sales, but is unfortunately not used in this way. This document should be filled in at the formal handover, where any questions and special requests should be discussed as well. This way, the operators would get more insight in the customer specific requests, avoiding a time-consuming search for information later on in the process.
7.2.2.2 Handling shipments for non-frequent customers An area where the lack of information was obvious was the handling of shipments for non-frequent customers. The routine here was that there were no dedicated operator to these customers and no internal SOP due to the infrequency. Hence, whenever a shipment for a non-frequent customer was handled, information needed to be retrieved all over again. Often this meant calling the customers to ask how they wanted the shipment to be handled. In order to investigate this further, the measurement data that had been collected with the PMT was divided into two groups; one with frequent customers (with a dedicated operator), and one with non-frequent customers (with no dedicated operator). The data shows that the non-frequent customers equaled to about 12 % of the shipments, and were taking up about 12 % of the operators’ time. Hence, it seems that the non-frequent customers do not take
Process step Described in chapter
Problem Improvement suggestion
Various 7.1.4.1 The hand-over of new clients from sales to sea import operators is inadequate
- Establish new routines when it comes to handling new clients, with a formal hand-over between sales and operators
Various 7.1.4.2 No internal SOP for handling non-frequent customers
- Establish internal SOPs for non-frequent customers
Various 7.1.4.3 No standardization when it comes to which customer offer should be updated
- Establish routines when it comes to updating customer offers based on how many shipments the customers have had

42
up more time than the frequent ones. But, this area was still seen as an improvements area, since the time to handle non-frequent customers could be reduced if there was an internal SOP established, and perhaps an operator dedicated to them.
A recommendation to the company here was to establish internal SOPs even for non-frequent customers. There was rework connected to these customers since the operators seem to investigate how these customers should be handled each time they had a new shipment. Establishing SOPs on the customer specific data could be seen as a one time investment by avoiding the rework of searching for information the next time the non-frequent customers had a shipment.
7.2.2.3 Updating customer offers In the Analyze phase it was discovered that the updating on customer offers was not standardized; some offers that were used often were not updated regularly, while some that were used rarely were updated more often. In order to attack this problem, the researchers suggested that the sales department updating the customer offers should introduce new routines, where the customer offers are checked every third month on how many shipments the customer has had. This way, the ones that have become frequent can be paid more attention, and the ones that do not have many shipments do not have to be updated that often. The overproduction at the sales department would decrease, and the chances that the correct offers are updated when the operators need them will increase.
E-mailing and paper handling 7.2.3
Excessive access to information can be very stressful when there are constantly new e-mails arriving and a lot of papers in circulation. The specific problems connected to this area can be found in table 7.3.
Process step Described in chapter:
Problem Improvement suggestion
Various 7.1.5.1 The paper handling is extensive at the department
- Suggest the use of a more digital file alongside the physical one
Various 7.1.5.2 The operators receive extensive amounts of e-mails every day
- Re-direct e-mails so that the ones that are destined for other operators will not be visible
- Develop an e-mail guide for tips and tricks on what can be done in Outlook to better organize the e-mails
Table 7.3 Description of information handling problems and corresponding improvement suggestions
7.2.3.1 The digital file The characteristic of the forwarding business is that many shipments are being processed at the same time, and at different stages of the shipment. This leads to a high throughput of papers for every operator, as well as many e-mails to answer and customer-specific requests to handle.

43
During the project it was noted that the paper handling is extensive at the Ocean Import Department. Many documents are processed, printed, scanned and e-mailed throughout the file handling. The data from the PMT shows that 6 % of the time is spent on document scanning and archiving, although it was concluded that this number is substantially higher in reality. A file contains between six and ten different documents, which are developed at different stages of the shipment. In order to decrease the paper handling, more usage of digital storage was proposed. This would decrease the waste of over processing, as well as unnecessary motion.
The company has today an efficient e-filing system, where documents are shared from other Panalpina offices around the world. A new version of the e-filing system is also to be launched in the autumn of 2012, with a better interface and a drag and drop-function. The suggestion was to use the e-filing system as storage for a file that will be partly physical and partly digital. Some documents are judged to still be needed in the physical file, such as original documents received by mail, or documents that the operators judge need to be in physical form since it facilitates their work, or because of legal reasons. By printing documents to PDF instead of to a physical paper, time could be saved that was previously spent on picking papers up at the printer, sorting papers and scanning papers. Several documents with possibilities for digital storage were identified, and approved by the operators to store in the digital file. The e-filing system was tested on two operators and a first evaluation shows that there is a potential in this way of working, although there are some minor practical issues to solve before an implementation on the whole department could be introduced. The implementation of a new version of the e-filing system in the autumn of 2012 is thought to solve most of these issues.
7.2.3.2 Re-direction of e-mails The problem with the operators receiving substantial amounts of e-mail every day was found to be a both time-consuming as well as stressful element of the work at the department. Many e-mails that the operators received in their inbox were destined for their co-workers, but the operators still needed to look through each mail before they could file or delete them. Due to the volume of the incoming e-mails, this was a considerable time thief.
One of the suggestions was to re-direct as many e-mails as possible from the operators that were not destined to them. This was done by searching on specific words in incoming e-mails, in order to filter them to specific maps. This decreased the number of e-mails that the operators received in their inbox and had to scan through. Since this was implemented during the vacation period the full result could not be seen, yet there was a decrease in the number of e-mails distributed to each operator through the group-mail by approximately 40 %. Another action here was to create an e-mail guide, with instructions on how to create rules in Outlook, enabling the operators to further make their e-mailing more efficient.
7.3 Model for continuous day-to-day improvement work During the course of the project, the researchers realized great potential in introducing continuous improvement work at the Ocean Import Department. The improvement work can be seen as within the frames of Panalpina’s continuous improvement program, PanCIP, where one big improvement step following the DMAIC-cycle launches a possibility of small improvement steps performed by every employee. The results of the continuous improvements is by Panalpina stated to lead to higher process efficiency, higher process standardization and higher service quality, and at the same time a reduction of costs. By

44
identifying a number of improvement areas, the researchers found concrete improvement suggestions that would increase standardization as well as the process efficiency. By providing the Ocean Import Department with a model to continue the work of identifying improvements, the researchers hope is that the department will start a journey on making continuous improvements an integrated part of their work.
To get started with continuous improvements a model is suggested based on improvement proposal cards and weekly table meetings. It is meant to be a simple yet structured way to catch defects and to gather opportunities for improvements. This suggestion can be tied to how improvement work should be done according to the PDCA-cycle. The model developed is highly inspired by the PDCA-cycle described by Liker & Franz (2011), as can be seen in figure 2.1. It suggests a way of identifying improvements that is driven by the employees’ deep knowledge and understanding of the process.
Figure 7.1 The model for continuous improvements, inspired by the PDCA-cycle of Liker & Franz (2011).
1. Possibilities and countermeasures are discussed and decided on at the next table meeting. Courses of action are decided on and the manager assures that relevant resources are available.
2. The actions that have been taken are evaluated, findings are presented and a decision is made to either change the process or to further develop the suggestion.
3. The final results are presented to the group on a table meeting, a plan for standardization is developed and further improvement areas are identified.
The process improvement cards are thought to be in the size of a business card or slightly larger. They should only contain three rows, name of the one that found the problem/possibility, short description of problem/possibility and name of responsible for the
1. Problems/possibilities are discussed on weekly
table meetings. One person is assigned to investigate further
2. Countermeasures are developed and
discussed at the next table meeting
3. Courses of action are evaluated on the next
table meeting.
4. Final results are presented. Further
development and new possibilities are
identified

45
investigation. The problem/possibility should be written down on the card and investigated according to the four-step procedure seen in figure 7.1, inspired by the PDCA cycle. The suggestion is that the cards should be used not only for detecting and fixing obvious problems, but also identifying areas for improvements. This could be something that the operators wish could work better and facilitate their day-to-day work, as well as improving the service towards customers.
The table meetings should be done on a weekly basis in order to go through those improvements cards that have been created during the week, but also to follow up previously started investigations. The emphasis for these types of improvements is that they should be small and incremental, and possible to discuss and take decisions on in short table meetings. The purpose of this is to avoid over-processing improvement suggestions that can be put into place and tested relatively fast. For larger improvement projects another, more extensive, model is presented in chapter 7.4.
The short-term model can be tied to Panalpinas PanCIP program, where the contributions to continuous improvements by every employee are emphasized. Linking Six Sigma improvement work to business strategy is stressed by Antony and Coronado (2002), where it is described as important to link a project to both financial as well as operational goals. The PanCIP objectives of increasing process efficiency, standardization and service quality, while reducing costs, should be well connected to the model for continuous improvements proposed here.
7.4 Model for long-term improvements The goal of the long-term proposal is to achieve a higher quality of the process through continuous improvement and increased awareness of defects and their effects. This is based on the Lean and Six Sigma methodologies where a few aspects have been given importance as guidelines for the future work. The model seen in figure 7.2 is based on the ability to see defects and waste, as a way to create awareness for where the process can be improved. It is then separated into two major legs with focus on communication and management commitment, both being important to achieve the goal of long-term improvements.
7.3.1 See defects and waste:
In a Lean enterprise a detected deviation or defect is seen as something positive since it allows countermeasures to be taken before the deviation can occur again, before it has an opportunity to affect the customer. As an example, Toyota continuously encourages their workers to report problems in their processes (Liker, 2004). This has several positive effects; the first is to stop with work-around/re-work loops and to actually solve the problem by various means. Examples from the Ocean Import Department could be non-closed files, misunderstandings in e-mails, or wrong information sent/received (by mail, database, webpage et cetera). As Antony (2004b) pointed out, the ratio of defects per million opportunities is not always connected to customer needs in services, which makes it an illogical way of measuring since not all defects are equally important. By defining a problem or creation of waste, and thereby creating an awareness of its existence, it is possible to take actions against it. It is the hope and thought of the researchers that this initially will increase the number of known problems in the organization, but without focusing on the underlying problems it will be much harder to achieve any real improvements in the long-term.

46
The model consists of two main sides, which are further described below. The left hand side is the more strategic part of the model and describing how management should be involved. By creating data-driven awareness it is thought that the problems can be pinpointed and proper actions can be taken. The right hand side is handling more of the communication problems, and how to create awareness of the needs of the internal customer.
Long term improvements
Management commitment
(strategic basis)
Report defects and waste
Company awareness (day
to day basis)
Communcation needs
See defects and waste
Lean and Six Sigma towards
customer
Figure 7.2 Proposed model for long-term improvements
7.3.2 Report defects and waste:
By reporting the problems in a structured way, they can be visualized and categorized, and a pattern in its occurrence can be seen. This goes back to the Six Sigma methodology of identifying and prioritizing improvement opportunities, connected to critical-to-quality characteristics (Magnusson, 2003). Al änge (2003) points out the importance of basing the strategy for improvement work on facts and striving to find the root causes of problems. This takes place is in an environment where the shop floor personnel are having the tools for data collection and are following a systematic problem solving approach to improve areas where they have the primary knowledge. Also Liker and Franz (2011) describe how important it is that problem solving projects with the aim to reduce variation and to build in quality are properly planned and based on facts.
On a more hands on level this means to implement a process improvement system as suggested in the short-term model, but to extend it with a way to report defects in an efficient manner. This is to serve as a background for the next point, Management Commitment, and to have data on where in the process the problems are occurring.

47
7.3.3 Management commitment: Management must be involved in the process improvement initiatives to ensure long-term endurance and successful projects (Magnusson, 2003). This is to ensure that the resources are allocated and that the different initiatives are followed up and implemented. Coronado et al. (2002) even state that management commitment is the most important factor for long-term success in the implementation of Six Sigma. For the proposed model the point is to get away from a general awareness of where a problem is (e.g. the invoicing process is broken), and instead focus specific and known problem areas (e.g. this web-site does not work properly which is causing us severe problems with the invoicing process), and to take proper actions. Connected to this is Coronado et al. (2002) consideration of the need for cultural change towards a state where defects are seen as improvement opportunities that should be visualized. Support for management itself should be gained from the PanCIP program, designed to support improvements such as the proposed model from this project.
The right hand side of the model is connected to the effect of reporting and spreading awareness of what issues are faced by a certain department. This is connected to the Lean thinking of customer focus since there are several processes at the office in Gothenburg where different departments are each other’s customer.
7.3.4 Communication needs and company awareness By visualizing the needs from different departments (customers of the process), and the value they want to have delivered, the flow of information between different departments can be pictured and problems will surface (Liker, 2004). The communication problems have been encountered at several steps throughout the course of this project. Therefore the belief is that a general introduction to Lean in combination with a structured way of reporting defects/deviations/faults/problem will help to initiate a solution to these problems. Problems in communication is often described as “throw over the wall syndrome”; the result from the work in one department is thrown over the wall to the next, as a way for the originating department to keep up the pace and meet its quota of work to be done (Cohen, 2003). The problem is that their solution does not match the need of their (internal) customer, who then will toss the task back for re-work, and then this iteration without-talking-to-each-other-loop is initiated.
An example of where this can start is the process for how the handover of new customers is handled. Today there is no standardized process and the information that is delivered to the operator is not matching the actual needs. As a start, the requirements on the handover should be specified and standardized, and the provider of information should do this handover in cooperation with the receiver (the operator).
7.3.5 Long-term improvements By visualizing what a defect or waste is, how it affects the colleagues and oneself, and how to use continuous improvements to solve them, it is the belief of the researchers that the level of quality will be raised, at the same time as the workload on the operators will be reduced. This is a part of the overall Lean and Six Sigma methodology that strives for better quality towards the final customer since a better internal process is something that will benefit the customer in several ways. Increased quality is obvious, so is also shorter handling times that can be derived from reducing waste (or rather, increased percentage of value

48
adding activities) and possibly a reduction in prices, as the organization is producing more value per investment.
7.4 Benchmarking Connected to the long-term improvements is also the ability for an organization to continuously learn. Alänge (1994) emphasizes the need for management to systemize problem solving and continuously improve processes as a way to create continuous learning. The described challenge is to look upon the operation from a new perspective in order to find new and more efficient ways to work, not just to work harder. One way to do this would be by benchmarking the implementation of Lean in other organizations, which is what Knuf (2000) has investigated. Benchmarking is commonly used to promote aggressive target setting when best practice has been collected either internally or externally to boost the performance of the company, by promoting visual examples of success. This will create awareness about other organizations’ solutions to common problems, but also about how much the own organization can improve. One of the shortcomings of benchmarking is though that a practice taken out of its context will not be that meaningful as it has grown from the culture of the original company. Connected to the future work with Lean Six Sigma at Panalpina, the challenge is to find departments within the organization that are similar enough regarding organization and culture in order to allow efficient transfer of experiences.
7.5 Cultural change As stated before, Lean is very much about cultural change, not only the application of some tools. It is the belief of the researchers that starting a Lean initiative would be very feasible for Panalpina on a global level since it would visualize the value flow and put focus on solving known problems, instead of making heavy investments in measuring a very diversified process. Of course this would be a project of a much larger magnitude then a local implementation, but the effects would also be much larger. Some similarities between a local and a global implementation should be possible to conclude since many of the problems are found on both local and global level, for example communication and sharing of correct and relevant information. Therefore a local implementation can hopefully serve as an eye-opener and create experiences within this field of quality management.
7.6 An improved summary In the Improve phase, countermeasures for the problem areas were presented. These countermeasures were developed due to a rigorous analysis performed in the previous phases of the project. Some improvements were implemented, while some will be left for the company as recommendations. The implemented changes are all in the quick win category due to the short time dedicated for implementation of improvements, while those that require more long-term support are handed over as recommendations. This is to ensure that the researchers could support the implemented suggestions and not leave them “half-done”. The other alternative would have been to only handle over suggestions, which would have given less validity to the work.
Two models for continuous improvements were proposed, one for short-term and one for long-term improvements. The short-term model is directed towards smaller, incremental improvements that can be performed relatively fast. It is based very much in Lean methodology by the usage of short but regular white-board meetings, improvement

49
proposal cards and the PDCA cycle. This is to involve the employees and to have an efficient and fast way to catch possible improvements.
The long-term model is meant to show what the company shall focus on, all being based on available literature regarding Lean and Six Sigma. The key words are
See your defects – if you hide or work around the problem you cannot solve it
Report the problems – a structured way of gathering data around the problems will show were actions shall be taken
Management commitment – to ensure that detected problems are handled and that proper resources are dedicated to the issue
Communication needs and company awareness – to work together so that the right information is gathered and forwarded to the (internal) customer, for example by doing Value Stream Mapping and AIM-workshops on different internal processes.

50

51
8 Control
Panalpina´s current way of measuring performance and making global comparison between departments or business units is to divide the number of files (shipments) done by the department with the number of full time employees (FTE) for a given period of time. There are however some drawbacks with this way of measuring. First of all it is rather a measurement on the demand from customers in comparison to the number of employees, than a measurement on how efficient work is executed. The second problem is that it takes no consideration to local requirements or the differences between different shipments. It is for example less work with an FCL shipment than an LCL shipment, and some customers are requiring much more attention than other. This variability between different customers is something that Loay and DeYong (2003) describes as a challenge for Six Sigma in service industries since different customers act differently, and hence are adding variability to the system.
Today there is a database system in place that can produce reports on many different parameters in the process, and how they have changed over time. This has been of great help in the project to analyze different process steps, and is also used by different departments such as finance and the management group for reviews. There has been a problem though to define parameters that describe the process itself. The parameters are often focusing on the output of the process, which means that they might be affected by noise of the process, rather than to describe the process itself. Another problem is that the majority of the lead time is spent waiting, and except for gathering information it is hard to take any actions while the shipment is in transit from one continent to another. This makes the measurement of traditional lead-times less useable as the value adding activities adds up to a few hours out of a lead-time of about one month.
Holgård and Danielsson (2010) investigated three companies that also had a need to change the way they analyzed the performance of their processes. These companies used traditional column charts that plotted parameters that were thought to be interesting, as they were demanded by customer (percentage of deliveries made on time et cetera). However, these were found to be of little value for analyzing the process itself as they do not take any consideration to the efforts that has been done to achieve a certain results, which is very similar to the measurement problems faced in this project. Holgård and Danielsson (2010) give the example on the percentage of shipments that were done on time. It was possible to achieve a good percentage of on-time deliveries due to over-time and other firefighting solutions, which said nothing about the underlying process. During their project the measurement was shifted towards the percentage of orders that were initiated on time, giving a better understanding about variations in the process, and a possibility to identify counteractions. Åhlström (2004) describes a similar example where Lean production principles were applied to a school setting. The students’ progress when it comes to learning was checked during the learning period, instead of just having exams at the end of the process.
Another valuable outcome from Holgård and Danielsson (2010) was how the usage of control charts can change the analysis of a process. They describe how control charts give better understanding for variation and can remove the question “Is this good?” in favor for a discussion involving “What to do?” regarding (sub-) processes that are found to be deviating.

52
8.1 Control parameters As described by Danielsson and Holgård (2010) and Wedgwood (2006), the control parameters defined as the x´s have been defined as the drivers of variability in the system. By monitoring these x´s it is possible to measure the performance of the system as a whole (y´s). This means that if one control parameter is deviating from its defined limits, it is something that will cause a problem for the system as a whole.
In this project control parameters have been selected that can initiate a discussion with the topic “What to do?” rather then “What has happened?” as described by Danielsson and Holgård (2010). Those that are described in chapter 8.1.1 to 8.1.3 are all chosen since they measure sub-processes that have been identified as problem areas and that have received much attention during the project. So although they are not providing a direct representation of the whole process, they are giving indications for the sub-processes that are most likely to create problems for the operator, and hence cause problem for the process as a whole.
A problem with control parameters is that they need to be representing a process, not being too general, and not being too specific. Armstrong (1995) discussed the problem of aggregated performance measurements, regarding if lack of information for each sub- process step will make it difficult to determine which part of the process that is causing the problems and which part that is performing well. This might lead to slow managerial reactions to significant problems at an individual stage of the process if the overall measurements are showing good results. If the process on the other hand is performing badly overall, there is a risk that resources are allocated to fix a part of the process that is not broken.
Klassen et al. (1998) connected the suitable level of aggregation to the level of analysis, pointing out the feasibility to use aggregated measures for comparison of firms or national productivity, while disaggregated measures are more important for operations improvements. For service industries the measurements metric are proposed to be highly customized but with a low complexity.
Sulek et al. (2006) took this one steps further by performing a case study for application of control charts in a grocery store, consisting of the product selection stage (the store itself) and the front-end which consisted of customer check out. One of the findings is how the analysis of these two departments should be performed. From being analyzed as statistically independent, the performance of the front-end department was found to depend heavily on the performance in the other department. Therefore they point out the importance of using Cause Selecting Process Control Charts to measure productivity and performance over time, as a mean to point out when and where a problem has arisen.
The control parameters found in this project are the first ones, and more should be available for those parts of the process that have not been in focus, but still have a need to be monitored. Examples could be connected to interactions between different parts of Panalpina (both at Business Unit-level and for international connections), but also communication to customers and suppliers. This could be the availability of information, the handover of necessary information, or the standard procedures for establishing new contracts. These are things that are handled on a regular basis and where a broken process

53
will create a lot of extra work for the operator at the Ocean Import Department in specific, but also for the rest of Panalpina in general.
Figure 8.1b gives an example of how a parameter that is put within its specified limits is easier to monitor, compared to 8.1a where only the only comparison is a target parameter which has been set in place without any statistical analysis,
It is essential that the measurements of the control parameters can be done easily and that they have a connection to the general setting of the industry, so that they can provide management with useful and timely information. Different metrics are useful in different situations, but it is important that they reflect how management believes that the service operation uses its resources to create value for the customer (Sulek et al. 2005). This is why the Process Measurement Tools that was used in this project is not suitable for measurements on a regular basis, the results would be to general, have the wrong focus, and consume too much time.
For each control parameter a short reaction plan has been described. The emphasis has been on pointing out suitable counteractions that can be taken when a control parameter is going outside its specifications, and also some likely causes for this to happen.
E-Mail 8.1.1
Adjustments have been made to how the e-mails sent to the group mail are distributed in the department. This should result in a much lower amount of e-mails reaching each operator, and that e-mails that are actually delivered are relevant for that operator to a higher degree. A control chart for the percentage of e-mails that reach each operator compared to the total number of e-mails delivered to the group mail should give a description of how well the e-mail distribution is working. This information can easily be gathered from Outlook on a suitable daily or weekly basis.
8.1.1.1 Reaction plan A guide that describes how to use Outlook efficiently has been created and the operators have been educated in how to make adjustments in Outlook. If renewal of education and settings in Outlook is not enough, one has to investigate if the total number of e-mail has increased, if the complexities of the files have changed (requiring more e-mailing) or if the cause is something else. New customers and establishment of new trade routes are two causes that are known to cause a higher amount of e-mailing.
151413121110987654321
25
20
15
10
5
0
Index
C1
15
Time Series Plot of C1
151413121110987654321
25
20
15
10
5
0
Observation
Ind
ivid
ua
l V
alu
e
_X=10,53
UCL=19,53
LCL=1,53
1
1
I Chart of C1
Figur 8.1a,b The difference between a general target and a control parameter where the upper and lower specification limits have been specified

54
File closing 8.1.2
If all information is available when the job costing is done, each file should close automatically as soon as all external invoices have been received. If this is not the case it is the operators’ task to investigate why this did not work and to adjust the expenses (which at that time might be known instead of estimated since the invoice has arrived). Several improvement proposals from this project aim to increase the availability of information and to work with continuous improvements, things that all should contribute to a higher percentage of files that can be closed as they should. As a measurement of how efficient these actions have been, the number of files that actually are closed without any extra actions from the operator should be monitored. This could be done by using a document where all the non-closed files are monitored, created by the department manager. By entering a short description of the problem for each non-closed file it will also be possible to pinpoint the most common problems.
This should be a source for continuous improvements, but also a way to identify needs for education, evaluation of suppliers it they are found to be constantly late with their invoices, or identification of other root causes that are affecting the job costing the most.
8.1.2.1 Reaction Plan Monitor the number of non-closed files as a percentage of the total number of files. When increasing outside the specified limits it is time to take actions against the major causes that are to be found in the log file.
Time to invoicing 8.1.3
When the final delivery is booked all costs are known and the operator should do the job costing and invoicing, at least according to the theoretical process description. But as mentioned before, there might be more urgent tasks that are requiring attention, and since the customer does not see a delayed invoice as a problem, the invoicing is something that is given low importance. However this is not the case for Panalpina as a company since a delayed invoice to customer means delayed payment from customer, which results in a reduced cash flow. Therefore this measurement is in place today as a way to track performance of the process, measuring the time from a shipment has arrived to port, and until the invoice is sent. This measurement is seen as an indicator for two things; first of all if the operator has the time to do job costing plus invoicing, although he/she has the option to do something more urgent. If the task were put aside it would be an indication that the operator is put under high stress. The second indicator would be that the operator sees the job costing and invoicing as a heavy burden. This is partly the case today as the task is complicated, and it requires some effort to gather all necessary information.
8.1.3.1 Reaction Plan Monitor the time from ETA to invoicing; when this is leaving its specified interval it is time to start an investigation.
The invoicing process has become easier with a more automatic calculation of costs. If this is found to be not enough, one has to ask if there is a need for further improvement in these calculations, or if automation of other parts of the invoicing is possible. Other sources to increased problems with invoicing could be decreased quality on the customer offers that the operators use to calculate the amount to be invoiced.

55
8.2 Updated p-FMEA Since the p-FMEA created during the Measure phase described the problems as they existed at that stage, an updated version of the FMEA been was created in the Control phase, see table 8.1 to 8.3. The purpose is to reflect upon how the actions taken as a result of the project has affected the system, and to point out the most critical areas that need further attention.
The most dramatic effect can be seen for Id#7. The risk that an operator misses an important e-mail due to the fact that “the group list distributes e-mail to everyone” was heavily reduced with the installation of some filtering rules in Outlook.
Table 8.1 Updated FMEA with input from the C&E Matrix
Table 8.2 Updated FMEA with input from the Fishbone diagram
Id# Potential Failure mode Potential Failure Effect
Potential Failure Cause
First RPN
New RPN
6 Step two declaration is not done within 11 days
Fines from customs authority
Stressed operator has not noticed
deadline
300 300
7 Operator misses an important e-mail
Delay in delivery Group mail distributes e-mail to
everyone
270 54
8 Shipment missed feeder Delay to customer Bad weather, peak in workload at port,
etc
224 224
9 Misses in communication Double work/re-work/frustration
Agents do not have access to FOS
216 216
10 Operator has to do repetitive task all over
again
Re-work Information in many places
210 <210
Id# Potential Failure mode Potential Failure Effect
Potential Failure Cause First PRN
New RPN
1 File not closed/closed with wrong amount
Re-work Expense was forgotten or had to be estimated
196 64
2 Invoices received after file closing
Re-opened files Suppliers are slow on sending invoices
144 144
3 Received invoices do not match estimations
in job costing
File cannot be closed
Faulty estimations in job costing
144 144
4 Customer offer is not updated
Customer is billed wrong amount and credit note has to
be created
Seller /Operator has not updated Customer Offer
140 140
5 Not updated information listed in
SOP
Work is delayed and/or performed
incorrectly
Customer does not notify changes
120 120

56
As stated in the original p-FMEA not all problems are possible to solve since they are caused by circumstances that are out of control for this project. Examples of this can be seen in Id# (2) and (5). These things were not left unattended because they were thought to be hard to solve, rather they were investigated and included in the detailed value stream mappings that were done during the project. However, no further actions were taken if the investigation
pointed at a source to the problem that required too much effort (if possible at all) in comparison to the estimated value. Number ID# (3) and (4) should be possible to reduce by the implementation of the proposed improvement suggestions.
As seen in table 8.3 the score for Id# 11 has been reduced. This in since an improved invoicing process is thought to ease the process and hence cause a more continuously performed invoicing.
Id# Potential Failure mode
Potential Failure Effect
Potential Failure Cause
First Severity *
Occurrence
New Severity*
Occurrence
11 Peak in workload at end of month
Stressed operator
Monthly invoicing 100 60
12 Different systems cannot talk to each
other
Operator has to re-enter information
System design 100 70
13 Stressed operator during some part of
the day
Hugh amount of e-mail in the
morning
Colleagues in different time-
zones
90 90
14 Deconsolidation list has to be done
manually
Extra work Deconsolidation list cannot be
created automatically
81 81
15 Estimations for job costing will not be
good enough
Re-work One operator receives more the
800 invoices/month
70 70
16 E-mail is time-consuming and
distracting
Operator is distracted from other
tasks
Bad mail discipline (PA
origin)
63 36
Table 8.3 Updated FMEA for failure modes that occur very frequently as a result of bad process design
8.3 A controlled summary In the control phase different control parameters were proposed, not just to measure the output of the process. An emphasis has been laid on finding control parameters inside the process that can describe what is happening and that do not give attention to noises in the process. This is to avoid that time spent on discussions about the process, instead of being used for actual improvement work. Three control parameters have been proposed in sub-processes that have been in focus through the project, but more control parameters should be desirable for other parts of the process. The proposed control parameters can be seen in

57
table 8.4, a visualization of what part of the process that will be measured can be seen in figure 8.1.
Presented in chapter
Concerning Description
8.1.1 E-mail To monitor the percentage of the e-mails directed to the group mail that each operator receive in their inbox (e.g. are not directed automatically). Also to monitor the total number of e-mails in correlation to number of shipments.
8.1.2 File closing To monitor the number of files that are closed automatically, without the operator having to re-work anything.
8.1.3 Time to invoicing
How long time it takes from when a shipment has arrived to the port and until the shipment is invoiced to customer.
Table 8.4 Summary of proposed control parameters
Figur 8.1 Visualization of what parts of the process that will be monitored
8.1.2
8.1.1
8.1.3

58
59
9 Results
This project had the purpose and scope to increase the productivity at the Ocean Import Department by using Lean and Six Sigma, and investigate how results from improvements can be measured. This was done by initiating improvement suggestions that were found during the project, as well as proposing models for further work with continuous improvements at the department. The researchers also developed control parameters for appropriate ways of measuring the process.
A considerable amount of time was used to measure the current state process with the help of the Process Measurement Tool (PMT), provided by Panalpina. Besides measuring the process the PMT give insight in how the process works, insights that ultimately proved to be of greater value to the researchers then the measurements themselves. Finding substantial improvement ideas as a direct result of the measurements was difficult. The measurements were useful when it comes to pinpointing problem areas, but the resolution of the measurements and the way the data is gathered does not reveal the root cause of the problem, nor does it provide sufficient support to enable efficient work in finding improvement opportunities.
Instead it was the workshop-based tools from the Lean Six Sigma methodology that turned out to have the greatest ability to pinpoint specific problems to be investigated. These can be generally concluded into “Problems with communication and information”, and make the work hard for the operators since it prevents a smooth and efficient workflow. The communication problems includes both external and internal channels, and one of the symptoms is that the operators are spending at least 18 % of their day writing and reading e-mails. A portion of the e-mails is considered to be “unnecessary” by the operators; for example e-mails that only require conformations of actions that have already been agreed on. The extensive e-mailing can also be due to unclear specifications, role descriptions or cultural differences. This connects to the internal communication problems where there is a need to improve the way communication is handled and handovers are done. As an example, many handovers are done according to the “throw over the wall”-syndrome, meaning the communication and discussions about what demands the receiver (internal customer) has on the handover are not properly specified.
Having many databases, systems and websites is making it hard to have an overview and easy access to all relevant information for each shipment. Often there is no standardized way to retrieve information, which means that the operator has to search in different places. All these systems are also causing a lot of double work since information has to be entered at several occasions. Sometimes a lack of information is causing work tasks to be postponed, since the result with high likeliness would be rework due to incomplete data.
With support in available literature, on especially Lean methodology, and the analysis done on the process the researchers emphasize the need to work with continuous improvements as a way to take actions against the described problems. Therefore a short-term and a long-term model were developed for this implementation. The idea is that the short-term initiatives will catch those problems where the solution is easy to find and will result in a significant improvement. The long-term model is more about changing the way defects and communication are handled and improved. The common word for short-term and long-term

60
improvements is Management Support, both to make sure the initiative is launched, and to keep it vital and alive in the long run.
The researchers have presented some initial ideas about how to measure the process by using process control charts. The main idea is to measure parameters inside the process instead of the output of the process. This is to ensure that the measurements reflect upon the process itself, and not a parameter that is biased by any noise connected to the process. This way management will be provided with a tool that allows counteractions to be placed at those places where they are needed, rather than at processes that are performing as they should.
The researchers have also presented some improvements that either have been implemented, or are ready to be launched in the near future. They describe actions that will give benefits with visual results already in a short to medium long perspective. Covering renewed education in different tools and software, improved procedures for handover and extended usage of digital storage, these suggestions are more about fixing a broken current state process then to change a culture as described in the long-term proposal.

61
10 Discussion
Panalpina is a global company with approximately 15 500 employees spread across the globe, diverted into some 500 offices in 80 countries, with a large number of suppliers and customers. Some offices operate with single digit number of employees, while others have hundreds of employees that are handling shipments in a line production setting. Some shipments consist of many containers, while others are on just a few pallets but with special conditions. This makes standardization hard and there are a number of cross-functional support functions with the task to support and coordinate the daily operations, but the geographical separations make this hard since the value flow for one shipment will not be equal to the value flow of the next. Therefore one can question if global benchmarking of efficiency is the right way to improve performance. The results in this report suggest a need to shift from heavy data-driven tools to qualitative analysis originating in the Lean Six Sigma methodology. Not every process is easy to measure, but by visualizing the customer that needs to be in focus, one can argue that the friction in the system will decrease. The visualization of the waste, and a common understanding of what value is, would be a great step in the right direction.
This project has managed to describe the process in the scope and present proposals for improvements that will strive for a higher efficiency, but it has not been a straight path and the methods have changed along the way. From initially being a data-driven project, the focus has shifted more towards qualitative tools. This was found to be more useful under the current conditions, with a need to find root causes rather than to quantify the problems using statistically analyses.
The initial phase of this project was spent measuring and mapping the current state process. It turned out to be a challenge due to all the variation and special conditions that are a natural part of the shipping industry. This made it hard to define a standard for measurements and sub-processes that could be used as a benchmark, although the main process often is following the same path. The further the project progressed the more obvious it became how hard it is to measure a customer service process, and to draw any valid conclusions out of the data. The measurements gave some valuable insights in the process for the researchers, who came in as external consultants. They can also give a good overall description of how much time is spent in different parts of the process, but there are alternative ways to get a similar insight. The AIM workshop was performed during one morning session and presented a chart that turned out to be very precise. It pinpointed the main problem areas in a way that other tools did not manage to do until weeks of data analysis and interpretation had been put in.
Therefore the researchers point at the need to shift from heavy data based tools to qualitative analysis originating in the Lean Six Sigma methodology. There is a great value in integrating the process owners in the improvement process, since they are the people that are the most knowledgeable in the process. By relying on data based tools instead of asking the operators what the problem is, and how the process works, there is a great risk that there will become a gap between what is applicable in reality compared to what the data suggests.
One will though have to be aware that Lean is so much more then the application of some tools. Many of the benefits with Lean are derived from a new way of thinking regarding

62
quality and customer focus. This is of course a big challenge for any organization, but it is also here that great possibilities can be found. It is the belief of the researchers that the visualization of the value stream with focus on customers (internal as well as external) will create a more efficient organization, both inter-department and international, as the created waste can re reduced.
It is not easy to measure soft processes such as the one at the Ocean Import Department, due to all the variation and noise factors. Therefore a measurement on the output of the process will not give an accurate measurement over time. In the manufacturing industry there is instead an adoption of process charts that measure the performance inside the process; this would be applicable in this service setting as well. By measuring the performance of key parts of the process, it is possible to predict the performance of the whole system, and to take valid counteractions on the sub-processes that have the greatest need for it.
Possible reorganizations at the department were investigated, for example whether it is more efficient to divide the tasks among the employees by having one operator doing administrative tasks, or if everyone should do the administrative tasks for their own shipments. A simulation was set up in order to work through different alternatives in pursuit for the best solution, but both the simulation and the connected discussion with the operators came to the conclusion that there is no need to swap the roles. The motivation to reorganize would be valid if there was an obvious gain, such as an increased overview or lesser need for handovers, without any drawbacks that make the system more fragile or slow. No such effects were found, and the idea of reorganization was discarded. Therefore it is the researchers belief that this discussion needs to change from “Who shall do what?”, to “What shall we do?”, meaning to visualize the process in order to identify what is value adding, and what is pure waste.

63
11 Conclusions
By using the structured DMAIC cycle of Six Sigma and combining it with Lean principles, the researchers have analyzed the processes at the Ocean Import Department with the aim of finding improvement potential. Through qualitative and quantitative tools, areas for improvements were found and proper counteractions were proposed. These areas often contained communication barriers, as well as large amounts of rework. The improvement suggestions were largely influenced by the principle of eliminating waste, which according to the researchers goes hand in hand with productivity improvements. Besides using tools from Lean Six Sigma, Panalpina’s internal tool PMT was used in order to detect improvements. The PMT gave hints for improvement areas, but the researchers’ beliefs were that the usage of the tool is too time consuming in relation to the results, and that the tool does not involve the operators in the improvement work as much as would be desirable.
By proposing counteractions against identified problems, and through workshops explaining the Lean methodology, the researchers’ hopes were to show the benefits of working with structured problems solving methods and Lean principles. For further improvement work at the department, two models were proposed to be implemented; one for small, incremental improvements, and one for larger, more complicated improvements. Both of the models were inspired by structured problem solving methods such as the PDCA-cycle and the DMAIC-cycle. The models contain high interaction from the operators, which are the persons that live and breathe the process, and are hoped to induce Lean thinking in the long-term as a cultural change. In the long-term an implementation of Lean within Panalpina on a global scale would be very feasible since it has the potential to make the internal processes run faster, smoother, and with less waste, all being improvements that would serve the customer.
The productivity measurement that is in place today at Panalpina compares the number of files that are handled per full time employee with the same ratio in other countries, in order to detect which countries need to make improvements. Making comparisons between different countries, with possibly different conditions when it comes to handling shipments, is difficult. The researchers’ suggestion was to move the measurements inside the process instead, to tasks that represent the condition of the whole process. These tasks were determined from the improvement areas that were found; tasks that have large amounts of waste should be monitored and controlled. By establishing control charts at these points, it can be detected when the process is about to go out of control, and proper counteractions can be implemented.

64
65
12 References
Alänge, S., (1994) The New paradigm for Industrial Practices. Department of Industrial Management and Economics, Chalmers University of Technology, CIM Working Papers No. WP 1994-01
Andersson, R., Eriksson, H., Torstensson, H., (2006) Similarities and Differences between
TQM, Six Sigma and Lean. The TQM Magazine, Vol. 18 Iss: 3, pp. 282-296
Antony, J., Antony, F. J., Kumar, M., Cho, B. R., (2007), Six Sigma in service organisations: Benefits, challenges and difficulties, common myths, empirical observations and success factors. International Journal of Quality & Reliability Management, Vol. 24, No. 3, pp. 294-311.
Antony, J., (2006) Six Sigma for service processes. Business Process Management Journal, Vol. 12, No. 2, pp. 234-248.
Antony, J. (2004a) Six Sigma in the UK service organisations: results from a pilot survey. Managerial Auditing Journal, Vol. 19,No. 8, pp. 1006- 1013.
Antony, J., (2004b),"Some pros and cons of six sigma: an academic perspective", The TQM Magazine, Vol. 16 Iss: 4 pp. 303 - 306
Armstrong, P.K., (1995), A model for analyzing quality in the service delivery process in P. Harker (Ed.), “The Service Productivity and Quality Challenge”, Kluwer Academic Publishers, Dordrecht, The Netherlands, pp. 311–342
Bergman, B., Klefsjö, B., (2010) Quality from customer needs to customer satisfaction. 3rd edition. Lund: Studentlitteratur.
Bryman, A., Bell, E., (2007) Business research methods. 2nd edition. New York: Oxford University Press Inc.
Chakrabarty, A., Tan, K.C., (2007) The current state of six sigma in application in services. Managing Service Quality, Vol.17 No. 2,pp. 194- 208
Cohen, M.C., (2003) “A path to improved pharmaceutical productivity”, Nature reviews Drug Discovery, Vol. 2 September 2003 pp. 751-753
Cotter, J.P., (2007), Leading Change, Why Transformation Efforts Fail. Harvard Business Review, January 2007, pp. 96-103
Coronado, R.B., Antony, J., (2002),"Critical success factors for the successful implementation of six sigma projects in organisations", The TQM Magazine, Vol. 14 Iss: 2 pp. 92 - 99
Danielsson,M., Holgård, J. (2010) Improving analysis of key performance measures at four middle-sized manufacturing companies. Gothenburg: Chalmers University of technology (Master of Science Thesis at Department of Materials and Manufacturing Technology)

66
de Koning, H., Verver, J.P.S., van den Heuvel, J., Bisgaard, S., & Does, R.J. (2006) Lean Six
Sigma in Healthcare. Journal for Healthcare Quality, Vol. 28, No 2. Pp. 4-11
Hensley, R.L., Dobie, K., (2005),Assessing readiness for six sigma in a service setting, Managing Service Quality, Vol. 15 Iss: 1 pp. 82 – 101
George, M.L. (2003) Lean Six Sigma for Service. New York: McGraw-Hill.
Klassen, K. J., Russell, R. M., Chrisman, J. J.,(1998) Efficiency and productivity measures for high contact services. The Service Industries Journal, Vol. 18, No 4, pp. 1-18
Knuf, J., (2000), Benchmarking the lean enterprise: Organizational learning at work, Journal of Operational Engineering Vol. 16, No. 4, July/August pp. 58-71
Larsson, L., (2008) Lean administration. Liber: Malmö
Laureani, A., Antony, J. Douglas, A.,(2010),"Lean six sigma in a call centre: a case study", International Journal of Productivity and Performance Management, Vol. 59 Iss: 8 pp. 757 - 768
Liker, J. K. (2004) The Toyota Way – 14 management principles from the worlds greatest manufacturer. New York: McGraw-Hill
Liker, J.K., Franz, J.K. (2011) The Toyota Way to Continuous Improvement. New York: McGraw-Hill
Loay Sehwail, Camille DeYong, (2003),"Six Sigma in health care", Leadership in Health Services, Vol. 16 Iss: 4 pp. 1 - 5
McLaughlin, C.P., Coffey, S.,(1990),"Measuring Productivity in Services", International Journal of Service Industry Management, Vol. 1 Iss: 1 pp. 46 – 64
Magnusson, K., Kroslid, D and Bergman, B., (2003) Six Sigma, The pragmatic approach. 2nd edition. Lund: Studentlitteratur.
Modig, N., and Åhlström, P., (2011) Vad är lean? Stockholm: Stockholm School of Economics Institute for Research
Nadler, D.A., Tushman, M.L., (1996) Implementing New Designs: Managing Organizational Change. In M.L. Tushmans & P. Andersons (Eds.), Managing Strategic Innovation and Change: A Collection of readings (pp. 596-606). New York: Oxford University Press
Nakhai, B., Neves J.S., (2009) The challenges of six sigma in improving service quality. International Journal of Quality & Reliability Management, Vol. 26, No. 7, pp. 663- 684.
Pepper, M.P.J., Spedding, T.A. (2010) The evolution of lean Six Sigma. International Journal of
Quality & Reliability management, Vol 27 No 2, pp. 138-155
Pojasek, R.B., (2003) Lean, Six Sigma and the Systems Approach: Management initiatives for Process Improvement. Environmental Quality Management, Vol. 13, No. 2, pp. 85-92

67
Sheehy, P., Navarro, D., Silvers, R., Keyes, v., Dixon, D., (2002) The black belt memory Jogger Salem: GoalQPC
Sulek, J. M., Maruchech, A., Lind, M. R., (2006) “Measuing performance in multi-stage service operations: An application of cause selecting control charts”. Journal of operations Management 24 pp. 711-727
Wedgwood, I.D., (2006) Lean Sigma: a practitioners’ Guide Upper Saddle River: Prentice Hall
Åhlström, P. (2004) Lean service operations: translating lean production principles to service operations, Int. J. Services Technology and Management, Vol. 5, Nos. 5/6, pp. 545-564.

68

69
Appendix A: Problems that would cause a customer to change forwarder
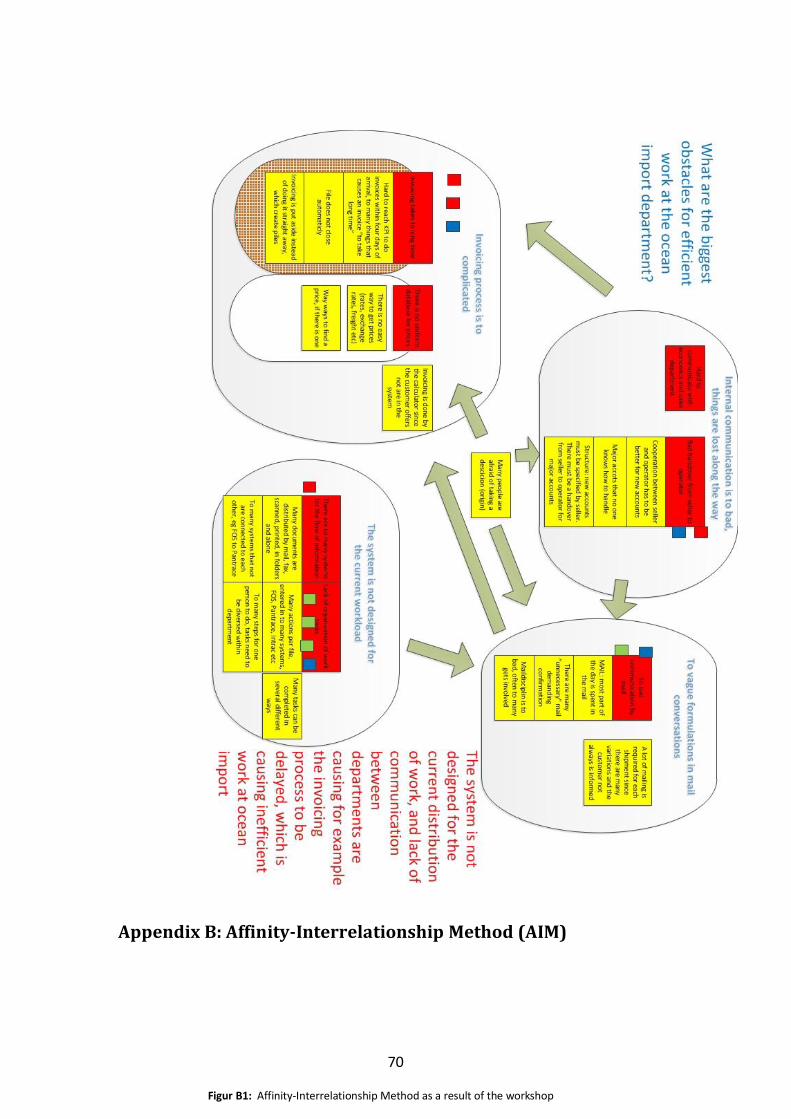
70
Appendix B: Affinity-Interrelationship Method (AIM)
Figur B1: Affinity-Interrelationship Method as a result of the workshop

71
Appendix C: Cause and Effect Matrix
Figure C.1: Cause and effect matrix, those marked in green were selected for further investigation; those in orange were left out
importa
nce
77
76
89
88
87
96
Speed of service
Quality of service
Cost of service
Transportation
Overporduction
Waiting
Extra (over) processing
Motion
Inventory
Underutilized People
Correction (Accuracy
and timeliness of
documentation )
Amount of files not
closed automatically
File
clo
sin
g38
Dete
ctive
work
for n
on-c
losed/re
-opened file
s0
10
09
99
99
09
9511
514
-3
Invo
icin
g a
nd
job
co
stin
g31
Know
ledge a
bout ta
riffs/c
harg
es (c
usto
mer o
ffer o
r genera
l rate
s)
09
90
30
93
93
13
366
402
-36
File
clo
sin
g37
Non-c
losed a
nd re
-opened file
s0
00
00
93
19
09
9320
320
0
Op
era
tor
41
Handlin
g d
ocum
ents
(Scan, p
rint, c
opy)
03
09
90
99
10
10
308
317
-9
Invo
icin
g a
nd
job
co
stin
g32
Know
ledge a
bout u
pcom
ing e
xpenses (w
hat P
A h
as to
pay)
03
30
30
93
00
99
297
309
-12
Ga
the
r de
tails
on
de
livery/c
us
tom
s12
SO
P (d
eta
ils o
n a
rrived s
hip
ment/c
all c
usto
mer)
19
00
13
91
31
90
297
327
-30
FC
L: A
rran
ge
de
livery a
nd
cu
sto
ms
cle
are
nce
21
Update
T&
T (F
Cl +
LC
L)
09
90
03
90
00
30
252
288
-36
FC
L: A
rran
ge
de
livery a
nd
cu
sto
ms
cle
are
nce
22
Recie
ved c
usto
ms p
aym
ent (F
CL +
LC
L)
91
90
09
31
00
00
246
285
-39
File
cre
atio
n8
Pre
-advic
e, a
dvic
e a
nd re
-advic
e fro
m c
arrie
r3
90
00
09
10
09
0245
281
-36
Invo
icin
g a
nd
job
co
stin
g34
Appro
xim
ate
know
ledge a
bout s
ubcontra
cto
rs ta
riffs/c
harg
es (P
RT - in
voic
e a
ppro
val)
01
00
00
03
90
99
238
241
-3
Op
era
tor
40
Know
ledge in
FO
S, K
SD
, inte
rnet to
ols
39
00
30
19
03
30
236
272
-36
Op
era
tor
42
Mail d
iscip
line
09
00
90
90
00
30
234
261
-27
FC
L: A
rran
ge
de
livery a
nd
cu
sto
ms
cle
are
nce
16
Sta
tistic
al n
um
ber fo
r custo
ms c
leare
nce (F
CL +
LC
L)
39
00
03
93
00
30
234
270
-36
Invo
icin
g a
nd
job
co
stin
g35
Opera
tor k
now
ledge fo
r findin
g file
num
ber (P
RT- in
voic
e c
odin
g)
00
00
09
09
91
00
232
232
0
File
cre
atio
n5
E-file
s fro
m o
rigin
(B/L
, inte
rnal in
voic
e)
33
03
33
13
00
90
224
242
-18
Ga
the
r de
tails
on
de
livery/c
us
tom
s13
B/L
from
orig
in (if o
rigin
al)
99
09
03
11
00
00
223
277
-54
Op
era
tor
39
Educatio
n &
years
at w
ork
pla
ce
39
10
33
33
10
03
216
253
-37
Re
treive
initia
l info
rma
tion
4R
ate
s/c
harg
es fro
m N
exus
03
90
00
33
00
39
213
231
-18
Re
treive
initia
l info
rma
tion
2C
lient re
quest w
ith in
fo o
n s
hip
ment (re
ady d
ate
, volu
me, w
eig
ht e
tc)1
99
00
33
00
03
0211
250
-39
File
cre
atio
n10
De-c
onsolid
atio
n lis
t9
10
90
11
13
01
0182
212
-30
File
clo
sin
g36
Exte
rnal in
voic
es re
cie
ved
01
00
09
00
00
09
142
145
-3
Invo
icin
g a
nd
job
co
stin
g33
Rate
of e
xchange
00
10
00
19
00
09
141
142
-1
File
cre
atio
n6
Exte
rnal in
voic
e fro
m s
hip
per
91
31
03
01
00
10
141
174
-33
Re
treive
initia
l info
rma
tion
1R
esponsib
le o
pera
tor s
ele
cte
d1
11
00
19
00
30
1129
136
-7
LC
L: A
rran
ge
de
livery
27
Update
d c
onsolid
atio
n lis
t9
30
10
01
11
01
0123
159
-36
FC
L: A
rran
ge
de
livery a
nd
cu
sto
ms
cle
are
nce
18
Tru
ckin
g c
om
pany c
onfirm
atio
n (F
CL +
LC
L)
91
01
03
00
00
03
121
151
-30
Ga
the
r de
tails
on
de
livery/c
us
tom
s11
Carg
o re
lease &
Pic
k-u
p tim
e a
t port
91
01
00
31
00
00
108
138
-30
FC
L: A
rran
ge
de
livery a
nd
cu
sto
ms
cle
are
nce
17
Tru
ckin
g c
om
pany b
ookin
g (F
CL +
LC
L)
91
00
00
00
00
13
97
127
-30
File
cre
atio
n7
Maste
r B/L
from
carrie
r1
30
10
30
10
01
078
90
-12
Re
treive
initia
l info
rma
tion
3G
reen lig
ht fro
m c
onsig
nee
31
01
03
00
00
00
61
73
-12
File
cre
atio
n9
Cre
dit in
form
atio
n o
n c
usto
mer
31
10
00
00
00
00
35
48
-13
Ga
the
r de
tails
on
de
livery/c
us
tom
s15
Custo
ms c
redit in
form
atio
n1
10
10
01
00
00
028
34
-6

72
Appendix D: Process Measurement Tool (PMT)
Figure D.1 The PMT as it looks while measuring
Sto
pp
ed
IDFile
-Nr.
Ho
us
e-N
rU
TN
-Nr
Cu
sto
me
r Nam
eV
alue
Ch
ain / P
roce
ss
Su
b-P
roce
ss
Elaps
ed
Tim
eA
dd
ition
al Info
rmatio
nC
on
t. me
as.
10035950808
ElektroskandiaPickup
Pickup Arrangem
ent0:03:05
continue
10036Euroform
PickupPickup A
rrangement
0:00:55continue
10035950808
ElektroskandiaPickup
Pickup Arrangem
ent0:00:35
continue
10034950808
ElektroskandiaPickup
Warehouse advice (Pickup)
0:00:16S
end info to warehouse
continue
10033950808
ElektroskandiaC
lient EnquiryS
cheduling and timetable
0:00:20S
end info to Custom
ercontinue
10032950808
ElektroskandiaC
lient EnquiryS
cheduling and timetable
0:00:01U
pdate with schedule in FO
Scontinue
10031950808
ElektroskandiaExport D
ocumentation
Single File C
reation0:02:14
Update w
ith schedule in FOScontinue
10030950808
ElektroskandiaC
lient EnquiryS
cheduling and timetable
0:01:00continue
10029950808
ElektroskandiaExport D
ocumentation
Single File C
reation0:03:27
continue
10028950739
Helens R
örExport D
ocumentation
Single File C
reation0:03:03
E-file/SC
Pcontinue
10027974813
Bergqvist
Status M
onitoring & U
pdatesStatus M
onitoring & U
pdates0:03:46
SA
P. Check files that not have been closed. Follow
up + rework,
continue
10026974622
Status M
onitoring & U
pdatesStatus M
onitoring & U
pdates0:05:46
SA
P. Check files that not have been closed. Follow
up + rework, incl request to m
ove one invoice to correct File-nrcontinue
10025974526
Status M
onitoring & U
pdatesStatus M
onitoring & U
pdates0:09:39
Check files that not have been closed. Follow
up + rework, incl m
oving one invoice from one file to anoth
continue
10024950294
Status M
onitoring & U
pdatesStatus M
onitoring & U
pdates0:08:17
Check files that not have been closed. Follow
up + rework
continue
10023Tor A
nderssonS
tatus Monitoring &
UpdatesS
tatus Monitoring &
Updates
0:02:57G
o through physical documents to know
what to do next
continue
10022950804
Tor Andersson
PickupW
arehouse advice (Pickup)0:02:19
Create instructions for Pick up to W
arehousecontinue
10021950804
Tor Andersson
Status M
onitoring & U
pdatesStatus M
onitoring & U
pdates0:02:10
Add this to the next
continue
10020950804
Tor Andersson
Docum
ent Scanning &
Archiving
Docum
ent Scanning &
Archiving
0:00:01Forw
arding Schedule to receiver
continue
10018950804
Tor Andersson
PickupPickup A
rrangement
0:05:46continue
10017975555
Status M
onitoring & U
pdatesStatus M
onitoring & U
pdates0:02:13
Follow up on shipm
entcontinue
10016975503
3 Nine A
BC
lient EnquiryO
rder acceptance / creation0:07:26
Redo previous B
/L instructions after they have been declinedcontinue
10015D
ocument S
canning & A
rchivingD
ocument S
canning & A
rchiving0:02:32
Random
continue
Pro
ce
ss
Tim
e M
ea
su
rem
en
t To
ol 1
.0
FOS
Sto
p
Initial Work
Re-W
ork
Blo
cke
d
Tim
e
Quotation
Order acceptance
/ creation
Cargo Tracking
Scheduling and tim
etable
Other
Pickup A
rrangement
Warehouse
advice
Air-
/ Seawarder
Local Tools / Excel
Web / Intranet
Shared Drive
Phone / E-Mail / Fax
Manual / Paper
Carrier Booking
(Air-)Port
transfer
Single File C
reation
Master File
Creation
Custom
s form
alities
Invoicing internal
Invoicing external
Costing
Quotation
Instructions
Inbound Transfer
File creation
Custom
s form
alities
Delivery / H
and-over A
rgm.
Warehouse
advice
Invoicing internal
Invoicing external
Costing
Follow U
pR
es
et
Other
Other
Other
Other
Deconsol
Docum
entation
Other
Other
T&T, IH
T
Ro
le:
Other
File-N
r:
Ho
us
e-N
r:
UT
N-N
r:
Cu
st.-N
ame
:
Ad
d. In
fo.:
Activity:
Su
pp
ortin
g T
oo
ls:
Other
Pro
du
ct:
Air
Ocean
Docum
ent Scanning & A
rchiving
Status Monitoring &
UpdatesA
dvice

73
Appendix E: Detailed improvement suggestions for job costing
An aspect of the incorrect job costings was to improve the accuracy of the costs estimations taken from Panalpina’s internal systems. A cause for the inaccuracy was that the operators did not receive proper training in the systems when they were launched, which led to individual solutions when finding expenses. This was a problem that was linked to standardization. The countermeasure was to perform a work shop with the operators and a person that is highly knowledgeable in the systems, in order to develop standards in how the systems are used and minimize the faulty expense estimations. If the percentage of correct expense estimations could be increased, a large amount of the re-work could be eliminated.
A more long-term suggestion to increase the percentage of correct job costings was also proposed. A digital log-book was proposed at the Ocean Import Department, where all the operators can log why files not are being closed. Since the closing of the files is highly dependent on the job costing, this is thought to be an efficient way of collecting the problems and attacking the root causes. During a workshop involving several of the operators, it was estimated that approximately 30 % of all files are not closed automatically; 50 % of these due to incorrect job costings and 50 % due to other issues, such as subcontractors sending invoices with incorrect amounts or costs being put on the wrong file by the economy department. By logging the causes thoroughly, the operators will be able to collect data around the causes and identify why the jobcosting are incorrect, and if there is for example any subcontractor that is over-represented when it comes to sending invoices with the wrong amounts.

74
Appendix F: Detailed improvement suggestions for invoicing
The next action that was considered was the invoicing. The customer offers were available in Excel, and the operators combined the different charges for each shipment on a calculator. The researcher’s suggestion was to introduce a new sheet to each customer offer, where the operators could easily register what type of shipment it was, the exchange rate and choose the port, and it would automatically produce the price under those conditions. This way, the extra work of having to calculate each invoice by calculator was decreased. The operators could retrieve each price more effectively, and the risk of mistyping decreased since it involved fewer steps of feeding in information.
In order to attack the problem with the information lacking in the invoicing/job costing task, several counteractions were proposed. When it comes to the non-updated customer offers, it was investigated which customers had a monthly offer update, which customers had more rarely updated offers, and which customers did not have offers at all. It was found that some of the offers that were being updated on a monthly basis actually belonged to customers that were infrequent. This lead to overproduction at the sales department, time that was spent updating offers that were not used often, that could have been spent on updating the offers that were used frequently. It was suggested that the sales department should have a meeting with the department manager every three months, where statistics of how many shipments each customer has had the last three-month period should be presented. This is to detect which customers are or have become infrequent, and to at regular intervals revise which customers should have monthly updates on offers, taken into consideration that there might be seasonal variation in shipments.
To simplify the complicated invoicing process, the researchers suggested that all customers and shipments should have an invoicing template. The use of templates existed at the department, but far from all customers had templates, especially the non-frequent ones. It was not difficult to create a template in the invoicing system, and it had the potential of facilitating the invoicing process and saving time. As a counteraction, a workshop was performed with the whole department, where each operator performed an “inventory check” of their templates, and created templates so that all customers were covered. One operator was assigned responsibility to create general templates, different for FCL and LCL shipments, where the most common costs where listed, but without addresses.
The third action regarding the invoicing had to do with the batches of files that are formed before the invoicing step. As experienced by the operators, and the researchers as well, the invoicing was often put aside to be done at a later stage, and had a tendency of piling up and being done in large batches at the end of each month. The researchers suggested two types of counteractions to manage this problem:
1. Constructing a poka yoke system, where operators for example could not perform the customs declaration without having done the invoicing. The customs declaration could not be put aside like the invoicing, so by making it impossible to do the customs declaration without having done the invoicing, the invoicing could be performed at once and the file would flow through the system without having to pile up and be performed in large batches.

75
2. Creating an incentive for the operators to perform the invoicing directly when they have the opportunity. This idea originated from the visual management theories of Lean. There could be for example a big plastic bowl, where each operator could put a red ball when they performed an invoice straight away, and when the bowl is full the whole department would get a reward. Although it could seem childish, it would be an important visual management tool where the operators are motivated by the playful approach to invoicing straight away.
When evaluating these two suggestions, the poka yoke system was found to be non-feasible. There would have to be a catch either in the transport booking step, the customs declaration step or in the updating of the shipment status. Constructing the catch would require coordination with external companies’ IT systems in two of the cases, and in the third case, it would require a system change worldwide at Panalpina. The visual management suggestion was more easily implemented at the Gothenburg office, and by launching it together with the new customer offer, which facilitates the invoicing process; the researchers beliefs were that they would achieve the desired effect.
A further recommendation for the company regarding the incorrect job costings is to keep a logbook, where the operators make a short notice on why each non-closed file was not closed. This in order to gather data on problems with non-closed files, and detect root causes to issues with file-closing.

76
Appendix G: Current state description of the process
FOS 7.4
E-file II (III to be launched in a few months)
Windows/Office XP/ 2003
Figure G.1 Current version of different softwares used at Ocean Import Department
This appendix is intended to give a short but detailed description of the process as it is working today. The main point is to serve as comparison for future comparisons as changes often occur gradually and it then is important to know which tools/methods/ways of working that already were in use when this project was executed.
Orders are received by e-mail to a group mail list that distribute one copy to each operator, things that not are connected to a specific operator is handled by one operator on a rotating schedule. Almost every e-mail from a PA office is received to the group mail to ensure that everyone receives the information ant that nothing is missed out. The initial e-mail that confirms a booking is printed and thereby initiating the physical file. Frequent customers have a specific operator (~88 % of total number of shipments) that handles all their shipments (or two operators if it is a very big customer), non-frequent of first time customers are called 1-2-3-4 and handed out evenly (each operator receives one out of four) since they are considered harder to handle and take much time. For all regular customers there is a SOP stating how to handle the shipment.
If shipment is accepted by receiver PA at the origin is advised to book according to MSPP. Upon request operator can retrieve rates for freight from GT Nexus. When cargo has disembarked from port PA Origin is responsible for sending B/L and internal invoice via E-file (although they sometimes are sent by e-mail and E-file)
When these files are received and printed one operator is responsible for registration of all shipments in FOS. FOS will then provide a cover sheet for the physical file where all printed documents are stored. At this time a first advice is sent to the receiver of the shipment
Incoming advices are sorted into a specific mail-box and one operator is responsible for updating Pantrace, FOS and Intrac according to these advices, from the time when the cargo has reached the port the other operators are responsible for updating their shipments in the tracking systems. For some new account information is transferred automatically from Pantrace to Intrac. Pantrace is reading information from the export file, so no update from the information entered in Gothenburg is possible.
All deconsolidation lists are created in Excel by one operator (same as registering the files) and then mailed to the warehouse, after stripping of container and sorting of goods the list is mailed back and the operator doing registrations spread printed copies to correlating physical files (located at each operators desk).
Transportören is used for most deliveries, although DHL also is frequently used. Bookings are done via their homepages. Customs declaration are either done by responsible operator

77
(KSD) or sent to an external company (ITS), for a minority of the shipments the final declaration is done by Panalpina, otherwise by external company or customer.
Approving of incoming invoices is mostly (~80-90 %) done by the operator with administrative task, using PRT
Jobcosting and invoicing is done in FOS, with required rate of exchange being received from GT Nexus or x-rates.com, costs can be retrieved from GT Nexus, customer specific offers, or in rare cases an ad-hoc quotation list. For the invoicing are templates used for the most frequent customers, each operator being responsible for keeping one´s own templates up to date.
After a file has been invoiced it is put in a big tickler file-box on wheels until it is confirmed to be closed, or an operator has to take any actions since it was re-opened or not even closed correctly. This is roughly done for 30 % of all files (estimated number).


