Download - Process improvement techniques
PROCESS ANALYSIS & IMPROVEMENT
TECHNIQUES
Simple Sustainable Solutions 1
Process Analysis & Improvement Techniques
Trainers:
Hakeem–Ur–Rehman
&
Sajid Mahmood
Simple Sustainable Solutions
Process Analysis & Improvement Techniques
Outline:
Simple Sustainable Solutions 2
Process Def.
Process Flow Diagram
o How to Draw?
o Value Added Vs Non–Value Added Activities
Process Analysis
o Bottleneck Analysis
o Productivity / Process Improvement through Line Balancing
Process FMEA
Hakeem-Ur-Rehman & Sajid Mahmood
Process Analysis & Improvement Techniques
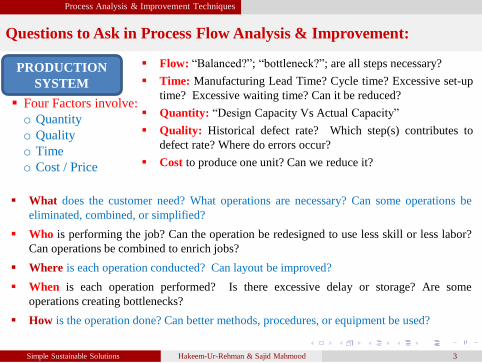
Questions to Ask in Process Flow Analysis & Improvement:
Simple Sustainable Solutions Hakeem-Ur-Rehman & Sajid Mahmood 3
PRODUCTION
SYSTEM
Four Factors involve:
o Quantity
o Quality
o Time
o Cost / Price
Flow: “Balanced?”; “bottleneck?”; are all steps necessary?
Time: Manufacturing Lead Time? Cycle time? Excessive set-up
time? Excessive waiting time? Can it be reduced?
Quantity: “Design Capacity Vs Actual Capacity”
Quality: Historical defect rate? Which step(s) contributes to
defect rate? Where do errors occur?
Cost to produce one unit? Can we reduce it?
What does the customer need? What operations are necessary? Can some operations be
eliminated, combined, or simplified?
Who is performing the job? Can the operation be redesigned to use less skill or less labor?
Can operations be combined to enrich jobs?
Where is each operation conducted? Can layout be improved?
When is each operation performed? Is there excessive delay or storage? Are some
operations creating bottlenecks?
How is the operation done? Can better methods, procedures, or equipment be used?
Process Analysis & Improvement Techniques
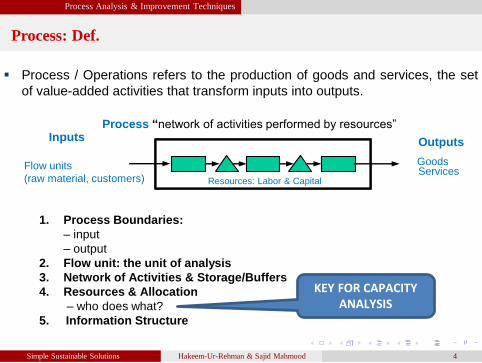
Process: Def.
Simple Sustainable Solutions Hakeem-Ur-Rehman & Sajid Mahmood 4
Process / Operations refers to the production of goods and services, the set
of value-added activities that transform inputs into outputs.
Inputs Outputs
GoodsServices
Resources Labor & Capital
Process “network of activities performed by resources”
Resources: Labor & Capital
Flow units
(raw material, customers)
1. Process Boundaries:
– input
– output
2. Flow unit: the unit of analysis
3. Network of Activities & Storage/Buffers
4. Resources & Allocation
– who does what?
5. Information Structure
KEY FOR CAPACITY ANALYSIS

Process Analysis & Improvement Techniques
Process Flow Diagram:
Simple Sustainable Solutions Hakeem-Ur-Rehman & Sajid Mahmood 5
Process flow diagram is that uses graphic symbols to represent the nature
and flow of the steps in a process / system.
FEW SYMBOLS USED IN FLOW DIAGRAM
Process Symbol
“An Operation or Action step”
Terminator Symbol
“Start or Stop Point in a process”
Inventory / Buffer
“Raw Material / Finished
Goods Storage”
Inventory / Buffer
“Partial Finished Goods
“Work In Process” Storage”
Flow Line
Decision Point
Process Analysis & Improvement Techniques
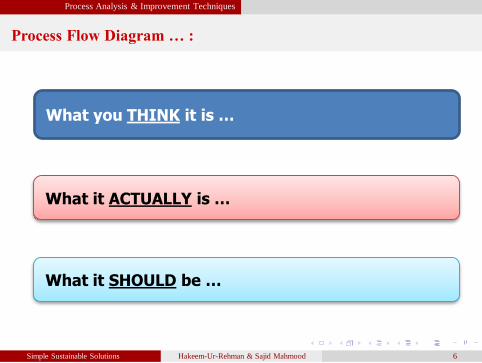
Process Flow Diagram … :
Simple Sustainable Solutions Hakeem-Ur-Rehman & Sajid Mahmood 6
What you THINK it is …
What it ACTUALLY is …
What it SHOULD be …
Process Analysis & Improvement Techniques
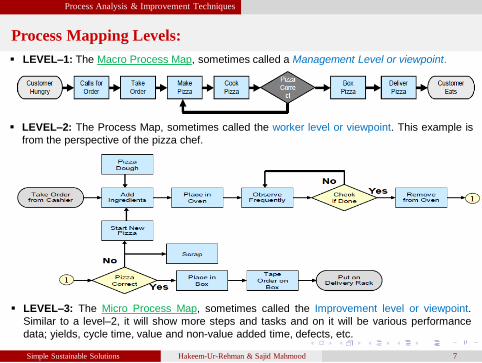
Process Mapping Levels:
Simple Sustainable Solutions Hakeem-Ur-Rehman & Sajid Mahmood 7
LEVEL–1: The Macro Process Map, sometimes called a Management Level or viewpoint.
LEVEL–2: The Process Map, sometimes called the worker level or viewpoint. This example is
from the perspective of the pizza chef.
LEVEL–3: The Micro Process Map, sometimes called the Improvement level or viewpoint.
Similar to a level–2, it will show more steps and tasks and on it will be various performance
data; yields, cycle time, value and non-value added time, defects, etc.
Process Analysis & Improvement Techniques
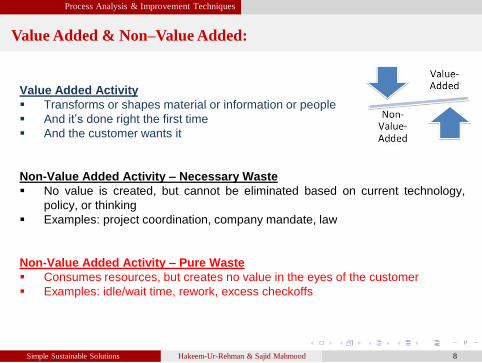
Value Added & Non–Value Added:
Simple Sustainable Solutions Hakeem-Ur-Rehman & Sajid Mahmood 8
Value Added Activity
Transforms or shapes material or information or people
And it’s done right the first time
And the customer wants it
Non-Value Added Activity – Necessary Waste
No value is created, but cannot be eliminated based on current technology,
policy, or thinking
Examples: project coordination, company mandate, law
Non-Value Added Activity – Pure Waste
Consumes resources, but creates no value in the eyes of the customer
Examples: idle/wait time, rework, excess checkoffs
Process Analysis & Improvement Techniques
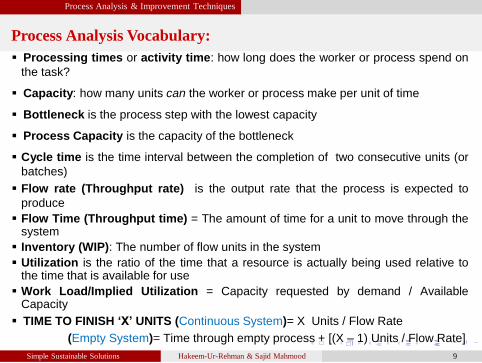
Process Analysis Vocabulary:
Simple Sustainable Solutions Hakeem-Ur-Rehman & Sajid Mahmood 9
Processing times or activity time: how long does the worker or process spend on
the task?
Capacity: how many units can the worker or process make per unit of time
Bottleneck is the process step with the lowest capacity
Process Capacity is the capacity of the bottleneck
Cycle time is the time interval between the completion of two consecutive units (or
batches)
Flow rate (Throughput rate) is the output rate that the process is expected to
produce
Flow Time (Throughput time) = The amount of time for a unit to move through thesystem
Inventory (WIP): The number of flow units in the system
Utilization is the ratio of the time that a resource is actually being used relative tothe time that is available for use
Work Load/Implied Utilization = Capacity requested by demand / AvailableCapacity
TIME TO FINISH ‘X’ UNITS (Continuous System)= X Units / Flow Rate
(Empty System)= Time through empty process + [(X – 1) Units / Flow Rate]
Process Analysis & Improvement Techniques
Process Analysis Vocabulary… :
Simple Sustainable Solutions Hakeem-Ur-Rehman & Sajid Mahmood 10
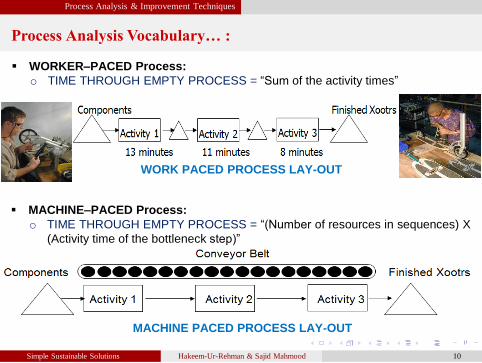
WORKER–PACED Process:
o TIME THROUGH EMPTY PROCESS = “Sum of the activity times”
WORK PACED PROCESS LAY-OUT
MACHINE PACED PROCESS LAY-OUT
MACHINE–PACED Process:
o TIME THROUGH EMPTY PROCESS = “(Number of resources in sequences) X
(Activity time of the bottleneck step)”
Process Analysis & Improvement Techniques
Process Analysis Vocabulary… :
Simple Sustainable Solutions Hakeem-Ur-Rehman & Sajid Mahmood 11
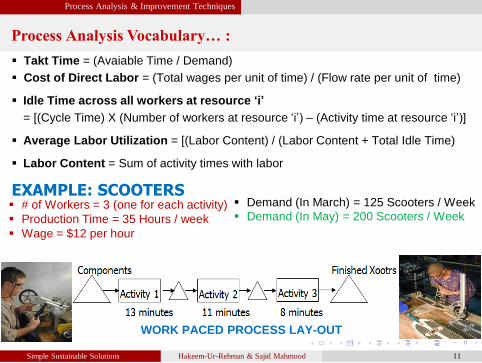
Takt Time = (Avaiable Time / Demand)
Cost of Direct Labor = (Total wages per unit of time) / (Flow rate per unit of time)
Idle Time across all workers at resource ‘i’
= [(Cycle Time) X (Number of workers at resource ‘i’) – (Activity time at resource ‘i’)]
Average Labor Utilization = [(Labor Content) / (Labor Content + Total Idle Time)
Labor Content = Sum of activity times with labor
EXAMPLE: SCOOTERS # of Workers = 3 (one for each activity)
Production Time = 35 Hours / week
Wage = $12 per hour
Demand (In March) = 125 Scooters / Week
Demand (In May) = 200 Scooters / Week
WORK PACED PROCESS LAY-OUT

Process Analysis & Improvement Techniques
Process Analysis – Example … :
Simple Sustainable Solutions Hakeem-Ur-Rehman 11
TASKS Task Duration
(SEC. / UNIT)
TASKS Task Duration
(SEC. / UNIT)
WORKER – 1:
1: Prepare cable 30
14: Trim and cap cable 59
2: Move cable 25 15: Place first rib 33
3: Assemble washer 100 16: Insert axles and cleats 96
4: Apply fork, threading cable end 66 17: Insert rear wheel 135
5: Assemble Socket head screws 114 18: Place second rib and deck 84
6: Steer pin nut 49 19: Apply grip tape 56
7: Brake shoe, spring, pivot bolt 66 20: Insert deck fasteners 75
TOTAL: 648
8: Insert front wheel 100 WORKER – 3:
21: Inspect and wipe-off 95
9: Insert axle bolt 30 22: Apply decal and sticker 20
10: Tighten axle bolt 43 23: Insert in bag 43
11: Tighten brake pivot bolt 51 24: Assemble carton 114
12: Assemble handle-cap 118
TOTAL: 792
25: Insert Xootr and manual 94
WORKER – 2:
13: Assemble brake lever and cable 110
26: Seal carton 84
TOTAL: 450

Process Analysis & Improvement Techniques
Process Analysis – Example … :
Simple Sustainable Solutions Hakeem-Ur-Rehman & Sajid Mahmood 13
Worker–1 Worker–2 Worker–3
Activity Time 13 min. / Unit 11 min. / Unit 8 min. / Unit
Capacity 1/13 Unit/min.
= 4.61 Units/hour
1/11 Unit/min.
= 5.45 Units/hour
1/8 Unit/min.
= 7.5 Units/hour
Process Capacity Capacity of the bottleneck resource = 4.61 Units / hour
Flow Rate Demand = 125 Units / Week = 125 / 35 hours = 3.57 Units / hour
= Min{Demand, Process Capacity} = 3.57 Units / hour
Cycle Time (1/3.57) hours / Unit = 16.8 Minutes / Unit
Idle Time 16.8 – 13 =
3.8 minutes / Unit
16.8 – 11 =
5.8 minutes / Unit
16.8 – 8 =
8.8 minutes / Unit
Utilization 3.57/4.61 = 77% 3.57/5.45 = 65.5% 3.57/7.5 = 47.6%
Cost of Direct Labor =(3 X $12/h X 35h/W) / 125 S/week = $10.08 / Scooter
Average Labor Utilization =(32 min. / Unit) / {(32 min. / Unit) + (18.4 min. / Unit)} = 63.4%
WHEN DEMAND (IN MARCH) IS = 125 UNITS / WEEK
Process Analysis & Improvement Techniques
Process Analysis – Example … :
Simple Sustainable Solutions Hakeem-Ur-Rehman & Sajid Mahmood 14
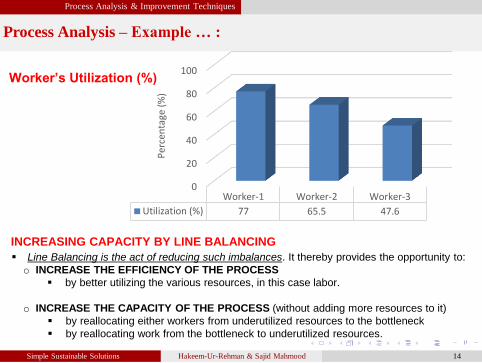
INCREASING CAPACITY BY LINE BALANCING
Line Balancing is the act of reducing such imbalances. It thereby provides the opportunity to:
o INCREASE THE EFFICIENCY OF THE PROCESS
by better utilizing the various resources, in this case labor.
o INCREASE THE CAPACITY OF THE PROCESS (without adding more resources to it)
by reallocating either workers from underutilized resources to the bottleneck
by reallocating work from the bottleneck to underutilized resources.
0
20
40
60
80
100
Worker-1 Worker-2 Worker-3
Utilization (%) 77 65.5 47.6
Per
cen
tage
(%
)
Worker’s Utilization (%)
Process Analysis & Improvement Techniques
Process Analysis – Example … :
Simple Sustainable Solutions Hakeem-Ur-Rehman & Sajid Mahmood 15
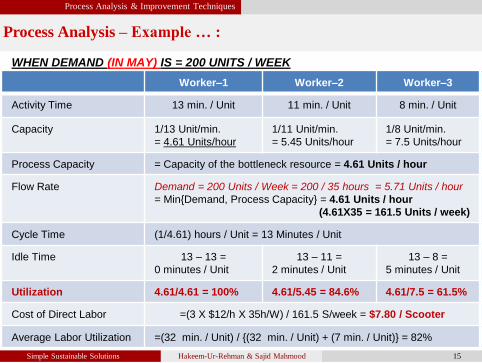
WHEN DEMAND (IN MAY) IS = 200 UNITS / WEEK
Worker–1 Worker–2 Worker–3
Activity Time 13 min. / Unit 11 min. / Unit 8 min. / Unit
Capacity 1/13 Unit/min.
= 4.61 Units/hour
1/11 Unit/min.
= 5.45 Units/hour
1/8 Unit/min.
= 7.5 Units/hour
Process Capacity = Capacity of the bottleneck resource = 4.61 Units / hour
Flow Rate Demand = 200 Units / Week = 200 / 35 hours = 5.71 Units / hour
= Min{Demand, Process Capacity} = 4.61 Units / hour
(4.61X35 = 161.5 Units / week)
Cycle Time (1/4.61) hours / Unit = 13 Minutes / Unit
Idle Time 13 – 13 =
0 minutes / Unit
13 – 11 =
2 minutes / Unit
13 – 8 =
5 minutes / Unit
Utilization 4.61/4.61 = 100% 4.61/5.45 = 84.6% 4.61/7.5 = 61.5%
Cost of Direct Labor =(3 X $12/h X 35h/W) / 161.5 S/week = $7.80 / Scooter
Average Labor Utilization =(32 min. / Unit) / {(32 min. / Unit) + (7 min. / Unit)} = 82%
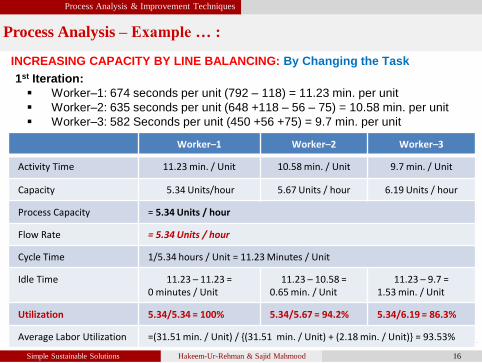
Process Analysis & Improvement Techniques
Process Analysis – Example … :
Simple Sustainable Solutions Hakeem-Ur-Rehman & Sajid Mahmood 16
INCREASING CAPACITY BY LINE BALANCING: By Changing the Task
1st Iteration:
Worker–1: 674 seconds per unit (792 – 118) = 11.23 min. per unit
Worker–2: 635 seconds per unit (648 +118 – 56 – 75) = 10.58 min. per unit
Worker–3: 582 Seconds per unit (450 +56 +75) = 9.7 min. per unit
Worker–1 Worker–2 Worker–3
Activity Time 11.23 min. / Unit 10.58 min. / Unit 9.7 min. / Unit
Capacity 5.34 Units/hour 5.67 Units / hour 6.19 Units / hour
Process Capacity = 5.34 Units / hour
Flow Rate = 5.34 Units / hour
Cycle Time 1/5.34 hours / Unit = 11.23 Minutes / Unit
Idle Time 11.23 – 11.23 = 0 minutes / Unit
11.23 – 10.58 = 0.65 min. / Unit
11.23 – 9.7 = 1.53 min. / Unit
Utilization 5.34/5.34 = 100% 5.34/5.67 = 94.2% 5.34/6.19 = 86.3%
Average Labor Utilization =(31.51 min. / Unit) / {(31.51 min. / Unit) + (2.18 min. / Unit)} = 93.53%

Process Analysis & Improvement Techniques
Process Analysis – Example … :
Simple Sustainable Solutions Hakeem-Ur-Rehman & Sajid Mahmood 17
2nd Iteration:
Worker–1: 623 seconds per unit (674 – 51) = 10.38 min. per unit
Worker–2: 602 seconds per unit (635 + 51 – 84) = 10.03 min. per unit
Worker–3: 665 Seconds per unit (581 + 84) = 11.08 min. per unit
Worker–1 Worker–2 Worker–3
Activity Time 10.38 min. / Unit 10.03 min. / Unit 11.08 min. / Unit
Capacity 5.78 Units/hour 5.98 Units / hour 5.41 Units / hour
Process Capacity = 5.41 Units / hour
Flow Rate = 5.41 Units / hour
Cycle Time 1/5.41hours / Unit = 11.08 Minutes / Unit
Idle Time 11.08 – 10.38 = 0.7 min. / Unit
11.08 – 10.03 = 1.05 min. / Unit
11.08 – 11.08 = 0 min. / Unit
Utilization 5.41/5.78 = 93.6% 5.41/5.98 = 90.5% 5.41/5.41 = 100%
Average Labor Utilization =(31.49 min. / Unit) / {(31.49 min. / Unit) + (1.75 min. / Unit)} = 94.7%
INCREASING CAPACITY BY LINE BALANCING: By Changing the Task …
Process Analysis & Improvement Techniques
Process Analysis – Example … :
Simple Sustainable Solutions Hakeem-Ur-Rehman & Sajid Mahmood 18
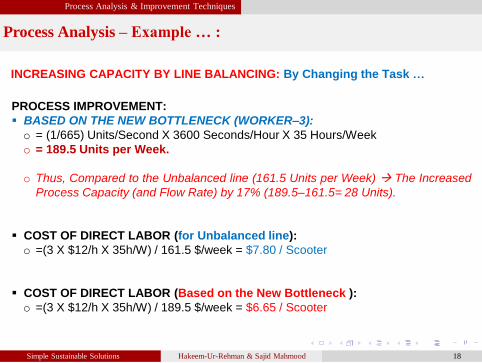
INCREASING CAPACITY BY LINE BALANCING: By Changing the Task …
PROCESS IMPROVEMENT:
BASED ON THE NEW BOTTLENECK (WORKER–3):
o = (1/665) Units/Second X 3600 Seconds/Hour X 35 Hours/Week
o = 189.5 Units per Week.
o Thus, Compared to the Unbalanced line (161.5 Units per Week) The Increased
Process Capacity (and Flow Rate) by 17% (189.5–161.5= 28 Units).
COST OF DIRECT LABOR (for Unbalanced line):
o =(3 X $12/h X 35h/W) / 161.5 $/week = $7.80 / Scooter
COST OF DIRECT LABOR (Based on the New Bottleneck ):
o =(3 X $12/h X 35h/W) / 189.5 $/week = $6.65 / Scooter
Process Analysis & Improvement Techniques
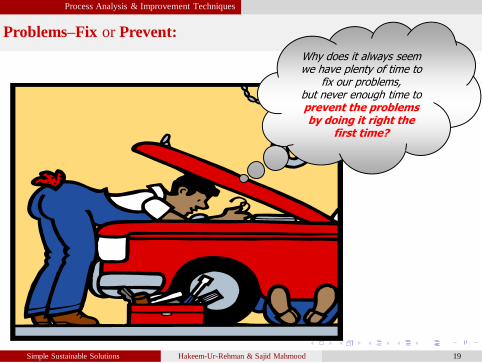
Problems–Fix or Prevent:
Simple Sustainable Solutions Hakeem-Ur-Rehman & Sajid Mahmood 19
Why does it always seem we have plenty of time to
fix our problems, but never enough time to prevent the problems by doing it right the
first time?

Process Analysis & Improvement Techniques
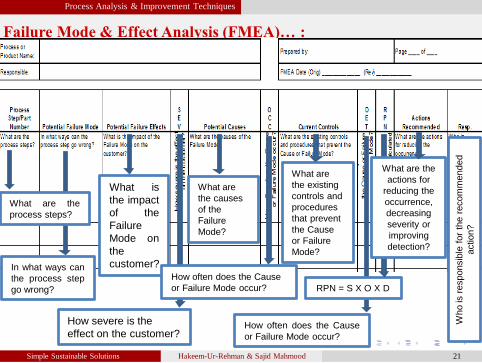
Failure Mode & Effect Analysis (FMEA):
Simple Sustainable Solutions Hakeem-Ur-Rehman & Sajid Mahmood 20
FMEA is an Engineering “Reliability Tool” That:
Helps define, identify, prioritize, and eliminate known and/or potential
failures of the system, design, or manufacturing process before they reach
the customer. The goal is to eliminate the Failure Modes and reduce their
risks.
What it can do for you!
1. Identifies Design or process related Failure Modes before they happen.
2. Determines the Effect & Severity of these failure modes.
3. Identifies the Causes and probability of Occurrence of the Failure Modes.
4. Identifies the Controls and their Effectiveness.
5. Quantifies and prioritizes the Risks associated with the Failure Modes.
6. Develops & documents Action Plans that will occur to reduce risk.
Process Analysis & Improvement Techniques
Failure Mode & Effect Analysis (FMEA)… :
Simple Sustainable Solutions Hakeem-Ur-Rehman & Sajid Mahmood 21
In what ways can
the process step
go wrong?
What is
the impact
of the
Failure
Mode on
the
customer?
How severe is the
effect on the customer?
What are
the causes
of the
Failure
Mode?
What are the
process steps?
What are
the existing
controls and
procedures
that prevent
the Cause
or Failure
Mode?
How often does the Cause
or Failure Mode occur?
How often does the Cause
or Failure Mode occur? RPN = S X O X D
What are the
actions for
reducing the
occurrence,
decreasing
severity or
improving
detection?
Who is
responsib
le f
or
the r
ecom
mended
action?
Process Analysis & Improvement Techniques
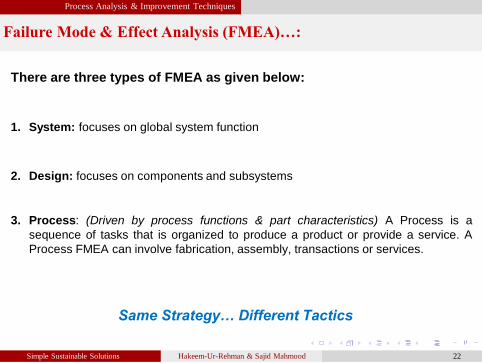
Failure Mode & Effect Analysis (FMEA)…:
Simple Sustainable Solutions Hakeem-Ur-Rehman & Sajid Mahmood 22
There are three types of FMEA as given below:
1. System: focuses on global system function
2. Design: focuses on components and subsystems
3. Process: (Driven by process functions & part characteristics) A Process is a
sequence of tasks that is organized to produce a product or provide a service. A
Process FMEA can involve fabrication, assembly, transactions or services.
Same Strategy… Different Tactics
Process Analysis & Improvement Techniques
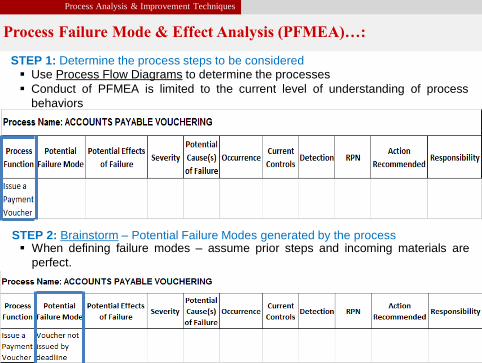
Process Failure Mode & Effect Analysis (PFMEA)…:
Simple Sustainable Solutions Hakeem-Ur-Rehman & Sajid Mahmood 22
STEP 1: Determine the process steps to be considered Use Process Flow Diagrams to determine the processes
Conduct of PFMEA is limited to the current level of understanding of process
behaviors
STEP 2: Brainstorm – Potential Failure Modes generated by the process When defining failure modes – assume prior steps and incoming materials are
perfect.
Process Analysis & Improvement Techniques
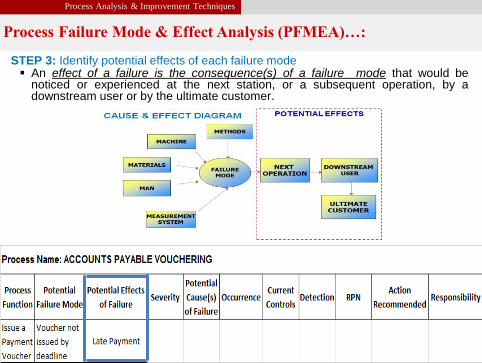
Process Failure Mode & Effect Analysis (PFMEA)…:
Simple Sustainable Solutions Hakeem-Ur-Rehman & Sajid Mahmood 23
STEP 3: Identify potential effects of each failure mode An effect of a failure is the consequence(s) of a failure mode that would be
noticed or experienced at the next station, or a subsequent operation, by adownstream user or by the ultimate customer.
Process Analysis & Improvement Techniques
Process Failure Mode & Effect Analysis (PFMEA)…:
Simple Sustainable Solutions Hakeem-Ur-Rehman & Sajid Mahmood 24
Process Analysis & Improvement Techniques
Process Failure Mode & Effect Analysis (PFMEA)…:
Simple Sustainable Solutions Hakeem-Ur-Rehman & Sajid Mahmood 25
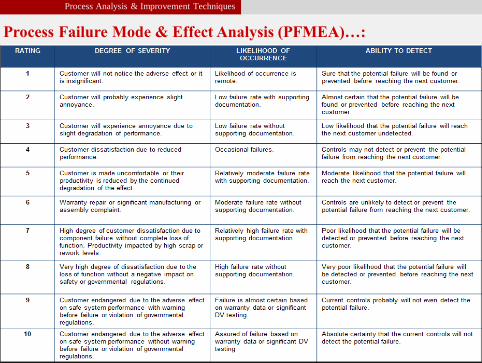
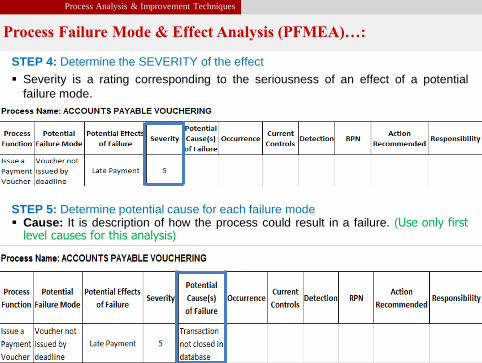
STEP 4: Determine the SEVERITY of the effect
Severity is a rating corresponding to the seriousness of an effect of a potential
failure mode.
STEP 5: Determine potential cause for each failure mode Cause: It is description of how the process could result in a failure. (Use only first
level causes for this analysis)

Process Analysis & Improvement Techniques
Process Failure Mode & Effect Analysis (PFMEA)…:
Simple Sustainable Solutions Hakeem-Ur-Rehman & Sajid Mahmood 26
Step 6: Rank the Occurrence of each Cause
The occurrence rating of each cause should reflect the relative occurrence of boththe failure and cause.
Step 7: Identify process controls currently used to DETECT the failure mode or
PREVENT the cause Detection is rating corresponding to the likelihood that current process will detect the
failure mode before it gets to the customer
Process Analysis & Improvement Techniques
Process Failure Mode & Effect Analysis (PFMEA)…:
Simple Sustainable Solutions Hakeem-Ur-Rehman & Sajid Mahmood 27
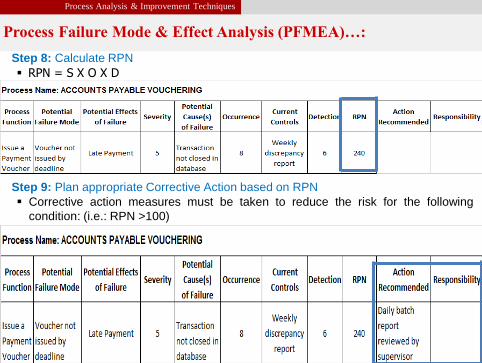
Step 8: Calculate RPN
RPN = S X O X D
Step 9: Plan appropriate Corrective Action based on RPN
Corrective action measures must be taken to reduce the risk for the following
condition: (i.e.: RPN >100)
Process Analysis & Improvement Techniques
Process Failure Mode & Effect Analysis (PFMEA)…:
Simple Sustainable Solutions Hakeem-Ur-Rehman & Sajid Mahmood 27
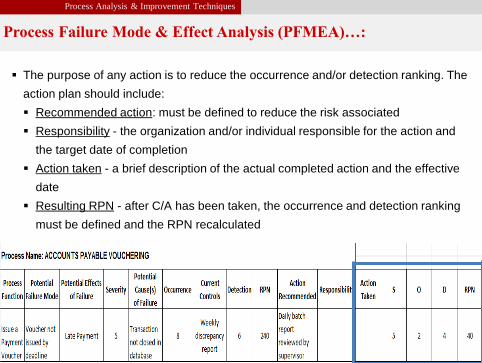
The purpose of any action is to reduce the occurrence and/or detection ranking. The
action plan should include:
Recommended action: must be defined to reduce the risk associated
Responsibility - the organization and/or individual responsible for the action and
the target date of completion
Action taken - a brief description of the actual completed action and the effective
date
Resulting RPN - after C/A has been taken, the occurrence and detection ranking
must be defined and the RPN recalculated
Hakeem-Ur-Rehman & Sajid Mahmood
Process Analysis & Improvement Techniques
Simple Sustainable Solutions 30
ANY QUESTION?
THANKS FOR LISTENING ()
Questions & Answers:


