
PROCESS INTENSIFICATION IN THE SYNTHESIS OF ORGANIC ESTERS:
KINETICS, SIMULATIONS AND PILOT PLANT EXPERIMENTS
By
Venkata Krishna Sai Pappu
A DISSERTATION
Submitted to
Michigan State University
in partial fulfillment of the requirements
for the degree of
DOCTOR OF PHILOSOPHY
Chemical Engineering
2012

ABSTRACT
PROCESS INTENSIFICATION IN THE SYNTHESIS OF ORGANIC ESTERS:
KINETICS, SIMULATIONS AND PILOT PLANT EXPERIMENTS
By
Venkata Krishna Sai Pappu
Organic esters are commercially important bulk chemicals used in a gamut of industrial
applications. Traditional routes for the synthesis of esters are energy intensive, involving
repeated steps of reaction typically followed by distillation, signifying the need for process
intensification (PI). This study focuses on the evaluation of PI concepts such as reactive
distillation (RD) and distillation with external side reactors in the production of organic acid
ester via esterification or transesterification reactions catalyzed by solid acid catalysts.
Integration of reaction and separation in one column using RD is a classic example of PI
in chemical process development. Indirect hydration of cyclohexene to produce cyclohexanol via
esterification with acetic acid was chosen to demonstrate the benefits of applying PI principles in
RD. In this work, chemical equilibrium and reaction kinetics were measured using batch reactors
for Amberlyst 70 catalyzed esterification of acetic acid with cyclohexene to give cyclohexyl
acetate. A kinetic model that can be used in modeling reactive distillation processes was
developed. The kinetic equations are written in terms of activities, with activity coefficients
calculated using the NRTL model. Heat of reaction obtained from experiments is compared to
predicted heat which is calculated using standard thermodynamic data. The effect of cyclohexene
dimerization and initial water concentration on the activity of heterogeneous catalyst is also
discussed.
Continuous pilot scale reactive distillation runs were conducted to demonstrate the
technical feasibility of cyclohexyl acetate formation and to exemplify the opportunities for heat

integration in RD operation. Based on these preliminary runs, process configurations and
conditions suitable for high conversions of cyclohexene are suggested. The experimental data
obtained at steady state are compared with results obtained from simulations performed using the
RADFRAC column module in Aspen Plus.
The concept of distillation with an external side reactor was evaluated in a process
involving the transesterification of methyl stearate and 1-butanol, yielding butyl stearate. An
activity-based kinetic model for this reaction using Amberlyst™ 15 as catalyst was developed.
The kinetic model includes etherification reactions occurring at reaction temperatures greater
than 90°C, producing butyl methyl ether and dibutyl ether. Kinetic parameters from this
database were used in modeling the distillation column with external side reactors. Process
simulation using Aspen Plus describes column performance as a function of operating
conditions, number of side reactors utilized, requirement for a pre-reactor, location of side draws
and re-entry points in the column. The column configuration that maximizes conversion of the
methyl ester to its butyl counterpart is presented.
In addition to evaluation of the PI concepts, using butyric acid as a model compound, the
effect of factors such as alcohol carbon chain length and type of solid acid catalyst on
esterification reaction rate was investigated.
In summary, advanced process concepts for continuous production of organic esters have
been examined. Chemical kinetic data from laboratory scale experiments has been used in
developing computational models of these concepts using Aspen Plus. The combination of
process simulations and pilot-plant experiments have identified process configurations and
conditions that lead to more efficient organic esters production with potential commercial
interest.

iv
ACKNOWLEDGEMENTS
I would like to thank Dr. Dennis J. Miller for being a great teacher and a patient mentor
throughout my Ph. D. Special thanks to Dr. Carl T. Lira for his advice and support. I also wish
to thank Dr. James E. Jackson, Dr. Ramani Narayan and Dr. Wei Liao for serving on my
committee. I would like to thank Dr. John Prindle of Tulane University for his help with process
simulations.
I wish to extend my gratitude for financial support by the U.S. Department of Energy’s
(DOE’s) Office of Energy Efficiency and Renewable Energy (EERE) through the Industrial
Technology Programs (DOE Contract No. DE-AC02-06CH11357) and also the U.S. Department
of Energy Freedom Car Program (Award #DE-FC2607NT42378) administered through the
National Energy Technology Laboratory in Morgantown, West Virginia.
Special thanks to Dr. Lars Peereboom for his help and support. Thanks to Dr. Aspi Kolah
for working with me on the reactive distillation unit. Thanks to Dr. Alvaro Orjuela, Dr. Abu
Hassan, Dr. Xi Hong, Aaron Oberg, Tyler Jordison, Arathi Santanakrishnan and Annie Lown for
being friendly and helpful lab mates. Also, I thank undergraduate students Omar Mcgiveron,
Victor Kanyi , Abraham Yanez, Evan Muller and Alex Smith for their assistance. I want to
extend my appreciation to William Andres Chasoy Rojas and Fernando Lenis for working with
me on pilot plant runs.
v
TABLE OF CONTENTS
LIST OF TABLES ....................................................................................................................... viii
LIST OF FIGURES ........................................................................................................................ x
KEY TO SYMBOLS AND ABBREVIATIONS ........................................................................ xxi
Chapter 1: Introduction ................................................................................................................... 1 1.1.ADVANCED PI TECHNIQUES ................................................................................................... 2
1.1.1. Reactive Distillation ...................................................................................................... 2 1.1.2. Distillation with external side reactor (DSR) ................................................................ 6
1.2.RESEARCH APPROACH AND OUTLINE ..................................................................................... 7 1.2.1. Cyclohexyl acetate – an intermediate in cyclohexanol production .............................. 8 1.2.2. Butyl stearate – a model compound for potential biodiesel constituents .................... 11 1.2.3. Butyric acid esterification: The effect of alcohol carbon chain length and type of
catalyst on the rate of esterification reaction ........................................................................ 12 1.3. REFERENCES .................................................................................................................. 14
Chapter 2: Cyclohexyl acetate production from cyclohexene and acetic acid: Reaction kinetics
and chemical equilibrium .............................................................................................................. 19 2.1. SUMMARY ........................................................................................................................... 19 2.2. INTRODUCTION ................................................................................................................... 19 2.3. MATERIALS AND METHODS ................................................................................................ 22 2.4. RESULTS AND DISCUSSION .................................................................................................. 24
2.4.1. Reaction studies .......................................................................................................... 24 2.4.2. Pseudo-Homogeneous (PH) kinetic model ................................................................. 28 2.4.3. Kinetic model comparison with experiments ............................................................. 31 2.4.4. Effect of cyclohexene dimerization on activity of Amberlyst 70 ............................... 35 2.4.5. Effect of water on the activity of Amberlyst 70 ......................................................... 37
2.5. CONCLUSION ....................................................................................................................... 39 2.6. APPENDIX A ........................................................................................................................ 42 2.7. REFERENCES ....................................................................................................................... 69
Chapter 3: Cyclohexyl acetate production using reactive distillation: Pilot plant experiments and
simulations .................................................................................................................................... 72 3.1. SUMMARY ........................................................................................................................... 72 3.2. INTRODUCTION ................................................................................................................... 72 3.3. MATERIALS AND METHODS ................................................................................................ 74

vi
3.3.1 Reactive distillation column configuration and operating procedure .......................... 75 3.4. RESULTS AND DISCUSSION .................................................................................................. 80
3.4.1. Heat Integration Runs ................................................................................................. 82 3.4.2. Energy balance for Runs 9a & 9b ............................................................................... 83 3.4.3. Simulation of RD column ........................................................................................... 87 3.4.4. Comparison of simulation and experimental results ................................................... 89 3.4.5. Effect of feed stage on CHE conversion ..................................................................... 93 3.4.6. Effect of heat loss on CHE conversion ....................................................................... 94 3.4.7. Effect of heat addition on CHE conversion ................................................................ 95 3.4.8. Effect of heat transfer between catalytic sections ....................................................... 95
3.5. CONCLUSIONS ..................................................................................................................... 97 3.6. APPENDIX B ........................................................................................................................ 99 3.7. REFERENCES ..................................................................................................................... 103
Chapter 4: A Kinetic Model of the Amberlyst-15 Catalyzed Transesterification of Methyl
Stearate with n-Butanol............................................................................................................... 105 4.1. SUMMARY ......................................................................................................................... 105 4.2. INTRODUCTION ................................................................................................................. 105 4.3. MATERIALS AND METHODS ............................................................................................... 107
4.3.1. Materials ................................................................................................................... 107 4.3.2. Reactors ..................................................................................................................... 107 4.3.3. Procedure .................................................................................................................. 108 4.3.4. Analysis ..................................................................................................................... 108
4.4. RESULTS AND DISCUSSION ................................................................................................ 109 4.4.1. Experimental evaluation of mass transfer resistances ............................................... 109 4.4.2. Kinetic model ............................................................................................................ 111 4.4.3. Results ....................................................................................................................... 117 4.4.4. Discussion ................................................................................................................. 123
4.5. CONCLUSION ..................................................................................................................... 125 4.6. APPENDIX C ...................................................................................................................... 127 4.7. REFERENCES ..................................................................................................................... 141
Chapter 5: Butyl stearate production using distillation column with external side reactors:
Process concept, simulation and analysis ................................................................................... 143 5.1. SUMMARY ......................................................................................................................... 143 5.2. INTRODUCTION ................................................................................................................. 143 5.3. DISTILLATION WITH EXTERNAL SIDE REACTOR CONCEPT (D-SRC) ................................... 145
5.3.1. MS transesterification reaction ................................................................................. 148 5.3.2. Boiling point ranking ................................................................................................ 148 5.3.3. Simulation methodology ........................................................................................... 149
5.4. RESULTS ........................................................................................................................... 153 5.4.1. Cases 1&2: Three PFRs in series .............................................................................. 153 5.4.2. Cases 3: Distillation with three external reactors...................................................... 155 5.4.3. Case 4: Distillation with two external reactors and pre-reactor ................................ 155
5.5. CONCLUSION ..................................................................................................................... 158

vii
5.6. REFERENCES ..................................................................................................................... 160
Chapter 6: Butyric acid esterification over solid acid catalysts: The effect of alcohol carbon chain
length and a kinetic model for Amberlyst 70 catalyzed esterification with 2-ethylhexanol ...... 162 6.1. SUMMARY ......................................................................................................................... 162 6.2. INTRODUCTION ................................................................................................................. 162 6.3. MATERIALS AND METHODS .............................................................................................. 164
6.3.1. Preparation of 4-Heptanol ......................................................................................... 165 6.3.2. Preparation of 2-ethylhexyl butyrate (2-EHB) ......................................................... 165 6.3.3. Batch experiments ..................................................................................................... 165 6.3.4. Sample analysis ......................................................................................................... 166
6.4. RESULTS AND DISCUSSION ................................................................................................ 167 6.4.1. Esterification of BA with different alcohols ............................................................. 167 6.4.2. BA esterification kinetics with 2-EHA ..................................................................... 171 6.4.3. Kinetic model for Amberlyst 70-catalyzed and auto-catalyzed esterification .......... 175 6.4.4. Effect of butyrate esters on biodiesel cloud point ..................................................... 177
6.5. CONCLUSIONS ................................................................................................................... 178 6.6. APPENDIX D ...................................................................................................................... 181 6.7. REFERENCES ..................................................................................................................... 207
Chapter 7: Conclusions, significance and recommendations for future work ............................ 210 7.1. REACTIVE DISTILLATION IN CYCLOHEXYL ACETATE PRODUCTION .................................... 210 7.2. DISTILLATION WITH SIDE REACTOR CONCEPT EVALUATION .............................................. 212 7.3. BUTYRIC ACID ESTERIFICATION WITH A SERIES OF ALCOHOLS .......................................... 213
viii
LIST OF TABLES
Table 2.1a: Standard Enthalpies and Standard Gibbs Energies of Formation (1 atm, 298K) ...... 28
Table 2.1b: Standard Enthalpies and Standard Gibbs Energies of Reaction at 298K .................. 28
Table 2.2: Summary of reaction kinetic parameters ..................................................................... 31
Table A.2a: Component molecular weight and density information ............................................ 43
Table A.2b: Component individual weight and volume measurement ......................................... 44
Table A.3.1 Summary of batch experiments with Amberlyst 70 as catalyst ................................ 45
Table A.6.2: NRTL parameters used in Aspen simulationsa ........................................................ 67
Table 3.1: Characteristics of pilot plant reactive distillation column ........................................... 78
Table 3.2: Summary of reaction conditions in pilot plant runs..................................................... 84
Table 3.3a: Energy balance from experimental material balance ................................................. 85
Table 3.3b: Energy balance from ideal material balance .............................................................. 85
Table 3.4a: Ideal vs. Experimental material balance for Run 9a .................................................. 86
Table 3.4b: Ideal vs. Experimental material balance for Run 9b .................................................. 86
Table 3.5: RD column parameters used in process simulations ................................................... 87
Table 3.6: Modified kinetic parameters used in process simulations ........................................... 88

ix
Table B.1.1: Reboiler duty calculation ......................................................................................... 99
Table B.2.1: Condenser duty calculation .................................................................................... 100
Table B.3.1: Standard heat of formation from DIPPR database ................................................. 101
Table 4.1: Kinetic model parameters ......................................................................................... 116
Table 4.2: Summary of experimental conditions and calculated mole fraction differences for MS
..................................................................................................................................................... 117
Table 4.3: Comparison of transesterification forward rate constants at 363 K .......................... 124
Table C.2.1: UNIFAC group identification of the components.................................................. 131
Table C.2.2: UNIFAC group interaction parameters .................................................................. 132
Table C.3.1: Summary of experimental conditions and calculated errors .................................. 133
Table 5.1: Simulation results for cases 1 and 2. ......................................................................... 154
Table 5.2a: Simulation results for cases 3 and 4. ........................................................................ 155
Table 5.2b:Column properties and conditions from simulation of Cases 3 and 4. ..................... 157
Table 6.1: Optimized kinetic model parameters with 95% confidence limits ............................ 178
Table D.1.1: Data for Figure D.1.2 determined from kinetic rate measurements in this work and
corresponding steric substituent constants taken from Newman [26]. ....................................... 183
Table D.4.1: Summary of experiments and reaction conditions ................................................. 186

x
LIST OF FIGURES
Figure 1.1: Principle of the choice of equipment from Schoenmakers et al.[27]. For interpretation
of the references to color in this and all other figures, the reader is referred to the electronic
version of this dissertation. ............................................................................................................. 4
Figure 1.2: An outline of research approach. .................................................................................. 8
Figure 1.3: Major production routes for cyclohexanol and its end uses ....................................... 10
Figure 2.1: Reaction network for cyclohexanol production from cyclohexene............................ 20
Figure 2.2: Cyclohexene esterification with acetic acid ............................................................... 22
Figure 2.3: Effect of catalyst loading on initial cyclohexene esterification rate. Reaction
conditions: Temperature: 363 K, Initial mole ratio CHE:AA = 1:3. ............................................ 25
Figure 2.4: Chemical equilibrium constant Ka (▲) and the best fit of experimental data (solid
line), compared with estimation based on Eq. (2.2) and thermodynamic data (dashed line). (■) -
Ka for Runs 30-33. ........................................................................................................................ 27
Figure 2.5: Experimental and predicted mole fraction profiles of CHE esterification. (▲)- AA;
(×)- CHA; (■)- CHE; (♦)- CHX. Continuous lines represent the predicted mole fraction profiles.
a) Run 16: Temperature 373 K; initial mole ratio CHE:AA = 1:3; CHE:CHX = 5:1; catalyst
loading 0.02 kgcat/kg soln. b) Run 17: Temperature 383 K; initial mole ratio CHE:AA = 1:3;
CHE:CHX = 5:1; catalyst loading 0.02 kgcat/kg soln. c) Run 18: Temperature 393 K; initial
mole ratio CHE:AA = 1:3; CHE:CHX = 5:1; catalyst loading 0.02 kgcat/kg soln. ..................... 32
Figure 2.6: Experimental and predicted mole fraction profiles of CHE esterification. (▲)- AA;
(×)- CHA; (■)- CHE; Continuous lines represent the predicted mole fraction profiles. a) Run 9:
Temperature 363 K; initial mole ratio CHE:AA = 1:1; catalyst loading 0.02 kgcat/kg soln. b)
Run 10: Temperature 363 K; initial mole ratio CHE:AA = 1:3; catalyst loading 0.02 kgcat/kg
soln. c) Run 11: Temperature 363 K; initial mole ratio CHE:AA = 1:5; catalyst loading 0.02
kgcat/kg soln. ................................................................................................................................ 34

xi
Figure 2.7: Cyclohexene dimer formation during esterification reaction. Straight line represents
the best fit for side product formation. (■) Acetic acid; (▲) Cyclohexyl acetate; (♦)
Cyclohexene;(×) Cyclohexene dimer. Reaction conditions: Temperature 403 K, Initial mole
ratio CHE to AA = 3:1 and catalyst loading 0.02 kgcat/kg soln................................................... 36
Figure 2.8: Effect of initial water concentration on reaction rate. Reaction conditions:
Temperature 363 K, Initial mole ratio CHE to AA = 1:1 and catalyst loading 0.02 kg cat/kg soln.
....................................................................................................................................................... 39
Figure A.1a: Effect of agitation speed on reaction rate. (□)-400 rpm; (×)-550 rpm; (∆)-800 rpm;
(▲)-1160 rpm; Reaction conditions: Temperature 363 K; initial mole ratio CHE:AA = 1:1;
catalyst loading 0.02 kgcat/kg soln. .............................................................................................. 42
Figure A.1b: Effect of catalyst particle size on reaction rate. (▲)-dp<150μm; (■)-
250<dp<590μm; (□)-dp>590μm. Reaction conditions: Temperature 363 K; initial mole ratio
CHE :AA = 1:1; catalyst loading 0.02 kgcat/kg soln. .................................................................. 43
Figure A.2: Parity plot for verification of additivity of volumes assumption .............................. 44
Figure A.3.1: Experimental and predicted mole fraction profiles of CHE esterification for Run1.
(▲)- AA; (×)- CHA; (■)- CHE. ................................................................................................... 47
Figure A.3.2: Experimental and predicted mole fraction profiles of CHE esterification for Run 2.
(▲)- AA; (×)- CHA; (■)- CHE. ................................................................................................... 47
Figure A.3.3: Experimental and predicted mole fraction profiles of CHE esterification for Run 3.
(▲)- AA; (×)- CHA; (■)- CHE. ................................................................................................... 48
Figure A.3.4: Experimental and predicted mole fraction profiles of CHE esterification for Run 4.
(▲)- AA; (×)- CHA; (■)- CHE. ................................................................................................... 48
Figure A.3.5: Experimental and predicted mole fraction profiles of CHE esterification for Run 5.
(▲)- AA; (×)- CHA; (■)- CHE. ................................................................................................... 49
Figure A.3.6: Experimental and predicted mole fraction profiles of CHE esterification for Run 6.
(▲)- AA; (×)- CHA; (■)- CHE. ................................................................................................... 49

xii
Figure A.3.7: Experimental and predicted mole fraction profiles of CHE esterification for Run 7.
(▲)- AA; (×)- CHA; (■)- CHE. ................................................................................................... 50
Figure A.3.8: Experimental and predicted mole fraction profiles of CHE esterification for Run 8.
(▲)- AA; (×)- CHA; (■)- CHE. ................................................................................................... 50
Figure A.3.9: Experimental and predicted mole fraction profiles of CHE esterification for Run
12. (▲)- AA; (×)- CHA; (■)- CHE. ............................................................................................. 51
Figure A.3.10: Experimental and predicted mole fraction profiles of CHE esterification for Run
13. (▲)- AA; (×)- CHA; (■)- CHE. ............................................................................................. 51
Figure A.3.11: Experimental and predicted mole fraction profiles of CHE esterification for Run
14. (▲)- AA; (×)- CHA; (■)- CHE. ............................................................................................. 52
Figure A.3.12: Experimental and predicted mole fraction profiles of CHE esterification for Run
15. (▲)- AA; (×)- CHA; (■)- CHE. ............................................................................................. 52
Figure A.3.13: Experimental and predicted mole fraction profiles of CHE esterification for Run
19. (▲)- AA; (×)- CHA; (■)- CHE. ............................................................................................. 53
Figure A.3.14: Experimental and predicted mole fraction profiles of CHE esterification for Run
20. (▲)- AA; (×)- CHA; (■)- CHE. ............................................................................................. 53
Figure A.3.15: Experimental and predicted mole fraction profiles of CHE esterification for Run
21. (▲)- AA; (×)- CHA; (■)- CHE. ............................................................................................. 54
Figure A.3.16: Experimental and predicted mole fraction profiles of CHE esterification for Run
22. (▲)- AA; (×)- CHA; (■)- CHE. ............................................................................................. 54
Figure A.3.17: Experimental and predicted mole fraction profiles of CHE esterification for Run
23. (▲)- AA; (×)- CHA; (■)- CHE. ............................................................................................. 55
Figure A.3.18: Experimental and predicted mole fraction profiles of CHE esterification for Run
24. (▲)- AA; (×)- CHA; (■)- CHE. ............................................................................................. 55
Figure A.3.19: Experimental and predicted mole fraction profiles of CHE esterification for Run
25. (▲)- AA; (×)- CHA; (■)- CHE. ............................................................................................. 56

xiii
Figure A.3.20: Experimental mole fraction profiles of CHE esterification for Run 26. (▲) CHA;
(■) AA; (♦) CHE;(×) CHE oligomers. Straight line represents the best fit for side product
formation. ...................................................................................................................................... 56
Figure A.3.21: Experimental mole fraction profiles of CHE esterification for Run 28. (▲) CHA;
(■) AA; (♦) CHE; (×) CHE oligomers. Straight line represents the best fit for side product
formation. ...................................................................................................................................... 57
Figure A.3.22: Experimental mole fraction profiles of CHE esterification for Run 29. (▲) CHA;
(■) AA; (♦) CHE; (×) CHE oligomers. Straight line represents the best fit for side product
formation. ...................................................................................................................................... 57
Figure A.3.23: Experimental mole fraction profiles for Run 30. (▲) AA; (■) CHA (♦) CHE. ... 58
Figure A.3.24: Experimental mole fraction profiles for Run 31. (▲) AA; (■) CHA (♦) CHE. ... 58
Figure A.3.25: Experimental mole fraction profiles for Run 32. (▲) AA; (■) CHA (♦) CHE. ... 59
Figure A.3.26: Experimental mole fraction profiles for Run 33. (▲) AA; (■) CHA (♦) CHE. ... 59
Figure A.4.1: Chromatogram for CHE dimer identification ......................................................... 60
Figure A.4.2: Mass spectra for 1-cyclohexyl cyclohexene ........................................................... 61
Figure A.4.3: Mass spectra for 3-cyclohexyl cyclohexene ........................................................... 62
Figure A.4.4: Mass spectra for 1,1’-oxybis cyclohexane ............................................................. 63
Figure A.5.1: calibration plot for Cyclohexene (CHE)................................................................. 65
Figure A.5.2: calibration plot for Acetic acid (AA)...................................................................... 65
Figure A.5.3: calibration plot for Cyclohexyl acetate (CHA) ...................................................... 66
Figure 3.1: A schematic of pilot scale RD column ....................................................................... 77
xiv
Figure 3.2: Temperature profile for Run 4.................................................................................... 82
Figure 3.3a: Temperature profile Run 9a. (♦)- Experimental; (■) – simulation assuming heat loss
on Stage 13; (▲) – simulation assuming heat loss uniformly across Stages 2-13. ...................... 91
Figure 3.3b: Composition profile of Run 9a. (×)-CHE; (♦)- CHE simulated; (□)- CHA; (■)- CHA
simulated; (∆)-AA; (▲)- AA simulated ....................................................................................... 91
Figure 3.4a: Temperature profile Run 9b. (♦)- Experimental; (■) – simulation. .......................... 92
Figure 3.4b: Composition profile of Run 9b. (×)-CHE; (♦)- CHE simulated; (□)- CHA; (■)- CHA
simulated; (∆)- AA; (▲)- AA simulated. ..................................................................................... 92
Figure 3.5: Effect of feed stage on CHE conversion for Run 9a. (♦)- Changing CHE feed stage
(■) – Changing AA feed stage ...................................................................................................... 93
Figure 3.6: Effect of heat loss on CHE conversion for Run 9a. ................................................... 94
Figure 3.7: Effect of heat addition to stages in catalytic section on CHE conversion for Run 9a.96
Figure 3.8: Effect of heat transfer between stages in catalytic section on CHE conversion for Run
9a. .................................................................................................................................................. 96
Figure 4.1. Effect of agitation speed on conversion rate of MS. Reaction conditions: BuOH:MS
molar feed ratio = 20:1; catalyst loading = 5.6 wt%; reaction temperature = 363 K. (□ - 300 rpm;
■ - 900 rpm; ▲ - 1060; × - 1230 rpm; + - 1460 rpm). .............................................................. 109
Figure 4.2. Effect of catalyst particle size on conversion rate of MS. Reaction conditions:
BuOH:MS molar feed ratio = 20:1; Amberlyst 15 catalyst loading = 5.6 wt% or equivalent of
10.25 meq H+; reaction temperature = 363 K. (□ - 60-250 µm; ■ -250-500 µm; ▲ - > 500 µm).
..................................................................................................................................................... 110
Figure 4.3a. Initial MS transesterification rate vs. catalyst loading (wt%). BuOH:MS molar feed
ratio = 20:1. (×) – 373 K; (■) – 363 K. Solid line represents best fit of the data. ..................... 119
Figure 4.3b. Effect of catalyst loading (wt%) on the conversion rate of MS. Reaction conditions:
BuOH:MS molar feed ratio = 20:1; reaction temperature = 363 K. (-■- - 5.6 wt%; -▲- - 2.8
wt%; -●- - 1.4 wt%). ................................................................................................................... 119
xv
Figure 4.4a. Mole fraction profiles of species present in MS transesterification reactions at 363
K. Reaction conditions: BuOH:MS molar feed ratio = 20:1; catalyst loading = 4.8 wt%. (-□- -
MS; -■- - BS; -▲- - MeOH; -×- - DBE; -+- - BME; -○- - W). .................................................. 121
Figure 4.4b. Mole fraction profiles of species present in MS transesterification reactions at 373
K. Reaction conditions: BuOH:MS molar feed ratio = 20:1; catalyst loading = 4.8 wt%; (-□- -
MS; -■- - BS; -▲- - MeOH; -×- - DBE; -+- - BME; -○- - W). .................................................. 121
Figure 4.5. Effect of temperature on the conversion rate of MS. Reaction conditions: BuOH:MS
molar feed ratio = 20:1; catalyst loading = 5.6 wt%. (×) –343 K ; (■) – 353 K; (▲) –363 K. .. 122
Figure 4.6. Effect of BuOH:MS molar feed ratio on MS conversion. Reaction conditions:
Temperature = 363 K; catalyst loading = 4.8 wt%. (-▲- - 5:1; -■- - 10:1; -×- - 20:1). ............. 123
Figure C.1.1: Calibration plot for Methyl stearate (MS) ............................................................ 128
Figure C.1.2: Calibration plot for 1-Butanol (BuOH) ............................................................... 128
Figure C.1.3: Calibration plot for Butyl stearate (BS) ............................................................... 129
Figure C.1.4: Calibration plot for Methanol (MeOH) ............................................................... 129
Figure C.1.5: Calibration plot for Dibutyl ether (DBE).............................................................. 130
Figure C.1.6.:Calibration plot for Butyl methyl ether (BME) .................................................... 130
Figure C.3.1: Mole fraction profiles of species present in MS transesterification reactions at
70°C. Reaction conditions: initial mole ratio MS to BuOH = 1:20; catalyst loading = 5.6 wt%;
(-□- -MS;-■- - BS;-▲- -MeOH;-×- -DBE;-+- -BME; -○- -W). ................................................. 134
Figure C.3.2: Mole fraction profiles of species present in MS transesterification reactions at
80oC. Reaction conditions: initial mole ratio MS to BuOH = 1:20; catalyst loading = 5.6 wt%;
(-□- -MS;-■- - BS;-▲- -MeOH;-×- -DBE;-+- -BME; -○- -W). ................................................. 134
Figure C.3.3: Mole fraction profiles of species present in MS transesterification reactions at
90oC. Reaction conditions: initial mole ratio MS to BuOH = 1:20; catalyst loading = 5.6 wt%;
(-□- -MS;-■- - BS;-▲- -MeOH;-×- -DBE;-+- -BME; -○- -W). ................................................. 135

xvi
Figure C.3.4: Mole fraction profiles of species present in MS transesterification reactions at
90oC. Reaction conditions: initial mole ratio MS to BuOH = 1:20; catalyst loading = 2.8 wt%;
(-□- -MS;-■- - BS;-▲- -MeOH;-×- -DBE;-+- -BME; -○- -W). ................................................. 135
Figure C.3.5: Mole fraction profiles of species present in MS transesterification reactions at
90oC. Reaction conditions: initial mole ratio MS to BuOH = 1:20; catalyst loading = 1.4 wt%;
(-□- -MS;-■- - BS;-▲- -MeOH;-×- -DBE;-+- -BME; -○- -W). ................................................. 136
Figure C.3.6: Mole fraction profiles of species present in MS transesterification reactions at
90oC. Reaction conditions: initial mole ratio MS to BuOH = 1:10; catalyst loading = 4.8 wt%;
(-□- -MS;-■- - BS;-▲- -MeOH;-×- -DBE;-+- -BME; -○- -W). ................................................. 136
Figure C.3.7: Mole fraction profiles of species present in MS transesterification reactions at
90oC. Reaction conditions: initial mole ratio MS to BuOH = 1:10; catalyst loading = 4.8 wt%;
(-□- -MS;-■- - BS;-▲- -MeOH;-×- -DBE;-+- -BME; -○- -W). ................................................. 137
Figure C.3.8: Mole fraction profiles of species present in MS transesterification reactions at
90oC. Reaction conditions: initial mole ratio MS to BuOH = 1:5; catalyst loading = 4.8 wt%;
(-□- -MS;-■- - BS;-▲- -MeOH;-×- -DBE;-+- -BME; -○- -W). ................................................. 137
Figure C.3.9: Mole fraction profiles of species present in MS transesterification reactions at
90oC. Reaction conditions: initial mole ratio MS to BuOH = 1:30; catalyst loading = 4.8 wt%;
(-□- -MS;-■- - BS;-▲- -MeOH;-×- -DBE;-+- -BME; -○- -W). ................................................. 138
Figure C.3.10: Mole fraction profiles of species present in MS transesterification reactions at
90oC. Reaction conditions: initial mole ratio MS to BuOH = 1:20; catalyst loading = 4.8 wt%
(-□- -MS;-■- - BS;-▲- -MeOH;-×- -DBE;-+- -BME; -○- -W). ................................................. 138
Figure C.3.11: Mole fraction profiles of species present in MS transesterification reactions at
100oC. Reaction conditions: initial mole ratio MS to BuOH = 1:20; catalyst loading = 2.8 wt%;
(-□- -MS;-■- - BS;-▲- -MeOH;-×- -DBE;-+- -BME; -○- -W). ................................................. 139
Figure C.3.12: Mole fraction profiles of species present in MS transesterification reactions at
100oC. Reaction conditions: initial mole ratio MS to BuOH = 1:20; catalyst loading = 5.6 wt%;
(-□- -MS;-■- - BS;-▲- -MeOH;-×- -DBE;-+- -BME; -○- -W). ................................................. 139
Figure 5.1: Schematic of distillation column with external side reactors and flow diagram for
Case 3. ......................................................................................................................................... 147
xvii
Figure 5.2: Simulation methodology for D-SRC evaluation. ..................................................... 150
Figure 5.3: Effect of reactor PFR reaction temperature on MS conversion and BuOH selectivity
towards BS. (■)- BS selectivity; (♦) - MS conversion. Reaction conditions: Feed mole ratio of
BuOH to MS = 2; Catalyst weight in reactor= 20 kg; Pressure = 3 atm. ................................... 153
Figure 5.4a: Flow diagram representing cases 1a and 1b. .......................................................... 154
Figure 5.4b: Flow diagram representing case 2. ......................................................................... 154
Figure 5.5: Flow diagram representing cases 4a, 4b and 4c. ...................................................... 156
Figure 6.1. Effect of increasing linear alcohol carbon number on esterification rate of butyric
acid. a) (TON); b) kTON (Eq.6.2). (■) – Amberlyst 70 ;(♦) - p-TSA; Reaction conditions: 3:1
alcohol:acid molar feed ratio, 0.01 kg cat/kg soln, 60°C. ........................................................... 169
Figure 6.2: Esterification rate of butyric acid with primary alcohols. (□) – Amberlyst 70;(◊) -
Amberlyst BD20; (○) – Amberlyst 15; (∆) - Amberlyst 36; Reaction conditions: 3:1 alcohol:acid
feed molar ratio, 0.01 kg cat/kg soln, 60°C. ............................................................................... 171
Figure 6.3: Initial BA esterification rate vs. catalyst loading; (♦)-120°C; (■)-130°C; Reaction
conditions: 2-EHA:BA feed molar ratio = 6:1. Solid lines represent best fit of the data. .......... 173
Figure 6.4: Mole fraction profiles of reaction components; (♦) – BA; (▲) – 2EHB; (×) – W;
Reaction conditions: 6:1 2-EHA:BA molar feed ratio, 0.01 kg cat/kg soln, 130°C. Continuous
lines represent predicted mole fraction profiles from kinetic model. ......................................... 176
Figure 6.5: Comparison of cloud points between canola biodiesel, #2 Diesel and canola
biodiesel with butyric acid esters. ............................................................................................... 178
Figure D.1.1: Verification of Taft Equation - polar effect; (◊) - p-TSA; (∆) -Amberlyst 70. ... 182
Figure D.1.2: Verification of Taft Equation (steric effect) catalyzed esterification of butyric acid
with linear alcohols; (♦) – p-TSA; (■) – Amberlyst 70. ............................................................. 183
Figure D.2.1: Effect of alcohol chain branching on butyric acid esterification rate. Reaction
conditions: 3:1 alcohol:BA feed molar ratio, 0.01 kg Amberlyst 70/kg soln, 60°C. .................. 184
xviii
Figure D.3.1: (a) Effect of agitation speed on conversion rate of butyric acid: (∆) -100rpm; (♦) -
530 rpm; (□) - 850 rpm. (b) Effect of catalyst particle size on conversion rate of butyric acid: (+)
- 300-500µm; (×) - 250-500 µm; (□) - 150-250 µm. Reaction conditions: 1:1 BA:2-EHA molar
feed ratio, 0.01 kg Amberlyst 70/kg soln., 110°C. ..................................................................... 185
Figure D.4.1: Mole fraction profiles of reaction components for Run 1; (♦) – BA; (▲) – 2EHB;
(×) – W. Continuous lines represent predicted mole fraction profiles from kinetic model. ....... 187
Figure D.4.2: Mole fraction profiles of reaction components for Run 2; (♦) – BA; (▲) – 2EHB;
(×) – W. Continuous lines represent predicted mole fraction profiles from kinetic model. ....... 187
Figure D.4.3: Mole fraction profiles of reaction components for Run 3; (♦) – BA; (▲) – 2EHB;
(×) – W. Continuous lines represent predicted mole fraction profiles from kinetic model. ....... 188
Figure D.4.4: Mole fraction profiles of reaction components for Run 5; (♦) – BA; (▲) – 2EHB;
(×) – W. Continuous lines represent predicted mole fraction profiles from kinetic model. ....... 188
Figure D.4.5: Mole fraction profiles of reaction components for Run 6; (♦) – BA; (▲) – 2EHB;
(×) – W. Continuous lines represent predicted mole fraction profiles from kinetic model. ....... 189
Figure D.4.6: Mole fraction profiles of reaction components for Run 7; (♦) – BA; (▲) – 2EHB;
(×) – W. Continuous lines represent predicted mole fraction profiles from kinetic model. ....... 189
Figure D.4.7: Mole fraction profiles of reaction components for Run 8; (♦) – BA; (▲) – 2EHB;
(×) – W. Continuous lines represent predicted mole fraction profiles from kinetic model. ....... 190
Figure D.4.8: Mole fraction profiles of reaction components for Run 9; (♦) – BA; (▲) – 2EHB;
(×) – W. Continuous lines represent predicted mole fraction profiles from kinetic model ........ 190
Figure D.4.9: Mole fraction profiles of reaction components for Run 10; (♦) – BA; (▲) – 2EHB;
(×) – W. Continuous lines represent predicted mole fraction profiles from kinetic model ........ 191
Figure D.4.10: Mole fraction profiles of reaction components for Run 11; (♦) – BA; (▲) –
2EHB; (×) – W. Continuous lines represent predicted mole fraction profiles from kinetic model
..................................................................................................................................................... 191

xix
Figure D.4.11: Mole fraction profiles of reaction components for Run 12; (♦) – BA; (▲) –
2EHB; (×) – W. Continuous lines represent predicted mole fraction profiles from kinetic model.
..................................................................................................................................................... 192
Figure D.4.12: Mole fraction profiles of reaction components for Run 13; (♦) – BA; (▲) –
2EHB; (×) – W. Continuous lines represent predicted mole fraction profiles from kinetic model.
..................................................................................................................................................... 192
Figure D.4.13: Mole fraction profiles of reaction components for Run 14; (♦) – BA; (▲) –
2EHB; (×) – W. Continuous lines represent predicted mole fraction profiles from kinetic model.
..................................................................................................................................................... 193
Figure D.4.14: Mole fraction profiles of reaction components for Run 15; (♦) – BA; (▲) –
2EHB; (×) – W. Continuous lines represent predicted mole fraction profiles from kinetic model.
..................................................................................................................................................... 193
Figure D.4.15: Mole fraction profiles of reaction components for Run 16; (♦) – BA; (▲) –
2EHB; (×) – W. Continuous lines represent predicted mole fraction profiles from kinetic model.
..................................................................................................................................................... 194
Figure D.4.16: Mole fraction profiles of reaction components for Run 17; (♦) – BA; (▲) –
2EHB; (×) – W. Continuous lines represent predicted mole fraction profiles from kinetic model.
..................................................................................................................................................... 194
Figure D.4.17: Mole fraction profiles of reaction components for Run 18; (♦) – BA; (▲) –
2EHB; (×) – W. Continuous lines represent predicted mole fraction profiles from kinetic model.
..................................................................................................................................................... 195
Figure D.4.18: Mole fraction profiles of reaction components for Run 19; (♦) – BA; (▲) –
2EHB; (×) – W. Continuous lines represent predicted mole fraction profiles from kinetic model.
..................................................................................................................................................... 195
Figure D.4.19: Mole fraction profiles of reaction components for Run 20; (♦) – BA; (▲) –
2EHB; (×) – W. Continuous lines represent predicted mole fraction profiles from kinetic model.
..................................................................................................................................................... 196
Figure D.5.1: Calibration plot for Butyric acid (BA) ................................................................. 197
Figure D.5.2: Calibration plot for 1-Butanol (BuOH) ................................................................ 198

xx
Figure D.5.3: Calibration plot for Butyl butyrate (BB) .............................................................. 198
Figure D.5.4: Calibration plot for Ethanol (EtOH). .................................................................... 199
Figure D.5.5: Calibration plot for Ethyl butyrate (EB). .............................................................. 199
Figure D.5.6: Calibration plot for isopropanol (IPA). ................................................................ 200
Figure D.5.7: Calibration plot for isopropyl butyrate (IPB). ...................................................... 200
Figure D.5.8: Calibration plot for Methanol (MeOH). ............................................................... 201
Figure D.5.9: Calibration plot for Methyl butyrate (MB). .......................................................... 201
Figure D.5.10: Calibration plot for 1-Propanol (PrOH). ............................................................ 202
Figure D.5.11: Calibration plot for Propyl butyrate (PB). .......................................................... 202
Figure D.5.12: Calibration plot for Sec-Butanol (S-BuOH). ...................................................... 203
Figure D.5.13: Calibration plot for tert-Butanol (t-BuOH). ....................................................... 203
Figure D.5.14: Calibration plot for Butyric acid (BA) ............................................................... 204
Figure D.5.15: Calibration plot for 2-Ethylhexyl butyrate (2-EHB). ......................................... 204
Figure D.5.16: Calibration plot for 2-Ethylhexanol (2-EHA). ................................................... 205

xxi
KEY TO SYMBOLS AND ABBREVIATIONS
ai Activity of species of i in solution
AA Acetic acid
BA Butyric acid
BME Butyl methyl ether
BS Butyl stearate
BuOH 1-butanol
CHA Cyclohexyl acetate
CHE Cyclohexene
CHX Cyclohexane
DBE Dibutyl ether
D-SRC Distillation with external side reactor concept
2-EHA 2-Ethylhexanol
2EHB 2-Ethylhexyl butyrate
Ef Energy of activation for forward esterification reaction, kJ/kmol
F2min Absolute sum of mean square differences
IE Ion exchange capacity of solid acid catalyst (Equivalents/kg cat)
k0f Pre-exponential factor for forward reaction rate constant
kf Forward reaction rate constant
Ka Equilibrium constant

xxii
kTON Turnover number normalized to actual alcohol and acid concentrations (m6/kmol
alcohol/kmol H+/hr)
k0
f,auto Pre-exponential factor of forward reaction rate constant in auto-catalyzed
esterification reaction (1/min)
kf,auto Forward reaction rate constant in auto-catalyzed esterification reaction
(1/min)
MeOH Methanol
MS Methyl stearate
(MV)tot Total molar volume of the solution (m3/kmol)
nruns Number of data points
NaCl Sodium Chloride
NaOH Sodium hydroxide
Nipredicted
Moles of ith
component predicted by kinetic model
Niexperimental
Experimentally determined moles of ith
component
rCHE Initial reaction rate of Cyclohexene (kmol/hr)
Ni Moles of ith
component in liquid phase
p-TSA Para toluene sulfonic acid
ri Reaction rate of ith
component (kmol/m3/min)
-rBA Initial reaction rate of butyric acid determined from mole fraction profile (1/min)

xxiii
(-rBA)ini Initial reaction rate of butyric acid determined from mole fraction profile (1/min)
TON Turnover number (kmol limiting reactant/kmol H+/hr)
V Volume of solution (m3)
W Water
Wcat Catalyst concentration (kg catalyst/kg solution)
Wsol Weight of solution (kg)
xj Mole fraction of species j in solution
o
R H Standard enthalpy of reaction in liquid state, kJ/mol
jvH , Heat of vaporization for species, kJ/mol
o
rg Standard Gibbs energy of reaction
o
fg Gibbs energy of formation
o
fh Standard enthalpy of formation kJ/mol
o
rh Standard enthalpy of reaction kJ/mol
W Water
Wcat Catalyst concentration (kg cat/kg soln)
xi,exp Experimentally determined mole fraction of ith
component
xi,cal Mole fraction of ith
component calculated using pseudo-homogeneous model
xxiv
Greek Letters
γi Liquid phase activity coefficient
i Stoichiometric coefficient of ith
component in solution
Subscripts
i Species in solution

1
Chapter 1: Introduction
Organic esters are an important class of commercial chemicals with the general formula
RCOOR', where R and R' can be either the same or different aliphatic, aromatic or heterocyclic
groups [1]. The most common methods for organic ester synthesis by acid catalysis are [2-4]: a)
direct addition of carboxylic acid to alcohol with the elimination of water b) transesterification of
an ester by alcohol and c) direct addition of olefin to carboxylic acid. Esters derived from
carboxylic acids are used as solvents, plasticizers, and food flavors [5]. They find application in
perfumery and are precursors in making a wide range of detergents [6], agrochemicals, and
pharmaceuticals. Diesters of carboxylic acids can be used as fuel components that improve cold
flow properties of biodiesel fuel [7, 8], and fatty acid methyl esters are used as biodiesel fuel [9,
10]. Conventional routes for ester production use homogeneous catalysts such as sulfuric acid
[11] and p-toluene sulfonic acid [12]. Heterogeneous catalysts such as cation exchange resins [6,
13, 14] are replacing corrosive homogeneous catalysts in organic ester synthesis due to their eco-
friendly nature and ease of separation from the reaction mixture.
The chemical industry is one of the largest energy consuming sectors in the world. In
2008, the industrial sector accounted for 38% of the global energy use of 505 quadrillion Btu,
22% of which was consumed for chemicals processing. Energy also represents 60% of the
chemical industry’s operating costs [15]. Most organic esters are high production volume
chemicals, produced at levels greater than 1000 MT per year by at least one member country in
Organization for Economic Cooperation and Development (OECD) [16].
Esterification and transesterification reactions, which are used to produce organic esters,
are limited by chemical equilibrium. Unit operations such as distillation are required to separate

2
the ester (or co-product water) and thus drive the reaction to completion, making these processes
highly energy intensive. Because of the growing demand for esters, there is an urgent need for
alternative chemical processing technologies with lower energy intensity to produce esters more
economically.
Process intensification (PI) provides an opportunity to use engineering principles to
simplify processes, improve energy efficiency and decrease waste production, energy intensity
and operational costs. It helps in developing a sustainable processing technology [17-19]. PI can
be achieved by combining functions or phenomena in an operation, adding or enhancing targeted
functions in a process and/or by using alternative energy sources to enhance performance.
A brief introduction to two PI concepts, namely reactive distillation and distillation with
external side reactors is given in Section 1.1. These concepts were evaluated in this study to
decrease energy intensity in esterification and transesterification processes to produce organic
esters of commercial importance.
1.1. Advanced PI techniques
1.1.1. Reactive Distillation
Reactive distillation represents a successful example of process intensification by
integrating chemical reaction and physical separation into a single unit operation. Use of RD to
produce high purity methyl acetate was a pioneering commercial application of PI to improve
energy efficiency and lower capital costs. Eastman chemicals’ methyl acetate RD process was
patented in 1984[20]. In the last three decades, RD was used in the commercial production of
methyl tertiary butyl ether (MTBE), ethyl tertiary butyl ether (ETBE), and tertiary amyl methyl
ether (TAME) [21] as gasoline oxygenate additives. With growing concerns regarding ground
water pollution in the USA, MTBE is now being replaced with ETBE and TAME [22]. Apart

3
from its use in traditional processes such as esterification and etherification, RD has also been
successfully applied as a PI technique for reactions such as desulfurization, selective
hydrogenation, dimerization and isomerization [23, 24]. According to Harmsen [23], CDTECH
and Sulzer Chemtech are the two major industrial scale technology suppliers for processes
involving RD operations. In 2006, CDTECH alone had licensed 146 commercial applications of
RD. Over 200 licensed commercial applications of RD are reported worldwide [23]. This shows
emerging interest in applying RD as a potential PI technique within the chemical industry.
RD offers the following advantages over conventional processes [25, 26]
reduces capital investment and operational costs
has scope for improving thermodynamic efficiency by utilizing heat of reaction
for liquid evaporation
drives the reaction towards completion by removing the volatile product thereby
overcoming conversion limitations related to chemical equilibrium
improves desired product selectivity by removing or maintaining low
concentration of reactants or products in the column that lead to side reaction
gives better control over the reactor system (by avoiding hot spots in the reactor)
In literature, certain guidelines to choose a reaction system for RD based on reaction
kinetics and relative volatilities of components are available [27, 28]. Figure 1.1 shows a
qualitative graphical method to identify reactive systems that can be considered for RD. Areas
for RD, distillation with side reactor configuration and evaporator connected to a reactor
configuration are shown. For reactions with moderate to fast reaction rate, RD is suggested. For
very slow reactions with low to medium relative volatilities, distillation with an external side
reactor is suggested.

4
Figure 1.1: Principle of the choice of equipment from Schoenmakers et al.[27]. For interpretation
of the references to color in this and all other figures, the reader is referred to the electronic
version of this dissertation.
1.1.1.1. Heat integration in RD column
To enhance energy efficiency, the heat of reaction needs to be taken into account during the
conceptual stages of RD column design [29]. Internal heat integration improves thermodynamic
efficiency of the RD process by using the heat of reaction for separation operation in RD
column. This internal heat utilization can be quantified as the thermal effect of a reaction (ξ) , a
dimensional number first introduced by Sundmacher et al.,[26]. It is defined as the ratio between
the heat of reaction and mean heat of vaporization.
N
j
L
jvj
Lo
R
Hx
H
1
, )(
)(
where j=1,N number of components in the reaction (1.1)
Based on ξ, Sun et al [30] divided the RD columns into the following three broad categories:
Rea
ctio
n r
ate
Relative volatility
slow
fast
low high
evaporator
+ reactor
Reactive distillation
evaporatorDistillation with

5
Reactions involving high thermal effect (ξ>1.0) where internal heat integration must be
considered
Reactions with moderate thermal effect (0.05≤ξ≤1.0) where balance between internal
mass and heat integration is needed
Reactions with negligible thermal effect (0≤ξ<0.05) where there is no heat utilization but
higher conversions can be achieved by vaporizing the products thus affecting the kinetic
equilibrium
While considering the RD process for reactions involving moderate thermal effect (0.05≤ξ≤1.0),
both internal mass and heat integration need to be evaluated during conceptual stages of RD
design. The synergy between mass and heat integration has a significant effect on process
intensification. A systematic methodology for internal heat integration for reactions with ξ>1.0 is
proposed in literature [29]. Detailed simulation studies of reactive distillation processes with
internal heat integration showed substantial improvements in energy efficiency besides reduced
capital investment [29, 31-35]. Huang et al., [29] studied methyl acetate production from
methanol and acetic acid (a reaction with moderate thermal effect ξ = 0.79 at 330K) using RD
and showed that simultaneous mass and heat integration can reduce heat duties of condenser and
reboiler by 3.68% and 4.52% respectively compared to a basic process design. It is important to
note that the reduction in energy consumption is only a result of increasing thermodynamic
efficiency in one RD column. In a system with a RD column followed by a distillation column as
in the transesterification methyl acetate with n-butanol, thermal coupling of RD with a side
stripper column to separate methanol and methyl acetate results in 14.% decrease in energy
consumption [36].

6
This study will focus on the simulation and pilot plant operation of a RD column
involving a reaction with moderate thermal effect. In addition to internal mass and heat
integration, the focus of this work is to study the effect of external heat integration on the energy
efficiency of RD column.
1.1.1.2. Alternative to RD technique
Reactive distillation is not always advantageous in organic ester synthesis. It is
ineffective for chemical systems in which temperatures favorable for reaction and that for
separation based on vapor-liquid equilibrium are not complementary. Another hardware issue
that mitigates RD use is catalyst deactivation or the need for changing catalyst in RD. It is
cumbersome to change heterogeneous catalyst packing from a RD column; this inflexibility adds
to the operating cost of the process. In chemical systems with very low reaction rate, high
catalyst hold up is required to achieve higher conversions. But high catalyst hold up in RD
affects separation efficiency by minimizing interfacial area between vapor and liquid. These
challenges in operational and hardware configurations can be overcome by using a distillation
column with external side reactors (herein DSR).
1.1.2. Distillation with external side reactor (DSR)
The concept of DSR as an alternative to RD was first proposed in literature by
Schoenmakers et al. [37]. Baur et al.[38] identified the complexities associated with DSR and
suggested an algorithm to determine optimum side reactor/column configuration. They studied
the methyl acetate process using DSR and concluded that it can match the methyl acetate yield
obtained using a reactive column. Bisowarno et al. [39] applied the DSR concept to ethyl tert-
butyl ether (ETBE) production. Ouni et al. [40] compared DSR and RD configurations for tert-

7
amyl methyl ether (TAME) production and isobutylene dimerization. Ojeda Nava et al.[41] also
studied TAME production using the DSR concept. They concluded that by optimizing design
parameters for DSR, it can compete with RD both in terms of energy efficiency and process
economics. Ding et al. [42] presented an optimization study for benzyl chloride production using
DSR. Kaymak et al.[28, 43, 44] identified that for RD to be economically attractive for any
reaction system, the temperature range suitable for chemical reaction to be compatible with the
temperature range suitable for vapor-liquid equilibrium. Their study is a quantitative
representation of the equipment choice guideline shown in Figure 1.1. They evaluated DSR for a
generic exothermic reaction where relative volatilities of components were assumed.
1.2. Research approach and outline
In this research, for a defined process concept to produce organic esters, a comprehensive
literature review was carried out. In addition, a study on chemical thermodynamics of the process
under consideration was also conducted. Batch reactor experiments were carried out to
characterize reaction kinetics of the system. These kinetic parameters were used in the process
simulation software, Aspen Plus. Non-ideality of the reaction system was taken into account
during kinetics characterization and process simulation. The simulation model thus developed
was used to evaluate process configurations that result in energy efficient production routes. An
outline of research approach followed in this work is presented in Figure 1.2. This research
approach was followed for evaluating PI techniques, RD and DSR in the production of
cyclohexyl acetate and butyl stearate respectively. The process simulation model was
experimentally verified using pilot plant experiments only in the case of cyclohexyl acetate
production.

8
Figure 1.2: An outline of research approach.
1.2.1. Cyclohexyl acetate – an intermediate in cyclohexanol production
Cyclohexanol is an industrially important chemical produced in large scale worldwide,
particularly as an intermediate in the production of nylon [45]. Major production routes for
producing nylon starting from naphtha, coal or natural gas are presented in Figure 1.3. It is to be
noted here that the benzene production route from natural gas shown in Figure 1.3 is not yet a
commercial process. Catalysts that can be used for direct conversion of natural gas to
petrochemicals have been reported in literature [46]. This route is included in the Figure 1.3 to
make it more comprehensive.
Design and conduct batch
reactor experiments
Evaluate kinetic parameters
using MATLAB
Process Simulation - Aspen Plus
Pilot plant experiments
Sample analysis – GC,HPLC
Define the process concept
Literature review
Thermodynamics
Phase equilibria
Process evaluation

9
The conventional route to cyclohexanol is via partial oxidation of cyclohexane, but this
route gives low selectivity with substantial byproduct formation and large recycle streams.
Hydrogenation of phenol with a metal catalyst is another commercial route to produce
cyclohexanol and cyclohexanone (Ketone-Alcohol oil or KA oil), and yields as high as 95% at
100% conversion can be achieved by this route. Though efficient, this route is energy intensive
because three moles of hydrogen are required for every mole of cyclohexanol formed. An
alternative route to produce cyclohexanol has been commercialized by Asahi chemicals [47].
This route involves partial hydrogenation of benzene to cyclohexene and cyclohexane separation
of cyclohexene from benzene and cyclohexane by successive extractive distillations, and direct
hydration of cyclohexene to cyclohexanol using a HZSM-5 type zeolite catalyst. The first step in
this process offers the advantage of less hydrogen consumption than the phenol route. The
second step involves high energy consumption to separate the close boiling mixture of benzene,
cyclohexane and cyclohexene by extractive distillation. The third step suffers from the drawback
of very low equilibrium conversion (~14%) [45]. This third step is also very energy intensive, as
the reaction is carried out in a slurry reactor followed by distillation for external separation.
All of the commercial processes discussed above have one common disadvantage:
reaction must be followed by an energy-intensive separation step. There thus exists an
opportunity in cyclohexanol production offer for process intensification [48]; reactive
distillation (RD) can combine reaction with separation, leading to a process with potentially
lower energy consumption.

10
Figure 1.3: Major production routes for cyclohexanol and its end uses
Separation
Benzene, Toluene,
Xylene
Natural
Naphtha
Benzene Toluene
Catalysis by
H-ZSM 5
Cyclohexane
Catalytic reforming
Coal
Carbonization
Hydrogenation
Cyclohexene
Partial Hydrogenation
Cyclohexanol
Cyclohexanone
Oxidation Hydration
Phenol
Oxidation
Dehydrogenation
Cyclohexanone
oxime
Hydroxylamine
Ammoximation
ε- Caprolactam
Beckmann
rearrangement
Nylon-6
Polymerization
KA Oil
Adipic
acid
Oxidation with
Nitric acid
Nylon-6,6
Hexamethylenediamine
Poly condensation
11
The reaction of cyclohexene with a carboxylic acid to form cyclohexyl ester with
subsequent hydrolysis of the ester is an attractive cyclohexene hydration route to cyclohexanol
for nylon-6,6 production. The use of RD to produce cyclohexyl formate and subsequent
hydration to cyclohexanol has been reported in the literature [49, 50]. In this work, acetic acid is
used as the reactive entrainer instead of formic acid, because the latter is toxic and decomposes
into carbon monoxide and water at higher temperatures. Cyclohexene esterification with acetic
acid is a moderately fast reaction. Therefore, RD is an apt choice for this reaction system (Figure
1.1). In addition to chemical kinetics and pilot scale experiments, insight into the effect of heat
addition and heat transfer between the reactive stages on cyclohexene conversion in RD column
using process simulations is also presented.
Chapters 2 and 3 in this study describe the use of RD technique to produce cyclohexyl
acetate. In Chapter 2, the chemical reaction kinetics and equilibrium dependence on temperature
of Amberlyst 70 catalyzed esterification of acetic acid with cyclohexene are described. This
chapter also deals with the effect of cyclohexene dimerization and initial water concentration on
the activity of the heterogeneous Amberlyst 70 catalyst.
In Chapter 3, pilot plant-scale RD experiments of cyclohexene esterification with acetic
acid are described. Based on preliminary pilot-plant runs, process configuration and conditions
suitable for high conversions of cyclohexene are suggested, and initial investigations into heat
integration for this reaction system are reported. This experimental data was also used to develop
a simulation model using the process design software -Aspen Plus.
1.2.2. Butyl stearate – a model compound for potential biodiesel constituents
Fatty acid butyl esters can be used as potential biodiesel constituents. Butyl stearate was
chosen as a model compound to represent fatty acid butyl esters. A process concept to produce

12
butyl stearate from methyl stearate by transesterification with 1-butanol was chosen to evaluate
DSR as a potential PI technique. In Chapter 4, the chemical reaction kinetics of Amberlyst 15
catalyzed transesterification of methyl stearate with 1-butanol along with etherification side
reaction is described. Using this kinetics in the Aspen Plus process design software, a model to
evaluate the concept of distillation with an external side reactor was simulated. In Chapter 5, the
details of these simulations are described.
1.2.3. Butyric acid esterification: The effect of alcohol carbon chain length and type of
catalyst on the rate of esterification reaction
In addition to evaluation of PI concepts, the effect of factors such as alcohol carbon chain
length and type of solid acid catalyst on esterification reaction rate was investigated. Butyric
acid, a carboxylic acid that can potentially be obtained from fermentation processes was chosen
as a model compound in this study. The effect of increasing alcohol carbon chain length and
branching on esterification rate is presented. Four strong cation exchange resins, Amberlyst 15,
Amberlyst 36, Amberlyst BD 20, and Amberlyst 70, were examined along with p-toluene
sulfonic acid as a homogeneous catalyst. For all catalysts, the decrease in turnover number
(TON) with increasing carbon chain length of the alcohol is described in terms of steric
hindrance and alcohol polarity. Detailed kinetics of butyric acid esterification with 2-
ethylhexanol using Amberlyst 70 catalyst were studied in a batch reactor. In Chapter 6, an
activity-based, pseudo-homogeneous kinetic model that includes autocatalysis by butyric acid is
presented for the Amberlyst 70 ion exchange resin catalyst.

13
REFERENCES

14
1.3. References
1. Riemenschneider, W. and H.M. Bolt, Esters, Organic. Ullmann's Encyclopedia of
Industrial Chemistry. 2000: Wiley-VCH Verlag GmbH & Co. KGaA.
2. Yadav, G.D. and P.H. Mehta, Heterogeneous Catalysis in Esterification Reactions:
Preparation of Phenethyl Acetate and Cyclohexyl Acetate by Using a Variety of Solid
Acidic Catalysts. Industrial & Engineering Chemistry Research, 1994. 33(9): p. 2198-
2208.
3. Michael A. Ogliaruso, J.F.W., Saul Patai, Zvi Rappoport, Synthesis of Carboxylic Acids,
Esters and their Derivatives. 1991, New York: John Wiley.
4. Yadav, G.D. and P.K. Goel, Selective synthesis of perfumery grade cyclohexyl esters
from cyclohexene and carboxylic acids over ion exchange resins: an example of 100%
atom economy. Green Chemistry, 2000. 2(2): p. 71-78.
5. Armstrong, D.W. and H. Yamazaki, Natural flavours production: a biotechnological
approach. Trends in Biotechnology, 1986. 4(10): p. 264-268.
6. Harmer, M.A. and Q. Sun, Solid acid catalysis using ion-exchange resins. Applied
Catalysis A: General, 2001. 221(1-2): p. 45-62.
7. Miller, D.J., et al., Process for producing mixed esters of fatty acids as biofuels. 2008:
Patent application, 12/313,343, USA.
8. Moser, B., et al., Diesters from Oleic Acid: Synthesis, Low Temperature Properties, and
Oxidation Stability. Journal of the American Oil Chemists' Society, 2007. 84(7): p. 675-
680.
9. Knothe, G., Krahl, J., Van Gerpen, J., Eds., The Biodiesel Handbook. 2005, Champaign,
IL: AOCS Press.
10. Wang, P.S., M.E. Tat, and J. Van Gerpen, The production of fatty acid isopropyl esters
and their use as a diesel engine fuel. Journal of the American Oil Chemists Society,
2005. 82(11): p. 845-849.

15
11. Grob, S. and H. Hasse, Reaction Kinetics of the Homogeneously Catalyzed Esterification
of 1-Butanol with Acetic Acid in a Wide Range of Initial Compositions. Industrial &
Engineering Chemistry Research, 2006. 45(6): p. 1869-1874.
12. de Jong, M.C., et al., Reaction kinetics of the esterification of myristic acid with
isopropanol and n-propanol using p-toluene sulphonic acid as catalyst. Applied
Catalysis A: General, 2009. 365(1): p. 141-147.
13. Lundquist, E.G., Catalyzed esterification process 1995: USA.
14. Sharma, M.M., Some novel aspects of cationic ion-exchange resins as catalysts. Reactive
and Functional Polymers, 1995. 26(1-3): p. 3-23.
15. Vincent, K.R., International Energy Outlook 2011, U.S.E.I. Administration, 2011:
Washington, DC.
16. The 2004 OECD List of High Production Volume Chemicals, E.D. OECD, 2004: Paris.
17. Stankiewicz, A.I. and J.A. Moulijn, Process intensification: Transforming chemical
engineering. Chemical Engineering Progress, 2000. 96(1): p. 22-34.
18. Schembecker, G. and S. Tlatlik, Process synthesis for reactive separations. Chemical
Engineering and Processing, 2003. 42(3): p. 179-189.
19. Lutze, P., R. Gani, and J.M. Woodley, Process intensification: A perspective on process
synthesis. Chemical Engineering and Processing: Process Intensification, 2010. 49(6): p.
547-558.
20. Victor H. Agreda; Lee R. Partin, b.o.K., Tenn, Reactive distillation process for the
production of methyl acetate, U.S. Patent, Editor. 1984, Eastman Kodak Company,
Rochester, N.Y.: USA.
21. Sharma, M.M. and S.M. Mahajani, Industrial Applications of Reactive Distillation, in
Reactive Distillation. 2003, Wiley-VCH Verlag GmbH & Co. KGaA. p. 1-29.
22. Winterberg, M., et al., Methyl Tert-Butyl Ether, in Ullmann's Encyclopedia of Industrial
Chemistry. 2000, Wiley-VCH Verlag GmbH & Co. KGaA.

16
23. Harmsen, G.J., Reactive distillation: The front-runner of industrial process
intensification: A full review of commercial applications, research, scale-up, design and
operation. Chemical Engineering and Processing, 2007. 46(9): p. 774-780.
24. Reactive Distillation: Status and Future Directions, ed. K. Sundmacher and A. Kienle.
2002: Wiley-VCH Verlag GmbH & Co. KGaA.
25. Taylor, R. and R. Krishna, Modelling reactive distillation. Chemical Engineering
Science, 2000. 55(22): p. 5183-5229.
26. Sundmacher, K.A.I., L.K. Rihko, and U. Hoffmann, Classification of reactive distillation
processes by dimensionless numbers. Chemical Engineering Communications, 1994.
127(1): p. 151-167.
27. Schoenmakers, H.G. and B. Bessling, Reactive and catalytic distillation from an
industrial perspective. Chemical Engineering and Processing: Process Intensification,
2003. 42(3): p. 145-155.
28. Kaymak, D.B., W.L. Luyben, and Smith, Effect of Relative Volatility on the Quantitative
Comparison of Reactive Distillation and Conventional Multi-unit Systems. Industrial &
Engineering Chemistry Research, 2004. 43(12): p. 3151-3162.
29. Huang, K., et al., Reactive distillation design with considerations of heats of reaction.
AIChE Journal, 2006. 52(7): p. 2518-2534.
30. Sun, J., K. Huang, and S. Wang, Deepening Internal Mass Integration in Design of
Reactive Distillation Columns, 1: Principle and Procedure. Industrial & Engineering
Chemistry Research, 2009. 48(4): p. 2034-2048.
31. Huang, K., S.-J. Wang, and W. Ding, Towards further internal heat integration in design
of reactive distillation columns--Part III: Application to a MTBE reactive distillation
column. Chemical Engineering Science, 2008. 63(8): p. 2119-2134.
32. Zhu, F., et al., Towards further internal heat integration in design of reactive distillation
columns--Part IV: Application to a high-purity ethylene glycol reactive distillation
column. Chemical Engineering Science, 2009. 64(15): p. 3498-3509.

17
33. Kumar, M.V.P. and N. Kaistha, Internal Heat Integration and Controllability of Double
Feed Reactive Distillation Columns, 1. Effect of Feed Tray Location. Industrial &
Engineering Chemistry Research, 2008. 47(19): p. 7294-7303.
34. Pavan Kumar, M.V. and N. Kaistha, Internal Heat Integration and Controllability of
Double Feed Reactive Distillation Columns, 2. Effect of Catalyst Redistribution.
Industrial & Engineering Chemistry Research, 2008. 47(19): p. 7304-7311.
35. Huang, K., et al., A fundamental principle and systematic procedures for process
intensification in reactive distillation columns. Chemical Engineering and Processing:
Process Intensification. 49(3): p. 294-311.
36. Wang, S.-J., D.S.H. Wong, and S.-W. Yu, Design and control of transesterification
reactive distillation with thermal coupling. Computers & Chemical Engineering, 2008.
32(12): p. 3030-3037.
37. Schoenmakers, H. and W. Buehler, Distillation column with external reactors - an
alternative to the reaction column. Chem.-Ing.-Tech., 1982. 54(2): p. 163.
38. Baur, R. and R. Krishna, Distillation column with reactive pump arounds: an alternative
to reactive distillation. Chem. Eng. Process., 2003. 43(3): p. 435-445.
39. Bisowarno, B.H., Y.-C. Tian, and M.O. Tadé, Application of side reactors on ETBE
reactive distillation. Chemical Engineering Journal, 2004. 99(1): p. 35-43.
40. Ouni, T., et al., Enhancing productivity of side reactor configuration through optimizing
the reaction conditions. Chem. Eng. Res. Des., 2004. 82(A2): p. 167-174.
41. Ojeda Nava, J.A., R. Baur, and R. Krishna, Combining Distillation and Heterogeneous
Catalytic Reactors. Chemical Engineering Research and Design, 2004. 82(2): p. 160-166.
42. Ding, L.-H., et al., Optimum Design and Analysis Based on Independent Reaction
Amount for Distillation Column with Side Reactors: Production of Benzyl Chloride. Ind.
Eng. Chem. Res., 2011. 50(19): p. 11143-11152.
43. Kaymak, D.B. and W.L. Luyben, Design of Distillation Columns with External Side
Reactors. Industrial & Engineering Chemistry Research, 2004. 43(25): p. 8049-8056.

18
44. Kaymak, D.B. and W.L. Luyben, Optimum Design of a Column/Side Reactor Process.
Ind. Eng. Chem. Res., 2007. 46(15): p. 5175-5185.
45. Musser, M.T., Cyclohexanol and Cyclohexanone. Ullmann's Encyclopedia of Industrial
Chemistry. 2000: Wiley-VCH Verlag GmbH & Co. KGaA.
46. Aboul-Gheit, A.K., et al., Direct Conversion of Natural Gas to Petrochemicals Using
Monofunctional Mo/SiO2 and H-ZSM-5 Zeolite Catalysts and Bifunctional Mo/H-ZSM-5
Zeolite Catalyst. Petroleum Science and Technology. 30(9): p. 893-903.
47. Osamu Mitsui, Y.F., Process for producing cyclic alcohol. 1986, Asahi Kasei Kogyo
Kabushiki Kaisha: USA.
48. Freund, H. and K. Sundmacher, Process Intensification, 1. Fundamentals and Molecular
Level, in Ullmann's Encyclopedia of Industrial Chemistry. 2011, Wiley-VCH Verlag
GmbH & Co. KGaA.
49. Steyer, F. and K. Sundmacher, Cyclohexanol Production via Esterification of
Cyclohexene with Formic Acid and Subsequent Hydration of the EsterReaction Kinetics.
Industrial & Engineering Chemistry Research, 2007. 46(4): p. 1099-1104.
50. Steyer, F., H.r. Freund, and K. Sundmacher, A Novel Reactive Distillation Process for the
Indirect Hydration of Cyclohexene to Cyclohexanol Using a Reactive Entrainer.
Industrial & Engineering Chemistry Research, 2008. 47(23): p. 9581-9587.

19
Chapter 2: Cyclohexyl acetate production from cyclohexene and acetic acid: Reaction
kinetics and chemical equilibrium
2.1. Summary
The reaction of cyclohexene with acetic acid to form cyclohexyl acetate with subsequent
hydrolysis of the ester is an attractive cyclohexene hydration route to cyclohexanol for nylon-6,6
production. In this work, the chemical reaction kinetics and equilibrium state of Amberlyst 70
catalyzed esterification of acetic acid with cyclohexene were measured in batch reactions.
Reactions were conducted over a temperature range of 343-403 K, initial mole ratios of acetic
acid:cyclohexene between 1: 5 and 5:1, and at catalyst loadings of 1 to 4wt% of feed. An
activity-based kinetic model is presented with activity coefficients calculated using the NRTL
model. Heat of reaction obtained from experiments is compared to the predicted heat calculated
using standard thermodynamic data. Effects of cyclohexene dimerization and initial water
concentration on the activity of heterogeneous catalyst are also discussed. The kinetic model is
useful for simulating cyclohexanol production in processes such as reactive distillation.
2.2. Introduction
Cyclohexanol is an industrially important chemical produced in large scale worldwide,
particularly as an intermediate in the production of nylon-6,6 [1]. A novel approach using
reactive distillation (herein, RD) to produce cyclohexanol from cyclohexene (herein, CHE)
produced in benzene hydrogenation is via indirect hydration [2-4]. In versions of this process
reported, formic acid is used as reactive entrainer - CHE is esterified with formic acid to produce
cyclohexyl formate in a first RD column, and the ester thus obtained can be hydrolyzed in a
second RD column to give cyclohexanol and formic acid, which can be recycled to the first

20
column. Apart from safety and energy efficiency, this method offers the additional key
advantage of separating cyclohexane (herein, CHX) from CHE. CHX does not participate in the
esterification reaction and can be collected as a top product from the first RD column, thus
eliminating the extractive distillation step required to separate the mixture of CHE and CHX.
Detailed reaction kinetics and vapor-liquid and liquid-liquid equilibrium data describing CHE
esterification with formic acid and cyclohexyl formate hydolysis is reported in literature [5-10].
In this study, acetic acid (herein, AA) is used as reactive entrainer to produce cyclohexanol from
CHE. The reaction scheme is shown in Figure 2.1. The production of cyclohexyl acetate (herein,
CHA) via esterification CHE with AA, which can be an intermediate in the production of
cyclohexanol is the focus of this study.
H3C
Cyclohexene
H3C
H3C
Acetic acid
2
Acetic acid
Cyclohexyl acetate
Cyclohexanol
+H2O-H2O
Figure 2.1: Reaction network for cyclohexanol production from cyclohexene

21
Esterification kinetics of CHE with acetic acid, acrylic acid, and methacrylic acid using
solid acid catalysts are reported in the literature [4, 11]. Chakrabarti et al.[11] studied this
reaction between 70-90°C using Amberlyst 15 catalyst, assuming that the reaction was
irreversible in the temperature range studied. However, olefin esterification with carboxylic acids
is an equilibrium limited reaction [12], so their kinetics are incomplete in this sense. Also, strong
cation exchange resin catalyst Amberlyst 70 has been shown to be superior to more commonly
used Amberlyst 15 in terms of high temperature stability and turn over frequency [13-15].
Therefore, a systematic kinetic study of CHE esterification with AA catalyzed by
Amberlyst 70 has been conducted to determine reaction conditions desirable for the esterification
reaction. Effects of temperature, catalyst loading and initial mole ratio of acetic acid to
cyclohexene on reaction were investigated. AA is used as the reactive entrainer instead of formic
acid because the latter is toxic and decomposes at higher temperatures to carbon monoxide and
water. The reaction scheme is shown in Figure 2.2;
The side reaction involving CHE dimerization has been shown by Ronchin et al. [16],
who studied alkylation kinetics of phenol with CHE using styrene divinylbenzene sulfonic resins
treated with nitric acid and sulfuric acid, to be the only significant oligomerization reaction that
affects the overall kinetics. Yadav et al. [15] studied esterification of CHE with carboxylic acids
to make perfumery-grade esters in the presence of ion exchange resins. In the presence of CHX
and short reaction times at 373 K, they found negligible amounts of dimer formation [17]. For
production of cyclohexyl acetate (here in , CHA) using reactive distillation , further study of
CHE dimerization is important because when CHE is fed to the lower part of the column, the
presence of catalyst at high temperatures can lead to CHE oligomerization. Thus

22
oligomerization and the subsequent effect of oligomers on ion exchange resin catalyst are
examined here.
Effects of water on catalyst activity were also studied. This study gives an insight into
the desirable operating conditions for reactive distillation column operation.
H3C
Amberlyst 70
H3C
Amberlyst 70
C12H20
Dimers of Cylohexene
Cyclohexene Acetic Acid Cyclohexyl acetate
Figure 2.2: Cyclohexene esterification with acetic acid
2.3. Materials and Methods
The starting materials used in this work, cyclohexene (>99%), cyclohexyl acetate (>99%)
and 1,4 dioxane (>99%), were obtained from Sigma-Aldrich. Glacial acetic acid (>99.7%) was
purchased from VWR Scientific, and 1-butanol was obtained from Mallinckrodt-Baker, Inc.
Amberlyst 70 ion exchange resin was purchased from the Dow Chemical Company. The ion-
exchange resin catalyst was washed with deionized water and then with ethanol until the
supernatant liquid was colorless and then dried overnight at 373 K under vacuum before use in
experiments. The ion exchange capacity of the resin catalyst was determined by titration as
2.6±0.2 eq/kg, a value in reasonable agreement with the value of 2.55 eq/kg reported by the
manufacturer [18].

23
Batch reactions for kinetic study were performed in a Parr 5000 multi-reactor system
equipped with temperature control (±0.2°C) and stirring speed control (0-1400 rpm). In a typical
experiment, measured quantities of CHE and AA along with Amberlyst 70 catalyst were charged
into the reactor. Stirring of the reactors was kept at 800 rpm. The reactor was sealed and heating
was then initiated. Zero reaction time was taken at the point that the desired reaction temperature
was reached even though a small amount of reaction takes place during heating. Approximately
one-milliliter samples were taken at specified intervals over a period of 3 hours of the reaction
via use of a syringe attached to a sample port. Equilibrium samples were collected after 24 hours
of reaction. Samples were passed through a 2µm filter attached to the end of the sample port to
separate sample solution from the catalyst.
Samples were analyzed using a HP-5890 Series II gas chromatograph equipped with a
flame ionization detector (FID). A 30m length, 0.53mm ID, 1.0µm film thickness Aquawax-DA
column was used to separate the components. Oven temperature maintained initially at 40C for
1.0 min, increased at 20C/min to 250C, and then maintained at that temperature for an
additional 2.0 min. Injector and detector temperatures were maintained at 250C and 300C
respectively. 1,4-Dioxane was used as internal standard. To identify cyclohexene dimers, a
Varian CP-3800 gas chromatograph equipped with Saturn 2000 mass spectrometer was used. A
fused silica capillary column SLB™-5ms:30m× 0.25mm × 0.25µm film thickness was used to
separate the components. Water content in the reactants was analyzed using Hydranal-coulomat
E solution in a coulometric AQ-2100 Karl-Fisher titrator.
To determine the effect of water and dimerization reaction on esterification of CHE with
AA, turn over number (TON, kmol CHE/kmol H+/hr) was calculated from the observed initial
reaction rate of cyclohexene (-rCHE) as follows:
24
solcat
CHE
WIEW
rTON
)( (2.1)
2.4. Results and Discussion
2.4.1. Reaction studies
2.4.1.1. Reusability of catalyst
The TON calculated for repeated use of Amberlyst 70 at 363 K and an initial mole ratio
of CHE to AA at 1:1, varied between 8.9 and 9.2 kmol CHE/kmol H+/hr. This initial result
suggests that Amberlyst 70 is an effective catalyst for this reaction. A control experiment with
only CHE and AA at 363 K and no catalyst showed no reaction over 24 hours. Therefore auto-
catalysis of this reaction was assumed negligible at the conditions studied.
2.4.1.2 Mass transfer considerations
The development of an accurate kinetic model requires that external and internal mass
transfer resistances be minimized in reaction. To ensure that there were no external mass transfer
resistances in CHE esterification with AA, the reaction was carried out at several different
agitation speeds while keeping all other conditions the same. Figure A.1a in Appendix A shows
that there is no significant effect of speed of agitation on the mole fraction of CHE over the
entire range of stirring rates. All further reactions were carried out at 800 rpm. Internal mass
transfer resistances were evaluated using different particle sizes of Amberlyst 70 obtained by
grinding the resin into finer particles and screening for three different size fractions. These three
fractions were evaluated under identical reaction conditions. Figure A.1b shows no significant

25
difference in CHE mole fraction profile for the different catalyst particle sizes, indicating that
intra-particle diffusion resistances are negligible for Amberlyst 70-catalyzed esterification.
Preliminary experiments at identical reaction conditions (800 rpm, 363 K, 1:1
cyclohexene: acetic acid) with increasing catalyst loading were conducted: a linear increase in
initial reaction rate of CHE was observed with increasing catalyst loading as shown in Figure 2.3
(R2=0.96) showing the intrinsic nature of kinetic data collected in this study.
0.00
2.00
4.00
6.00
8.00
10.00
12.00
0 0.01 0.02 0.03 0.04 0.05
Init
ial
reac
tion r
ate
10
4*(-
r CH
E)
(1/m
in)
catalyst loading kg cat/kg soln
Figure 2.3: Effect of catalyst loading on initial cyclohexene esterification rate. Reaction
conditions: Temperature: 363 K, Initial mole ratio CHE:AA = 1:3.
2.4.1.3. Chemical equilibrium constant
The mole fraction-based equilibrium constants (Kx) were determined by analysis of
reaction samples taken after 24 hours of reaction time, a period sufficient for the esterification
reaction to closely approach equilibrium. The activity-based equilibrium constant, Ka, was
calculated from Kx via inclusion of activity coefficients of the species in the mixture as
determined by the NRTL model (Eq. 2.2).

26
ivivxKKivaK iixia (2.2)
In Figure 2.4, the natural logarithm of Ka obtained in this way was plotted against the
inverse of absolute temperature. In order to verify the values of Ka obtained for reactions starting
with CHE and AA, four additional experiments (Runs 30-33, Appendix A, Table A.3.1) starting
with CHA and AA were conducted. As shown in Figure 2.4, Ka obtained for these experiments
(reverse reaction) is in agreement with that obtained from experiments starting with CHE and
AA (forward reaction). In Runs 30-33, high initial mole ratio of AA to CHA was maintained to
avoid CHE oligomerization which affects kinetic equilibrium.
Along with the experimental data, values of Ka calculated from standard thermodynamic
properties of individual reactants and products, obtained from the NIST database and DIPPR
database [19] (Table 2.1a) were included in Figure 2.4. The standard Gibbs energy of reaction
and equilibrium constant at 298 K are related as follows:
o
o
ro
aRT
gTK
)(ln
(2.3)
The value of o
rg at standard temperature was computed using the heat capacity of
components involved in the reaction [20]. As can be seen in Figure 2.3, the heat of reaction
estimated from the slope of the regression of experimental data is similar to that obtained from
standard thermodynamic data. It is to be noted that the value of o
rg depends on standard Gibbs
energy of formation obtained from literature. A small error in standard data will lead to an error
in estimated value of o
rg . The uncertainties on o
fg for components involved in the reaction

27
are given in Table 2.1a. Based on these uncertainties, o
rg for the reaction is between -24.03 and
34.83. Therefore, the value for o
rg (-9.34 KJ/mol) obtained from linear regression (Table 2.1b)
is acceptable and within the expected range.
Figure 2.4: Chemical equilibrium constant Ka (▲) and the best fit of experimental data (solid
line), compared with estimation based on Eq. (2.2) and thermodynamic data (dashed line). (■) -
Ka for Runs 30-33.
Measured values of Ka were then used to calculate thermodynamic properties of the
reaction and were compared to that obtained using standard thermodynamic and heat capacity
data of individual components, given in Table 2.1b. The value of Ka decreases with increasing
temperature, showing the moderate exothermicity of the reaction. The temperature dependence
of the equilibrium constant which describes the best fit of the experimentally obtained
equilibrium constants can be expressed as follows:
-6
-5
-4
-3
-2
-1
0
1
2
2.4 2.5 2.6 2.7 2.8 2.9 3
ln(K
a)
1000/T (K-1)

28
Ka = exp (3600.5/T-8.7819) (R2=0.88) (2.4)
The heat of reaction obtained from experimental data is very close to that obtained from
standard thermodynamic data (Table 2.1b), showing the consistency of data used in this study.
Table 2.1a: Standard Enthalpies and Standard Gibbs Energies of Formation (1 atm, 298K)
Component o
fh (kJ/mol) o
fg (kJ/mol) Uncertainty inofg (kJ/mol)
Cyclohexene -38.22 103 ±10.3
Acetic acid -484.5 -389 ±11.67
Cyclohexyl acetate -553.4 -280.6 ±28.06
Table 2.1b: Standard Enthalpies and Standard Gibbs Energies of Reaction at 298K
Component o
rh (kJ/mol ) org (kJ/mol)
From heats of formation (Table 2.1a) -30.68 -24 to +34.8
From linear regression of experimental data -29.93 -8.17
2.4.2. Pseudo-Homogeneous (PH) kinetic model
Since the effects of mass transfer are negligible, a pseudo-homogeneous kinetic model
can be applied to this system according to Helfferich [21]. To account for the thermodynamic
non-ideality of the liquid solution in which reaction takes place, activity is used as a measure of
species concentration instead of mole fraction, with activity coefficients calculated using NRTL
model for binary components [22]. Although somewhat more complex to develop, activity-
based models generally provides a more accurate representation of species evolution during
reaction.
Cyclohexene (CHE) esterification with acetic acid (AA) to give cyclohexyl acetate
(CHA) can be represented by a single, reversible second order reaction.

29
CHE + AA CHA (2.5)
The rate constant for the reverse reaction can be represented as kr=kf/Ka, where Ka is the
equilibrium constant for esterification reaction.
The design equation for batch reactor is as follows,
Vrdt
dNi
i (2.6)
where ri has units of kmol/m3/min. In this reaction, two moles react to form only one
mole of product, thus decreasing the total number of moles in the system and also the total
volume of the system. Volume changes in the system were accounted for by assuming additivity
of individual volumes. To validate this assumption, known weights of CHE, AA and CHA were
mixed and resulting total volume was measured. Correlation between computed volume using Eq
(2.7) measured volumes is linear as shown in Figure A.2.
i
iNV
, where ρi is the molar density (2.7)
The pseudo-homogeneous rate law for any species i, in terms of mole fractions can be
written as,
x
CHAAACHEfcat
i
i
K
xxxkW
r
(2.8)
By taking nonideality of the system into account, reaction rate can be written as
kr
kf

30
a
CHAAACHEfcat
i
i
K
aaakW
r
; iii xa (2.9)
The temperature dependence of the rate constants can be expressed by the Arrhenius
equation.
RT
Ekk fo
ff exp (2.10)
Two kinetic parameters kof and Ef have to be determined to describe the reaction system.
2.4.2.1 Parameter evaluation
A second order Runge-Kutta method, ODE23 in MATLAB 7.0, was used to numerically
integrate the differential equations describing the formation and consumption of each species in
the system. Liquid phase mole fractions of all species were calculated over the course of each
reaction using an initial set of kinetic parameters and were compared to the experimental data.
Kinetic parameters were then optimized by minimizing the root mean square error between
experimental and calculated mole profiles in liquid phase (Ni) in all experiments according to
Eq. (2.11) below. A total of 25 experiments (Runs 1-25) containing 175 data points were fitted
to the kinetic rate expressions. A summary on reaction conditions of all the experiments and
corresponding molefraction profile comparison between experimental and predicted is given in
Appendix A.3.
runsspecies runs
erimental
i
predicted
i
n
NNF
2exp
2
min
)( (2.11)
The kinetic parameters that result in the lowest root mean square error of 1.45 for an
activity based pseudo-homogeneous models are given in Table 2.2.The calibration plots used in

31
quantification of components are presented in Appendix A.5. The NRTL parameters used to
calculate activity coefficients provided by Smith et al [22] are presented in Appendix A.6.
During kinetic parameter evaluation, the change in total weight of solution in each
experiment due to removal of small quantities as samples was not taken into account. In a typical
experiment, it was observed that Wcat increased by 6% by the end of the experiment as a result
of sample removal. Therefore, in this study, Wcat was changed by ± 6% and new kinetic
parameters were evaluated. It was observed that this change in Wcat did not change the Fmin and
also the resulting kinetic parameters were within ± 1% the results reported here. Therefore, in all
further studies, it is assumed that Wcat is constant throughout the reaction.
Table 2.2: Summary of reaction kinetic parameters
Parameter Value Units
k0 3.34E+12 (kmol.kgsoln)/(kgcat.min.m3)
Ef 88100 kJ/kmol
2.4.3. Kinetic model comparison with experiments
In this reaction system, as described in Section 2.4.2, the total number of moles is not
constant. Therefore, understanding stoichiometry of the system from mole fraction profiles can
be challenging in that molefraction of AA remains constant while AA is consumed. Even though
this can be overcome by showing the change in absolute moles of each component in the system
with time for all experiments, only mole fraction profiles are presented to keep uniformity
among all chapters in this work.

32
The plots in Figure 2.5 show the mole fraction profiles for experiments conducted at
temperatures from 373 to 393 K, keeping all other conditions the same. The model properly
predicts the increase in esterification rate with temperature, as well as the concentration of the
inert component in the reaction, CHX.
2.5(a)
Figure 2.5: Experimental and predicted mole fraction profiles of CHE esterification. (▲)- AA;
(×)- CHA; (■)- CHE; (♦)- CHX. Continuous lines represent the predicted mole fraction profiles.
a) Run 16: Temperature 373 K; initial mole ratio CHE:AA = 1:3; CHE:CHX = 5:1; catalyst
loading 0.02 kgcat/kg soln. b) Run 17: Temperature 383 K; initial mole ratio CHE:AA = 1:3;
CHE:CHX = 5:1; catalyst loading 0.02 kgcat/kg soln. c) Run 18: Temperature 393 K; initial
mole ratio CHE:AA = 1:3; CHE:CHX = 5:1; catalyst loading 0.02 kgcat/kg soln.
0
0.1
0.2
0.3
0.4
0.5
0.6
0.7
0.8
0 50 100 150 200 250
Mo
le f
ract
ion
Time (min)

33
Figure 2.5 (cont’d)
2.5(b)
0
0.1
0.2
0.3
0.4
0.5
0.6
0.7
0.8
0 50 100 150 200 250
Mole
fra
ctio
n
Time (min)
2.5(c)
0
0.1
0.2
0.3
0.4
0.5
0.6
0.7
0.8
0 50 100 150 200 250
Mole
fra
ctio
n
Time (min)

34
Figure 2.6 shows the predicted mole fraction profiles along with the experimental data at
different mole ratios of CHE to AA from 1:1 to 1:5. It is to be noted that this model does not take
into account CHE dimerization that occurs at temperatures above 373 K. The reaction conditions
that are more suitable for the side reaction and its effect on the solid acid catalysis discussed in
the next section.
.
0
0.1
0.2
0.3
0.4
0.5
0.6
0 500 1000 1500
Mole
fra
ctio
n
Time (min)
2.6(a)
Figure 2.6: Experimental and predicted mole fraction profiles of CHE esterification. (▲)- AA;
(×)- CHA; (■)- CHE; Continuous lines represent the predicted mole fraction profiles. a) Run 9:
Temperature 363 K; initial mole ratio CHE:AA = 1:1; catalyst loading 0.02 kgcat/kg soln. b)
Run 10: Temperature 363 K; initial mole ratio CHE:AA = 1:3; catalyst loading 0.02 kgcat/kg
soln. c) Run 11: Temperature 363 K; initial mole ratio CHE:AA = 1:5; catalyst loading 0.02
kgcat/kg soln.

35
Figure 2.6 (cont’d)
0
0.1
0.2
0.3
0.4
0.5
0.6
0.7
0.8
0 250 500 750 1000 1250
Mo
le f
ract
ion
Time (min)
2.6(b)
2.6(c)
2.4.4. Effect of cyclohexene dimerization on activity of Amberlyst 70
In addition to experiments for kinetic parameter evaluation, batch experiments with
higher initial CHE concentrations were carried out (Run 26-29) and side products were
0
0.1
0.2
0.3
0.4
0.5
0.6
0.7
0.8
0.9
0 250 500 750 1000 1250
Mo
le f
ract
ion
Time (min)

36
quantified by stoichiometry. Initial mole ratio of CHE:AA was maintained at 5:1 and 3:1 and
temperature was maintained at 373 K and 403K in these experiments. It is assumed that CHE
oligomerization is an irreversible reaction. Figure 2.7 shows the mole profile of components in
the reaction mixture including the side products for Run 27. Oligomer formation follows a
straight line, justifying the assumption of an irreversible reaction.
Figure 2.7: Cyclohexene dimer formation during esterification reaction. Straight line represents
the best fit for side product formation. (■) Acetic acid; (▲) Cyclohexyl acetate; (♦)
Cyclohexene;(×) Cyclohexene dimer. Reaction conditions: Temperature 403 K, Initial mole
ratio CHE to AA = 3:1 and catalyst loading 0.02 kgcat/kg soln.
To determine whether oligomers of CHE deposit inside the pores of the catalyst and
deactivate it, a control batch experiment with known amount of Amberlyst 70 catalyst at 403 K
and cyclohexene was carried out for 72 hours. A sample taken after 48 hours from this reaction
was analyzed by mass spectrometer to identify the oligomers. It was found that CHE dimers, 1-
0
0.1
0.2
0.3
0.4
0.5
0.6
0.7
0.8
0 500 1000 1500 2000
Mole
fra
ctio
n
Time (min)

37
cyclohexyl-cyclohexene and 3-cyclohexyl-cyclohexene, along with 1,1'-oxybis-cyclohexane
(Dicyclohexyl ether), were the major products from this reaction. Trace amounts of water present
inside the pores of Amberlyst 70 and 85 ppm of water in the feed CHE catalyst must be
responsible for the formation of dicyclohexyl ether. A chromatogram showing retention time of
dimers along with their chemical structures and corresponding mass spectra are given in
Appendix A.4. This result is in agreement with observations found in literature, that CHE
dimerization is the predominant reaction in oligomerization of CHE [14].
After the reaction, the catalyst was washed with ethanol and dried at 378 K under
vacuum for 12 hours. It was observed that the catalyst weight increased by 15%, evidence to
polymer deposition in the pores of Amberlyst 70 catalyst. The activity of this catalyst determined
by titration was 1.8 eq/kg compared to 2.4 eq/kg of fresh catalyst. This catalyst, upon testing in
esterification at 363 K and an initial mole ratio of CHE to AA 1:1, showed a slightly decreased
TON (8.2 kmol CHE/kmol H+/hr) compared to the TON of 9.2 kmol CHE/kmol H
+/hr when
fresh. A negligible amount of CHE oligomers were observed in batch reactor experiments at 353
and 363 K with 1:5 initial mole ratio of AA to CHE (Runs 28, 29). Therefore, it can be
concluded that CHE dimerization reaction occurs at very high mole ratios of CHE and at higher
reaction temperatures. For this reason, while considering reactive distillation for the production
CHA from CHE and AA, care must be taken to avoid reaction conditions in the column that suit
CHE dimerization reaction which deactivates the catalyst.
2.4.5. Effect of water on the activity of Amberlyst 70
The esterification of AA with CHE is in theory a water-free reaction. However, glacial
acetic acid and cyclohexene used in the batch experiments in this study contain 620 and 85ppm
of water, respectively. Since water molecules are involved in competitive adsorption onto the

38
active sites on catalyst along with the reactants, it is important to study the effect of water on the
catalytic activity of Amberlyst 70 for this reaction.
Six batch reactions with increasing initial water concentration were carried out and TON
for each reaction was calculated using Eq 2.1.
As seen in Figure 2.8, the TON decreases rapidly
with increasing initial water concentration on from 0.01M to 0.07M. For reactions catalyzed by
strong ion exchange resins like Amberlyst 70, small amounts of water are preferentially adsorbed
onto –SO3H groups. This competitive adsorption decreases the strength and number of acid sites
available for the desired reaction. This is responsible for drastic decrease in TON. At higher
concentrations of water, according to Gates et al.[23], reaction is catalyzed by hydrated protons
and reaction rate becomes constant with increasing water concentration. This is in agreement
with the results shown in Figure 2.8: as the water concentration is raised from 0.07M to 0.13M,
the TON is almost a constant. For reactive distillation, it is thus desirable that water content in
the reactants is as low as possible for CHA production from CHE and an overhead decanter
along with condenser is recommended for removal of water.
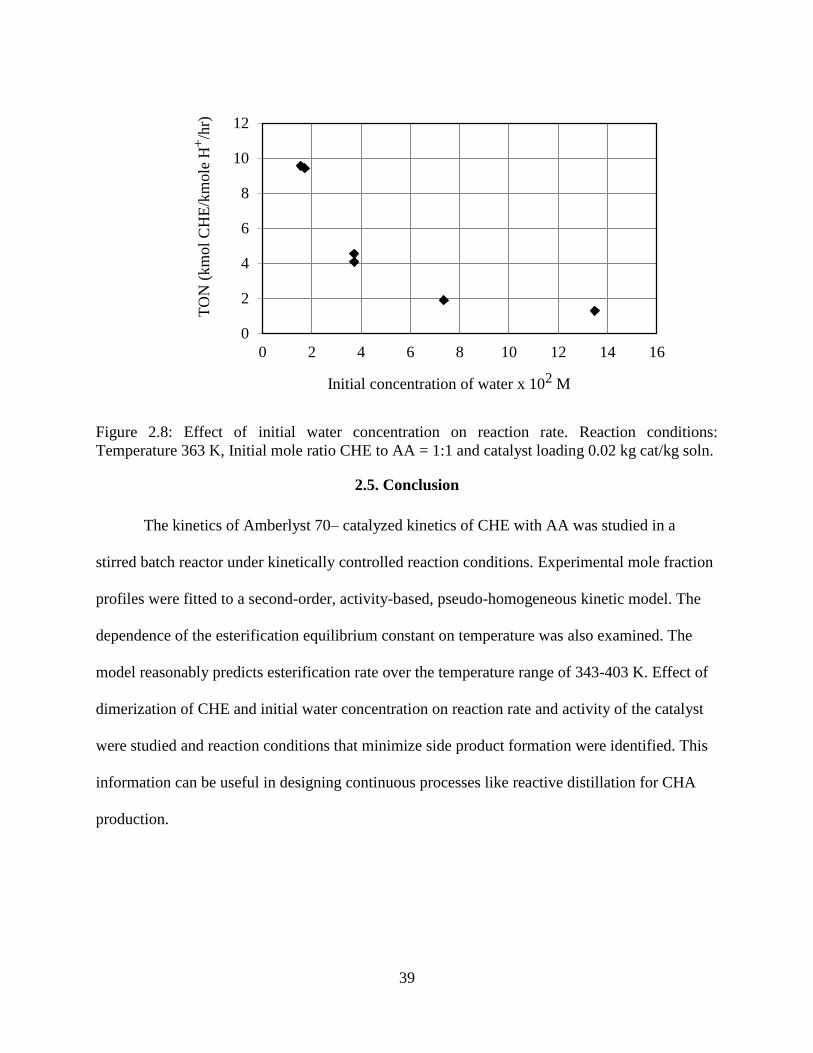
39
Figure 2.8: Effect of initial water concentration on reaction rate. Reaction conditions:
Temperature 363 K, Initial mole ratio CHE to AA = 1:1 and catalyst loading 0.02 kg cat/kg soln.
2.5. Conclusion
The kinetics of Amberlyst 70– catalyzed kinetics of CHE with AA was studied in a
stirred batch reactor under kinetically controlled reaction conditions. Experimental mole fraction
profiles were fitted to a second-order, activity-based, pseudo-homogeneous kinetic model. The
dependence of the esterification equilibrium constant on temperature was also examined. The
model reasonably predicts esterification rate over the temperature range of 343-403 K. Effect of
dimerization of CHE and initial water concentration on reaction rate and activity of the catalyst
were studied and reaction conditions that minimize side product formation were identified. This
information can be useful in designing continuous processes like reactive distillation for CHA
production.
0
2
4
6
8
10
12
0 2 4 6 8 10 12 14 16
TO
N (
km
ol
CH
E/k
mo
le H
+/h
r)
Initial concentration of water x 102 M

40

41
APPENDIX A

42
2.6. Appendix A
A.1: Internal and external mass transfer resistance
(a)
Figure A.1a: Effect of agitation speed on reaction rate. (□)-400 rpm; (×)-550 rpm; (∆)-800 rpm;
(▲)-1160 rpm; Reaction conditions: Temperature 363 K; initial mole ratio CHE:AA = 1:1;
catalyst loading 0.02 kgcat/kg soln.
0
0.1
0.2
0.3
0.4
0.5
0.6
0 50 100 150 200 250 300 350
Mo
le f
ract
ion
CH
E
Time (min)

43
(b)
Figure A.1b: Effect of catalyst particle size on reaction rate. (▲)-dp<150μm; (■)-
250<dp<590μm; (□)-dp>590μm. Reaction conditions: Temperature 363 K; initial mole ratio
CHE :AA = 1:1; catalyst loading 0.02 kgcat/kg soln.
A.2: The additivity of volumes assumption:
Theoretical and measured volumes from Table A.2b were used in a parity plot to verify
the additivity of volumes assumption is shown in Figure A.2. The measured volumes were only
1.5% higher than theoretical volume (from best fit of the data R2=0.98). This difference is small
enough that additivity of volumes can be assumed.
Table A.2a: Component molecular weight and density information
component
Molecular
weight
kg/kmol
density
kg/L
Molar density
kmol/L
CHE 82.14 0.811 0.00987
AA 60.05 1.049 0.01746
CHA 142.2 0.97 0.00682
0
0.1
0.2
0.3
0.4
0.5
0.6
0 50 100 150 200 250
Mole
fra
ctio
n C
HE
Time (min)

44
Table A.2b: Component individual weight and volume measurement
weight
CHE
(gm)
weight AA
(gm)
weight
CHA (gm)
Volume
Theoretical
Eq.(2.7)
Volume
measured error %
10.00 4.99 5.01 22.2 22.6 1.5
5.03 10.00 5.01 20.9 21.4 2.3
5.04 5.02 10.01 21.3 21.6 1.3
12.01 5.01 3.01 22.6 23 1.3
3.00 12.01 5.00 20.2 20.6 1.4
5.10 3.01 12.02 21.5 21.7 0.7
7.01 7.00 5.99 21.4 21.8 1.4
8.02 8.09 4.02 21.7 22.2 2.0
4.01 8.04 8.00 20.8 21.1 1.1
8.09 4.03 7.99 22.0 22.3 1.1
Figure A.2: Parity plot for verification of additivity of volumes assumption
20
20.5
21
21.5
22
22.5
23
23.5
20 20.5 21 21.5 22 22.5 23 23.5
Mea
sure
d m
ixtu
re v
olu
me
Theroretical mixture volume calculated using Eq (2.7)

45
A.3: Summary of batch reactor experiments
In this section a summary of all batch reactor experiments used to characterize reaction kinetics
of CHE esterification with AA is presented. Table A.3.1 shows the reaction conditions of the
batch experiments. In Figures A.3.1 to A.3.22 continuous lines represent predicted mole fraction
profiles and data points represent experimental data.
Table A.3.1 Summary of batch experiments with Amberlyst 70 as catalyst
Run
Temperature
(K)
Mass
% of
catalyst
Wcat
Duration
(hr)
Initial mole
ratio
AA :CHE
Initial
mole
ratio
CHE:
CHX
Total
initial
moles
Total
initial
volume
(cc)
Figure
number
1 373.15 2 21 4 0.88 58 A.3.1
2 383.15 2 21 4 0.88 58 A.3.2
3 393.15 2 21 4 0.88 58 A.3.3
4 403.15 2 21 4 0.88 58 A.3.4
5 393.15 2 23 1 0.78 62 A.3.5
6 393.15 2 4 3 0.88 60.2 A.3.6
7 393.15 2 24 5 0.91 58.5 A.3.7
8 393.15 4 24 4 0.88 58 A.3.8
9 363.15 2 48 1 0.78 61.5 2.6a
10 363.15 2 48 3 0.89 60.3 2.6b
11 363.15 2 23 5 0.92 59.5 2.6c
12 363.15 1 23 3 0.89 60.3 A.3.9
13 363.15 4 23 3 0.89 60.3 A.3.10
14 353.15 2 5 3 0.89 60.3 A.3.11
15 343.15 2 5 3 0.89 60.3 A.3.12

46
Table A.3.1 (cont’d)
16 373.15 2 3.5 3 5 0.83 58.6 2.5a
17 383.15 2 3.5 3 5 0.83 58.2 2.5b
18 393.15 2 3.5 3 5 0.83 58 2.5c
19 403.15 2 3.5 3 5 0.83 58.1 A.3.13
20 393.15 2 3.5 1.2 5 0.77 61.8 A.3.14
21 393.15 2 3.5 5 5 0.86 57 A.3.15
22 363.15 2 3.5 0.2 0.70 58 A.3.16
23 363.15 2 24 0.35 0.74 58 A.3.17
24 353.15 2 72 0.2 0.70 58 A.3.18
25 353.15 2 72 0.33 0.73 58 A.3.19
26 403.15 2 24 0.2 0.7 58 A.3.20
27 403.15 2 24 0.33 0.732 58 2.7
28 373.15 2 72 0.2 0.7 58 A.3.21
29 373.15 2 72 0.33 0.731 58 A.3.22
Run
Temperature
(K)
Mass
% of
catalyst
Wcat
Duration
(hr)
Initial mole
ratio
AA :CHA
Initial
mole
ratio
CHE:
CHX
Total
initial
moles
Total
initial
volume
(cc)
Figure
number
30 363.15 2.8 94 3 0.71 56.7 A.3.23
31 363.15 2.8 94 3 0.71 56.7 A.3.24
32 353.15 2.8 94 1.8 0.64 56.8 A.3.25
33 353.15 2.8 72 1.8 0.64 56.8 A.3.26

47
0
0.1
0.2
0.3
0.4
0.5
0.6
0.7
0.8
0.9
0 500 1000 1500 2000 2500 3000
Mo
lefr
acti
on
Time (min)
Figure A.3.1: Experimental and predicted mole fraction profiles of CHE esterification for Run1.
(▲)- AA; (×)- CHA; (■)- CHE.
0
0.1
0.2
0.3
0.4
0.5
0.6
0.7
0.8
0.9
0 500 1000 1500 2000 2500 3000
Mo
lefr
acti
on
Time (min)
Figure A.3.2: Experimental and predicted mole fraction profiles of CHE esterification for Run 2.
(▲)- AA; (×)- CHA; (■)- CHE.

48
Figure A.3.3: Experimental and predicted mole fraction profiles of CHE esterification for Run 3.
(▲)- AA; (×)- CHA; (■)- CHE.
Figure A.3.4: Experimental and predicted mole fraction profiles of CHE esterification for Run 4.
(▲)- AA; (×)- CHA; (■)- CHE.
0
0.1
0.2
0.3
0.4
0.5
0.6
0.7
0.8
0.9
0 500 1000 1500 2000 2500 3000
Mo
lefr
acti
on
Time (min)
0
0.1
0.2
0.3
0.4
0.5
0.6
0.7
0.8
0.9
0 500 1000 1500 2000 2500 3000
Mo
lefr
acti
on
Time (min)

49
Figure A.3.5: Experimental and predicted mole fraction profiles of CHE esterification for Run 5.
(▲)- AA; (×)- CHA; (■)- CHE.
Figure A.3.6: Experimental and predicted mole fraction profiles of CHE esterification for Run 6.
(▲)- AA; (×)- CHA; (■)- CHE.
0
0.1
0.2
0.3
0.4
0.5
0.6
0 50 100 150 200 250
Mole
frac
tion
Time (min)
0
0.1
0.2
0.3
0.4
0.5
0.6
0.7
0.8
0 50 100 150 200 250
Mo
lefr
acti
on
Time (min)

50
Figure A.3.7: Experimental and predicted mole fraction profiles of CHE esterification for Run 7.
(▲)- AA; (×)- CHA; (■)- CHE.
Figure A.3.8: Experimental and predicted mole fraction profiles of CHE esterification for Run 8.
(▲)- AA; (×)- CHA; (■)- CHE.
0
0.1
0.2
0.3
0.4
0.5
0.6
0.7
0.8
0.9
1
0 50 100 150 200 250
Mole
frac
tion
Time (min)
0
0.1
0.2
0.3
0.4
0.5
0.6
0.7
0.8
0.9
0 50 100 150 200 250
Mole
frac
tion
Time (min)

51
Figure A.3.9: Experimental and predicted mole fraction profiles of CHE esterification for Run
12. (▲)- AA; (×)- CHA; (■)- CHE.
Figure A.3.10: Experimental and predicted mole fraction profiles of CHE esterification for Run
13. (▲)- AA; (×)- CHA; (■)- CHE.
0
0.1
0.2
0.3
0.4
0.5
0.6
0.7
0.8
0.9
0 500 1000 1500
Mole
frac
tion
Time (min)
0
0.1
0.2
0.3
0.4
0.5
0.6
0.7
0.8
0 500 1000 1500
Mo
lefr
acti
on
Time (min)

52
Figure A.3.11: Experimental and predicted mole fraction profiles of CHE esterification for Run
14. (▲)- AA; (×)- CHA; (■)- CHE.
Figure A.3.12: Experimental and predicted mole fraction profiles of CHE esterification for Run
15. (▲)- AA; (×)- CHA; (■)- CHE.
0
0.1
0.2
0.3
0.4
0.5
0.6
0.7
0.8
0 200 400 600 800 1000 1200 1400
Mole
frac
tion
Time (min)
0
0.1
0.2
0.3
0.4
0.5
0.6
0.7
0.8
0.9
0 200 400 600 800 1000 1200 1400
Mole
frac
tion
Time (min)

53
0
0.1
0.2
0.3
0.4
0.5
0.6
0.7
0.8
0 50 100 150 200
Mole
frac
tion
Time (min)
Figure A.3.13: Experimental and predicted mole fraction profiles of CHE esterification for Run
19. (▲)- AA; (×)- CHA; (■)- CHE.
0
0.1
0.2
0.3
0.4
0.5
0.6
0 50 100 150 200
Mo
lefr
acti
on
Time (min)
Figure A.3.14: Experimental and predicted mole fraction profiles of CHE esterification for Run
20. (▲)- AA; (×)- CHA; (■)- CHE.

54
0
0.1
0.2
0.3
0.4
0.5
0.6
0.7
0.8
0.9
0 50 100 150 200 250
Mole
frac
tion
Time (min)
Figure A.3.15: Experimental and predicted mole fraction profiles of CHE esterification for Run
21. (▲)- AA; (×)- CHA; (■)- CHE.
Figure A.3.16: Experimental and predicted mole fraction profiles of CHE esterification for Run
22. (▲)- AA; (×)- CHA; (■)- CHE.
0
0.1
0.2
0.3
0.4
0.5
0.6
0.7
0.8
0.9
0 50 100 150 200 250
Mole
frac
tion
Time (min)

55
Figure A.3.17: Experimental and predicted mole fraction profiles of CHE esterification for Run
23. (▲)- AA; (×)- CHA; (■)- CHE.
Figure A.3.18: Experimental and predicted mole fraction profiles of CHE esterification for Run
24. (▲)- AA; (×)- CHA; (■)- CHE.
0
0.1
0.2
0.3
0.4
0.5
0.6
0.7
0.8
0 200 400 600 800 1000 1200 1400
Mole
frac
tion
Time (min)
0
0.1
0.2
0.3
0.4
0.5
0.6
0.7
0.8
0.9
0 50 100 150 200 250 300
Mo
lefr
acti
on
Time (min)

56
Figure A.3.19: Experimental and predicted mole fraction profiles of CHE esterification for Run
25. (▲)- AA; (×)- CHA; (■)- CHE.
Figure A.3.20: Experimental mole fraction profiles of CHE esterification for Run 26. (▲) CHA;
(■) AA; (♦) CHE;(×) CHE oligomers. Straight line represents the best fit for side product
formation.
0
0.1
0.2
0.3
0.4
0.5
0.6
0.7
0.8
0 50 100 150 200 250
Mo
lefr
acti
on
Time (min)
0
0.1
0.2
0.3
0.4
0.5
0.6
0.7
0.8
0.9
0 200 400 600 800 1000 1200 1400 1600
Mole
fra
ctio
n
Time (min)

57
0
0.1
0.2
0.3
0.4
0.5
0.6
0.7
0.8
0.9
0 50 100 150 200 250 300
Mo
le f
ract
ion
Time (min)
Figure A.3.21: Experimental mole fraction profiles of CHE esterification for Run 28. (▲) CHA;
(■) AA; (♦) CHE; (×) CHE oligomers. Straight line represents the best fit for side product
formation.
Figure A.3.22: Experimental mole fraction profiles of CHE esterification for Run 29. (▲) CHA;
(■) AA; (♦) CHE; (×) CHE oligomers. Straight line represents the best fit for side product
formation.
0
0.1
0.2
0.3
0.4
0.5
0.6
0.7
0.8
0 50 100 150 200 250 300
Mo
le f
ract
ion
Time (min)

58
Figure A.3.23: Experimental mole fraction profiles for Run 30. (▲) AA; (■) CHA (♦) CHE.
Figure A.3.24: Experimental mole fraction profiles for Run 31. (▲) AA; (■) CHA (♦) CHE.
0
0.1
0.2
0.3
0.4
0.5
0.6
0.7
0.8
0.9
0 20 40 60 80 100
Mo
lefr
acti
on
Time (hr)
0
0.1
0.2
0.3
0.4
0.5
0.6
0.7
0.8
0.9
0 20 40 60 80 100
Mo
lefr
acti
on
Time (hr)

59
Figure A.3.25: Experimental mole fraction profiles for Run 32. (▲) AA; (■) CHA (♦) CHE.
Figure A.3.26: Experimental mole fraction profiles for Run 33. (▲) AA; (■) CHA (♦) CHE.
0
0.1
0.2
0.3
0.4
0.5
0.6
0.7
0.8
0 20 40 60 80 100
Mo
lefr
acti
on
Time (hr)
0
0.1
0.2
0.3
0.4
0.5
0.6
0.7
0.8
0 20 40 60 80
Mo
lefr
acti
on
Time (hr)

60
A.3: Identification of Cyclohexene oligomers
Figure A.4.1 shows retention time of CHE dimer peaks along with their structures in a
gas chromatogram. Figures A.4.2, A.4.3 and A.4.4 show the mass spectra for 1-cyclohexyl
cyclohexene, 3-cyclohexyl cyclohexene and 1,1’-oxybis cyclohexane respectively. It is to be
noted here that mass spectrometry was used only for identification of CHE dimers.
Figure A.4.1: Chromatogram for CHE dimer identification
0.0E+00
1.0E+05
2.0E+05
3.0E+05
4.0E+05
5.0E+05
6.0E+05
7.0E+05
8.0E+05
9.0E+05
1.0E+06
19 19.1 19.2 19.3 19.4 19.5 19.6
Res
ponse
Retention time (min)
Cyclohexene,1-cyclohexyl-
Cyclohexene,3-cyclohexyl-Cyclohexene,3-cyclohexyl-
Cyclohexane, 1,1'-oxybis-

61
Figure A.4.2: Mass spectra for 1-cyclohexyl cyclohexene
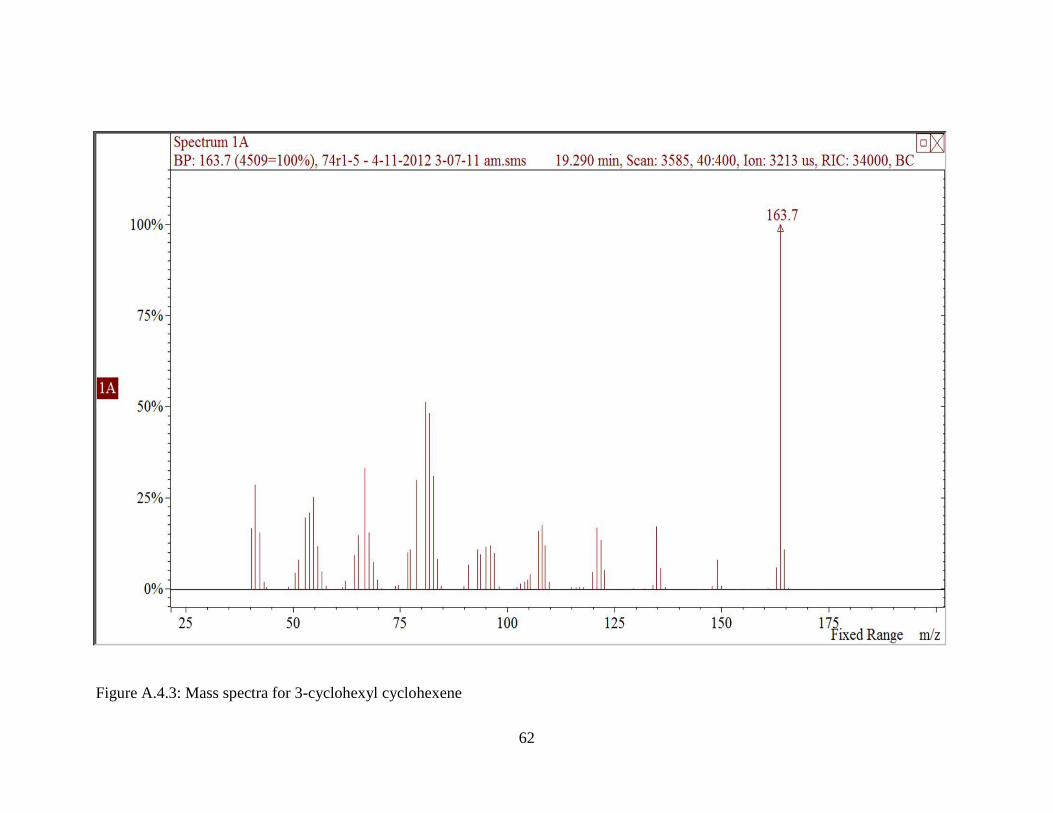
62
Figure A.4.3: Mass spectra for 3-cyclohexyl cyclohexene

63
Figure A.4.4: Mass spectra for 1,1’-oxybis cyclohexane

64
A.5: Calibration plots for sample analysis
Reaction samples were diluted in 1-Butanol with 5 wt% 1,4 Dioxane (1-BuOH+14D)
solvent. To determine the weight of each component in the reaction sample, individual
calibrations were carried out. Measured quantity of each component was mixed with known
amount of solvent such that the component is 10% by weight in the solution. The calibration
samples were made to cover the whole range of mass fraction that is expected in the reaction
samples. These samples were analyzed in gas chromatograph as described in Section 2.3. From
the chromatograms, area for each component is obtained. From this data, area for a known
weight of component and area for fixed amount of 14D is known. The ratio of area of component
to that of 14D is plotted against the ratio of known weight of component to that of 14D. This plot
is typically a straight line passing through the origin. The slope of this line is the “calibration
factor”.
Weight of individual components is unknown in reaction samples. From the
chromatograms, area of 14D and areas of individual component are obtained. Weight of 14D is
known from the amount solvent used to dilute the reaction sample. Using the calibration factor
for each component, weight of the component is obtained. Figures A.5.1 to A.5.3 show the
calibration plots used in this study.

65
Figure A.5.1: calibration plot for Cyclohexene (CHE)
Figure A.5.2: calibration plot for Acetic acid (AA)
y = 0.3977x
R² = 0.9636
0
0.5
1
1.5
2
2.5
3
0 2 4 6 8
Wei
ght
rati
o C
HE
/14D
Area ratio CHE/14D
y = 2.1211x
R² = 0.9667
0
0.5
1
1.5
2
0 0.2 0.4 0.6 0.8
Wei
gh
t ra
tio
AA
/14
D
Area ratio AA/14D

66
Figure A.5.3: calibration plot for Cyclohexyl acetate (CHA)
A.6: NRTL parameters
The NRTL-HOC parameters used in Chapters 2 and 3 to calculate activity coefficients
are presented in Tables A.6.1 and A.6.2 [22].
Table A.6.1: HOC parameters used in Aspen simulations
AA CHA CHE W
AA 4.5 2 0 2.5
CHA 2 0.53 0
CHE 0 0 0
W 2.5 1.7
y = 0.4891x
R² = 0.9713
0
0.5
1
1.5
2
2.5
0 1 2 3 4 5
Wei
gh
t ra
tio
CH
A/1
4D
Area ratio CHA/14D

67
Table A.6.2: NRTL parameters used in Aspen simulationsa
Component
i CHE CHA AA CHE AA CHA CHE AA W CHX
Component
j AA CHE CHA CHX CHX CHX W W CHA W
Temperature
units K K K K K K K K K K
Source USER USER USER USER USER USER USER
APV71
VLE-HOC USER
APV71 LLE-
ASPEN
aij 0
-
0.06041
0.62514
6 0 0
2.06657
8 0 -1.9763
6.90004
6 -10.4585
aji 0 10.6828 0.12857 0 0 -2.65123 0 3.3293 3.59808 13.1428
bij
277.36071
2
-
390.093 0 4.2466 601.80 -1334.89 1626.49 609.8886 0 4954.897
bji 584.03308
-
3091.04 0 4386.49 678.993 2029.09 2585.47 -723.888 0 -1066.98
cij 0.3 0.3 1 0.89828 0.5 0.3 0.24319 0.3 0.31077 0.2
Tlower 0 0 0 0 351.95 0 0 293.15 0 283.15
Tupper 1000 1000 1000 1000 391.25 1000 1000 502.9 1000 326.15
a: APV71 refers to Aspen Plus Version 7.1

68
REFERENCES

69
2.7. References
1. Musser, M.T., Cyclohexanol and Cyclohexanone. Ullmann's Encyclopedia of Industrial
Chemistry. 2000: Wiley-VCH Verlag GmbH & Co. KGaA.
2. Steyer, F., H.r. Freund, and K. Sundmacher, A Novel Reactive Distillation Process for the
Indirect Hydration of Cyclohexene to Cyclohexanol Using a Reactive Entrainer.
Industrial & Engineering Chemistry Research, 2008. 47(23): p. 9581-9587.
3. Sharma, M.M., Some novel aspects of cationic ion-exchange resins as catalysts. Reactive
and Functional Polymers, 1995. 26(1-3): p. 3-23.
4. Saha, B. and M. Mohan Sharma, Esterification of formic acid, acrylic acid and
methacrylic acid with cyclohexene in batch and distillation column reactors: ion-
exchange resins as catalysts. Reactive and Functional Polymers, 1996. 28(3): p. 263-278.
5. Katariya, A., H.r. Freund, and K. Sundmacher, Two-Step Reactive Distillation Process
for Cyclohexanol Production from Cyclohexene. Industrial & Engineering Chemistry
Research, 2009. 48(21): p. 9534-9545.
6. Steyer, F., Z. Qi, and K. Sundmacher, Synthesis of cylohexanol by three-phase reactive
distillation: influence of kinetics on phase equilibria. Chemical Engineering Science,
2002. 57(9): p. 1511-1520.
7. Steyer, F. and K. Sundmacher, VLE and LLE Data for the System Cyclohexane +
Cyclohexene + Water + Cyclohexanol. Journal of Chemical & Engineering Data, 2004.
49(6): p. 1675-1681.
8. Steyer, F. and K. Sundmacher, VLE and LLE Data Set for the System Cyclohexane +
Cyclohexene + Water + Cyclohexanol + Formic Acid + Formic Acid Cyclohexyl Ester.
Journal of Chemical & Engineering Data, 2005. 50(4): p. 1277-1282.
9. Steyer, F. and K. Sundmacher, Cyclohexanol Production via Esterification of
Cyclohexene with Formic Acid and Subsequent Hydration of the EsterReaction Kinetics.
Industrial & Engineering Chemistry Research, 2007. 46(4): p. 1099-1104.

70
10. Kumar, R., et al., Development of a Novel Catalytic Distillation Process for
Cyclohexanol Production: Mini Plant Experiments and Complementary Process
Simulations. Organic Process Research & Development, 2011. 15(3): p. 527-539.
11. Chakrabarti, A. and M.M. Sharma, Cyclohexanol from cyclohexene via cylohexyl acetate
- catalysis by ion-exchange resin and acid treated clay. Reactive Polymers, 1992. 18(2):
p. 107-115.
12. Verevkin, S.P., et al., Equilibrium of chemical-transformations in the system of
carboxylic acid-olefin-ester. Journal of Applied Chemistry of the Ussr, 1992. 65(3): p.
536-541.
13. Siril, P.F., H.E. Cross, and D.R. Brown, New polystyrene sulfonic acid resin catalysts
with enhanced acidic and catalytic properties. Journal of Molecular Catalysis A:
Chemical, 2008. 279(1): p. 63-68.
14. Bringué, R., Roger, et al., Thermally stable ion-exchange resins as catalysts for the
liquid-phase dehydration of 1-pentanol to di-n-pentyl ether (DNPE). Journal of Catalysis,
2006. 244(1): p. 33-42.
15. Bringué, R., et al., Water effect on the kinetics of 1-pentanol dehydration to di-n-pentyl
ether (DNPE) on amberlyst 70. Topics in Catalysis, 2007. 45(1): p. 181-186.
16. Ronchin, L., G. Quartarone, and A. Vavasori, Kinetics and mechanism of acid catalyzed
alkylation of phenol with cyclohexene in the presence of styrene divinylbenzene sulfonic
resins. Journal of Molecular Catalysis A: Chemical, 2011. 353-354(0): p. 192-203.
17. Yadav, G.D. and P.K. Goel, Selective synthesis of perfumery grade cyclohexyl esters
from cyclohexene and carboxylic acids over ion exchange resins: an example of 100%
atom economy. Green Chemistry, 2000. 2(2): p. 71-78.
18. http://www.amberlyst.com/literature/a4/70.pdf. Accessed on 5/22/2012.
19. DIPPRR Data Compilation of Pure Chemical Properties. 2011, Design Institute for
Physical Properties, AIChE, New York, NY. 2011.
20. Elliott, R.J. and C.T. Lira, Introductory Chemical Engineering Thermodynamics. Second
ed. 2009, Boston: Prentice Hall.

71
21. Helfferich, F.G., Ion exchange. 1st ed. 1962, New York McGraw Hill.
22. Alex Smith, A.K., Carl T.Lira, Dennis J. Miller, Phase equilibrium data for cyclohexene,
acetic acid system, Manuscript in preparation, Michigan State University.
23. Gates, B.C. and W. Rodriguez, General and specific acid catalysis in sulfonic acid resin.
Journal of Catalysis, 1973. 31(1): p. 27-31.

72
Chapter 3: Cyclohexyl acetate production using reactive distillation: Pilot plant
experiments and simulations
3.1. Summary
Cyclohexyl acetate production using reactive distillation can be an intermediate step
during cyclohexanol production by indirect hydration of cyclohexene using acetic acid as
reactive entrainer. In this study, pilot scale runs in the MSU reactive distillation facility were
conducted to demonstrate technical feasibility of this intermediate step and exemplify the
opportunities for external heat integration in a continuous reactive distillation operation. All
experiments were conducted at atmospheric pressure in a 6 m tall, 51 mm ID pilot-scale glass
column packed with KATAPAK-SP11 structured packing containing Amberlyst 70 cation
exchange resin as catalyst. Based on preliminary runs, process configuration and conditions
suitable for high conversions of cyclohexene are suggested. The experimental data obtained at
steady state were compared with results obtained from simulations performed using RADFRAC
column module in Aspen Plus.
3.2. Introduction
Process intensification (PI) uses engineering principles to develop sustainable processing
technologies that are simpler, more energy efficient, less waste producing and lower cost [1-3].
PI can be achieved by combining functions or phenomena in an operation, adding or enhancing
targeted functions in a process, and/or by using alternative energy sources to enhance
performance. One such PI technique is reactive distillation (RD), which integrates chemical
reaction and physical separation into one unit operation. The use of RD to produce high purity
methyl acetate [4] and the production of methyl tert-butyl ether (MTBE) [5] are perhaps the best

73
known commercial applications of PI to improve energy efficiency. Freund et al., reviewed the
processes that offer an opportunity for application of RD as a PI technique [6, 7]. Cyclohexanol
production from benzene by partial hydrogenation to cyclohexene (herein, CHE) and then
hydration is one such process where RD can be used to decrease energy consumption and capital
expenditures.
Indirect hydration is a novel RD approach to produce cyclohexanol from CHE [8, 9] in
high yields. In this process, a carboxylic acid is used as a reactive entrainer. CHE is first
esterified with the carboxylic acid to produce a cyclohexyl ester in the first RD column. In a
second RD column, the ester is hydrolyzed to liberate the free carboxylic acid, which can be
recycled back to the first RD column, and cyclohexanol. Steyer et al and Kumar et al. [10-13]
have demonstrated the technical feasibility of producing cyclohexanol from CHE and formic
acid using mini plant experiments, and developed a process simulation model that represents
steady state experimental data. Apart from safety and energy efficiency, this method offers the
additional advantage of separating CHE from cyclohexane, an undesired product of benzene
hydrogenation. Cyclohexane does not participate in the esterification reaction and can be isolated
and collected as the top product from the first RD column. This eliminates the extractive
distillation step required to separate the mixture of CHE and cyclohexane in other approaches
employing benzene hydrogenation [14, 15].
To enhance energy efficiency, using the heat of reaction to drive separation must be taken
into account during the conceptual stages of designing a particular RD process [16]. This internal
heat utilization can be quantified as the thermal effect of a reaction (ξ), a dimensional number
first introduced by Sundmacher et al. [17]. Thermal effect is defined as the heat of reaction
divided by the mean heat of vaporization.

74
N
j
L
jvj
Lo
R
Hx
H
1
, )(
)(
where j=1,N number of components in the reaction (3.1)
CHE esterification with acetic acid is an exothermic reaction with a thermal effect of ξ =
1.04 (equilibrium mole fraction data taken from a batch experiment at 90°C was used in this
calculation). For reactions with moderate thermal effects (0.05≤ξ≤1.0), feed stage location plays
a significant role in determining the energy efficiency of a RD column [18]. For exothermic
reactions, it is also important to evaluate heat transfer effects from the section of the column
where most of the reaction takes place to sections where energy is most needed (e.g. where there
is less reaction).
This study focuses on the first part of the indirect hydration approach using acetic acid
(herein, AA) as the reactive entrainer. Pilot scale experiments to evaluate the feasibility of CHE
esterification with AA and establish steady state operation were first performed under different
process conditions. Further experiments were then conducted to demonstrate the effect of heat
loss from a section of the RD column at steady state as a first step in implementing heat
integration in the reaction system. Using process simulation, the effect of heat addition or loss
from a section of the column and the effect of heat transfer from one of column to another on
CHE conversion was studied and compared to the experimental results obtained. Based on the
results and challenges encountered during pilot plant runs and simulations, suitable process
conditions for RD operation are suggested.
3.3. Materials and Methods
Acetic acid (>99.7%, glacial) was purchased from VWR scientific. Cyclohexene (>99%)
was obtained from Alfa Aesar. Cyclohexyl acetate (>99%) and 1,4-dioxane (>99%) were

75
obtained from Sigma-Aldrich. 1-Butanol, which was used as solvent during sample analysis, was
obtained from Mallinckrodt-Baker, Inc. Amberlyst 70 resin was purchased from the Dow
Chemical Company.
Samples were analyzed using a HP-5890 Series II gas chromatograph equipped with a
flame ionization detector (FID). A 30m length, 0.53mm ID, 1.0µm film thickness Aquawax-DA
column was used to separate the components. Oven temperature maintained initially at 40C for
1.0 min, increased at 20C/min to 250C, and then maintained at that temperature for an
additional 2.0 min. Injector and detector temperatures were maintained at 250C and 300C
respectively. 1,4-Dioxane was used as internal standard. To identify cyclohexene dimers, a
Varian CP-3800 gas chromatograph equipped with Saturn 2000 mass spectrometer was used. A
fused silica capillary column SLB™-5ms:30m× 0.25mm × 0.25µm film thickness was used to
separate the components. Water content in the reactants was analyzed using Hydranal-coulomat
E solution in a coulometric AQ-2100 Karl-Fisher titrator.
To determine the catalytic activity by titration, catalyst packing was soaked in 1M NaCl
solution in water for 2 hours and then titrated using 0.1M NaOH solution. Catalyst reactivation
was done by soaking the catalyst packing in 5% by weight sulfuric acid in water for 12 hours and
then washing with deionized water till pH of the washed liquid was at least 5.0. A fresh catalyst
packing was titrated to obtain an activity value of 2.7 eq/kg.cat.
3.3.1 Reactive distillation column configuration and operating procedure
A schematic of the reactive distillation column for cyclohexyl acetate (herein, CHA)
production from CHE and AA is shown in Figure 3.1. The experimental setup comprises a glass
column, a total condenser, an accumulator for refluxing the distillate product that works as
decanter to separate accumulated water, a reboiler, and a bottom product collector. The glass

76
column consists of six one-meter long, 51 mm ID removable sections; two noncatalytic sections
and four catalytic/reactive sections. The catalytic sections are packed with KATAPAK-SP11
structured packing filled with Amberlyst-70 cationic ion-exchange resin as acid catalyst.
Steinigeweg et al., measured separation efficiency of KATAPAK-SP 11 structured packings
using water-acetic acid test system and found that number of theoretical stages per meter of the
packings is 2 [19]. Therefore in this study, height-equivalent theoretical plate (HETP) of 0.5 was
assumed giving the column an equivalent of 12 theoretical stages plus a partial reboiler. Each
catalyst packing in the reactive section was 9 cm in length and contained approximately 0.014kg
of catalyst. This is equivalent to 11 packings per meter of column i.e., 0.150 kg.cat/1 m of
column or 0.075 kg.cat/stage. The catalytic sections are separated by liquid re-distributors that
also allow intermediate liquid sample withdrawal. The noncatalytic stripping and enriching
sections of the column are packed with structured Sulzer-Mellapak packings. The specifications
of the column design are given in Table 3.1.

77
Figure 3.1: A schematic of pilot scale RD column
S-P
1
14
3
5
6
7
8
9
10
11
13T-1
T-2
S-P
S-P
S-P
T-3
T-4
T-5
T-6
T-7
T-8
T-9
T-10
T-11
T-12
T-13
T-14
Condenser
Bottom Feed Cyclohexene
TI
1– 2
TI
3 – 5
TI
6 – 8
TI
9 –11
TI
12-14
WI
1Bottom Product
TI
15
TI
TI
F-T1
Reboiler
4
2
12
Glass wool insulation
Top Feed Acetic acid
I-74
Cooling
Water In
Cooling
Water Out
Decanter
Water Out

78
Table 3.1: Characteristics of pilot plant reactive distillation column
Parameter Value
height (m) 6
inner diameter (mm) 51
reboiler capacity (L) 2.5
Non-catalytic stripping
section height (m) 1
type of packing Mellapak
catalytic section height (m) 4
Packing type KATAPAK- SP11
Catalyst Amberlyst-70
catalyst particle size (mm) >0.5
catalyst holdup (kg/m3) 76
Non-catalytic enriching
section height (m) 1
Packing type Mellapak
The column was wrapped with electric heating tapes and insulated with glass wool bands.
Internal and external surface thermocouples were positioned at various points along the column
to register temperature profiles inside and outside the column. To imitate adiabatic operation of
an industrial scale column, the heating tapes along the column height were individually
controlled to match external surface temperature with internal column temperature. To
ameliorate the corrosive effects of acetic acid at high temperature, the reboiler was powered by a
1500W, 120V titanium sheath tubular heater obtained from Durex industries (Part No: HB26X-
05W-15002-821501). Reboiler power was calculated by measuring current through the heater

79
using an ammeter. Cooling water was used as coolant in the condenser. To determine condenser
duty, the cooling water inlet and outlet temperatures and flow rate were measured during the
experiments. By measuring heat input (reboiler power) and output (energy balance over
condenser), an overall energy balance across the column was carried out.
During column operation, CHE and AA were fed to the column using diaphragm pumps
from feed tanks positioned on electronic balances via insulated pipelines equipped with
temperature probes. Both weights and volumes of top and bottom products were measured
periodically during the experiments using electronic balance and volumetric flasks. An accurate
overall mass balance for each run could be carried out from these measurements.
A typical pilot scale experiment started with CHA in the reboiler. After heating was
initiated, AA was fed 1.5 meters below the top of the column (top of Stage 4) at a desired flow
rate that was verified periodically by noting the change in weight of the AA feed tank. When the
temperature profile across the column reached the boiling point of AA and AA appeared in the
condenser, the CHE feed was started at the desired flow rate that was again monitored by noting
feed tank weight change. The CHE was fed 0.5 meters from the bottom of the column (top of
Stage 12). Temperature set point for heating tapes for the glass column were continuously
monitored and changed when necessary to ensure an adiabatic column operation. Experimental
steady state was assumed when temperature profile of the column changed by no more than
±0.5K over one hour, and when inlet and outlet flow rates within 5% of their set points.
Typically, steady state was achieved after approximately 3-4 times the volume of liquid holdup
in the reboiler was collected as bottom product. As steady state was approached and achieved,
multiple sets of distillate and bottoms product samples and intermediate samples from ports
along the column were collected for analysis. After the run, the steady state operation of the

80
column was verified by doing chromatographic analysis of the samples and conducting
component mass balances across the column.
3.4. Results and Discussion
The complete set of steady state conditions for RD experiments conducted in pilot scale
is shown in Table 3.2. In Run 2, CHE mass flow was 11.9±0.4 gm/min and AA flow was
maintained such that AA:CHE feed mole ratio was about 1.1. Steady state was achieved in 2.5
hours and from bottom product analysis, it was found that CHE conversion was 100%. To
achieve steady state with CHE conversion lower than Run 2, CHE flow was increased to
25.7±0.5 gm/min and AA:CHE feed mole ratio was maintained at 1.9 in Run 3. Steady state was
achieved in 2 hours and 100% conversion of CHE was confirmed from bottom product analysis.
CHE flow was further increased in Run 4 to 22.1±0.5 gm/min and feed mole ratio of AA:CHE
was maintained at 1.1. In this run too, 100% CHE conversion was achieved. When CHE flow
was further increased to 30.9±0.5 gm/min, keeping the feed mole ratio of AA:CHE at 1.1, steady
state was not achieved even after 4 hours. In Runs 2-5, phase separation of water was observed
in intermediate samples collected from the enriching section and from the top of the catalytic
section. The AA feed used in the experimental runs was glacial acetic acid with approximately
600 ppm of water. While operating under total reflux conditions, as in Runs 2-5, buildup of
water was observed in the column. In Runs 2-4, 100% conversion of CHE resulted in very high
bottom temperature as a result of which, unreacted CHE and water were confined to the top part
of the column. But when CHE feed rate was further increased in Run 5 such that complete
conversion was not achieved, CHE was forced to flow out of the column as bottom product and
steady state was not achieved.

81
Run 6 was discontinued because reboiler heater needed replacement. Similar observation
as in Run 5 was made in Runs 7 and 8 during which steady state was not achieved. Under the
experimental condition of total reflux in Run 2-8, there was no outlet for accumulated water or
unreacted CHE. Therefore, taking CHE as distillate product and using a decanter after the
condenser section to remove water was proposed for all further RD runs.
During Runs 2, 3 and 4, 100% CHE conversion resulted in high temperature conditions in
the bottom section of the reactive zone that are favorable for CHE oligomerization. Run 4
temperature profile across the column is shown in Figure 3.2 as an example. To test the catalyst
for any degradation, a catalyst packing from the bottom of the reactive section was taken out
after Runs 2-5. Catalyst was removed by piercing a hole in the packing. This catalyst was
washed with ethanol and a sample of the supernatant liquid was analyzed using GC-MS.
Cyclohexene dimers (cyclohexene, 1-cyclohexyl and cyclohexene, 3-cyclohexyl) were found to
be present in the solution. Catalyst activity by titration was found to be 1.4 eq/kg.cat. Catalyst
activity on a packing just above the one that was pierced was 2.3 eq/kg.cat. These findings
suggest that the bottom most catalyst packing was affected due to oligomerization of CHE. CHE
oligomers can block pores or form new networks inside the pores of Amberlyst 70 catalyst which
can be the reason for the observed lower activity. The cause of deactivation and a complete
explanation to deactivation phenomenon is beyond the scope of this study. The catalyst packing
in the top section of the reactive zone did not lose catalyst activity. The catalyst packings that
were removed from the column were replaced in their respective positions before Runs 9a & 9b.

82
Figure 3.2: Temperature profile for Run 4.
3.4.1. Heat Integration Runs
In Runs 9a and 9b, the organic layer collected in the decanter was divided into two
streams: top distillate and a reflux stream going back to the column. The bottom aqueous layer
from the decanter was periodically drained and discarded. It is to be noted here that phase
separation of water might not occur at steady state conditions during a given experimental RD
run as water concentration is not high enough to cause phase separation and also because the
column is not operated under total reflux conditions. The major function of the decanter during
Runs 9a and 9b was to remove accumulated water in the column that was a result of the initial
AA wash during column startup as described in the previous section.
Using a decanter to remove accumulated water in the column and distillate flow to
accommodate incomplete CHE conversion, steady state was achieved in Run 9a. Details of the
steady state operating conditions are given in Table 3.2. To study the effect of heat loss from a
section of the column on CHE conversion as a first step in evaluating heat integration, heat
insulation from the bottom-most catalytic section (Stages 10 and 11) was removed and a new
320
340
360
380
400
420
440
460
0 1 2 3 4 5 6 7 8 9 10 11 12 13 14
Tem
per
atu
re (
K)
Stage
AA Feed
CHE Feed
Condenser Reboiler

83
steady state was achieved as Run 9b. Distillate flow was adjusted to keep the reflux ratio the
same as in Run 9a.
3.4.2. Energy balance for Runs 9a & 9b
Complete energy balances based on 1) experimental material balance and 2) ideal
material balance for Runs 9a & 9b are given in Tables 3.3a & 3.3b. Details of energy balance
calculations for Runs 9a and 9b are given in Appendix B. It is to be noted here that this energy
balance is sensitive to the uncertainties in top and bottom product compositions and also to the
uncertainty in feed flow measurement (Table 3.3a). The heat loss using experimental material
balance exceeded reboiler input which is unrealistic. An ideal material balance is computed
using the experimental CHA yield during Runs 9a and 9b, with all other outlet component flows
adjusted to close the material balance. From energy balance based on ideal material balance,
shows a reasonable heat loss of 131 W to surroundings which is a reasonable fraction of reboiler
input. Also, it was found that there is an extra heat loss of 135 W in Run 9b due to the removal
of insulation from the bottom-most reactive zone in the column (stages 10 and 11 in the
simulation). Since all the measurements were conducted on the same day and by the same
operators using identical procedures, it can be assumed that uncertainty in energy balance of both
the runs is the same and that the extra heat loss estimated from the energy balance for Run 9b is
the result of insulation removal. These heat loss calculations are important for subsequent
process simulations. Ideal vs. experimental material balance data for Runs 9a &9b is given in
Tables 3.4a & 3.4b.

84
Table 3.2: Summary of reaction conditions in pilot plant runs
Feed flow
(gm/min)
Product flow (gm/min)
Run
code
Reboiler
power
(KW)
Top
(AA)
Bottom
(CHE) Configuration Distillate Bottom Bottoms temperature (K)
CHE
Conversiona
%
2 0.93 8.9±0.4 11.9±0.4 Total reflux 21.6±0.4 446.15 100
3 0.82 25.7±0.5 18.5±0.6 Total reflux 45.2±1.5 416.15 100
4 0.82 16.1±0.4 22.1±0.5 Total reflux 37.7±1.8 451.15 100
5 0.80 24.6±1.2 30.9±0.5 Total reflux 55±2.5 not reached steady state
7 1.0 25±1.2 29.5±1.5 Total reflux 54.8±2.0 not reached steady state
8 0.93 18.5±1.5 17.5±1.5 Total reflux 35.5±2.0 not reached steady state
9a 0.43 25.5±0.9 25.8±1.3 Distillate / decanter 8.7±0.3 45.5±1.5 386.15
46
9b 0.43 25.7±1.5 27.9±1.5 Distillate / decanter 3.44±0.4 48.5±1.5 376.15
40
a. Conversion based on CHA yield using ideal material balance

85
Table 3.3a: Energy balance from experimental material balance
Run
code
Reboiler
power
(KW)
Condenser
heat duty
(kW)
CHE
feed
enthalpy
(kW)
AA feed
enthalpy
(kW)
Distillate
enthalpy
(kW)
Bottom
product
enthalpy
(kW)
Heat In
(kW)
Heat Out
(kW)
Heat
loss(kW)
9a 0.43 0.29 -0.216 -3.440 -0.308 -3.638 -3.224 -3.658 0.434
9b 0.43 0.14 -0.213 -3.472 -0.127 -3.800 -3.254 -3.784 0.529
Excess heat
loss in Run
9b 0.096
Table 3.3b: Energy balance from ideal material balance
Run
code
Reboiler
power (KW)
Condenser
heat duty
(kW)
CHE
feed
enthalpy
(kW)
AA feed
enthalpy
(kW)
Distillate
enthalpy
(kW)
Bottom
product
enthalpy
(kW)
Heat In
(kW)
Heat Out
(kW)
Heat
loss(kW)
9a 0.431 0.287 -0.216 -3.440 -0.269 -3.374 -3.224 -3.355 0.131
9b 0.431 0.143 -0.213 -3.472 -0.100 -3.563 -3.254 -3.520 0.266
Excess heat
loss in Run
9b 0.135

86
Table 3.4a: Ideal vs. Experimental material balance for Run 9a
Ideal material balance
Experimental material
balance
Mass flow (gm/min) Mass flow (gm/min)
CHE
feed
AA
feed Distillate Bottoms Distillate Bottoms
CHE 28.3
7.865 7.260 6.808 6.416
AA
25.6 1.595 14.353 1.892 16.355
CHA
0 22.808 0 22.794
Mass fraction Mass fraction
CHE 1.0
0.831 0.163 0.782 0.141
AA
1.0 0.169 0.323 0.218 0.358
CHA
0 0.513 0 0.499
Table 3.4b: Ideal vs. Experimental material balance for Run 9b
Ideal material balance
Experimental material
balance
Mass flow (gm/min) Mass flow (gm/min)
CHE
feed
AA
feed Distillate Bottoms Distillate Bottoms
CHE 27.900
3.962 12.545 3.111 9.906
AA
25.770 0.523 16.918 0.619 18.794
CHA
0.000 19.723 0.000 19.706
Mass fraction Mass fraction
CHE 1.0
0.883 0.255 0.834 0.204
AA
1.0 0.117 0.344 0.166 0.388
CHA
0 0.401 0 0.406

87
3.4.3. Simulation of RD column
Steady state simulations of pilot plant RD operation were performed using the
equilibrium stage model in the RADFRAC column module in Aspen Plus (Version 7.1, Aspen
Tech). The NRTL model was used to describe liquid phase non-ideality in the column. NRTL
parameters were taken from Smith et al.,[20] (Appendix A.6). The column parameters used in
simulations were chosen according to the pilot plant set up and are summarized in Table 3.5.
Simulations for these pilot plant runs were also conducted. It should be noted that the simulation
results for Runs 9a & 9b obtained in this study were compared to results obtained by Dr. John
Prindle of Tulane University and were found to be in agreement with each other.
Table 3.5: RD column parameters used in process simulations
Parameter
Total number of stages (N) 14
HETP – Height equivalent to theoretical plate (m) 0.5
Reactive stages Catalytic (4-11) 7
Non-catalytic (12-14)&(2-3) 5
Feed Stages Acetic acid feed 4 on stage-liquid
Cyclohexene feed 12 on stage-liquid
Catalyst holdup (kg/stage) (stages 4 to 11) 0.075
Product removal stage Top 1
Bottom 14
Properties Base method NRTL-HOC
Amberlyst 70 Catalyst loading (kg/stage) in structured
packings 0.075

88
3.4.3.1 Kinetic parameters for simulations
Experimentally validated pseudo- homogeneous kinetics discussed in Chapter 2 was used
to model chemical reactions in the RD column. The units on the pre-exponential factors for
forward reaction rates in Chapter 2 were kmol.kgsoln/kg.cat/min/m3soln. If the unit for hold-up
is chosen as kg.cat in simulations for modeling CHE esterification, then thee units for pre-
exponential factor in Aspen Simulations need to be kmol/kg.cat/sec. By dividing units of pre-
exponential factor (reported in Chapter 2) with the approximate density of solution (950 kg/m3),
kinetic parameters with units required for Aspen Plus simulations can be obtained. Modified
kinetic parameters used in these simulations are shown in Table 3.6.
Table 3.6: Modified kinetic parameters used in process simulations
Reaction CHE+AA CHA CHA CHE+AA Units
Pre-exponential factor 5.87 × 10⁷ 4.34 × 10
11 kmol/kg.cat/sec
Activation Energy 88100 118410 kJ/kmol
3.4.3.2 Algorithm selection
Aspen Plus offers a group of convergence algorithms and initialization methods for
distillation problems based on chemical properties of components involved. For the cyclohexene
esterification system – which may act as a two phase distillation when water is present in the
system, it is apt to use the strongly non-ideal convergence algorithm in simulations. In
preliminary simulations using the built-in power law for reaction kinetics, it was observed that
two different solutions were obtained by choosing standard algorithm or strongly non-ideal
algorithm in the simulation software. However, when a user subroutine was used for kinetics,
both the algorithms gave identical result. This observation was sent to AspenTech support for
evaluation. AspenTech support indicated that a user subroutine should not force a change in

89
algorithm contrary to our experience. Therefore, when using the built-in power law for kinetics,
both solutions are valid mathematical solutions. The strongly non-ideal algorithm is used in all
the simulations presented in this study. It is important to note here that, multiple valid steady-
state results are feasible, and caution must be exercised while relying on simulations for design
of RD column.
3.4.4. Comparison of simulation and experimental results
To match steady state temperature and composition profiles from simulations with the
experimental profiles, a heat loss of 140 W was assumed on Stage 13 in both the Runs 9a & 9b,
in addition to the heat loss due to insulation removal in Run 9b. Figures 3.3a and 3.4a show the
experimental and simulated temperature profiles for Runs 9a and 9b. In a separate simulation,
this heat loss to surroundings was assumed to be uniform across Stages 2-13 in the column for
Run 9a. The resulting temperature profile for Run 9a is shown in Figure 3.3a. It is clear that the
assumption of uniform heat loss across Stages 2-13 does not give profiles that match
experiments, but the additional heat loss only on stage 13 does give results that agree with
experimental results. Therefore, in all further simulations heat loss of 140 W was assumed on
only on Stage 13.
CHE conversion obtained from simulations for Runs 9a & 9b were 45.2% and 40.3%
respectively, which is very close to the experimentally obtained values. However, reboiler
temperatures predicted from simulations for Runs 9a & 9b have an error of 10.1% and 7.6%
respectively. The assumption of 140 W heat loss only on Stage 13 affects composition of CHA
in the bottoms, resulting in a lower reboiler temperature. To examine this further, heat loss on
stage 13 was varied between 90 and 140 W. For a 100 W heat loss on Stage 13 for Run 9a, CHE
conversion was 53% and reboiler temperature matched within an error of 5% for Run 9a.

90
However, the experimentally determined yield for CHA in Run 9a was only 46%. Because it was
desired to match the CHA yield in simulations and experiments, the heat loss of 140 W on Stage
13 was retained in all subsequent simulations. This value is very close to the experimental heat
loss calculated using ideal material balance.
Composition profiles predicted by simulations for Runs 9a & 9b are presented in Figure
3.3b and 3.4b. The simulated compositions are in good agreement with experimental data except
for Stage 1 in Run 9b. For the simulation of Run 9b (insulation removed on Stages 10 and 11),
Stage 1 composition depends significantly on heat loss from Stages 10 and 11, because CHE is
fed from Stage 12 and any heat loss from bottom sections of catalytic zone will reduce the
amount of CHE going to the top of the column. Heat loss on Stages 10 and 11 was varied
between 90 W and 140W. At a heat loss of 90 W, predicted stage 1 composition matches with
the experimental composition but CHE conversion of 46% is obtained. However, the
experimental yield in Run 9b matches closely with simulations when heat loss in Run 9b was set
at 140 W. This is the reason for error in simulated Stage 1 compositions in Run 9b.
It is to be noted here that during Runs 9a & 9b, a decanter was used to remove water
accumulated in the column. Water separation occurred when CHE feed was started. After a
steady state was reached there was no separation of water inside the column or in the decanter.
The simulations predicted no phase separation of water with 500 ppm of water in AA feed and
85 ppm of water in CHE feed. Therefore, a decanter unit operation was not used in simulations.
Using this experimentally validated simulation model, additional parametric simulations
were conducted to examine, feed stage location, effect of heat loss & addition and effect heat
transfer between the stages on CHE conversion and energy requirement. Results are discussed in
the following sections.

91
Figure 3.3a: Temperature profile Run 9a. (♦)- Experimental; (■) – simulation assuming heat loss
on Stage 13; (▲) – simulation assuming heat loss uniformly across Stages 2-13.
Figure 3.3b: Composition profile of Run 9a. (×)-CHE; (♦)- CHE simulated; (□)- CHA; (■)-
CHA simulated; (∆)-AA; (▲)- AA simulated
75
80
85
90
95
100
105
110
115
120
1 2 3 4 5 6 7 8 9 10 11 12 13 14
Tem
per
ature
(°C
)
StageCondenser Reboiler
123456789
1011121314
0 0.2 0.4 0.6 0.8 1
Sta
ge
Liquid Weight fraction
Condenser
Reboiler

92
Figure 3.4a: Temperature profile Run 9b. (♦)- Experimental; (■) – simulation.
Figure 3.4b: Composition profile of Run 9b. (×)-CHE; (♦)- CHE simulated; (□)- CHA; (■)- CHA
simulated; (∆)- AA; (▲)- AA simulated.
75
80
85
90
95
100
105
110
115
120
1 2 3 4 5 6 7 8 9 10 11 12 13 14
Tem
per
atu
re (
°C)
StageCondenser Reboiler
123456789
1011121314
0 0.2 0.4 0.6 0.8 1
Sta
ge
Liquid Wt fraction
Condenser
Reboiler

93
3.4.5. Effect of feed stage on CHE conversion
The CHE feed stage was varied between Stages 4 and 12, keeping all other conditions the
same as Run 9a to study its effect on CHE conversion. Similarly, CHE feed location was kept
constant similar to Run 9a, but AA feed location was varied between stages 2 and 8. The results
of these simulations are presented in Figure 3.5. The AA feed stage has no significant effect on
CHE conversion. However, by changing CHE feed stage from stage 12 to stage 9, 56%
conversion of CHE can be achieved instead of 45% conversion during experimental Run 9a. For
CHE conversion of 46% obtained in experimental Run 9a, and with CHE feed on stage 9
simulations show that the reboiler duty can be decreased to 270 W from 430 W. This is an
energy saving of approximately 37%, a result that highlights the importance of feed stage
location in the RD column for this system.
Figure 3.5: Effect of feed stage on CHE conversion for Run 9a. (♦)- Changing CHE feed stage
(■) – Changing AA feed stage
30
35
40
45
50
55
60
1 2 3 4 5 6 7 8 9 10 11 12 13 14
CH
E c
onver
sion %
Feed stage

94
3.4.6. Effect of heat loss on CHE conversion
Run 9b was conducted to determine the effect of heat loss on CHE conversion. From
experiments, it is clear that by removing insulation on Stages 10 and 11, CHE conversion
decreases from 46% to 40%. To study the effect of heat loss from all the other reactive stages,
simulations were conducted assuming a heat loss of 140 W on pairs of stages (Stage 4&5, Stage
10&11 etc.,) from Stage 4 to 11. Effect of heat loss from reactive stages on CHE conversion is
shown in Figure 3.6. This heat loss is in addition to the 140 W heat loss assumed for simulations
of Runs 9a & 9b on Stage 13. Heat loss from the top three reactive sections result in higher
conversion than that achieved in Run 9a. Heat loss from the top reactive stages keeps maximum
amount of CHE in the reactive zone which is the reason for this increase in conversion. When
heat loss is moved to the lower catalytic zone, driving force for CHE vaporization is decreased
and CHE exits as bottom product, thus decreasing CHE conversion.
Figure 3.6: Effect of heat loss on CHE conversion for Run 9a.
0
10
20
30
40
50
60
4,5 5,6 6,7 7,8 8,9 9,10 10,11
CH
E c
on
ver
sio
n %
Stages
Run 9b

95
3.4.7. Effect of heat addition on CHE conversion
In Run 9b, effect of heat loss on CHE conversion was studied and simulated. In order to
determine the effect of addition of heat to the catalytic section on CHE conversion, simulations
were conducted at Run 9a conditions and adding 140 W heat to a pair of stages. It is clear from
the results shown in Figure 3.7 that heat addition alone to any reactive section does not improve
CHE conversion.
3.4.8. Effect of heat transfer between catalytic sections
To determine the effect of using heat from one pair of stages on another pair of stages in
the same RD column, simulations were conducted with a heat loss 140W on one pair of stages
and heat addition of 140 W on another pair of stages in the catalytic section. All the reaction
conditions were kept the same as Run 9a. Results are presented in Figure 3.8. When 140 W heat
is transferred from Stages 4&5 to 10&11, CHE conversion increases to 51% compared to 46% in
Run 9a. In order to achieve 46% conversion, reboiler duty can be decreased to 395 W resulting
in an energy savings of 8.1%. Similarly, 140 W heat transfer from top of the catalytic section to
bottom catalytic section resulted in improved CHE conversion. This result demonstrates the
importance of using exothermic heat of reaction from top catalytic stages to improve energy
efficiency of RD column.

96
37.5
38
38.5
39
39.5
40
40.5
41
41.5
42
42.5
43
4,5 5,6 6,7 7,8 8,9 9,10 10,11
CH
E c
on
ver
sio
n %
Stages
Figure 3.7: Effect of heat addition to stages in catalytic section on CHE conversion for Run 9a.
Figure 3.8: Effect of heat transfer between stages in catalytic section on CHE conversion for Run
9a.
42
43
44
45
46
47
48
49
50
51
52
4,5 -->10,11 4,5 -->10,11 5,6 -->10,11 6,7 -->10,11 7,8 -->10,11
CH
E c
onver
sion %
Stages
Reboiler
heat duty = 395 W
Reboiler
heat duty = 430W
97
3.5. Conclusions
The feasibility of producing CHA using RD was demonstrated on a pilot scale using a 6m
glass column with Amberlyst 70 catalyst in KATAPAK-SP 11 packings. It was shown that 100%
conversion of CHE can be achieved using RD. The effect of high temperature and high catalyst
loading conditions that result in CHE oligomerization on the activity of catalyst was studied. It
was found that CHE oligomerization decreases the activity of Amberlyst 70 catalyst present in
bottom-most part of the catalytic zone. It is beneficial to tag all the catalyst packings so that the
packings with decreased catalyst activity can be identified. It is also beneficial to conduct the RD
experiments at lower pressure to keep the bottom catalytic zone temperature less than 373 K.
Pilot scale experiments were conducted to study the effect of heat loss from the reactive
section of RD column on CHE conversion. Simulations with a simple equilibrium stage model
using RADFRAC module in Aspen Plus based on experimentally obtained chemical kinetics,
energy balance and vapor-liquid equilibria were performed. Steady-state simulation results were
validated by experimental runs in a pilot plant column. This simple simulation model is
adequate for an initial approximation of RD column performance for CHA production from CHE
and AA.
The effect of feed stage, heat loss, addition and heat transfer between reactive stages was
studied using the simulation model. It was found that for reactions with moderate thermal effect
such as CHE esterification with AA, heat transfer from top of the catalytic zone to the bottom
part of the catalytic zone yields energy efficient results. These simulations can be used as a
guideline for designing experiments to determine the effect of external heat integration using RD
column for cyclohexanol production from CHE.

98
APPENDIX B

99
3.6. Appendix B
B.1: Reboiler duty calculation
In Runs 9a and 9b, current (I, amps) supplied to reboiler was measured. Resistance (R) of
the reboiler specified by the manufacturer was 9.6 Ω.
Power (P) = I2* R (B.1.1)
Current measured during Runs 9a and 9b and corresponding power is given in Table
B.1.1.
Table B.1.1: Reboiler duty calculation
Run Current ( Amps) Power(kW)
9a 6.7 0.43
9b 6.7 0.43
B.2: Condenser duty calculation
Condenser heat duty was calculated by measuring temperature of cooling water entering
and leaving the condenser and its flow rate. Heat duty (Qc), mass flow rate of water (m) and
temperature difference between inlet and outlet temperatures (∆T) are related as follows:
Qc=m*cp*∆T where cp is the specific heat capacity of water = 4.179kJ/kg/K (B.2.1)
The condenser heat duty calculated using Eq B.2.1for Runs 9a &9b are presented in
Table B.2.1.

100
Table B.2.1: Condenser duty calculation
Run
Cooling Water in
Temperature °C
Cooling Water out
Temperature °C
Flow rate
(gm/min)
Condenser duty
(kW)
9a 24 32 517.24
0.29
9b 24 28 545.45
0.14
B.3: Stream enthalpy calculation
The heat capacity for a component at temperature T is calculated as follows:
Cp= a+ bT +cT2+dT
3 (B.3.1)
The values for a, b, c and d were obtained for each component from DIPPR database
(Table B.3.1). Enthalpy of a stream at temperature T is calculated from the following equation.
TR is the reference temperature 298K.
n
i
T
RT
dTipCoif
hixTH
1,,
* (B.3.2)
Where xi is the mole fraction of number of components in the stream, o
ifh , is the heat
of formation at standard state (298 K). Table B.3.1 gives standard heat formation data for
components involved in this study. Enthalpy of streams calculated as described above was
compared to the enthalpy of streams obtained from Aspen Plus simulations and they were in
agreement with each other.
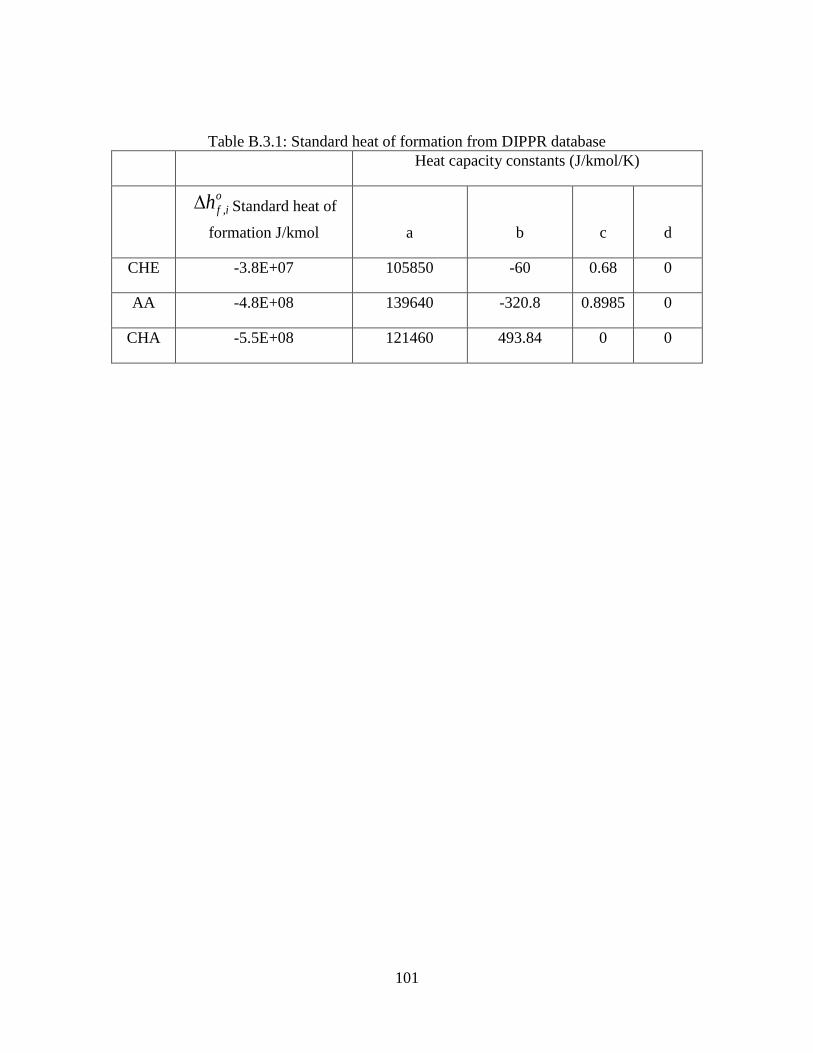
101
Table B.3.1: Standard heat of formation from DIPPR database
Heat capacity constants (J/kmol/K)
o
ifh , Standard heat of
formation J/kmol a b c d
CHE -3.8E+07 105850 -60 0.68 0
AA -4.8E+08 139640 -320.8 0.8985 0
CHA -5.5E+08 121460 493.84 0 0

102
REFERENCES

103
3.7. References
1. Stankiewicz, A.I. and J.A. Moulijn, Process intensification: Transforming chemical
engineering. Chemical Engineering Progress, 2000. 96(1): p. 22-34.
2. Schembecker, G. and S. Tlatlik, Process synthesis for reactive separations. Chemical
Engineering and Processing, 2003. 42(3): p. 179-189.
3. Lutze, P., R. Gani, and J.M. Woodley, Process intensification: A perspective on process
synthesis. Chemical Engineering and Processing: Process Intensification, 2010. 49(6): p.
547-558.
4. Victor H. Agreda; Lee R. Partin, b.o.K., Tenn, Reactive distillation process for the
production of methyl acetate, U.S. Patent, Editor. 1984, Eastman Kodak Company,
Rochester, N.Y.: USA.
5. Sharma, M.M. and S.M. Mahajani, Industrial Applications of Reactive Distillation, in
Reactive Distillation. 2003, Wiley-VCH Verlag GmbH & Co. KGaA. p. 1-29.
6. Freund, H. and K. Sundmacher, Process Intensification, 1. Fundamentals and Molecular
Level, in Ullmann's Encyclopedia of Industrial Chemistry. 2011, Wiley-VCH Verlag
GmbH & Co. KGaA.
7. Freund, H. and K. Sundmacher, Process Intensification, 4. Plant Level, in Ullmann's
Encyclopedia of Industrial Chemistry. 2011, Wiley-VCH Verlag GmbH & Co. KGaA.
8. Chakrabarti, A. and M.M. Sharma, Cyclohexanol from cyclohexene via cylohexyl acetate
- catalysis by ion-exchange resin and acid treated clay. Reactive Polymers, 1992. 18(2):
p. 107-115.
9. Steyer, F., H.r. Freund, and K. Sundmacher, A Novel Reactive Distillation Process for the
Indirect Hydration of Cyclohexene to Cyclohexanol Using a Reactive Entrainer.
Industrial & Engineering Chemistry Research, 2008. 47(23): p. 9581-9587.
10. Steyer, F. and K. Sundmacher, VLE and LLE Data for the System Cyclohexane +
Cyclohexene + Water + Cyclohexanol. Journal of Chemical & Engineering Data, 2004.
49(6): p. 1675-1681.
104
11. Steyer, F. and K. Sundmacher, VLE and LLE Data Set for the System Cyclohexane +
Cyclohexene + Water + Cyclohexanol + Formic Acid + Formic Acid Cyclohexyl Ester.
Journal of Chemical & Engineering Data, 2005. 50(4): p. 1277-1282.
12. Steyer, F. and K. Sundmacher, Cyclohexanol Production via Esterification of
Cyclohexene with Formic Acid and Subsequent Hydration of the EsterReaction Kinetics.
Industrial & Engineering Chemistry Research, 2007. 46(4): p. 1099-1104.
13. Kumar, R., et al., Development of a Novel Catalytic Distillation Process for
Cyclohexanol Production: Mini Plant Experiments and Complementary Process
Simulations. Organic Process Research & Development, 2011. 15(3): p. 527-539.
14. Berg, L., Separation of benzene from close boiling hydrocarbons by extractive
distillation. 1995, Berg, Lloyd: USA.
15. Osamu Mitsui, Y.F., Process for producing cyclic alcohol. 1986, Asahi Kasei Kogyo
Kabushiki Kaisha: USA.
16. Huang, K., et al., Reactive distillation design with considerations of heats of reaction.
AIChE Journal, 2006. 52(7): p. 2518-2534.
17. Sundmacher, K.A.I., L.K. Rihko, and U. Hoffmann, Classification of reactive distillation
processes by dimensionless numbers. Chemical Engineering Communications, 1994.
127(1): p. 151-167.
18. Sun, J., K. Huang, and S. Wang, Deepening Internal Mass Integration in Design of
Reactive Distillation Columns, 1: Principle and Procedure. Industrial & Engineering
Chemistry Research, 2009. 48(4): p. 2034-2048.
19. Steinigeweg, S. and J.r. Gmehling, Esterification of a Fatty Acid by Reactive Distillation.
Industrial & Engineering Chemistry Research, 2003. 42(15): p. 3612-3619.
20. Alex Smith, A.K., Carl T. Lira, Dennis J. Miller, Phase equilibrium data for cyclohexene,
acetic acid system, Manuscript in preparation, Michigan State University.

105
Chapter 4: A Kinetic Model of the Amberlyst-15 Catalyzed Transesterification of Methyl
Stearate with n-Butanol
4.1. Summary
An attractive approach to improving cold flow properties of biodiesel is to transesterify
fatty acid methyl esters with higher alcohols such as n-butanol or with branched alcohols such as
isopropanol. In this study, the reaction kinetics of Amberlyst-15 catalyzed transesterification of
methyl stearate, a model biodiesel compound, with n-butanol have been examined. After
identifying conditions to minimize both internal and external mass transfer resistances, the
effects of catalyst loading, temperature, and the mole ratio of n-butanol to methyl stearate in the
transesterification reaction were investigated. Experimental data were fit to a pseudo-
homogeneous, activity-based kinetic model with inclusion of etherification reactions to
appropriately characterize the transesterification system.
4.2. Introduction
Biodiesel, which is composed mainly of fatty acid methyl esters (FAME) produced by
transesterification of plant triglycerides, is a renewable fuel with a potential to be used along
with or as a replacement for petroleum-based diesel [1]. However, in recent years biodiesel has
had an image setback because of high feedstock costs and poor low temperature properties. Cold
flow properties of biodiesel can be improved by winterization [2], which affects oxidative
stability and cetane value of the fuel, by the alcoholysis of vegetable oils with longer and
branched chain alcohols such as isopropanol and n-butanol [2-4], by the addition of cold flow
improvers, or by modification of the fatty acid profile of the parent vegetable oils[5].

106
It is generally understood that biodiesel pour point and cloud point can be improved by
using alcohols other than methanol to transesterify plant triglycerides. For example, we have
shown that fatty acid butyl esters (FABE) mixed with regular biodiesel reduce cloud point
temperature substantially without compromising cetane number [6]. A major difficulty in
obtaining fatty acid esters with alcohols other than methanol is that the rate and thermodynamic
favorability of base-catalyzed transesterification with higher alcohols is much lower than with
methanol, such that reaction does not take place to an appreciable extent in many cases, and in
others the advantageous phase separation obtained in methanol transesterification is lost [7].
Because of these challenges, we have developed an approach to producing higher alcohol
esters of fatty acids by first making FAME via traditional base catalysis and then transesterifying
FAME with other alcohols using heterogeneous catalysts to produce the desired esters. The use
of heterogeneous catalysts offers the advantage of easier product purification, a water-free
environment, reduced cost, and the potential to implement continuous processes such as reactive
distillation.
Because no information is available in the literature describing the kinetics of fatty acid
methyl ester transesterification with higher alcohols using heterogeneous catalysts, we have
conducted and present here a kinetic study on the transesterification of methyl stearate (MS), a
model compound representative of biodiesel and present in some plant oils to a significant
degree [1], with n-butanol (BuOH) using Amberlyst 15 strong cationic exchange resin as
catalyst. A pseudo-homogeneous, activity-based kinetic model that includes side reactions to
form ethers is developed to properly describe the experimental data. This kinetic study lends
insight into the use of heterogeneous ion exchange resin catalysts for fatty acid ester
transesterification, and is useful for setting the direction of process design in biofuel operations.

107
4.3. Materials and methods
4.3.1. Materials
n-Butanol (BuOH) (99.9%) was obtained from Mallinckrodt-Baker Inc. Methanol
(MeOH) (>99.9%), ethyl caprylate (>99%), and methyl stearate (MS) (>96%) were purchased
from Sigma-Aldrich. Impurities in methyl stearate included approximately 1.5 wt% non-
saponifiable material and 2.5% unsaturated triglycerides, neither of which are expected to have a
significant effect on methyl stearate conversion given their low concentration and the large
excess of butanol used. For calibration of components in gas chromatography, high purity methyl
stearate (>99%) and butyl stearate (BS) (>99%) were purchased from Nucheck-Prep, Inc. 1-
Octanol (99%) was purchased from Spectrum Chemical.
Amberlyst 15 cation-exchange resin, which is a copolymer of divinylbenzene and
styrene, was purchased from Sigma-Aldrich and washed with de-ionized water and ethanol and
vacuum dried at 378K before its use in reaction. The acid site density of the washed resin, as
measured by titration with 0.1 M NaOH, is 4.2 meq H+/g. Other physical and chemical
properties of the resin catalyst are reported in the literature [8].
4.3.2. Reactors
Kinetic experiments were carried out in a Parr 5000 Multi-Reactor system equipped with
temperature control (±0.2 K) and stirring speed control (0-1400 rpm). Each of the six batch
reactors has a 75-ml capacity with 1.5″ internal diameter. Stirring was done using an octagonal,
Teflon-coated magnetic stirring bar placed inside the reactor. Samples were taken at specified
times during reaction via use of a syringe attached to a sample port. Samples were passed

108
through a 2 m filter attached to the end of the sample port to separate the sample solution from
catalyst.
4.3.3. Procedure
In a typical experiment, measured quantities of MS and BuOH totaling approximately 55
mL, along with the Amberlyst-15 catalyst, were charged into the reactor. The reactor was sealed
and heating was initiated. Once the desired temperature was reached, stirring was started and that
time was taken as the zero reaction time. Typically, five or six 0.8 mL samples were taken at
specified time intervals over a period of 24 hours of the reaction; these samples were taken by
drawing a 2-3 mL aliquot of reaction solution into the syringe and then flushing it back into the
reactor several times to clear the sample line and obtain a representative sample. Withdrawn
samples were immediately diluted in 3.0 g of 1-octanol with 5-wt% of ethyl caprylate as the
internal standard and refrigerated to ensure no further reaction took place before analysis.
4.3.4. Analysis
Samples were analyzed using a HP-5890 Series II gas chromatograph with flame
ionization detector. Helium was used as carrier gas at a flow rate of 10 ml/min. An Aquawax-
DA 30m column with 0.53mmID and 1.0m film thickness was used to separate the
components. Oven temperature was maintained initially at 313 K for 4.0 min, increased at 293
K/min to 523K, and then maintained at that temperature for an additional 4.0 min. Injector and
detector temperatures were maintained at 523 K and 573 K, respectively. To determine MS, BS,
DBE, BME compositions, chromatographic data were collected and processed using Peak
Simple software. Mole fractions of BuOH, MeOH and water were determined by material
balance. Calibration plots used in the sample analysis are presented in Appendix C.1.

109
4.4. Results and Discussion
4.4.1. Experimental evaluation of mass transfer resistances
The development of an accurate kinetic model requires that external and internal mass
transfer resistances be minimized in reaction. To ensure that there were no external mass transfer
resistances in methyl stearate transesterification, the reaction was carried out at several different
agitation speeds while keeping all other conditions the same. Figure 4.1 shows that there is no
significant effect of speed of agitation on the mole fraction of MS over the entire range of
stirring rates. All further reactions were carried out at 1400 rpm.
Figure 4.1. Effect of agitation speed on conversion rate of MS. Reaction conditions: BuOH:MS
molar feed ratio = 20:1; catalyst loading = 5.6 wt%; reaction temperature = 363 K. (□ - 300 rpm;
■ - 900 rpm; ▲ - 1060; × - 1230 rpm; + - 1460 rpm).
0
0.01
0.02
0.03
0.04
0.05
0 500 1000 1500 2000 2500 3000 3500
MS
mo
le f
ract
ion
Time (min)

110
Internal mass transfer resistances were evaluated using different particle sizes of
Amberlyst 15, obtained by grinding the resin into finer particles and screening for three different
size fractions. These three fractions were evaluated under identical reaction conditions including
constant catalyst active site loading. Figure 4.2 shows no significant difference in conversion
rate for the different catalyst particle sizes, indicating that intra-particle diffusion resistances are
negligible for Amberlyst 15-catalyzed transesterification.
Figure 4.2. Effect of catalyst particle size on conversion rate of MS. Reaction conditions:
BuOH:MS molar feed ratio = 20:1; Amberlyst 15 catalyst loading = 5.6 wt% or equivalent of
10.25 meq H+; reaction temperature = 363 K. (□ - 60-250 µm; ■ -250-500 µm; ▲ - > 500 µm).
This absence of internal mass transport resistances is further corroborated via calculation
of the observable modulus (ηφ2) for the initial reaction rate at 373 K for the largest resin particle
size; the resulting value of ηφ2 = 0.03 is significantly below the range for which internal mass
transport limitations are present. In the calculation, a value of the diffusivity of methyl stearate
in n-butanol of 2.3 x 10⁻¹⁰
m2/sec was used from the Wilke-Chang equation. Based on these
results, as-received Amberlyst 15 was used without size reduction for the kinetic studies.
0
0.01
0.02
0.03
0.04
0.05
0 500 1000 1500 2000
MS
mo
le f
ract
ion
Time (min)

111
4.4.2. Kinetic model
Since the effect of mass transfer resistances is negligible, a pseudo-homogeneous kinetic
model can be applied to this system according to Helfferich [9]. To account for the
thermodynamic non-ideality of the liquid solution in which reaction takes place, activity is used
as a measure of species concentration instead of mole fraction. Although somewhat more
complex to develop, the activity-based model generally provides a more accurate representation
of species evolution during reaction.
4.4.2.1. Calculation of activity coefficients
The UNIFAC group contribution method was used to calculate activity coefficients of the
components present in each product sample taken during methyl stearate transesterification. The
UNIFAC group volume (Rk) and surface area (Qk) parameters were taken from Rao [10].
Tables C.2.1 and C.2.2 in Appendix C show the splitting of the groups and the UNIFAC group
interaction parameters, respectively, used to calculate activity coefficients of each species in
solution during reaction.
4.4.2.2. Transesterification reaction
Methyl stearate transesterification with n-butanol can be represented by a single,
reversible second order reaction.
BS+MeOH where a
f
K
kk
,1
r1, (4.1) MS + BuOH
The rate constant for the reverse reaction can be represented as
fk ,1
rk ,1

112
a
f
K
kk
,1
r1, (4.2)
where Ka, the equilibrium constant for transesterification, has been determined
experimentally (Section 4.4.2.4 below).
4.4.2.3. Etherification reactions
Although it is always desirable to avoid side reactions [11], preliminary
transesterification of MS with BuOH using Amberlyst 15 catalyst showed that dehydration of
alcohols to form dibutyl ether (DBE) and butyl methyl ether (BME) was important at high
temperatures and high catalyst loadings. The alcohol etherification reactions are given as
WDBEk
BuOH 22 (4.3)
WBMEk
MeOHBuOH 3 (4.4)
In prior studies, Gangadwala et al. [12] report that etherification of BuOH can be
neglected at low temperatures (333-363 K). During our experiments, we observed formation of
measurable quantities of DBE and BME as low as 353 K, with the quantities formed becoming
important at higher temperatures. It is thus necessary to include these two reactions in the
kinetic model for MS transesterification to properly describe the system dynamics. Methanol
dehydration to dimethyl ether was not observed in reaction because the methanol to butanol mole
ratio was low.
Dehydration of n-butanol to dibutyl ether and of n-butanol and methanol to methyl butyl
ether can be considered irreversible because of the large equilibrium constant for the reaction
[13].

113
4.4.2.4. Reaction equilibrium
Transesterification reactions are typically characterized by equilibrium constants near
unity. For the MS/BuOH system, experiments to measure the equilibrium constant of the
reaction were conducted over a temperature range of 353 K to 385 K. The lower temperature
range was chosen because side reactions such as irreversible etherification occur at higher
temperature and higher catalyst loading, producing water which hydrolyzes the fatty acid ester
and prevents the reaction from reaching transesterification equilibrium.
Equilibration reactions were carried out for time periods ranging from 24 to 96 hours,
sufficient for the reaction to reach equilibrium. Final product compositions were determined and
the activity-based equilibrium constant, Ka (Eq. 4.5), was calculated via inclusion of activity
coefficients of the species in the mixture
iii v
i
v
ix
v
ia xKKaK (4.5)
where υi is the stoichiometric coefficient for species i in the reaction.
The logarithm of the calculated Ka was plotted vs. 1/T and an enthalpy of
transesterification of approximately +2.4 kJ/mol was determined from the best fit of the data.
However, the correlation coefficient (R2) was less than 0.1, so for practical purposes the reaction
can be considered thermoneutral with a value of Ka of 1.3±0.3 over the temperature range
investigated.
4.4.2.5. Rate equations
The rate of consumption of methyl stearate in the reaction mixture is described by Eq.
(4.6):

114
a
MeOHBS
BuOHMSfcat
MS
K
aaaakW
dt
dx,1 (4.6)
iii xa (4.7)
Similar differential equations for other species present can be written as follows:
a
MeOHBS
BuOHMSfcat
BS
K
aaaakW
dt
dx,1 (4.8)
MeOHBuOHcatBuOHcat
a
MeOHBS
BuOHMSfcat
BuOH aakWakWK
aaaakW
dt
dx3
2
2,1
(4.9)
MeOHBuOHcat
a
MeOHBS
BuOHMSfcat
MeOH aakWK
aaaakW
dt
dx3,1
(4.10)
2
2 BuOHcatDBE akW
dt
dx (4.11)
MeOHBuOHcatBME aakWdt
dx3 (4.12)
MeOHBuOHcatBuOHcat
W aakWakWdt
dx3
2
2 (4.13)
The temperature dependence of the rate constants can be expressed by the Arrhenius
equation.
RTE
kk fo
ff,1
,1,1 exp (4.14)
RT
Ekk o 2
22 exp (4.15)
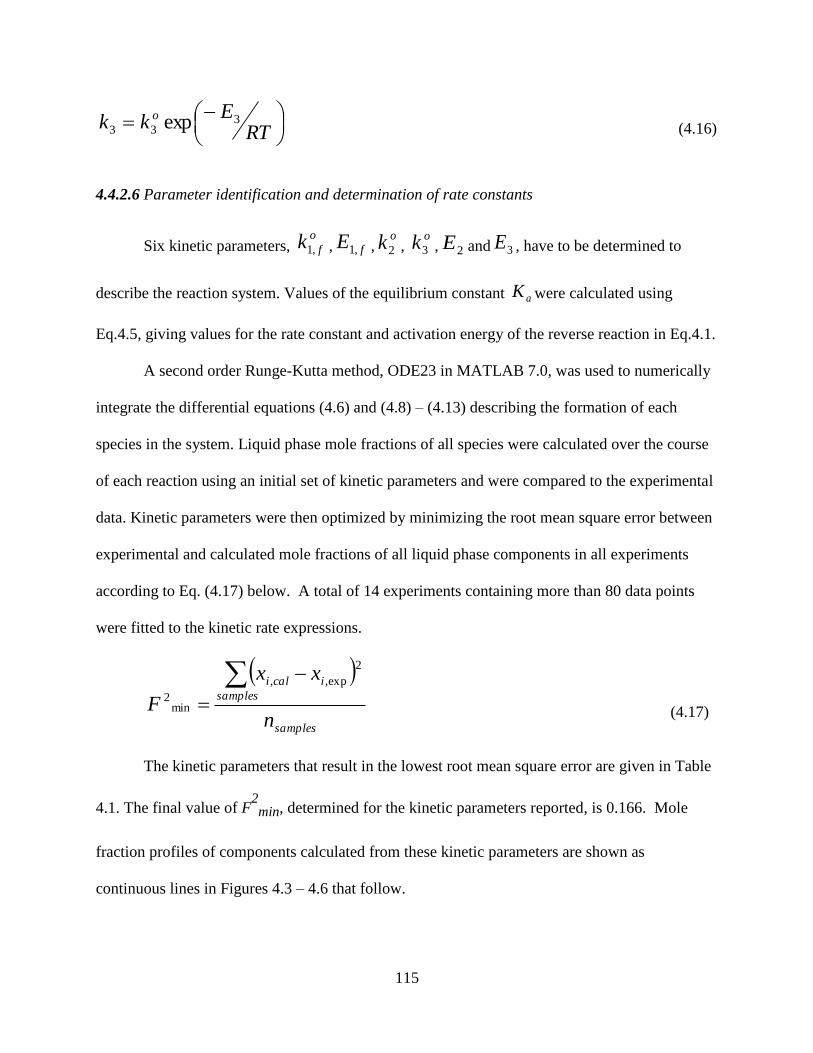
115
RT
Ekk o 3
33 exp (4.16)
4.4.2.6 Parameter identification and determination of rate constants
Six kinetic parameters, o
fk ,1 , fE ,1 ,ok2 ,
ok3 , 2E and 3E , have to be determined to
describe the reaction system. Values of the equilibrium constant aK were calculated using
Eq.4.5, giving values for the rate constant and activation energy of the reverse reaction in Eq.4.1.
A second order Runge-Kutta method, ODE23 in MATLAB 7.0, was used to numerically
integrate the differential equations (4.6) and (4.8) – (4.13) describing the formation of each
species in the system. Liquid phase mole fractions of all species were calculated over the course
of each reaction using an initial set of kinetic parameters and were compared to the experimental
data. Kinetic parameters were then optimized by minimizing the root mean square error between
experimental and calculated mole fractions of all liquid phase components in all experiments
according to Eq. (4.17) below. A total of 14 experiments containing more than 80 data points
were fitted to the kinetic rate expressions.
samples
samples
icali
n
xx
F
2
exp,,
min2
(4.17)
The kinetic parameters that result in the lowest root mean square error are given in Table
4.1. The final value of F2
min, determined for the kinetic parameters reported, is 0.166. Mole
fraction profiles of components calculated from these kinetic parameters are shown as
continuous lines in Figures 4.3 – 4.6 that follow.

116
Calculated mole fractions of each component were compared to those from experiment
by calculating the average of the absolute value of the difference between experimental and
calculated mole fractions at all data points within each experiment, represented on both a relative
(Eq. 4.18) and an absolute (Eq. 4.19) basis. The F values below give a measure of the fit of the
kinetic model to the experimental data.
%100exp,
exp,,
samples
samples i
icali
reln
x
xx
F (4.18)
samples
samples
icali
absn
xx
F
exp,,
(4.19)
Table 4.1: Kinetic model parameters
Parameter Value Units
k01,f
3.21×10⁹
kgsoln/(kgcat∙
min)
E1.f 82500 kJ/kmol
ko2 1.56×10
10
kgsoln/(kgcat∙
min)
ko3
3.12×10¹⁰
kgsoln/(kgcat∙
min)
E2 98800 kJ/kmol
E3 92500 kJ/kmol

117
4.4.3. Results
Experiments were carried out to study the effect of catalyst loading, temperature, and
BuOH:MS mole ratio on the rate of Amberlyst 15-catalyzed transesterification. Table 4.2
summarizes the reaction conditions and the differences between experimental and predicted MS
mole fractions in each experiment. Table C.3.1 in Appendix C shows the predicted differences
in calculated and experimental mole fractions for BuOH, MeOH and BS. Mole fraction profiles
of all kinetic experiments comparing experimental and predicted data are presented in Appendix
C.3.
Table 4.2: Summary of experimental conditions and calculated mole fraction differences for
MS
Run
Figure
number
Molar feed
ratio
BuOH: MS
Catalyst
loading
(wt %)
Temperature
(K)
Frel for MS
(Eq. 4.18)
Fabs for
MS
(Eq. 4.19)
1 C.2.1 20 5.6 343 6 0.0022
2 C.2.2 20 5.6 353 4 0.0014
3 C.2.3 20 5.6 363 4 0.0012
4 C.2.4 20 2.8 363 4 0.0012
5 C.2.5 20 1.4 363 4 0.0017
6 C.2.6 10 4.8 363 2 0.0015
7 C.2.7 10 4.8 363 7 0.0038
8 C.2.8 5 4.8 363 2 0.0027
9 4.4a 20 4.8 363 5 0.0010
10 C.2.9 30 4.8 363 13 0.0018
11 C.2.10 20 4.8 363 6 0.0020

118
Table 4.2 (cont’d)
12 C.2.11 20 2.8 373 10 0.0022
13 4.4b 20 4.8 373 14 0.0018
14 C.2.12 20 5.6 373 22 0.0036
4.4.3.1. Effect of catalyst loading
A control experiment without Amberlyst 15 catalyst present showed no transesterification
over 24 hr reaction time. The effect of catalyst loading from zero to 5.6 wt% of solution on the
rate of MS transesterification was examined at 363 K and 373 K with a BuOH:MS initial mole
ratio of 20:1. The initial rate of each reaction was determined by taking the slope at t=0 of a
curve that best represents the mole fraction vs. time data. The plot of this initial rate
(dXMS/dt׀t=0),versus catalyst loading, given in Figure 4.3a, is linear, showing that external mass
transfer resistances are absent and that the catalyst is effectively distributed and active
throughout the reaction solution. Figure 4.3b shows the profiles of mole fraction vs. time at
363K for three catalyst loadings; the kinetic model accurately predicts rate as a function of
catalyst loading.

119
Figure 4.3a. Initial MS transesterification rate vs. catalyst loading (wt%). BuOH:MS molar feed
ratio = 20:1. (×) – 373 K; (■) – 363 K. Solid line represents best fit of the data.
Figure 4.3b. Effect of catalyst loading (wt%) on the conversion rate of MS. Reaction conditions:
BuOH:MS molar feed ratio = 20:1; reaction temperature = 363 K. (-■- - 5.6 wt%; -▲- - 2.8
wt%; -●- - 1.4 wt%).
0
0.1
0.2
0.3
0.4
0.5
0.6
0 1 2 3 4 5 6
Init
ial rea
cti
on
ra
te X
10
4(1
/min
)
catalyst loading %
373 K
363 K
0
0.01
0.02
0.03
0.04
0.05
0 500 1000 1500 2000
MS
mole
fra
ctio
n
Time (min)

120
4.4.3.2. Effect of temperature
The effect of increasing reaction temperature on the transesterification reaction from 343
K to 373 K at an initial BuOH:MS molar ratio of 20:1 was studied. Etherification of alcohols is
slow below 363 K but is important at or above 373 K. Figures 4.4a and 4.4b show the evolution
of all species in transesterification over time; etherification of BuOH with MeOH to form BME
causes the MeOH mole fraction to fall below that of butyl stearate at longer times and even to
decrease at 373 K (Figure 4.4b). Figure 4.5 shows the increasing rate of MS conversion with
increasing reaction temperature over the temperature range 343-363 K. The calculated activation
energy for methyl stearate transesterification (82,600 kJ/kmol, Table 4.1), is much higher than
the value of 40,900 kJ/kmol reported for transesterification of methyl acetate to butyl acetate
over Amberlyst 15 [14]. The activation energies for ether formation (98,800 kJ/kmol and 92,500
kJ/kmol) are similar to the value (Ea = 102,600 kJ/kmol) we reported for dietyl ether formation
in an earlier publication [15].

121
Figure 4.4a. Mole fraction profiles of species present in MS transesterification reactions at 363
K. Reaction conditions: BuOH:MS molar feed ratio = 20:1; catalyst loading = 4.8 wt%. (-□- -
MS; -■- - BS; -▲- - MeOH; -×- - DBE; -+- - BME; -○- - W).
Figure 4.4b. Mole fraction profiles of species present in MS transesterification reactions at 373
K. Reaction conditions: BuOH:MS molar feed ratio = 20:1; catalyst loading = 4.8 wt%; (-□- -
MS; -■- - BS; -▲- - MeOH; -×- - DBE; -+- - BME; -○- - W).
0
0.01
0.02
0.03
0.04
0.05
0 500 1000 1500 2000 2500 3000
MS
mole
fra
ctio
n
Time (min)
0
0.01
0.02
0.03
0.04
0.05
0 500 1000 1500 2000 2500 3000
MS
mole
fra
ctio
n
Time (min)
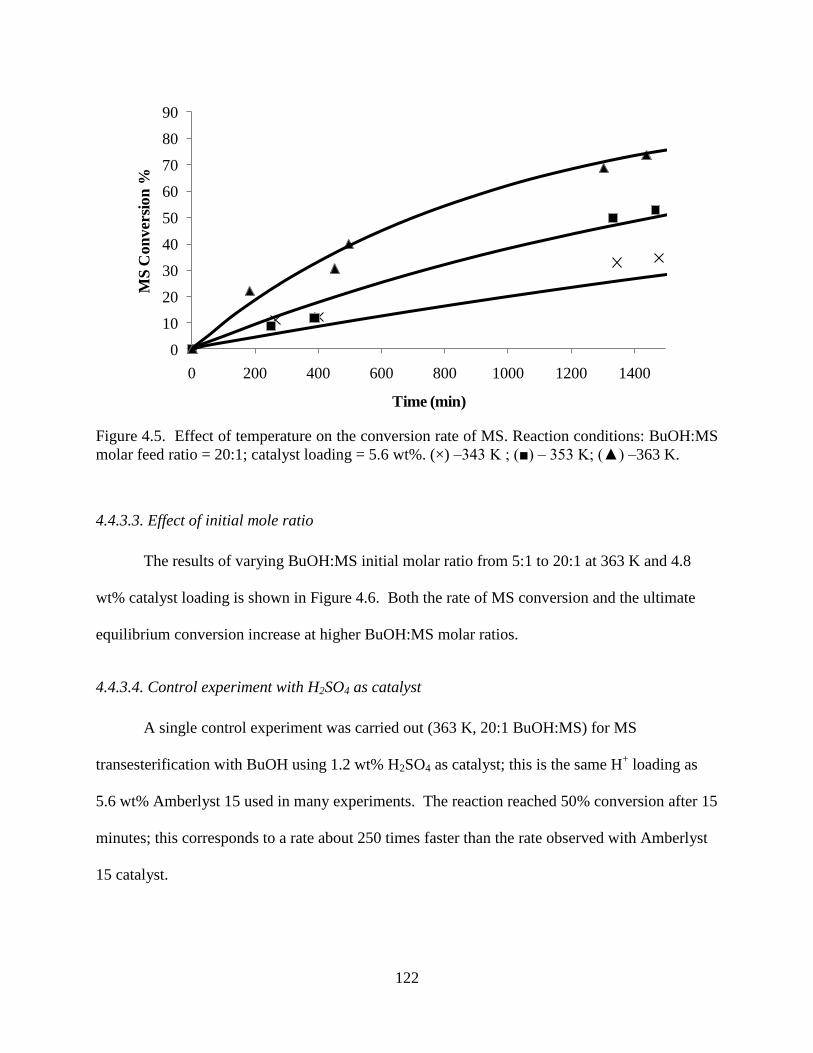
122
Figure 4.5. Effect of temperature on the conversion rate of MS. Reaction conditions: BuOH:MS
molar feed ratio = 20:1; catalyst loading = 5.6 wt%. (×) –343 K ; (■) – 353 K; (▲) –363 K.
4.4.3.3. Effect of initial mole ratio
The results of varying BuOH:MS initial molar ratio from 5:1 to 20:1 at 363 K and 4.8
wt% catalyst loading is shown in Figure 4.6. Both the rate of MS conversion and the ultimate
equilibrium conversion increase at higher BuOH:MS molar ratios.
4.4.3.4. Control experiment with H2SO4 as catalyst
A single control experiment was carried out (363 K, 20:1 BuOH:MS) for MS
transesterification with BuOH using 1.2 wt% H2SO4 as catalyst; this is the same H+ loading as
5.6 wt% Amberlyst 15 used in many experiments. The reaction reached 50% conversion after 15
minutes; this corresponds to a rate about 250 times faster than the rate observed with Amberlyst
15 catalyst.
0
10
20
30
40
50
60
70
80
90
0 200 400 600 800 1000 1200 1400
MS
Co
nv
ersi
on
%
Time (min)

123
Figure 4.6. Effect of BuOH:MS molar feed ratio on MS conversion. Reaction conditions:
Temperature = 363 K; catalyst loading = 4.8 wt%. (-▲- - 5:1; -■- - 10:1; -×- - 20:1).
4.4.4. Discussion
The kinetic model effectively predicts the rate of methyl stearate transesterification and
concurrent ether formation over the range of conditions examined. The ether formation reactions
add a valuable component to the model in describing loss of BuOH.
We have compared the forward rate constant of MS transesterification with several other
BuOH transesterification studies presented in the literature. Results of this comparison, with all
rates on a per kmol H+ (catalyst) basis, are given in Table 4.3. As described above, the H2SO4-
catalyzed rate of MS transesterification is about 250 times faster than the Amberlyst 15-
catalyzed rate under identical conditions. The transesterification of methyl acetate with butanol
over Amberlyst 15, reported by Bozek-Winkler et al., [14] is 60-70 times more rapid than MS
transesterification. We also compared our forward transesterification rate constant to that of
Friedman et al. [7] for transesterification of soy triglycerides to diglycerides, and monoglycerides
to glycerol, with butanol using H2SO4. On the same basis, triglyceride transesterification with
0
10
20
30
40
50
60
70
80
90
100
0 1000 2000 3000
MS
con
ver
sion
%
Time (min)

124
H2SO4 is about 30 times faster than MS transesterification with A-15, but about 1/8 the rate of
MS transesterification with H2SO4.
The difference in rates between the systems reported in Table 3.3 with Amberlyst 15
catalyst is attributable to both the different molecular size and polarity of methyl stearate vs.
methyl acetate. Bozek-Winkler et al., [14] state that low polarity molecules can complicate the
characterization of kinetics in Amberlyst resins; it is likely that this effect comes into play in our
system, yet the pseudo-homogeneous model fits our experimental data adequately.
Our results with Amberlyst 15 and with H2SO4 as catalyst show just how significantly
the molecular properties of methyl stearate and butanol influence conversion rate over the
heterogeneous catalyst. Even though Amberlyst 15 does not give rates as rapid as H2SO4 for
this reaction, the kinetic results presented here do provide an activation energy and a rate
expression as well as an insight into byproduct formation. This information should be useful to
other researchers in developing advanced biofuel concepts from triglyceride feedstocks.
Table 4.3: Comparison of transesterification forward rate constants at 363 K
Reaction Catalyst
kf (363 K)
(kg soln/kmol
H+/hr)
Ea
(kJ/mol)
Reference
MS + BuOH Amberlyst 15 6.1 x 101 82,500 this work
MS + BuOH H2SO4 1.6 x 10⁴ - this work
Methyl acetate + BuOH Amberlyst 15 4.0 x 10³ 40,890 [14]
Triglyceride + BuOH
Monoglyceride + BuOH
H2SO4
H2SO4
1.9 x 10³
4.6 x 10³
62,000
63,100
[7]

125
From the forward rate constant, the initial turnover frequency (TOF) of MS
transesterification on the acidic Amberlyst 15 sites at 363 K with BuOH:MS at 20:1 is 0.04 kmol
MS/kmol H+/hr. This low value is another indication that Amberlyst 15 is less than an ideal
choice for methyl stearate transesterification.
The experimental data collected in this work has also been fitted to a mole fraction-based
model, where activity of each species is replaced by its mole fraction. When this mole fraction
model is applied, similar rate constants are obtained and the value of the objective function (Eq.
17) is 0.15, slightly smaller than the value of 0.166 obtained with the activity model. However,
the value of Kγ, the ratio of product-to-reactant activity coefficients (Eq. 4.5) at the experimental
conditions, ranges from 1.3 to 1.5, signifying that there is significant nonideality in this system.
Because the value of Kγ differs significantly from unity, the activity-based model is preferred
and will offer a better fit of data over a range of conditions broader than that investigated here
where nonidealities may even more strongly predominate.
4.5. Conclusion
The effect of temperature, reactant molar ratio, and catalyst loading on the rate of
Amberlyst 15-catalyzed transesterification of MS with BuOH has been experimentally
investigated. The dependence of the transesterification equilibrium constant on temperature was
also examined. Based on the experimental results, a second-order, activity-based kinetic model
was developed and optimized to fit the data. The model describes the transesterification
reasonably well over the range of 343-373 K, including the formation of ethers at higher
temperatures. The results clearly show the challenges associated with using Amberlyst 15
catalysts for transesterification of larger fatty acid esters.

126
APPENDIX C

127
4.6. Appendix C
C.3.1 Calibration plots for sample analysis
Reaction samples were diluted in 1-octanol with 5 wt% ethyl caprylate (1-OC+EC)
solvent. To determine the weight of each component in the reaction sample, individual
calibrations were carried out. Measured quantity of each component was mixed with a known
amount of solvent such that the component is 10% by weight in the solution. The calibration
samples were made to cover the whole range of mass fraction that is expected in the reaction
samples. These samples were analyzed in a gas chromatograph as described in Section 4.3.4.
From the chromatograms, area for each component is obtained. From this data, area for a known
weight of component and area for fixed amount of EC is known. The ratio of area of component
to that of EC is plotted against the ratio of known weight of component to that of EC. This plot is
typically a straight line passing through the origin. The slope of this line is the “calibration
factor”.
Weight of individual components is unknown in reaction samples. From chromatograms,
area of EC and areas of individual components are obtained. Weight of EC is known from the
amount solvent used to dilute the reaction sample. Using the calibration factor for each
component, weight of the component is obtained. Figures C.1.1 to C.1.6 show the calibration
plots used in this study.

128
Figure C.1.1: Calibration plot for Methyl stearate (MS)
Figure C.1.2: Calibration plot for 1-Butanol (BuOH)
y = 0.8586x
R² = 0.9796
0
0.2
0.4
0.6
0.8
1
1.2
1.4
1.6
0 0.5 1 1.5 2
Wei
ght
rati
o M
S/E
C
Area ratio MS/EC
y = 0.8536x
R² = 0.9963
0
1
2
3
4
5
6
0 1 2 3 4 5 6
Wei
ght
rati
o B
uO
H/E
C
Area ratio BuOH/EC

129
Figure C.1.3: Calibration plot for Butyl stearate (BS)
Figure C.1.4: Calibration plot for Methanol (MeOH)
y = 0.9839x
R² = 0.9585
0
0.02
0.04
0.06
0.08
0.1
0.12
0.14
0 0.05 0.1 0.15
Wei
ght
rati
o B
S/E
C
Area ratio BS/EC
y = 1.9457x
R² = 0.9991
0
0.05
0.1
0.15
0.2
0.25
0 0.05 0.1 0.15
Wei
ght
rati
o M
eOH
/EC
Area ratio MeOH/EC

130
Figure C.1.5: Calibration plot for Dibutyl ether (DBE)
Figure C.1.6.:Calibration plot for Butyl methyl ether (BME)
y = 0.8842x
R² = 0.9835
0
0.5
1
1.5
2
2.5
3
0 1 2 3 4
Wei
ght
rati
o D
BE
/EC
Area ratio DBE/EC
y = 0.9612x
R² = 0.999
0
0.5
1
1.5
2
2.5
0 0.5 1 1.5 2 2.5
Wei
ght
rati
o B
ME
/EC
Area ratio BME/EC

131
Table C.2.1: UNIFAC group identification of the components
Group identification
Component name Group name Main Secondary vj Rk Qk
Methyl Stearate CH3 1 1 2 0.9011 0.848
CH2 1 2 15 0.6754 0.540
CH2COO 11 22 1 1.6764 1.420
n-Butanol CH3 1 1 1 0.9011 0.848
CH2 1 2 3 0.6754 0.540
OH 5 14 1 1 1.2
Butyl Stearate CH3 1 1 2 0.9011 0.848
CH2 1 2 18 0.6754 0.540
CH2COO 11 22 1 1.6764 1.420
Methanol CH3OH 6 15 1 1.4311 1.432
Di Butyl Ether CH3 1 1 2 0.9011 0.848
CH2 1 2 5 0.6754 0.540
CH2O 13 25 1 0.9183 0.780
Butyl Methyl Ether CH3 1 1 2 0.9011 0.848
CH2 1 2 2 0.6754 0.540
CH2O 13 25 1 0.9183 0.780
Water H2O 7 16 1 0.92 1.4
vj =number of groups in the component molecule

132
Table C.2.2: UNIFAC group interaction parameters
Main
Group 1 5 6 7 11 13
Main
Group Name CH2 OH CH3OH H2O CH2COO CH2O
1 CH2 0 986.5 697.2 1318 232.1 251.5
5 OH 156.4 0 -137.1 353.5 101.1 28.06
6 CH3OH 16.51 249.1 0 -181 -10.72 -128.6
7 H2O 300 -229.1 289.6 0 72.87 540.5
11 CH2COO 114.8 245.4 249.6 200.8 0 -235.7
13 CH2O 83.36 237.7 238.4 -314.7 461.3 0

133
Table C.3.1: Summary of experimental conditions and calculated errors
Run
Mole
ratio
BuOH:
MS
Catalyst
Loading
wt%
Temp.
(K) BuOH1
BS1 MeOH
1 BuOH
2 BS
2 MeOH
2
1 20 5.6 343 0 3 4 0.0022 0.0003 0.0004
2 20 5.6 353 0 3 3 0.0031 0.0004 0.0004
3 20 5.6 363 1 28 24 0.0120 0.0040 0.0030
4 20 2.8 363 1 32 30 0.0080 0.0027 0.0023
5 20 1.4 363 0 12 11 0.0020 0.0006 0.0005
6 10 4.8 363 1 11 12 0.0052 0.0023 0.0032
7 10 4.8 363 1 6 9 0.0054 0.0027 0.0040
8 5 4.9 363 4 21 23 0.0309 0.0171 0.0195
9 20 4.8 363 0 7 8 0.0041 0.0015 0.0016
10 30 4.8 363 0 8 7 0.0029 0.0013 0.0010
11 20 4.8 363 0 11 10 0.0035 0.0024 0.0020
12 20 2.8 373 1 12 11 0.0065 0.0024 0.0020
13 20 4.8 373 1 17 16 0.0074 0.0031 0.0024
14 20 5.6 373 1 14 16 0.0095 0.0026 0.0031
1-Frel - Average relative error % of the species (Eq.4.18)
2-Fabs - Average absolute error of the species (Eq. 4.19)

134
Figure C.3.1: Mole fraction profiles of species present in MS transesterification reactions at
70°C. Reaction conditions: initial mole ratio MS to BuOH = 1:20; catalyst loading = 5.6 wt%;
(-□- -MS;-■- - BS;-▲- -MeOH;-×- -DBE;-+- -BME; -○- -W).
Figure C.3.2: Mole fraction profiles of species present in MS transesterification reactions at
80oC. Reaction conditions: initial mole ratio MS to BuOH = 1:20; catalyst loading = 5.6 wt%;
(-□- -MS;-■- - BS;-▲- -MeOH;-×- -DBE;-+- -BME; -○- -W).
0
0.01
0.02
0.03
0.04
0.05
0 500 1000 1500
MS
mo
le f
ract
ion
Time (min)
0
0.01
0.02
0.03
0.04
0.05
0 500 1000 1500
MS
mole
fra
ctio
n
Time (min)

135
Figure C.3.3: Mole fraction profiles of species present in MS transesterification reactions at
90oC. Reaction conditions: initial mole ratio MS to BuOH = 1:20; catalyst loading = 5.6 wt%;
(-□- -MS;-■- - BS;-▲- -MeOH;-×- -DBE;-+- -BME; -○- -W).
Figure C.3.4: Mole fraction profiles of species present in MS transesterification reactions at
90oC. Reaction conditions: initial mole ratio MS to BuOH = 1:20; catalyst loading = 2.8 wt%;
(-□- -MS;-■- - BS;-▲- -MeOH;-×- -DBE;-+- -BME; -○- -W).
0
0.01
0.02
0.03
0.04
0.05
0 500 1000 1500
MS
mole
fra
ctio
n
Time (min)
0
0.01
0.02
0.03
0.04
0.05
0 500 1000 1500
MS
mole
fra
ctio
n
Time (min)

136
Figure C.3.5: Mole fraction profiles of species present in MS transesterification reactions at
90oC. Reaction conditions: initial mole ratio MS to BuOH = 1:20; catalyst loading = 1.4 wt%;
(-□- -MS;-■- - BS;-▲- -MeOH;-×- -DBE;-+- -BME; -○- -W).
Figure C.3.6: Mole fraction profiles of species present in MS transesterification reactions at
90oC. Reaction conditions: initial mole ratio MS to BuOH = 1:10; catalyst loading = 4.8 wt%;
(-□- -MS;-■- - BS;-▲- -MeOH;-×- -DBE;-+- -BME; -○- -W).
0
0.01
0.02
0.03
0.04
0.05
0 500 1000 1500
MS
mole
fra
ctio
n
Time (min)
0
0.01
0.02
0.03
0.04
0.05
0.06
0.07
0.08
0.09
0 500 1000 1500
MS
mole
fra
ctio
n
Time (min)

137
Figure C.3.7: Mole fraction profiles of species present in MS transesterification reactions at
90oC. Reaction conditions: initial mole ratio MS to BuOH = 1:10; catalyst loading = 4.8 wt%;
(-□- -MS;-■- - BS;-▲- -MeOH;-×- -DBE;-+- -BME; -○- -W).
Figure C.3.8: Mole fraction profiles of species present in MS transesterification reactions at
90oC. Reaction conditions: initial mole ratio MS to BuOH = 1:5; catalyst loading = 4.8 wt%;
(-□- -MS;-■- - BS;-▲- -MeOH;-×- -DBE;-+- -BME; -○- -W).
0
0.01
0.02
0.03
0.04
0.05
0.06
0.07
0.08
0.09
0 500 1000 1500
MS
mole
fra
ctio
n
Time (min)
0
0.02
0.04
0.06
0.08
0.1
0.12
0.14
0.16
0 500 1000 1500
MS
mole
fra
ctio
n
Time (min)

138
Figure C.3.9: Mole fraction profiles of species present in MS transesterification reactions at
90oC. Reaction conditions: initial mole ratio MS to BuOH = 1:30; catalyst loading = 4.8 wt%;
(-□- -MS;-■- - BS;-▲- -MeOH;-×- -DBE;-+- -BME; -○- -W).
Figure C.3.10: Mole fraction profiles of species present in MS transesterification reactions at
90oC. Reaction conditions: initial mole ratio MS to BuOH = 1:20; catalyst loading = 4.8 wt%
(-□- -MS;-■- - BS;-▲- -MeOH;-×- -DBE;-+- -BME; -○- -W).
0
0.01
0.02
0.03
0 500 1000 1500 2000 2500 3000
MS
mole
fra
ctio
n
Time (min)
0
0.01
0.02
0.03
0.04
0.05
0 500 1000 1500 2000 2500 3000
MS
mole
fra
ctio
n
Time (min)

139
Figure C.3.11: Mole fraction profiles of species present in MS transesterification reactions at
100oC. Reaction conditions: initial mole ratio MS to BuOH = 1:20; catalyst loading = 2.8 wt%;
(-□- -MS;-■- - BS;-▲- -MeOH;-×- -DBE;-+- -BME; -○- -W).
Figure C.3.12: Mole fraction profiles of species present in MS transesterification reactions at
100oC. Reaction conditions: initial mole ratio MS to BuOH = 1:20; catalyst loading = 5.6 wt%;
(-□- -MS;-■- - BS;-▲- -MeOH;-×- -DBE;-+- -BME; -○- -W).
0
0.01
0.02
0.03
0.04
0.05
0 500 1000 1500 2000 2500 3000
MS
mole
fra
ctio
n
Time (min)
0
0.01
0.02
0.03
0.04
0.05
0 500 1000 1500 2000 2500 3000
MS
mole
fra
ctio
n
Time (min)

140
REFERENCES

141
4.7. References
1. Knothe, G., Krahl, J., Van Gerpen, J., Eds., The Biodiesel Handbook. 2005, Champaign,
IL: AOCS Press: .
2. Lee, I., L.A. Johnson, and E.G. Hammond, Reducing the crystallization temperature of
biodiesel by winterizing methyl soyate. Journal of the American Oil Chemists Society,
1996. 73(5): p. 631-636.
3. Wahlen, B.D., B.A. Barney, and L.C. Seefeldt, Synthesis of Biodiesel from Mixed
Feedstocks and Longer Chain Alcohols Using an Acid-Catalyzed Method. Energy &
Fuels, 2008. 22(6): p. 4223-4228.
4. Wang, P.S., M.E. Tat, and J. Van Gerpen, The production of fatty acid isopropyl esters
and their use as a diesel engine fuel. Journal of the American Oil Chemists Society,
2005. 82(11): p. 845-849.
5. Knothe, G., "Designer" biodiesel: Optimizing fatty ester composition to improve fuel
properties. Energy & Fuels, 2008. 22(2): p. 1358-1364.
6. Miller, D.J., et al., Process for producing mixed esters of fatty acids as biofuels. 2008:
Patent application, 12/313,343, USA.
7. Freedman, B., R.O. Butterfield, and E.H. Pryde, Transesterification kinetics of soybean
oil. Journal of the American Oil Chemists Society, 1986. 63(10): p. 1375-1380.
8. Bock, H., M. Jimoh, and G. Wozny, Analysis of reactive distillation using the
esterification of acetic acid as an example. Chemical Engineering & Technology, 1997.
20(3): p. 182-191.
9. Helfferich, F.G., Ion exchange. 1st ed. 1962, New York McGraw Hill.
10. Rao, Y., Chemical engineering Thermodynamics. 1st ed. 1997, Hyderabad: Universities
Press.

142
11. Blagov, S., et al., Influence of ion-exchange resin catalysts on side reactions of the
esterification of n-Butanol with acetic acid. Chemical Engineering Science, 2006. 61(2):
p. 753-765.
12. Gangadwala, J., et al., Esterification of acetic acid with butanol in the presence of ion-
exchange resins as catalysts. Industrial & Engineering Chemistry Research, 2003.
42(10): p. 2146-2155.
13. Song, W., et al., Measurement of Residue Curve Maps and Heterogeneous Kinetics in
Methyl Acetate Synthesis. Industrial & Engineering Chemistry Research, 1998. 37(5): p.
1917-1928.
14. Bozek-Winkler, E. and J.r. Gmehling, Transesterification of Methyl Acetate and n-
Butanol Catalyzed by Amberlyst 15. Industrial & Engineering Chemistry Research, 2006.
45(20): p. 6648-6654.
15. Kolah, A.K., et al., Reaction Kinetics of the Catalytic Esterification of Citric Acid with
Ethanol. Industrial & Engineering Chemistry Research, 2006. 46(10): p. 3180-3187.

143
Chapter 5: Butyl stearate production using distillation column with external side reactors:
Process concept, simulation and analysis
5.1. Summary
An alternate approach to direct esterification of fatty acids for producing higher alcohol
esters is to first make the fatty acid methyl esters (FAME) via traditional base catalysis and then
transesterify FAME with other alcohols using heterogeneous catalysts to produce the desired
esters. Conventional reactive distillation will likely be uneconomical for this reaction system
because of the slow reaction rate and temperature limitations. Methyl and butyl stearate were
chosen as model compounds to represent FAMEs and FABEs respectively. We present here a
study that evaluates the potential of carrying out distillation in a column with external side
reactors for continuous transesterification of FAME with 1-butanol. Process simulation using
Aspen Plus describes column performance as a function of operating conditions, the number of
side reactors utilized, requirement for a pre-reactor, location of side draws and re-entry points in
the column. The column configuration that maximizes conversion of the methyl ester to its butyl
counterpart is presented.
5.2. Introduction
Fatty acid butyl esters (FABE) are commercially important chemicals used in a wide
range of applications such as lubricants, emulsifiers and detergents. Recent literature suggests
that higher alcohol chain fatty acid esters such as FABE improve cold flow properties of
biodiesel and can be used as biodiesel constituents without any modification to the existing
diesel engine[1, 2]. Conventional processes to produce higher alcohol fatty acid esters using
batch reactors followed by distillation operation is energy intensive. An alternate approach to

144
direct esterification of fatty acids for producing higher alcohol esters is to first make the fatty
acid methyl esters (FAME) via traditional base catalysis and then transesterify FAME with other
alcohols using heterogeneous catalysts to produce the desired esters. This work focuses on
evaluating techniques that reduce energy consumption in producing higher alcohol fatty acid
esters such as FABE. Butyl stearate (here in, BS) was chosen as model compound to represent
FABE.
Process intensification (PI) provides an opportunity to use engineering principles to
simplify processes, improve energy efficiency, decrease waste production, and lower operational
costs. It helps in developing a sustainable processing technology [3-5]. PI can be achieved by
combining functions or phenomena into one operation, by adding or enhancing targeted
functions in a process, and/or by using alternative energy sources to enhance performance. One
such PI technique is reactive distillation (RD), which employs integration of chemical reaction
and physical separation into one column.
Reactive distillation has been extensively studied in the literature and is practiced
industrially to produce, among other products, organic acid esters and ethers of commercial
importance. However, it is not always advantageous to use RD, for example in systems in which
temperature favorable for reaction and that for separation based on vapor-liquid equilibrium are
not complementary. Another issue that mitigates RD use is limited catalyst life time because of
deactivation and the resulting need to change the catalyst in an RD configuration. It is labor
intensive to change heterogeneous catalyst packing within an RD column, thus adding to the
operational cost of the process. In chemical systems with very low reaction rates, high catalyst
hold up is required for achieving high conversion. But high catalyst hold up in RD affects
separation operation by minimizing interfacial area between vapor and liquid.
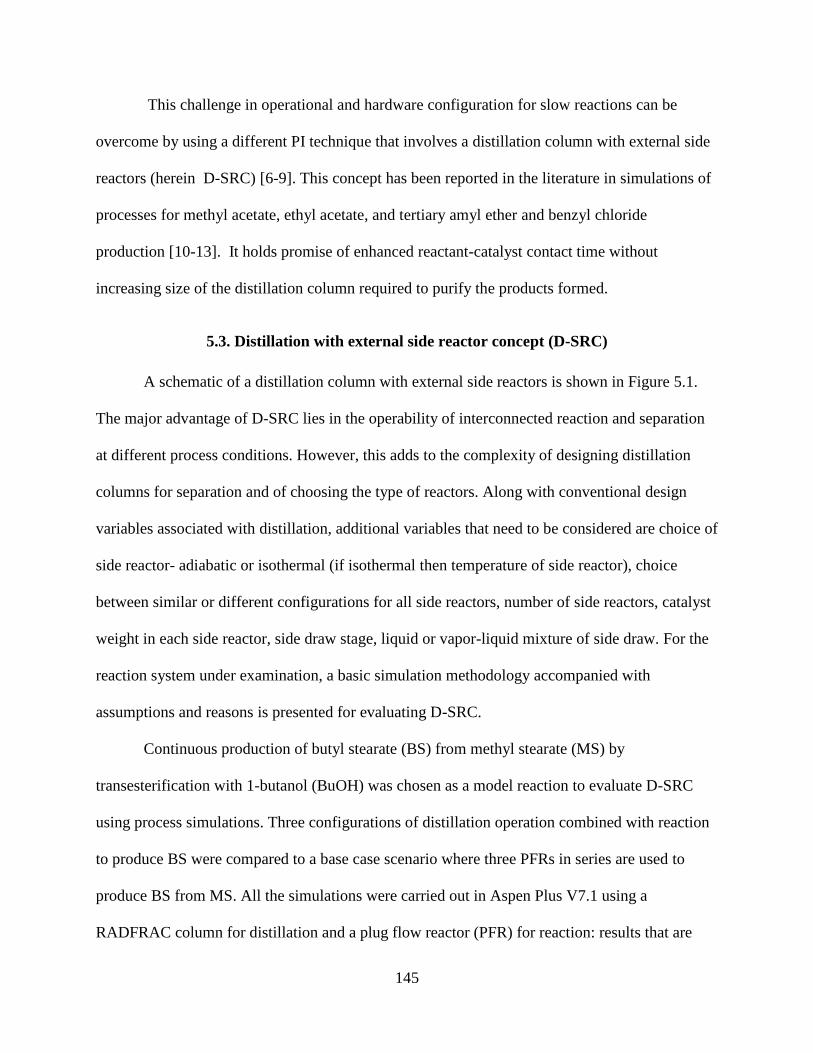
145
This challenge in operational and hardware configuration for slow reactions can be
overcome by using a different PI technique that involves a distillation column with external side
reactors (herein D-SRC) [6-9]. This concept has been reported in the literature in simulations of
processes for methyl acetate, ethyl acetate, and tertiary amyl ether and benzyl chloride
production [10-13]. It holds promise of enhanced reactant-catalyst contact time without
increasing size of the distillation column required to purify the products formed.
5.3. Distillation with external side reactor concept (D-SRC)
A schematic of a distillation column with external side reactors is shown in Figure 5.1.
The major advantage of D-SRC lies in the operability of interconnected reaction and separation
at different process conditions. However, this adds to the complexity of designing distillation
columns for separation and of choosing the type of reactors. Along with conventional design
variables associated with distillation, additional variables that need to be considered are choice of
side reactor- adiabatic or isothermal (if isothermal then temperature of side reactor), choice
between similar or different configurations for all side reactors, number of side reactors, catalyst
weight in each side reactor, side draw stage, liquid or vapor-liquid mixture of side draw. For the
reaction system under examination, a basic simulation methodology accompanied with
assumptions and reasons is presented for evaluating D-SRC.
Continuous production of butyl stearate (BS) from methyl stearate (MS) by
transesterification with 1-butanol (BuOH) was chosen as a model reaction to evaluate D-SRC
using process simulations. Three configurations of distillation operation combined with reaction
to produce BS were compared to a base case scenario where three PFRs in series are used to
produce BS from MS. All the simulations were carried out in Aspen Plus V7.1 using a
RADFRAC column for distillation and a plug flow reactor (PFR) for reaction: results that are

146
close to highest MS conversion achievable in a given configuration are presented and a
simulation methodology is proposed for D-SRC evaluation.

147
Figure 5.1: Schematic of distillation column with external side reactors and flow diagram for
Case 3.
Top product
Bottom product
PFR 2
PFR 1
MS
BuOH
PFR 3

148
5.3.1. MS transesterification reaction
MS transesterification with BuOH can be represented by a single, reversible second
order reaction as shown in R1
BS + MeOH where a
f
K
kk
,1
r1,
(R1) MS + BuOH
The alcohol etherification reactions are given as
WDBEk
BuOH 22 (R2)
WBMEk
MeOHBuOH 3 (R3)
The components involved in MS transesterification reaction are BuOH, MS, BS,
methanol (MeOH), dibutyl ether (DBE), butyl methyl ether (BME) and water (W). Reaction
kinetics and chemical equilibrium data for MS transesterification with BuOH catalyzed by
Amberlyst 15 is available in literature [14] from our prior study. After making appropriate unit
adjustments to kinetic parameters to make them compatible for use in Aspen Plus, these kinetics
were used in simulating and evaluating D-SRC. Since MS converts only to BS (R1) and BuOH
can convert both to BS and ethers (R2&R3), the four configurations presented in this study are
compared in terms of MS conversion and BuOH selectivity towards BS.
5.3.2. Boiling point ranking
In order to study the separation using distillation, it is important to determine the boiling
point ranking and relative volatilities of components involved in this reaction. The boiling point
ranking for this system is BS>MS>DBE>BuOH>W>BME>MeOH. For the desired MS
fk ,1
rk ,1

149
transesterification reaction in this study, MeOH is the low boiler and stearates are heavy boilers.
Methanol can be taken out from top of the column as a product, thus driving the reaction to
completion. BuOH is an intermediate boiler, which at first glance allows the column to be
operated rich in BuOH and thus makes this reaction ideal for evaluating D-SRC. However, when
side reactions are taken into account, DBE is the intermediate boiler. This makes top of the
column rich in BuOH and bottom part of the column rich in DBE. These observations help
decide the liquid side draw stage that goes to the reactor from the column.
5.3.3. Simulation methodology
A simulation methodology to configure D-SRC similar to that proposed by Baur et
al.[15] is shown in Figure 5.2. This methodology was used to search for distillation with side
reactor configurations that resulted in highest MS conversion and BuOH selectivity to BS. In
Case 1, three isothermal PFRs were connected in series. In this scenario, MS conversion is
limited by R1 chemical equilibrium. Initial mole ratio of BuOH to MS was increased to improve
MS conversion. In Case 2, each PFR is connected to a distillation column and bottom product of
the column is sent to the next PFR. In Case 3, a RADFRAC distillation column is connected to
three isothermal PFRs. In Case 4, one of the side reactors in Case 3 was used as pre reactor to the
distillation column.
BuOH can form azeotrope with water resulting in water build up and phase separation in
the column. Since ester hydrolysis is not considered in reaction kinetics in this study, water
entering PFRs as a reactant will jeopardize the objective of this study. By decreasing the number
of stages in rectifying section and adjusting reflux ratio, water build up in the column can be
avoided. This strategy comes with a disadvantage that unreacted BuOH is collected as a top
product. Simulations that resulted in high MS conversion with an optimum reflux ratio and total

150
number of stages without water build up are presented in this study. Assumptions and
explanations based on chemical engineering principles that were used as guidelines in selecting
side draw stage, side draw return stage and PFR reaction temperature are discussed in the
following sections. These guidelines will decrease the design complexity of D-SRC.
Set column parameters
- MS feed flow fixed
- Column configuration
(number of stages, reflux
ratio/ reboiler duty)
- Reactor configuration fixed
- Number of PFRs
Search for high MS
conversion
configuration
Is the configuration
satisfactory ?
NO
Phase
separation
Decanter
requirement
YES
Calculate BS
yield, MS
conversion
Maximize flow to PFRs
Adjust catalyst loading in PFRs to
achieve maximum conversion
Adjust feed ratio, side draw and return
stages
Adjust PFR temperature
High conversion of MS
Figure 5.2: Simulation methodology for D-SRC evaluation.

151
5.3.3.1. Side draw stage
It is assumed that only liquid is withdrawn from the stages on the column. This eliminates
energy required for compression when vapor-liquid mixture is drawn from the column. Liquid
return lines from reactors are fed onto the stage directly below the stage from which the side
draw was taken. This ensures that BS produced in the reactor will not enter the same reactor
again, as it is the heavy key in this system. Methanol, which is the light key, will enter in very
small amounts into the reactor because it is predominantly in the vapor phase in the column, and
thus etherification reactions (R3) will be minimized. Following these assumptions, the location
of the side draw stage is kept as a variable; only the case for which maximum conversion of MS
is achieved is reported. In Aspen Plus, side draws increase the number of recycle streams,
making convergence of the simulation difficult. Therefore, tear streams are used where
appropriate as initial guesses for recycle streams to guide the simulation to convergence. For
preliminary simulations, in order to attain simulation convergence, side reactor input flow was
started at 0.05( mol/min) and increased to 0.5 mol/min in small steps. After achieving
convergence, the results for side stream outlets from reactors were used as initial guesses for all
other simulations.
5.3.3.2. Choice of side reactor: reaction temperature and pressure
MS transesterification is very slow at lower reaction temperature, necessitating high
catalyst loading and higher reaction temperatures. In order to achieve high conversion of MS, all
PFRs used in this study are 0.15m dia × 1.5m long with a catalyst loading of 20 kg, operating at
an isothermal reaction temperature of 353 K and at a pressure of 3 atm. The effect of increasing
reaction temperature on BS selectivity and yield in a simulated plug flow reactor (PFR) with the
same physical configuration as that used in D-SRC simulations is shown in Figure 5.3. It is clear

152
from these results that BS yield drastically decreases because etherification of BuOH is faster
than MS transesterification. This result gives insight into an essential guideline in evaluating D-
SRC for MS transesterification, and aids in determining the temperature of the side reactors. As
DBE and BuOH are the intermediate boilers in the system, when the column is operated at
atmospheric pressure, the column temperature profile will be close to will be 373 K throughout.
If liquid is drawn from any stage on the stage at this temperature and reacted in an adiabatic
PFR, ether yield will be higher than the desired ester because a) etherification kinetics faster than
transesterification b) transesterification is a thermally neutral reaction whereas etherification is
an exothermic reaction. Increase in temperature profile along the length of adiabatic PFR will
only help etherification and not transesterification. By doing preliminary simulations of
distillation with adiabatic side reactors and comparing to that with isothermal PFRs, it was
verified that he latter case gave higher MS conversion and selectivity of BuOH towards BS.
Therefore, isothermal PFRs at 353 K were used for comparison in all the simulations. To keep
MeOH produced in PFRs in the liquid state, all the reactors were operated at 3 atm pressure.

153
Figure 5.3: Effect of reactor PFR reaction temperature on MS conversion and BuOH selectivity
towards BS. (■)- BS selectivity; (♦) - MS conversion. Reaction conditions: Feed mole ratio of
BuOH to MS = 2; Catalyst weight in reactor= 20 kg; Pressure = 3 atm.
5.4. Results
5.4.1. Cases 1&2: Three PFRs in series
Simulation results for producing BS using three PFRs in series (Figure 5.4a) with
increasing initial mole ratio are presented in Table 5.1. In Cases 1a and 1b, with increase in mole
ratio of BuOH:MS from 1 to 2, MS conversion increases as expected.
Case 2 employs a different configuration that includes distillation columns after each
PFR. A block flow diagram for this case is shown in Figure 5.4b. The conversion of MS is
higher in Case 2 because of MeoH removal in each distillation column.
0
10
20
30
40
50
60
70
80
90
100
0
10
20
30
40
50
60
70
80
90
100
340 350 360 370 380 390 400
BuO
H
sele
ctiv
ity t
ow
ards
BS
%
MS
Con
ver
sion
%
Temperature (K)

154
Figure 5.4a: Flow diagram representing cases 1a and 1b.
Figure 5.4b: Flow diagram representing case 2.
Table 5.1: Simulation results for cases 1 and 2.
Case 1a 1b 2
MS feed rate [mol/min] 0.1 0.1 0.1
Feed BuOH:MS ratio 1 2 2
PFRs in series 3 3 3
MS conversion 46.9 70.7 85.5
BuOH Selectivity to BS 54.3 52.6 61.0
Product
MS+BUOH
PFR 1
PFR 2
PFR 3
MS+BUOHPFR 1
W,
BME, MeOH
PFR 2
W,
BME, MeOH
W,
BME, MeOH
PFR 3
MS, BS, DBE

155
5.4.2. Cases 3: Distillation with three external reactors
Simulation results for BS production using distillation with three external side reactors
(see Figure 1) and increasing feed mole ratio of BuOH:MS is presented in Table 2a. MS was fed
on stage 4 and BuOH was fed on stage 14 in these cases. Specified and calculated column
parameters for the configuration with highest MS conversion in each case are presented in Table
5.2b.
5.4.3. Case 4: Distillation with two external reactors and pre-reactor
Following the results from Cases 1, 2 and3, Case 4 is formulated by adding a PFR pre-
reactor to Case 3 to improve MS conversion. An example flow diagram for Case 4 is shown in
Figure 5.5. Product from prereactor is fed to the column on stage 7 in the three cases. The
number of side reactors and BuOH:MS mole ratio of feed were used as variables. Number of
side reactors was changed from 1 to 3, initial feed mole ratio of BuOH:MS was changed from 1
to 3 and temperature of PFRs was changed from 353 K to 373 K. Simulations that resulted in
highest MS conversion and BUOH selectivity towards BS are presented in Table 5.2a.
Table 5.2a: Simulation results for cases 3 and 4.
Case 3a 3b 3c 4a 4b 4c
MS feed rate [mol/min] 0.1 0.1 0.1 0.1 0.1 0.1
Feed BuOH:MS ratio 1 2 3 2 3 3
Side reactor PFRs 3 3 3 2 2 1
MS conversion % 50.2 72.6 80.4 90.6 93.3 87.8
BuOH selectivity towards BS 61.8 61.0 53.8 61.0 61.4 67.1
Number of pre- reactors -- -- -- 1 1 1

156
Figure 5.5: Flow diagram representing cases 4a, 4b and 4c.
Top product
Bottom product
PFR 3
PFR 2
MS+BuOH
PFR 1

157
Table 5.2b:Column properties and conditions from simulation of Cases 3 and 4.
Case 3a 3b 3c 4a 4b 4c
Number of stages 16 16 16 16 16 16
Condenser Total Total Total Total Total Total
Reboiler Kettle Kettle Kettle Kettle Kettle Kettle
Top stage pressure [atm] 1 1 1 1 1 1
Specified reflux ratio 0.85 -- -- -- -- --
Specified distillate rate [mol/min] 0.10 0.20 0.26 0.20 0.26 0.26
Calculated molar reflux ratio 0.85 0.15 0.21 2.61 2.15 2.82
Calculated bottoms rate [mol/min] 0.12 0.12 0.17 0.12 0.17 0.17
Calculated boilup rate [mol/min] 0.48 0.83 1.30 0.76 1.32 1.33
Calculated distillate rate [mol/min] 0.10 0.20 0.26 0.20 0.26 0.26
Condenser / top stage temperature [K] 345 355 357 347 353 355
Condenser / top stage pressure [bar] 1.01 1.01 1.01 1.01 1.01 1.01
Condenser / top stage heat duty [J/sec] 123.22 164.69 228.62 488.73 582.12 714.47
Condenser / top stage reflux rate [mol/min] 0.09 0.03 0.05 0.52 0.56 0.74
Reboiler pressure [bar] 1.01 1.01 1.01 1.01 1.01 1.01
Reboiler temperature [K] 572.82 492.40 413.96 505.44 411.28 409.04
Reboiler heat duty [J/sec] 1048 1000 1020 1020 1020 1020
Side draw to PFR1 stage 7 7 7 7 7 7
Side draw to PFR2 stage 9 9 9 9 9 --
Side draw to PFR3 stage 11 11 11 -- -- --
Return from PFR1 stage 8 8 8 8 8 9
Return from PFR2 stage 10 10 10 10 10 --
Return from PFR3 stage 12 12 12 -- -- --

158
5.5. Conclusion
D-SRC is a useful PI technique for reactions that require different operating conditions
for reaction and separation. In this study, D-SRC is evaluated for MS transesterification,
characterized by very slow reaction rate at lower temperatures and high side product formation at
higher temperatures. The best case scenario identified using D-SRC is with a pre-reactor and one
distillation column with two side reactors at stages 7 and 9. Results for this case are superior to
the conventional ester production technique involving three PFRs in series with intermediate
distillation to remove methanol. Even though this configuration for FAME transesterification
with BuOH is better than conventional process, it involves etherification, making this system
unsuitable for economic evaluation of D-SRC.

159
REFERENCES

160
5.6. References
1. Miller, D.J., et al., Process for producing mixed esters of fatty acids as biofuels. 2008:
Patent application, 12/313,343, USA.
2. Hellier, P., et al., The Influence of Fatty Acid Ester Alcohol Moiety Molecular Structure
on Diesel Combustion and Emissions. Energy & Fuels, 2012. 26(3): p. 1912-1927.
3. Stankiewicz, A.I. and J.A. Moulijn, Process intensification: Transforming chemical
engineering. Chemical Engineering Progress, 2000. 96(1): p. 22-34.
4. Schembecker, G. and S. Tlatlik, Process synthesis for reactive separations. Chemical
Engineering and Processing, 2003. 42(3): p. 179-189.
5. Lutze, P., R. Gani, and J.M. Woodley, Process intensification: A perspective on process
synthesis. Chemical Engineering and Processing: Process Intensification, 2010. 49(6): p.
547-558.
6. Baur, R. and R. Krishna, Distillation column with reactive pump arounds: an alternative
to reactive distillation. Chemical Engineering and Processing, 2004. 43(3): p. 435-445.
7. Kaymak, D.B. and W.L. Luyben, Design of Distillation Columns with External Side
Reactors. Industrial & Engineering Chemistry Research, 2004. 43(25): p. 8049-8056.
8. Jakobsson, K., et al., Modelling of a side reactor configuration combining reaction and
distillation. Chemical Engineering Science, 2002. 57(9): p. 1521-1524.
9. Schoenmakers, H. and W. Buehler, Distillation column with external reactors - an
alternative to the reaction column. Chem.-Ing.-Tech., 1982. 54(2): p. 163.
10. Ding, L.-H., et al., Optimum Design and Analysis Based on Independent Reaction
Amount for Distillation Column with Side Reactors: Production of Benzyl Chloride. Ind.
Eng. Chem. Res., 2011. 50(19): p. 11143-11152.
11. Tsai, R.-C., et al., Design and Control of the Side Reactor Configuration for Production
of Ethyl Acetate. Industrial & Engineering Chemistry Research, 2008. 47(23): p. 9472-
9484.

161
12. Ouni, T., et al., Enhancing productivity of side reactor configuration through optimizing
the reaction conditions. Chem. Eng. Res. Des., 2004. 82(A2): p. 167-174.
13. Ojeda Nava, J.A., R. Baur, and R. Krishna, Combining Distillation and Heterogeneous
Catalytic Reactors. Chemical Engineering Research and Design, 2004. 82(2): p. 160-166.
14. Pappu, V.K.S., et al., A kinetic model of the Amberlyst-15 catalyzed transesterification of
methyl stearate with n-butanol. Bioresource Technology, 2011. 102(5): p. 4270-4272.
15. Baur, R. and R. Krishna, Distillation column with reactive pump arounds: an alternative
to reactive distillation. Chem. Eng. Process., 2003. 43(3): p. 435-445.

162
Chapter 6: Butyric acid esterification over solid acid catalysts: The effect of alcohol carbon
chain length and a kinetic model for Amberlyst 70 catalyzed esterification with 2-
ethylhexanol
6.1. Summary
Butyric acid esters can improve the cold flow properties of diesel fuels and are thus
attractive biofuel constituents. Esters produced from biobutyric acid can also be commercially
important renewable chemicals. This study focuses on liquid phase esterification of butyric acid
with a series of linear and branched alcohols. The effect of increasing alcohol carbon chain
length and branching on esterification rate at 60°C is presented. Four strong cation exchange
resins, Amberlyst™ 15, Amberlyst™ 36, Amberlyst™ BD 20, and Amberlyst™ 70, are
examined along with p-toluenesulfonic acid as a homogeneous catalyst. For all catalysts, the
decrease in turnover number (TON) with increasing carbon chain length of the alcohol is
described in terms of steric hindrance and alcohol polarity. Detailed kinetics of butyric acid
esterification with 2-ethylhexanol using Amberlyst™ 70 catalyst was studied in a batch reactor.
An activity-based, pseudo-homogeneous kinetic model that includes autocatalysis by butyric
acid is presented for the Amberlyst 70 ion exchange resin catalyst.
6.2. Introduction
Esterification of carboxylic acids is a widely studied and industrially important reaction
[1]. Carboxylic acid esters can be used as plasticizers, industrial solvents, pharmaceuticals,
agrochemicals, perfumes, and food flavors [2]. Long chain fatty acid esters can be used as
biofuel components [3, 4]. The traditional route for preparing esters is via reaction of the
carboxylic acid with an alcohol using a homogeneous catalysts such as sulfuric acid [5] or p-

163
toluene sulfonic acid [6]. Use of esters as biorenewable chemicals and as “green” solvents has
encouraged the study of esterification reactions using heterogeneous catalysts [7-9].
Solid acid catalysts used for esterification include, but are not limited to, Amberlyst 15
[8, 10], Amberlite IR-120 [11], Nafion/silica nanocomposite SAC-13 [12, 13], polymer
supported sulfonic acid Smopex-101 [14], heteropoly acid supported on ion exchange resins [7,
15], Amberlyst 36 [16], modified zirconia [17], Dowex 50WX8-400 [18] and Dowex 50WX2
[19].
There is growing interest to produce butyric acid (butanoic acid, herein BA) by
fermentation from biorenewable resources [20, 21]. Using BA as a platform molecule, n-butanol
can be synthesized by hydrogenolysis (Gaertner et al., 2009); 2-ethylhexanol (herein 2-EHA) can
be produced by the Guerbet reaction of n-butanol (Kim et al., 2011), and the secondary alcohol
4-heptanol can be made via ketonization and hydrogenation ([22-24]. Esters of BA made with
these alcohols are commercially important renewable chemicals and potential biofuel
constituents.
The effect of alcohol chain length and branching on esterification rate of several
carboxylic acids is reported in the literature [12, 14, 25]. Erdem and Cebe [25] conducted
heterogeneously catalyzed esterification of propanoic acid with different alcohols using dioxane
as solvent. They observed that as the chain length and branching increased, esterification rate
rapidly decreased because of steric hindrance of alcohols. They described the steric hindrance in
terms of the Taft equation [26].
Ju et al. [18] reported esterification kinetics of BA with n-butanol, but little information
exists for the behavior of BA in esterification with other alcohols. With the potential of using BA
as platform molecule for the production of biofuel constituents, we report here the results of

164
esterification reactivity of various alcohols with BA using both homogeneous and heterogeneous
catalysts. Heterogeneous catalysts include Amberlyst 15, Amberlyst 70, Amberlyst BD 20, and
Amberlyst 36 cation exchange resins; esterification rate of different alcohols on these solid acid
catalysts is presented and compared to the rate obtained with p-toluene sulfonic acid in solution
as a homogeneous catalyst. To further understand BA esterification, a detailed kinetic study of
the solid acid-catalyzed esterification of BA with 2-EHA is also presented; the effects of
temperature, catalyst loading, and initial mole ratio of 2-EHA to BA in esterification have been
examined.
6.3. Materials and Methods
Butyric acid (≥ 99%), methanol, ethanol, 1-propanol, 2-propanol, 2-butanol, 3-butanol,
iso-butanol (2-methyl-1-propanol), 2-ethylhexanol (2-EHA), 4-heptanone, methyl butyrate, ethyl
butyrate, propyl butyrate, butyl butyrate, heptyl butyrate, octyl butyrate and butyryl chloride
were purchased from Sigma-Aldrich and used in their as-received states. 1-butanol was obtained
from Mallinckrodt-Baker, Inc. Preparation of 4-heptanol and 2-ethylhexyl butyrate is described
below.
Ion exchange resin catalyst Amberlyst 15 and Amberlyst 36 were purchased from Sigma
Aldrich. Amberlyst 70 and Amberlyst BD 20 were obtained from the Dow Chemical Company.
Ion-exchange capacity for the Amberlyst resins was determined by titration using 0.1M NaOH
solution in water. The values obtained were 4.3 eq/kg for Amberlyst 15, 5.1 eq/kg for Amberlyst
BD 20, 5.4 eq/kg for Amberlyst 36, and 2.7 eq/kg for Amberlyst 70. All ion-exchange resin
catalysts were washed with deionized water and ethanol until the supernatant liquid was
colorless and then dried overnight at 100°C under vacuum before using in reaction.

165
6.3.1. Preparation of 4-Heptanol
In a 2L Parr 4520 bench top reactor, 1L of 4-heptanone was hydrogenated at 1000 psi and
180°C using 10 gm of 5% Ru/C as catalyst. Identity of the product 4-heptanol was confirmed by
gas chromatography; final purity was >98%. The 4-heptanol obtained was used in esterification
of BA.
6.3.2. Preparation of 2-ethylhexyl butyrate (2-EHB)
In a 250 ml three necked glass reactor fitted with a condenser and a thermal probe, 2-
EHA (20 ml) was added to Na2CO3 (19.2 gm) and stirred at room temperature. Butyryl chloride
(21 ml) was added drop wise over a period of 2 hours. Reactor contents were heated to 55°C, and
stirring was continued until no gas bubbles were observed. After cooling, the solution was
washed twice with de-ionized water and the organic layer was separated and washed with 0.1M
NaOH solution in water to remove any unreacted BA. After decanting the organic layer,
magnesium sulfate was added to the product 2-EHB to remove trace amounts of water. Purity of
the product was confirmed by gas chromatography as >98%. This material was used as the
standard in quantitative analysis of 2-EHB obtained in BA esterification with 2-EHA.
6.3.3. Batch experiments
Batch esterification reactions were performed in a Parr 5000 Multi-Reactor System
equipped with temperature control (±0.2°C) and stirring speed control (0-1400 rpm).
Experiments were performed under solvent-free conditions. In a typical experiment, a measured
quantity of alcohol and catalyst were charged into the reactor. The reactor was sealed and heating
was initiated. Once the desired temperature was reached, the required amount of BA was injected
into the reactor via syringe and stirring was started - that instant was taken as zero reaction time.

166
Approximately one-milliliter samples were taken at specified time intervals over the first three
hours of reaction via use of a syringe attached to a sample port. Equilibrium samples were
collected after 24 hours of reaction. Samples were passed through a 2m filter attached to the
end of the sample port to separate the sample solution from solid catalyst.
6.3.4. Sample analysis
All reaction samples from BA esterification with different alcohols except 2-EHA were
analyzed using a HP-5890 Series II gas chromatograph with flame ionization detector. An
Aquawax-DA 30m column with 0.53mm ID and 1.0m film thickness was used to separate the
components. Oven temperature maintained initially at 40C for 1.0 min, increased at 20C/min
to 250C, and then maintained at that temperature for an additional 2.0 min. Injector and detector
temperatures were maintained at 250C and 300C respectively. Ethyl caprylate was used as the
internal standard. A Varian MSWS 450 with a packed Chromosorb 101 column and a thermal
conductivity detector was used for analyzing samples from BA esterification with 2-EHA. Oven
temperature was maintained initially at 200C for 0.5 min, increased at 30C/min to 300 C, and
then maintained at that temperature for an additional 2.0 min. Injector and detector temperatures
were maintained at 250 and 260C, respectively. Calibration plots used in this study are
presented in Section A4.5. To compare BA esterification reactivity among different alcohols,
turnover number (TON, kmol BA/kmol H+/hr) was calculated from the observed initial reaction
rate as follows.
catsolcat
totaliniBA
IEW
MVrTON
)(
)()(
(6.1)

167
For heterogeneous catalysts, it is assumed that all acid sites participate in reaction. To
determine initial rate, a polynomial curve was fitted to the plot of mole fraction of BA vs. time
from experiment; initial reaction rate was taken as the slope of the polynomial at time zero.
6.4. Results and Discussion
6.4.1. Esterification of BA with different alcohols
Esterification rate of BA with several alcohols is shown in Figure 6.1a in terms of TON.
The trend in reactivity with alcohol carbon number reiterates the observation of Erdem et al.
[25]: reactivity decreases significantly from methanol to ethanol, and declines much more slowly
as the alcohol carbon number increases from two to eight. This decline in reactivity is observed
in both homogeneously and heterogeneously catalyzed reactions. As the number of carbon atoms
increases in linear alcohols, the -OH molar concentration decreases logarithmically [27]. This
makes the alcohols less polar from methanol to 1-octanol, which affects the esterification
reaction rate, and it also lowers the expected reaction rate simply by the presence of fewer
hydroxyl groups in solution. The effect of polarity and steric hindrance in BA esterification with
this series of primary, linear alcohols was examined using the Taft equation (Appendix D.1).
The plot of the Taft equation (Figures D.1.1 & D.1.2) for the alcohols supports the notion
that, for both homogeneously and heterogeneously catalyzed reactions, the decrease in
esterification reactivity from methanol to 1-octanol is the result of steric and polar effects. The
similarity in reaction trend and in the quality of fit with both homogeneous and heterogeneous
catalysts is evidence that the mechanism and overall behavior of esterification is the same for
both. Based on this analysis, we conclude that the observed decrease in reactivity with increasing
carbon number of the alcohol is the result of steric hindrance and polar effects of the alcohol, and
not as a result of differences in affinity of the alcohols for the ion exchange resin catalyst.

168
It is clear that polar and steric effects of alcohols are essentially the same for both
homogeneous and heterogeneous catalysts. The observation that TON for para-toluenesulfonic
acid (p-TSA) was 10-12 times higher than Amberlyst 70 (Figure 6.1a) could be attributed to a)
some acid sites on Amberlyst 70 are unavailable for reaction or have reduced activity because of
resin swelling or hydrophilicty; or b) restricted conformation of intermediate complexes
adsorbed on Amberlyst 70 acid sites (as opposed to unrestricted movement in solution with p-
TSA). Particular explanation for this observation is beyond the scope of this study. For
researchers working on the esterification reaction mechanism under heterogeneous catalysis, a
correlation between the structure of alcohols and their reactivity with carboxylic acid presented
in this study would give an additional insight. To further investigate the observed rate behavior,
the turn over number (TON) for a given alcohol is expressed as a rate constant in terms of molar
concentrations of BA and the alcohol.
AlcoholAcid
TONkTON (6.2)
The forward rate constant kTON in Eq. (6.2) is plotted versus alcohol carbon number in
Figure 6.1b. The rate constant decreases sharply from methanol to ethanol, but declines only
slightly with increasing carbon number for all other linear, primary alcohols. This common value
of kTON can thus be used to determine the esterification rate of BA with any alcohol or mixture
of alcohols from ethanol to 1-octanol under the given range of reaction conditions. For example,
an experiment involving mixed alcohol (ethanol and 1-butanol) esterification of BA at an
alcohol:acid mole ratio of 3:1 with 1 wt% Amberlyst 70 at 60°C gave a value of kTON = 0.48
[28], close to the value of 0.5 given in Figure 6.1b.

169
(a)
Figure 6.1. Effect of increasing linear alcohol carbon number on esterification rate of butyric
acid. a) (TON); b) kTON (Eq.6.2). (■) – Amberlyst 70 ;(♦) - p-TSA; Reaction conditions: 3:1
alcohol:acid molar feed ratio, 0.01 kg cat/kg soln, 60°C.
0
10
20
30
40
50
60
70
80
90
100
0
200
400
600
800
1000
1200
1400
0 1 2 3 4 5 6 7 8
TO
N (
km
ol
BA
/km
ol
H +
/hr)
TO
N (
km
ol
BA
/km
ol
H +
/hr)
Carbon number of linear alcohol

170
Figure 6.1 (cont’d)
(b)
The TON for BA esterification branched alcohols decreases with increasing branching
from 1-butanol to isobutanol, and from 1-octanol to 2-EHA because of steric hindrance (Figure
D.2.1, Appendix D). The TON decreases from 11.6 for 1-butanol to 2.6 for 2-butanol, as –OH
accessibility decreases in secondary alcohols. A similar result was obtained for esterification
with 1-heptanol and the secondary alcohol 4-heptanol.
Figure 6.2 compares BA esterification rates with a series of linear alcohols in terms of
TON using four ion-exchange resin catalysts. Among heterogeneous catalysts, Amberlyst 70 has
high activity per active site (H+). On a unit mass basis, Amberlyst BD 20 has the highest activity,
giving greater conversion of BA with methanol in 1 hour than any other solid acid catalyst.
Among the solid catalysts, Amberlyst 15 is commercially available and widely used in industry,
0
0.2
0.4
0.6
0.8
1
1.2
1.4
0
5
10
15
20
25
0 1 2 3 4 5 6 7 8
kT
ON
(m6/k
mol
alco
ho
l/k
mo
l H
+/h
r)
kT
ON
(m6/k
mo
l al
coh
ol/
km
ol
H+/h
r)
Carbon number of linear alcohol

171
but it suffers the limitation of low thermal stability (<140°C). Amberlyst 70 exhibits high
thermal stability because of its halogenated polymer backbone [29]. Therefore, in the following
kinetic study of BA esterification with 2-EHA, Amberlyst-70 was used as the catalyst.
Figure 6.2: Esterification rate of butyric acid with primary alcohols. (□) – Amberlyst 70;(◊) -
Amberlyst BD20; (○) – Amberlyst 15; (∆) - Amberlyst 36; Reaction conditions: 3:1 alcohol:acid
feed molar ratio, 0.01 kg cat/kg soln, 60°C.
6.4.2. BA esterification kinetics with 2-EHA
BA esterification with 2-EHA can be represented by a single, reversible second order
reaction.
BA+ 2 EHA 2EHB + W (6.3)
0
10
20
30
40
50
60
70
80
90
100
0 1 2 3 4 5 6 7 8
TO
N (
km
ol
BA
/km
ol
H+
/hr)
Number of carbons in linear alcohol
kr
kf

172
6.4.2.1. Mass transfer resistances
The development of an accurate kinetic model for reactions involving heterogeneous
catalysts requires that external and internal mass transfer resistances be minimized in reaction.
To ensure that there were no external mass transfer resistances in BA esterification with 2-EHA,
the reaction was carried out at several different agitation speeds while keeping all other
conditions the same. Over the range of 100 rpm to 850 rpm investigated in this study, no
significant effect of the speed of agitation was observed on the rate of esterification. Therefore,
all further reactions were carried out at 550 rpm.
To further investigate possible external mass transfer effects and overall catalyst
utilization, experiments were conducted at catalyst loadings from 0 to 2 wt% at 120°C and 0.5 to
3 wt% at 130°C. The plot of initial BA esterification rate versus catalyst loading at each
temperature is linear (Figure 6.3); this is further evidence that external mass transfer resistances
are absent and that the catalyst is effectively distributed and active throughout the reaction
solution.
Internal mass transfer resistances were evaluated using different particle sizes of
Amberlyst 70, obtained by grinding the resin into fine particles and sieving to obtain three
different size fractions. These three fractions were evaluated under identical reaction conditions
including constant catalyst loading. No significant difference in conversion rate for the different
catalyst particle sizes was observed, indicating that intra-particle diffusion resistances are
negligible for Amberlyst 70-catalyzed esterification. Therefore, the resin catalyst was used in its
as-received state for all experiments. The effect of stirring rate and the catalyst particle size on
rate of esterification is shown in Appendix D (Figures D.3.1a&b).

173
Figure 6.3: Initial BA esterification rate vs. catalyst loading; (♦)-120°C; (■)-130°C; Reaction
conditions: 2-EHA:BA feed molar ratio = 6:1. Solid lines represent best fit of the data.
Internal mass transfer resistances were evaluated by estimating the observable modulus Φ
and implementing the Weisz-Prater criterion:
Φ = robsρpRp2/De[As] << 1 (6.4)
The observable modulus Φ, which represents the ratio of the actual reaction rate to the
maximum diffusion rate, can be evaluated from the observed rate of reaction, the catalyst particle
radius (Rp), effective diffusivity of the limiting reactant (De), and bulk concentration of the
reactant [As] at the external surface of the particle. When Φ is much less than one, the reaction
is kinetically controlled and internal mass transfer resistances are absent. For Amberlyst 70, Rp
= 170 µm, catalyst porosity is ~0.57, and the liquid phase diffusion coefficient of BA in 2-EHA,
DAB, calculated using the Wilke-Chang equation, is 1.5 x 10⁻⁵
cm2/sec. For esterification of BA
and 2-EHA at 100°C with 1 wt % Amberlyst 70 as catalyst and an initial 2-EHA:BA molar ratio
0
1
2
3
4
5
6
7
8
0 0.005 0.01 0.015 0.02 0.025 0.03 0.035
1000
×in
itia
l re
acti
on r
ate
-rB
A
(1/m
in)
Catalyst loading (kg cat/kg solution)

174
of 6:1, the value of Φ was 0.014. Internal mass transfer resistances can therefore be neglected for
this reaction system.
6.4.2.2. Equilibrium constant
The mole fraction-based equilibrium constants (Kx) were determined by analysis of
reaction samples taken after 24 hrs of reaction time, a sufficient period for the esterification
reaction to closely approach equilibrium. The activity-based equilibrium constant, Ka, was
calculated from Kx via inclusion of activity coefficients of the species in the mixture (Eq. 6.5).
iii v
i
v
ix
v
ia xKKaK (6.5)
The values of Kx varied only from 1.5 to 5.0 over the range of experimental conditions
studied. Therefore, it is assumed that Kx does not depend on temperature, and an average value
for Kx of 2.6 was determined from all experiments. The activity coefficient ratio Kγ, was
calculated using the UNIFAC group contribution method. The UNIFAC group volume (Rk) and
surface area (Qk) parameters were taken from Rao [30]. Values of Kγ varied from 10.2 to 11.6
over all experiments; an average value of 10.9 was used in the kinetic model.
6.4.2.3. Effect of initial molar feed ratio
A few experiments were carried out initially at low mole ratios of 2EHA:BA (< 4:1). At
high conversions of BA under these conditions, the formation of two phases was observed. With
this phase separation, even a stirring rate of 1200 rpm did not ensure samples of uniform
composition from the batch reactor. This resulted in mass balance errors during sampling and a
poor fit of the kinetic data. Therefore, most experiments were carried out at high initial mole

175
ratio of alcohol to BA (>6:1). As initial alcohol to acid mole ratio increases from six to 15,
butyric acid conversion rate increases modestly, but the equilibrium conversion remains close to
93% for all 2-EHA to BA ratios. Figure 6.4 shows the mole fraction profiles reaction of
components at 2-EHA:BA molar feed ratio of 6:1. The reactions typically reached the
equilibrium composition within 3 hours.
Results from Figure 6.3 at different catalyst loadings show that zero catalyst loading
gives a non-zero rate; therefore, several experiments were conducted without catalyst present to
facilitate kinetic modeling of auto-catalyzed BA esterification with 2-EHA. The rate at 130°C in
Figure 6.3 for zero catalyst loading was extrapolated from uncatalyzed reaction rates at 90°C to
120°C.
6.4.3. Kinetic model for Amberlyst 70-catalyzed and auto-catalyzed esterification
A pseudo-homogeneous kinetic model for esterification, combining auto-catalyzed and
resin-catalyzed esterification, has been previously described in the literature [9, 31]. The rate of
BA consumption in the reaction mixture is described in terms of activities:
a
WEHBEHABAautofBAfcatBA
BA
K
aaaakxkWr
dt
dx 22, ; ixiia (6.6)
In Eq. (6.6), the rate constant for the reverse reactions (solid acid catalyzed and auto-
catalyzed is represented as kf /Ka, where Ka is the activity-based equilibrium constant for
esterification. Similar differential equations can be written for other species in the reacting
system.
The temperature dependence of the rate constants can be expressed by the Arrhenius
equation.

176
RTfEo
fkfk exp ;
RT
Ekk autofo
autofautof,
,, exp (6.7)
Figure 6.4: Mole fraction profiles of reaction components; (♦) – BA; (▲) – 2EHB; (×) – W;
Reaction conditions: 6:1 2-EHA:BA molar feed ratio, 0.01 kg cat/kg soln, 130°C. Continuous
lines represent predicted mole fraction profiles from kinetic model.
Four kinetic parameters kof , k
of,auto ,Ef and Ef,auto have to be determined to describe
the reaction system. Twenty experiments (Appendix D, Table D.4.1) containing 194 data points,
at temperatures ranging from 373 K to 423 K, initial molar ratios of 2-EHA:BA from 6:1 to 15:1,
and Amberlyst 70 catalyst loading from 0 to 3.0 wt% were fit to the kinetic rate expression. A
fourth-order Runge-Kutta method, ODE23 in MATLAB 7.0, was used to numerically integrate
the differential equations that describe the formation of each species in the system. Liquid phase
mole fractions of all species were calculated over the course of each reaction using an initial set
of kinetic parameters and were compared to the experimental data. Kinetic parameters were then
0
0.02
0.04
0.06
0.08
0.1
0.12
0.14
0.16
0 50 100 150
Mo
lefr
acti
on
Time (min)

177
optimized by minimizing the root mean square error between experimental and calculated mole
fractions of all liquid phase components in all experiments according to Eq. (8).
samples
samples
icali
n
xx
F
2
exp,,
min2
(6.8)
The kinetic parameters that result in the lowest root mean square error, along with their
95% confidence intervals, are given in Table 4.1. The final value of F2min, determined for the
kinetic parameters reported is 0.0055, indicating that the model describes the experimental data
reasonably well. The predicted and experimental molefraction profiles are given in Appendix D
(Section D.4). The calibration plots used in quantification of components using gas
chromatography are presented in Section D.5, Appendix D.
6.4.4. Effect of butyrate esters on biodiesel cloud point
Esters of BA examined in this work were added to canola biodiesel in varying
concentrations and their cloud point were measured using Tanaka mini pour/cloud point tester
MPC-102L according to ASTM method D2500. As seen in Figure 6.5, addition of butyrate
esters decreases the cloud point of canola biodiesel from -5°C to as low as -14°C, close to the
cloud point of -16°C for #2 petroleum diesel. This shows the potential of butyrate esters as fuel
components to alleviate cold weather limitations of biodiesel.
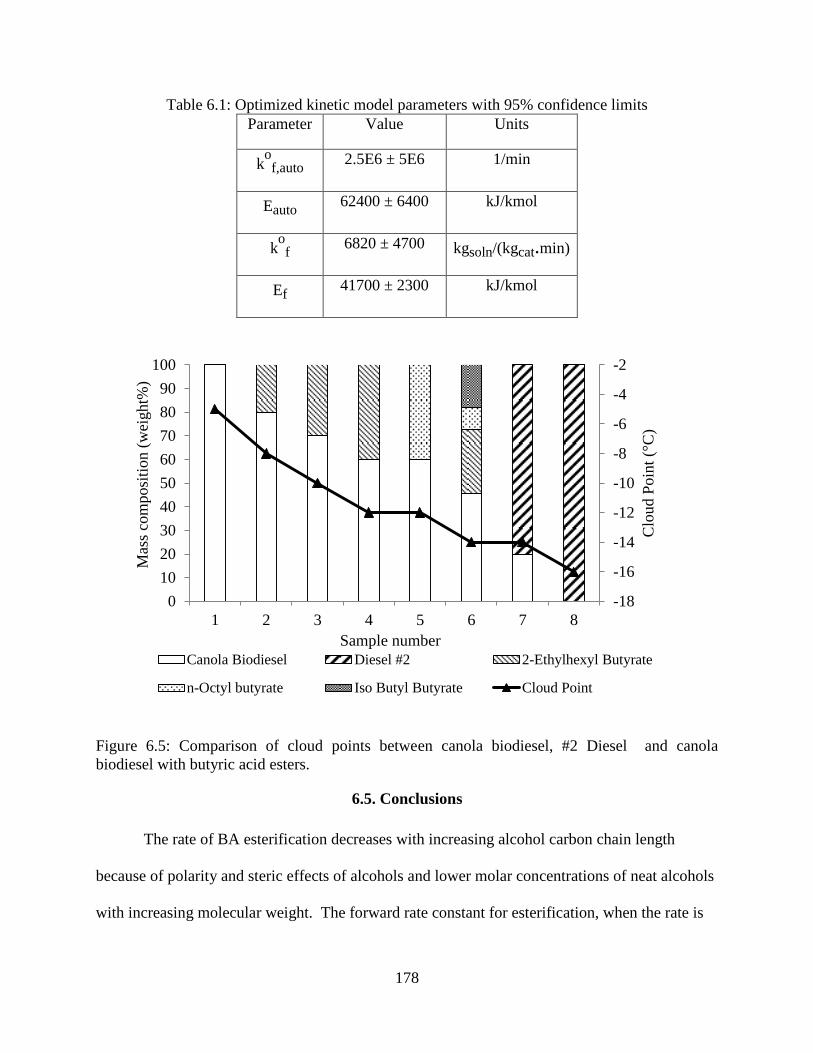
178
Table 6.1: Optimized kinetic model parameters with 95% confidence limits
Parameter Value Units
kof,auto 2.5E6 ± 5E6 1/min
Eauto 62400 ± 6400 kJ/kmol
kof
6820 ± 4700 kgsoln/(kgcat.min)
Ef 41700 ± 2300 kJ/kmol
Figure 6.5: Comparison of cloud points between canola biodiesel, #2 Diesel and canola
biodiesel with butyric acid esters.
6.5. Conclusions
The rate of BA esterification decreases with increasing alcohol carbon chain length
because of polarity and steric effects of alcohols and lower molar concentrations of neat alcohols
with increasing molecular weight. The forward rate constant for esterification, when the rate is
-18
-16
-14
-12
-10
-8
-6
-4
-2
0
10
20
30
40
50
60
70
80
90
100
1 2 3 4 5 6 7 8
Clo
ud P
oin
t (°
C)
Mas
s co
mposi
tion (
wei
ght%
)
Sample number
Canola Biodiesel Diesel #2 2-Ethylhexyl Butyrate
n-Octyl butyrate Iso Butyl Butyrate Cloud Point

179
expressed in terms of molar concentrations of alcohol and acid, is essentially constant for C2 to
C8 primary, linear alcohols, but higher for methanol.
The kinetic model developed for Amberlyst-70 catalyzed esterification of BA with 2-
EHA predicts esterification rate over the temperature range of 100-150°C reasonably well,
making it useful for designing continuous processes for BA esterification.

180
APPENDIX D
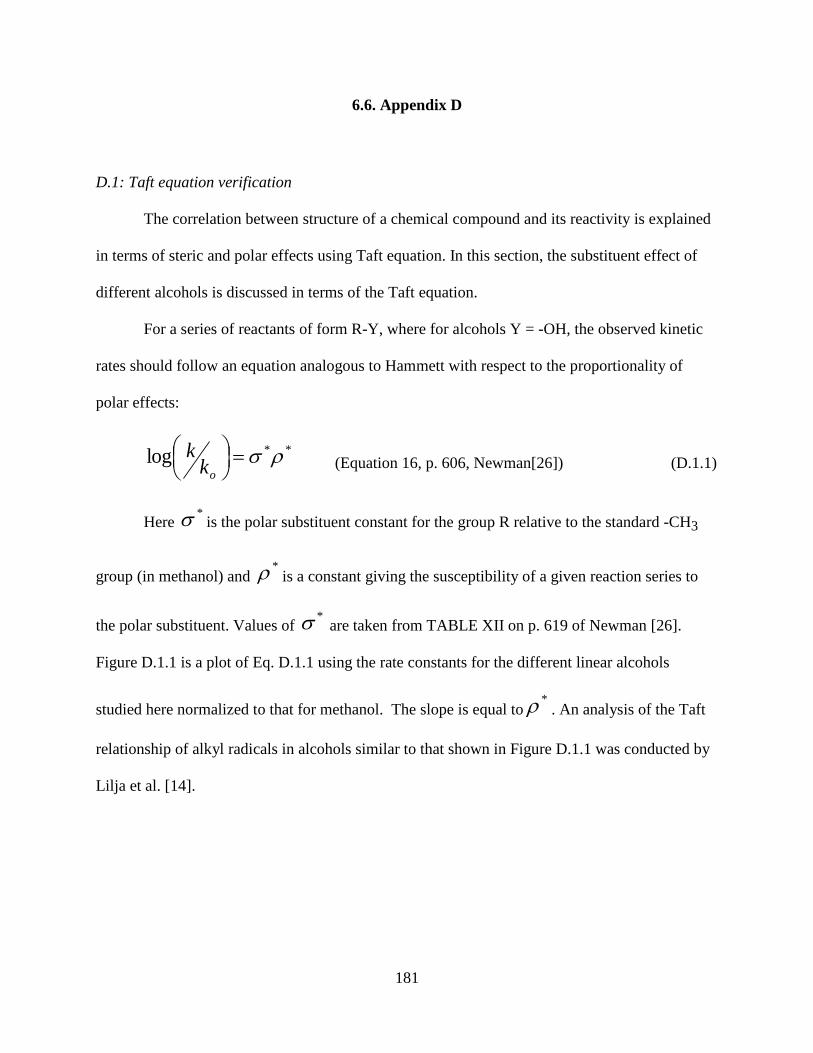
181
6.6. Appendix D
D.1: Taft equation verification
The correlation between structure of a chemical compound and its reactivity is explained
in terms of steric and polar effects using Taft equation. In this section, the substituent effect of
different alcohols is discussed in terms of the Taft equation.
For a series of reactants of form R-Y, where for alcohols Y = -OH, the observed kinetic
rates should follow an equation analogous to Hammett with respect to the proportionality of
polar effects:
**log
okk
(Equation 16, p. 606, Newman[26]) (D.1.1)
Here * is the polar substituent constant for the group R relative to the standard -CH3
group (in methanol) and * is a constant giving the susceptibility of a given reaction series to
the polar substituent. Values of * are taken from TABLE XII on p. 619 of Newman [26].
Figure D.1.1 is a plot of Eq. D.1.1 using the rate constants for the different linear alcohols
studied here normalized to that for methanol. The slope is equal to* . An analysis of the Taft
relationship of alkyl radicals in alcohols similar to that shown in Figure D.1.1 was conducted by
Lilja et al. [14].

182
Figure D.1.1: Verification of Taft Equation - polar effect; (◊) - p-TSA; (∆) -Amberlyst 70.
In a similar manner, if inductive effects are neglected, the Taft equation can be used to
describe steric effects:
sCH
Ek
k
3
log ; Analogous to equation 15 page 597 [26] (D.1.2)
where Es is the near-quantitative measure of the total steric effect associated with a given
substituent relative to the standard of comparison. In this analysis, the -CH3 group in ethanol is
taken as the standard of comparison, and reaction between ethanol and butyric acid is taken as
the standard reaction. Reactions of BA with alcohols only up to n-butanol were evaluated,
because values of Es for alcohols only up to n-butanol are available. Values given in Table D.1.1
are plotted in Figure D.1.2, showing that the Taft equation is satisfied for steric effects. A
similar analysis for propanoic acid esterification with different alcohols was conducted by Erdem
et al [25].
-0.8
-0.7
-0.6
-0.5
-0.4
-0.3
-0.2
-0.1
0
-0.14 -0.12 -0.1 -0.08 -0.06 -0.04 -0.02 0
log(k
/ko)
σ*
C1
C2C3
C4

183
Table D.1.1: Data for Figure D.1.2 determined from kinetic rate measurements in this work and
corresponding steric substituent constants taken from Newman [26].
Figure D.1.2: Verification of Taft Equation (steric effect) catalyzed esterification of butyric acid
with linear alcohols; (♦) – p-TSA; (■) – Amberlyst 70.
p-TSA Amberlyst 70
log(k/kCH3) log(k/kCH3) Es
Methanol 0.593 0.448 1.24
Ethanol 0 0 0
n-Propanol -0.0526 -0.133 -0.07
n-Butanol -0.1472 -0.197 -0.36
-0.3
-0.2
-0.1
0
0.1
0.2
0.3
0.4
0.5
0.6
0.7
-0.5 0 0.5 1 1.5
log(k
/kC
H3)
Es

184
D.2: Effect of alcohol chain branching on butyric acid esterification rate
Figure D.2.1: Effect of alcohol chain branching on butyric acid esterification rate. Reaction
conditions: 3:1 alcohol:BA feed molar ratio, 0.01 kg Amberlyst 70/kg soln, 60°C.
00.5
11.5
22.5
33.5
44.5
55.5
6
TO
N (
hr-1
)
0
2
4
6
8
10
12
TO
N (
hr-1
)
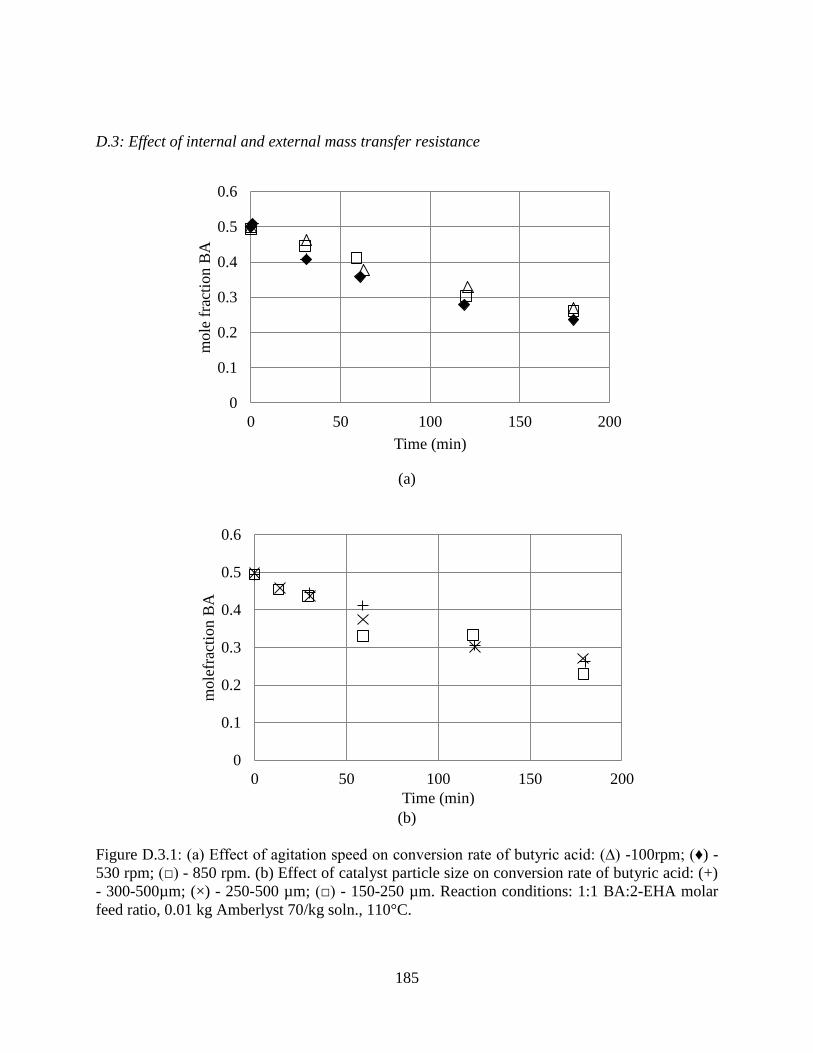
185
D.3: Effect of internal and external mass transfer resistance
(a)
(b)
Figure D.3.1: (a) Effect of agitation speed on conversion rate of butyric acid: (∆) -100rpm; (♦) -
530 rpm; (□) - 850 rpm. (b) Effect of catalyst particle size on conversion rate of butyric acid: (+)
- 300-500µm; (×) - 250-500 µm; (□) - 150-250 µm. Reaction conditions: 1:1 BA:2-EHA molar
feed ratio, 0.01 kg Amberlyst 70/kg soln., 110°C.
0
0.1
0.2
0.3
0.4
0.5
0.6
0 50 100 150 200
mo
lefr
acti
on
BA
Time (min)
0
0.1
0.2
0.3
0.4
0.5
0.6
0 50 100 150 200
mo
le f
ract
ion
BA
Time (min)

186
D.4: Summary of batch reactor experiments and reaction conditions
Table D.4.1: Summary of experiments and reaction conditions
Run
number
Total
Initial
moles
Total initial
volume (ml)
Reaction
temperature °C Wcat Initial mole
ratio 2EHA:BA
Figure
number
1 0.36 52.78 100 0.01 6 D.4.1
2 0.36 52.74 110 0.01 6 D.4.2
3 0.36 52.75 120 0.01 6.1 D.4.3
4 0.36 52.64 130 0.01 6.2 6.4
5 0.36 52.64 140 0.01 6.2 D.4.4
6 0.36 52.79 150 0.01 6 D.4.5
7 0.34 50.43 130 0.01 12 D.4.6
8 0.34 50.43 140 0.01 12 D.4.7
9 0.35 51.49 130 0.01 8.3 D.4.8
10 0.35 51.47 140 0.01 8.3 D.4.9
11 0.33 49.98 130 0.01 15 D.4.10
12 0.33 49.99 140 0.01 14.9 D.4.11
13 0.36 52.79 120 0.005 6 D.4.12
14 0.36 52.83 130 0.004 6 D.4.13
15 0.36 52.76 130 0.030 5.9 D.4.14
16 0.36 52.82 120 0.003 6 D.4.15
17 0.38 55.09 90 0 5.9 D.4.16
18 0.38 55.09 100 0 5.9 D.4.17
19 0.38 55.09 110 0 5.9 D.4.18
20 0.38 55.09 120 0 5.9 D.4.19

187
Figure D.4.1: Mole fraction profiles of reaction components for Run 1; (♦) – BA; (▲) – 2EHB;
(×) – W. Continuous lines represent predicted mole fraction profiles from kinetic model.
Figure D.4.2: Mole fraction profiles of reaction components for Run 2; (♦) – BA; (▲) – 2EHB;
(×) – W. Continuous lines represent predicted mole fraction profiles from kinetic model.
0
0.02
0.04
0.06
0.08
0.1
0.12
0.14
0.16
0 50 100 150
Mole
frac
tion
Time (min)
0
0.02
0.04
0.06
0.08
0.1
0.12
0.14
0.16
0 50 100 150
Mo
lefr
acti
on
Time (min)

188
Figure D.4.3: Mole fraction profiles of reaction components for Run 3; (♦) – BA; (▲) – 2EHB;
(×) – W. Continuous lines represent predicted mole fraction profiles from kinetic model.
Figure D.4.4: Mole fraction profiles of reaction components for Run 5; (♦) – BA; (▲) – 2EHB;
(×) – W. Continuous lines represent predicted mole fraction profiles from kinetic model.
0
0.02
0.04
0.06
0.08
0.1
0.12
0.14
0.16
0 50 100 150
Mo
lefr
acti
on
Time (min)
0
0.02
0.04
0.06
0.08
0.1
0.12
0.14
0.16
0 50 100 150
Mole
frac
tion
Time (min)

189
Figure D.4.5: Mole fraction profiles of reaction components for Run 6; (♦) – BA; (▲) – 2EHB;
(×) – W. Continuous lines represent predicted mole fraction profiles from kinetic model.
Figure D.4.6: Mole fraction profiles of reaction components for Run 7; (♦) – BA; (▲) – 2EHB;
(×) – W. Continuous lines represent predicted mole fraction profiles from kinetic model.
0
0.02
0.04
0.06
0.08
0.1
0.12
0.14
0.16
0 20 40 60 80 100 120
Mo
lefr
acti
on
Time (min)
0
0.01
0.02
0.03
0.04
0.05
0.06
0.07
0.08
0.09
0.1
0 50 100 150 200
Mo
lefr
acti
on
Time (min)

190
Figure D.4.7: Mole fraction profiles of reaction components for Run 8; (♦) – BA; (▲) – 2EHB;
(×) – W. Continuous lines represent predicted mole fraction profiles from kinetic model.
Figure D.4.8: Mole fraction profiles of reaction components for Run 9; (♦) – BA; (▲) – 2EHB;
(×) – W. Continuous lines represent predicted mole fraction profiles from kinetic model
0
0.01
0.02
0.03
0.04
0.05
0.06
0.07
0.08
0.09
0.1
0 50 100 150 200
Mo
lefr
acti
on
Time (min)
0
0.02
0.04
0.06
0.08
0.1
0.12
0 50 100 150 200
Mo
lefr
acti
on
Time (min)

191
Figure D.4.9: Mole fraction profiles of reaction components for Run 10; (♦) – BA; (▲) – 2EHB;
(×) – W. Continuous lines represent predicted mole fraction profiles from kinetic model
Figure D.4.10: Mole fraction profiles of reaction components for Run 11; (♦) – BA; (▲) –
2EHB; (×) – W. Continuous lines represent predicted mole fraction profiles from kinetic model
0
0.02
0.04
0.06
0.08
0.1
0.12
0 50 100 150
Mo
lefr
acti
on
Time (min)
0
0.01
0.02
0.03
0.04
0.05
0.06
0.07
0.08
0 50 100 150 200
Mole
frac
tion
Time (min)

192
Figure D.4.11: Mole fraction profiles of reaction components for Run 12; (♦) – BA; (▲) –
2EHB; (×) – W. Continuous lines represent predicted mole fraction profiles from kinetic model.
Figure D.4.12: Mole fraction profiles of reaction components for Run 13; (♦) – BA; (▲) –
2EHB; (×) – W. Continuous lines represent predicted mole fraction profiles from kinetic model.
0
0.01
0.02
0.03
0.04
0.05
0.06
0.07
0.08
0 50 100 150 200
Mo
lefr
acti
on
Time (min)
0
0.02
0.04
0.06
0.08
0.1
0.12
0.14
0.16
0 50 100 150 200 250
Mo
lefr
acti
on
Time (min)

193
Figure D.4.13: Mole fraction profiles of reaction components for Run 14; (♦) – BA; (▲) –
2EHB; (×) – W. Continuous lines represent predicted mole fraction profiles from kinetic model.
Figure D.4.14: Mole fraction profiles of reaction components for Run 15; (♦) – BA; (▲) –
2EHB; (×) – W. Continuous lines represent predicted mole fraction profiles from kinetic model.
0
0.02
0.04
0.06
0.08
0.1
0.12
0.14
0.16
0 50 100 150 200 250
Mo
lefr
acti
on
Time (min)
0
0.02
0.04
0.06
0.08
0.1
0.12
0.14
0.16
0 50 100 150
Mo
lefr
acti
on
Time (min)

194
Figure D.4.15: Mole fraction profiles of reaction components for Run 16; (♦) – BA; (▲) –
2EHB; (×) – W. Continuous lines represent predicted mole fraction profiles from kinetic model.
Figure D.4.16: Mole fraction profiles of reaction components for Run 17; (♦) – BA; (▲) –
2EHB; (×) – W. Continuous lines represent predicted mole fraction profiles from kinetic model.
0
0.02
0.04
0.06
0.08
0.1
0.12
0.14
0.16
0 50 100 150 200
Mo
lerf
ract
ion
Time (min)
0
0.02
0.04
0.06
0.08
0.1
0.12
0.14
0.16
0 5000 10000 15000
Mole
frac
tion
Time (min)

195
Figure D.4.17: Mole fraction profiles of reaction components for Run 18; (♦) – BA; (▲) –
2EHB; (×) – W. Continuous lines represent predicted mole fraction profiles from kinetic model.
Figure D.4.18: Mole fraction profiles of reaction components for Run 19; (♦) – BA; (▲) –
2EHB; (×) – W. Continuous lines represent predicted mole fraction profiles from kinetic model.
0
0.02
0.04
0.06
0.08
0.1
0.12
0.14
0.16
0 5000 10000 15000
Mo
lefr
acti
on
Time (min)
0
0.02
0.04
0.06
0.08
0.1
0.12
0.14
0.16
0 5000 10000 15000
Mole
frac
tion
Time (min)

196
Figure D.4.19: Mole fraction profiles of reaction components for Run 20; (♦) – BA; (▲) –
2EHB; (×) – W. Continuous lines represent predicted mole fraction profiles from kinetic model.
D.5: Calibration plots for sample analysis
Reaction samples from butyric acid (BA) esterification with methanol (MeOH), ethanol
(EtOH) were diluted in 1-Butanol with 5 wt% Ethyl caprylate (1-BuOH+EC) solvent. For all
other reaction samples, Isopropanol with 5 wt% Ethyl caprylate (IPA+EC) was used as solvent.
To determine the weight of each component in the reaction sample, individual calibrations were
carried out. Measured quantity of each component was mixed with known weight of solvent such
that the component is 10% by weight in the solution. The calibration samples were made to
cover the whole range of mass fraction that is expected in the reaction samples. These samples
were analyzed in a gas chromatograph as described in Section 6.3.4. From the chromatograms,
area for each component is obtained. From this data, area for a known weight of component and
area for a fixed amount of EC is known. The ratio of area of component to that of EC is plotted
against the ratio of known weight of component to that of EC. This plot is typically a straight
line passing through the origin. The slope of this line is the “calibration factor”.
0
0.02
0.04
0.06
0.08
0.1
0.12
0.14
0.16
0 5000 10000 15000
Mo
lefr
acti
on
Time (min)
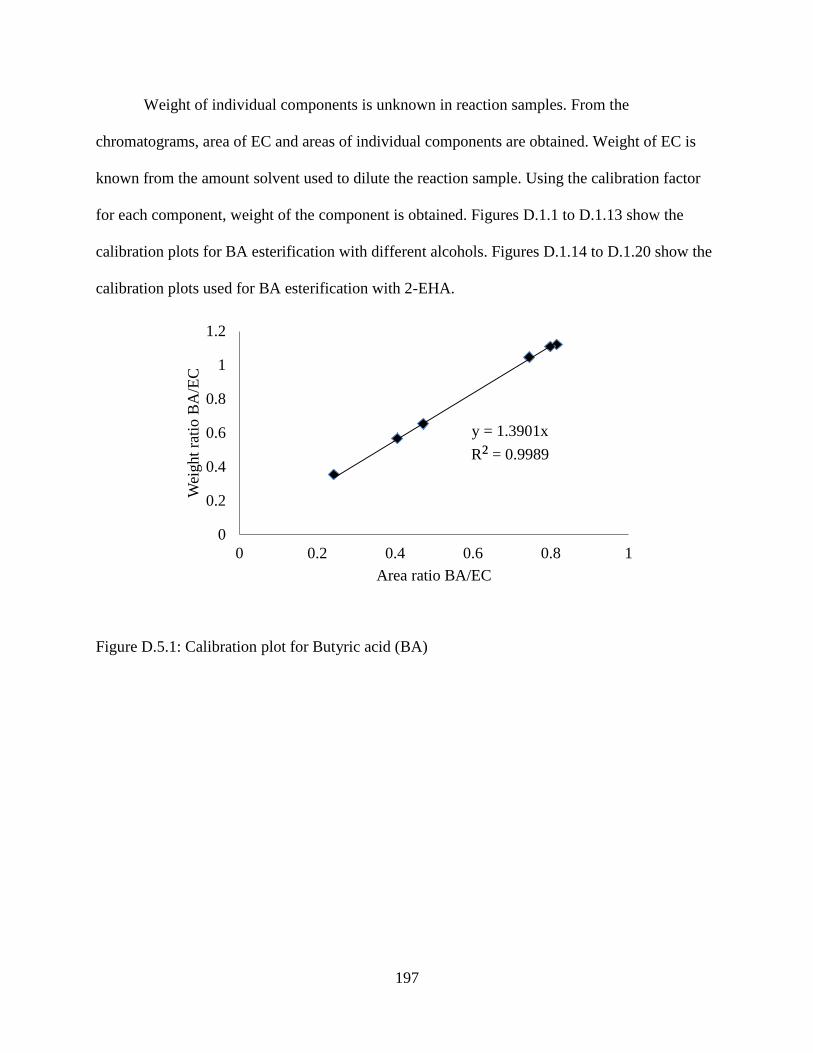
197
Weight of individual components is unknown in reaction samples. From the
chromatograms, area of EC and areas of individual components are obtained. Weight of EC is
known from the amount solvent used to dilute the reaction sample. Using the calibration factor
for each component, weight of the component is obtained. Figures D.1.1 to D.1.13 show the
calibration plots for BA esterification with different alcohols. Figures D.1.14 to D.1.20 show the
calibration plots used for BA esterification with 2-EHA.
Figure D.5.1: Calibration plot for Butyric acid (BA)
y = 1.3901x
R² = 0.9989
0
0.2
0.4
0.6
0.8
1
1.2
0 0.2 0.4 0.6 0.8 1
Wei
ght
rati
o B
A/E
C
Area ratio BA/EC

198
Figure D.5.2: Calibration plot for 1-Butanol (BuOH)
Figure D.5.3: Calibration plot for Butyl butyrate (BB)
y = 0.9512x
R² = 0.9993
0
0.2
0.4
0.6
0.8
1
1.2
0 0.2 0.4 0.6 0.8 1 1.2
Wei
ght
raio
BuO
H/E
C
Area ratio BuOH/EC
y = 0.9873x
R² = 0.9986
0
0.2
0.4
0.6
0.8
1
1.2
1.4
0 0.5 1 1.5
Wei
ght
rati
o B
B/E
C
Area ratio BB/EC

199
Figure D.5.4: Calibration plot for Ethanol (EtOH).
Figure D.5.5: Calibration plot for Ethyl butyrate (EB).
y = 1.5045x
R² = 0.9973
0
0.2
0.4
0.6
0.8
1
1.2
0 0.2 0.4 0.6 0.8
Wei
gh
t ra
tio
EtO
H/E
C
Area ratio EtOH/EC
y = 1.3167x
R² = 0.9975
0
0.2
0.4
0.6
0.8
1
1.2
1.4
0 0.2 0.4 0.6 0.8 1 1.2
Wei
gh
t ra
tio
EB
/EC
Area ratio EB/EC

200
Figure D.5.6: Calibration plot for isopropanol (IPA).
Figure D.5.7: Calibration plot for isopropyl butyrate (IPB).
y = 1.4766x
R² = 0.9694
0
0.2
0.4
0.6
0.8
1
1.2
0 0.2 0.4 0.6 0.8
Wei
gh
t ra
tio
IPA
/EC
Area ratio IPA/EC
y = 1.2125x
R² = 0.9979
0
0.2
0.4
0.6
0.8
1
1.2
1.4
0 0.2 0.4 0.6 0.8 1 1.2
Wei
gh r
atio
IP
B/E
C
Area ratio IPB/EC

201
Figure D.5.8: Calibration plot for Methanol (MeOH).
Figure D.5.9: Calibration plot for Methyl butyrate (MB).
y = 2.2907x
R² = 0.9986
0
0.2
0.4
0.6
0.8
1
1.2
0 0.1 0.2 0.3 0.4 0.5
Wei
gh
rat
io M
eOH
/EC
Area ratio MeOH/EC
y = 1.4297x
R² = 0.9876
0
0.2
0.4
0.6
0.8
1
1.2
0 0.2 0.4 0.6 0.8 1
Wei
gh
t ra
tio
MB
/EC
Area ratio MB/EC

202
Figure D.5.10: Calibration plot for 1-Propanol (PrOH).
Figure D.5.11: Calibration plot for Propyl butyrate (PB).
y = 1.0829x
R² = 0.9972
0
0.2
0.4
0.6
0.8
1
1.2
0 0.2 0.4 0.6 0.8 1
Wei
ght
rati
o P
rOH
/EC
Area ratio PrOH/EC
y = 1.0667x
R² = 0.9991
0
0.2
0.4
0.6
0.8
1
1.2
0 0.2 0.4 0.6 0.8 1 1.2
Wei
gh
t ra
tio
PB
/EC
Area ratio PB/EC
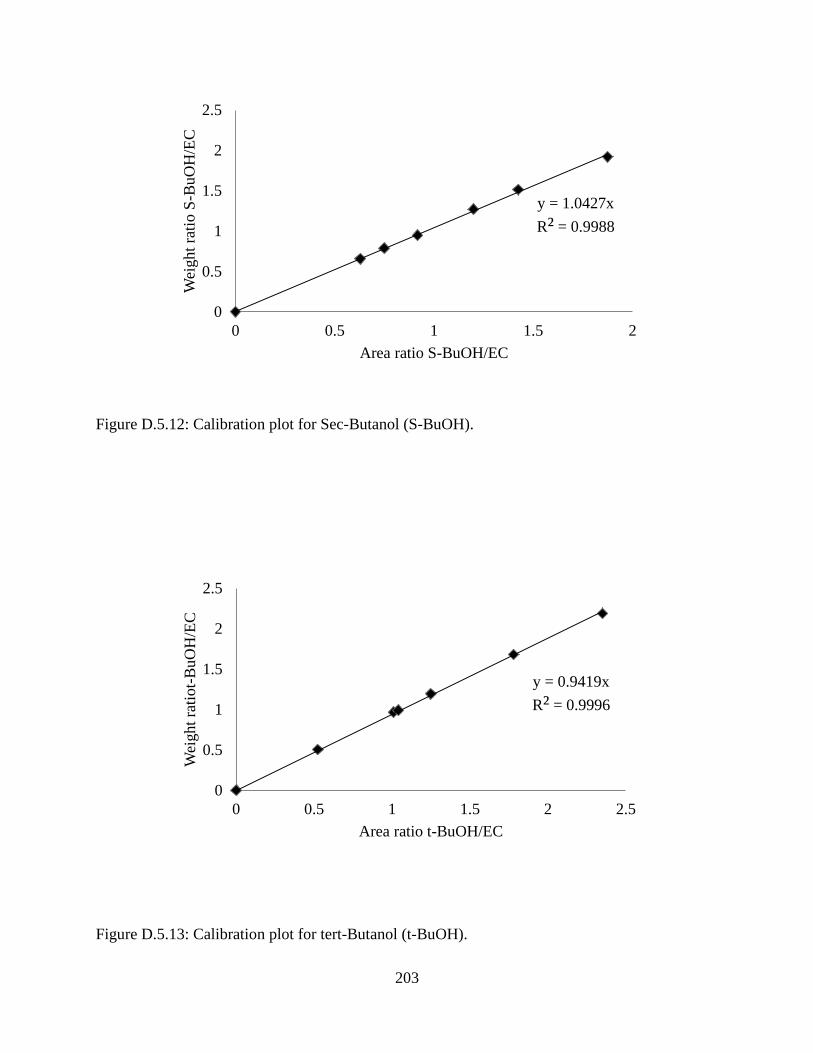
203
Figure D.5.12: Calibration plot for Sec-Butanol (S-BuOH).
Figure D.5.13: Calibration plot for tert-Butanol (t-BuOH).
y = 1.0427x
R² = 0.9988
0
0.5
1
1.5
2
2.5
0 0.5 1 1.5 2
Wei
ght
rati
o S
-BuO
H/E
C
Area ratio S-BuOH/EC
y = 0.9419x
R² = 0.9996
0
0.5
1
1.5
2
2.5
0 0.5 1 1.5 2 2.5
Wei
ght
rati
ot-
BuO
H/E
C
Area ratio t-BuOH/EC

204
Figure D.5.14: Calibration plot for Butyric acid (BA)
Figure D.5.15: Calibration plot for 2-Ethylhexyl butyrate (2-EHB).
y = 0.5768x
R² = 0.97
0
0.2
0.4
0.6
0.8
1
1.2
1.4
1.6
0 0.5 1 1.5 2 2.5
Wei
ght
rati
o B
A/E
C
Area ratio BA/EC
y = 0.6944x
R² = 0.8797
0
0.2
0.4
0.6
0.8
1
1.2
1.4
0 0.5 1 1.5 2
Wei
ght
rati
o 2
-EH
B/E
C
Area ratio 2-EHB/EC
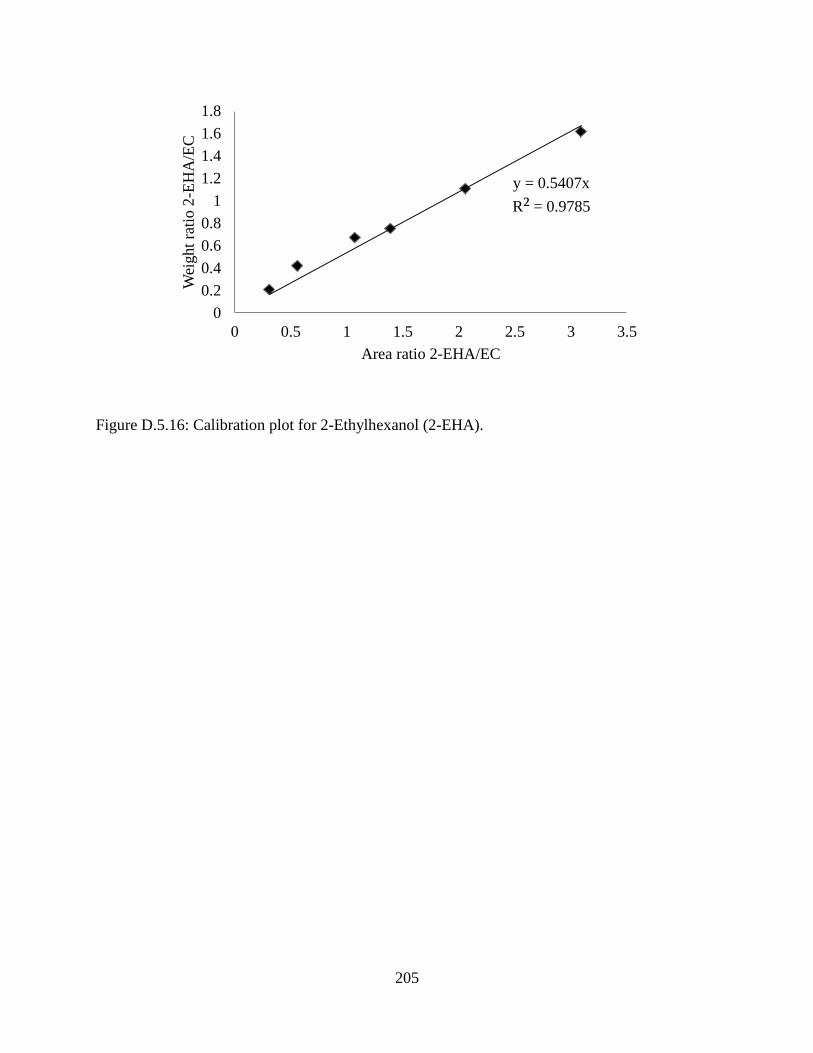
205
Figure D.5.16: Calibration plot for 2-Ethylhexanol (2-EHA).
y = 0.5407x
R² = 0.9785
0
0.2
0.4
0.6
0.8
1
1.2
1.4
1.6
1.8
0 0.5 1 1.5 2 2.5 3 3.5
Wei
ght
rati
o 2
-EH
A/E
C
Area ratio 2-EHA/EC

206
REFERENCES
207
6.7. References
1. Yadav, G.D. and P.H. Mehta, Heterogeneous Catalysis in Esterification Reactions:
Preparation of Phenethyl Acetate and Cyclohexyl Acetate by Using a Variety of Solid
Acidic Catalysts. Industrial & Engineering Chemistry Research, 1994. 33(9): p. 2198-
2208.
2. Armstrong, D.W. and H. Yamazaki, Natural flavours production: a biotechnological
approach. Trends in Biotechnology, 1986. 4(10): p. 264-268.
3. Mbaraka, I.K., et al., Organosulfonic acid-functionalized mesoporous silicas for the
esterification of fatty acid. Journal of Catalysis, 2003. 219(2): p. 329-336.
4. Mbaraka, I.K. and B.H. Shanks, Design of multifunctionalized mesoporous silicas for
esterification of fatty acid. Journal of Catalysis, 2005. 229(2): p. 365-373.
5. Grob, S. and H. Hasse, Reaction Kinetics of the Homogeneously Catalyzed Esterification
of 1-Butanol with Acetic Acid in a Wide Range of Initial Compositions. Industrial &
Engineering Chemistry Research, 2006. 45(6): p. 1869-1874.
6. de Jong, M.C., et al., Reaction kinetics of the esterification of myristic acid with
isopropanol and n-propanol using p-toluene sulphonic acid as catalyst. Applied
Catalysis A: General, 2009. 365(1): p. 141-147.
7. Engin, A., H. Haluk, and K. Gurkan, Production of lactic acid esters catalyzed by
heteropoly acid supported over ion-exchange resins. Green Chemistry, 2003. 5(4): p.
460-466.
8. Kolah, A.K., et al., Reaction Kinetics for the Heterogeneously Catalyzed Esterification of
Succinic Acid with Ethanol. Industrial & Engineering Chemistry Research, 2008. 47(15):
p. 5313-5317.
9. Kolah, A.K., et al., Reaction Kinetics of the Catalytic Esterification of Citric Acid with
Ethanol. Industrial & Engineering Chemistry Research, 2006. 46(10): p. 3180-3187.
10. Gangadwala, J., et al., Esterification of acetic acid with butanol in the presence of ion-
exchange resins as catalysts. Industrial & Engineering Chemistry Research, 2003.
42(10): p. 2146-2155.

208
11. AltIokka, M.R. and A. ÇItak, Kinetics study of esterification of acetic acid with
isobutanol in the presence of amberlite catalyst. Applied Catalysis A: General, 2003.
239(1-2): p. 141-148.
12. Liu, Y., E. Lotero, and J.G. Goodwin Jr, Effect of carbon chain length on esterification of
carboxylic acids with methanol using acid catalysis. Journal of Catalysis, 2006. 243(2):
p. 221-228.
13. Liu, Y., E. Lotero, and J.G. Goodwin Jr, A comparison of the esterification of acetic acid
with methanol using heterogeneous versus homogeneous acid catalysis. Journal of
Catalysis, 2006. 242(2): p. 278-286.
14. Lilja, J., et al., Esterification of different acids over heterogeneous and homogeneous
catalysts and correlation with the Taft equation. Journal of Molecular Catalysis A:
Chemical, 2002. 182-183: p. 555-563.
15. Alsalme, A., E.F. Kozhevnikova, and I.V. Kozhevnikov, Heteropoly acids as catalysts
for liquid-phase esterification and transesterification. Applied Catalysis A: General,
2008. 349(1-2): p. 170-176.
16. Schmid, B., M. Doker, and J. Gmehling, Esterification of Ethylene Glycol with Acetic
Acid Catalyzed by Amberlyst 36. Industrial & Engineering Chemistry Research, 2008.
47(3): p. 698-703.
17. López, D.E., et al., Esterification and transesterification using modified-zirconia
catalysts. Applied Catalysis A: General, 2008. 339(1): p. 76-83.
18. Ju, I.B., et al., Kinetic study of catalytic esterification of butyric acid and n-butanol over
Dowex 50Wx8-400. Chemical Engineering Journal, 2011. 168(1): p. 293-302.
19. Vahteristo, K., et al., Kinetics of Neopentyl Glycol Esterification with Different
Carboxylic Acids. Industrial & Engineering Chemistry Research, 2009. 48(13): p. 6237-
6247.
20. Zhang, C., et al., Current Progress on Butyric Acid Production by Fermentation. Current
Microbiology, 2009. 59(6): p. 656-663.

209
21. Zhu, Y., Z. Wu, and S.-T. Yang, Butyric acid production from acid hydrolysate of corn
fibre by Clostridium tyrobutyricum in a fibrous-bed bioreactor. Process Biochemistry,
2002. 38(5): p. 657-666.
22. Kim, S.M., et al., Conversion of biomass-derived butanal into gasoline-range branched
hydrocarbon over Pd-supported catalysts. Catalysis Communications, 2011. 16(1): p.
108-113.
23. Gaertner, C.A., et al., Catalytic coupling of carboxylic acids by ketonization as a
processing step in biomass conversion. Journal of Catalysis, 2009. 266(1): p. 71-78.
24. Murkute, A.D., J.E. Jackson, and D.J. Miller, Supported mesoporous solid base catalysts
for condensation of carboxylic acids. Journal of Catalysis, 2011. 278(2): p. 189-199.
25. Erdem, B. and M. Cebe, Determination of Steric Effect on the Esterification of Different
Alcohols with Propanoic Acid over Cation-exchange Resin Catalyst Dowex 50Wx4.
Zeitschrift für Physikalische Chemie, 2011. 225(1): p. 125-136.
26. Newman, M.S., Steric Effects in Organic Chemistry. 1956, New York: Wiley.
27. Reichardt, C., Solvents and Solvent Effects in Organic Chemistry (3rd edition). 2003,
Weinheim: Wiley–VCH.
28. Santhanakrishnan, A., C.T. Lira, and D.J. Miller, Butyric acid esterification with mixed
alcohols catalyzed by Amberlyst 70,Personal communication.
29. Siril, P.F., H.E. Cross, and D.R. Brown, New polystyrene sulfonic acid resin catalysts
with enhanced acidic and catalytic properties. Journal of Molecular Catalysis A:
Chemical, 2008. 279(1): p. 63-68.
30. Rao, Y., Chemical engineering Thermodynamics. 1st ed. 1997, Hyderabad: Universities
Press.
31. Omota, F., A.C. Dimian, and A. Bliek, Fatty acid esterification by reactive distillation.
Part 1: equilibrium-based design. Chemical Engineering Science, 2003. 58(14): p. 3159-
3174.

210
Chapter 7: Conclusions, significance and recommendations for future work
This chapter is divided into three sections. The use of reactive distillation in cyclohexyl
acetate production from cyclohexene is discussed in the first part. The second part involves the
evaluation of the concept of distillation with side reactor in butyl stearate production. The third
part discusses the significance of butyric acid esterification with a series of alcohols presented in
this work.
7.1. Reactive distillation in cyclohexyl acetate production
In this study, the feasibility of producing cyclohexyl acetate using reactive distillation
(RD) was demonstrated on a pilot scale glass column. It was shown that 100% conversion of
cyclohexene can be achieved using RD. Process simulations were performed with a simple
equilibrium stage model using the RADFRAC module in Aspen Plus based on experimentally
obtained chemical kinetics, energy balance, and vapor-liquid equilibria.
The reaction kinetics developed in the laboratory included experiments containing
cyclohexane, and showed that cyclohexane does not effect cyclohexene esterification kinetics.
This simulation model can be used for the design, optimization and process scale-up of
cyclohexyl acetate production, as well as for the design of an RD process to separate
cyclohexene and cyclohexane.
The availability of pilot scale experimental data with a complete energy balance and
studies on the effect of heat loss from reactive on the efficiency of RD are limited in literature.
Therefore, in this study it is shown, using experimentally validated simulations that heat transfer
between stages can lead to improved energy-efficiency in the operation of the reactive column.

211
The simulation methodology can be extended to study heat integration effects of any
esterification reaction with moderate thermal effect in a RD column.
The challenges in the operation of the RD column described in this work, such as the
effect of water on reaction rate and degradation of catalyst due to oligomerization of
cyclohexene, offer insights into making modifications to the process (e.g., introduction of a
decanter after condenser) and using RD as a potential process intensification technique.
It is recommended that the esterification reactive column be operated under vacuum to
keep the column temperature below 373 K. Doing so decreases catalyst degradation due to
oligomerization of cyclohexene. All the catalyst packings used in the catalytic zone of the
column must be tagged and checked periodically for catalyst activity.
The production of cyclohexyl acetate described in this work is an intermediate step in
producing cyclohexanol from cyclohexene (Figure 2.1). During cyclohexyl acetate hydrolysis, it
is important to include deacetylation of cyclohexyl acetate into cyclohexene and acetic acid.
Since cyclohexene esterification is considered a reversible reaction in this study, the kinetics
presented here can be used in cyclohexyl acetate hydration kinetics characterization. This will
reduce the number of parameters that need to be regressed.
Preliminary experiments showed that a batch reactor system is not suitable for describing
reaction kinetics of cyclohexyl acetate hydrolysis because of the presence of two phases in the
sample mixture collected from the reactors. It is recommended that a continuously stirred tank
reactor (CSTR) system be used for kinetic model development of this reaction. The gas
chromatographic method described in this work can be used to analyze the samples from the
organic layer of the cyclohexyl acetate hydrolysis system.

212
This work is a first step towards a complete study on the advantages of external heat
integration in cyclohexanol production from cyclohexene. The primary objective in evaluating
external heat integration in cyclohexanol production from cyclohexene is to show that by heat
exchange between two RD columns, overall energy efficiency can be improved. The simulation
presented in this study can be extended to simulate two RD columns with heat exchange between
their reactive stages.
Cyclohexanol can be produced from cyclohexene using formic acid or acetic as reactive
entrainer. Because formic acid decomposes at higher temperatures, the formic acid process needs
to be operated under vacuum. In this study, it is shown that cyclohexene dimerizes at higher
temperatures and affects catalyst activity. So, it is recommended that the acetic acid process be
operated under vacuum as well. Therefore, an economic study comparing both the processes is
essential.
An experimentally validated simulation model for a process with formic acid as a
reactive entrainer has been reported in the literature (Chapter 2, Section 2.2). The simulation
model presented here, along with an equilibrium kinetic model for cyclohexyl acetate hydrolysis,
can be used to evaluate economic feasibility of cyclohexanol production from cyclohexene using
acetic acid as reactive entrainer. Results can be compared with the formic acid process to
ascertain feasibility of the acetic acid process.
7.2. Distillation with side reactor concept evaluation
In this study, the concept of distillation with a side reactor is evaluated for methyl stearate
transesterification with 1-butanol. This reaction is characterized by very slow reaction rate at
lower temperatures and high side product formation at higher temperatures. A distillation column
equipped with external side reactors along with a pre-reactor is identified as the best

213
configuration for this reaction system. It is shown that this configuration is superior to the
conventional ester production technique.
It is observed that distillation with a side reactor has both its advantages and additional
complexities in terms of design and operation. Before considering this concept, it is
recommended that a preliminary study on relative volatilities of components involved be
conducted, and that feasible design assumptions that eliminate design variables be formulated.
The simulation methodology proposed in this study can be used as a guideline for evaluating the
concept of distillation with side reactors for producing bio-renewable chemicals through
esterification and transesterification.
7.3. Butyric acid esterification with a series of alcohols
In this study it was found that the rate of butyric acid esterification (mol/volume/time)
decreases with increasing alcohol carbon chain length. This is because of the polarity and steric
effects of alcohols and lower molar concentrations of neat alcohols with increasing molecular
weight. However, the forward rate constant for esterification, when the rate expression is written
in terms of molar concentrations of alcohol and acid, is essentially constant for C2 to C8
primary, linear alcohols, but higher for methanol. The result is an important step in predicting
the esterification rate in reactions involving carboxylic acid and a mixture of alcohols of known
composition (for example, fusel alcohols obtained from ethanol fermentation), because the same
rate constant can be used for all C2-C8 alcohols. The detailed kinetics of Amberlyst-70 ion
exchange resin – catalyzed esterification of butyric acid with 2-ethylhexanol was presented. This
model can be used in process simulations for designing continuous processes for butyric acid
esterification.


