DR_AS_4055.doc - 28/05/2012 15:05:11
COMMITTEE BD-099
DR AS 4055
(Project ID: 100967)
Draft for Public Comment
Australian Standard
LIABLE TO ALTERATION—DO NOT USE AS A STANDARD
BEGINNING DATE FOR COMMENT:
4 June 2012
CLOSING DATE FOR COMMENT:
6 August 2012
Important: The procedure for public comment has changed – please
read the instructions on the inside cover of this document.
Wind loads for housing (Revision of AS 4055—2006)
COPYRIGHT

DR_AS_4055.doc - 28/05/2012 15:05:11
Draft for Public Comment
Australian Standard
The committee responsible for the issue of this draft comprised representatives of organizations interested in the subject matter of the proposed Standard. These organizations are listed on the inside back cover.
Comments are invited on the technical content, wording and general arrangement of the draft.
The method for submission of comment on this document is to register and fill in an online form via Standards Hub Website. Instructions and examples of comment submission are available on the website. Please use the following link—
https://www.hub.standards.org.au/hub/public/listOpenCommentingPublication.action
Comment must be via Hub, any emails or forms sent to us by fax or mail will not be considered by the Committee when it reviews the Public Comment received.
Please place relevant clause numbers beside each comment.
Editorial matters (i.e. spelling, punctuation, grammar etc.) will be corrected before final publication.
The coordination of the requirements of this draft with those of any related Standards is of particular importance and you are invited to point out any areas where this may be necessary.
Please provide supporting reasons and suggested wording for each comment. Where you consider that specific content is too simplistic, too complex or too detailed please provide an alternative.
If the draft is acceptable without change, an acknowledgment to this effect would be appreciated.
Once you have registered and submitted your comments via the online form, your comments are automatically submitted to the committee for review.
Normally no acknowledgment of comment is sent. All comments received via the Standards Hub Website by the due date will be reviewed and considered by the relevant drafting committee. We cannot guarantee that comments submitted in other forms will be considered along with those submitted via the Standards Hub online form. Where appropriate, changes will be incorporated before the Standard is formally approved.
If you know of other persons or organizations that may wish to comment on this draft Standard, could you please advise them of its availability. Further copies of the draft are available from the Publisher SAI Global at http://www.saiglobal.com/
SAI GLOBAL Customer Service Centre
Telephone: 13 12 42
Facsimile: 1300 65 49 49
e-mail: mailto:[email protected]
Internet: http://www.saiglobal.com/shop

DR_AS_4055.doc - 28/05/2012 15:05:11
Draft for Public Comment
STANDARDS AUSTRALIA
Committee BD-099—Wind loads for Housing
DRAFT
Australian Standard
Wind loads for housing
(Revision of AS 4055—2006)
(To be AS 4055—2XXX)
Comment on the draft is invited from people and organizations concerned with this subject.
It would be appreciated if those submitting comment would follow the guidelines given on
the inside front cover.
Important: The procedure for public comment has changed – please read the instructions on the inside cover of this document
This document is a draft Australian Standard only and is liable to alteration in the light of
comment received. It is not to be regarded as an Australian Standard until finally issued as
such by Standards Australia.

DRAFT ONLY 2 DRAFT ONLY
DR_AS_4055.doc - 28/05/2012 15:05:11
PREFACE
This Standard was prepared by the Standards Australia Committee BD-099, Wind loads for
housing to supersede AS 4055—2006.
This Standard incorporates Amendment No. 1 (July 2008). The changes required by the
Amendment are indicated in the text by a marginal bar and amendment number against the
clause, note, table, figure or part thereof affected.
This Standard will be referenced in the Building Code of Australia 2013 edition
(BCA 2006), thereby superseding in part the previous edition, AS 4055—2006, which will
be withdrawn 12 months from the date of publication of this edition.
The objective of this Standard is to provide designers, builders and manufacturers of
building products that are affected by wind loading with a range of wind speed classes that
can be used to design and specify such products for use in housing that are within the
limitations in this Standard.
This revision aims to improve modelling of topographic effects and also to harmonise the
standard with recent changes to AS/NZS 1170.2:2011 including Amendment No.1. This
edition differs from the previous edition as follows:
(a) The Scope of the Standard has been amended to include the limitation of the standard
to Class 1 and Class 10 buildings as defined by the BCA. This has always been the
intention of the standard as reflected in its definition of House, but the limitation is
more obvious when presented in the Scope
(b) Table 2.1 presenting wind speeds for each Wind Classification has been split into a
Non-Cyclonic regions table and a Cyclonic regions table for clarification. The wind
speeds for each Wind Classification remain unchanged.
(c) Table 2.2 presenting the Wind Classification for sites has been changed to include a
new Topographic Class (T0) and to harmonise with changes adopted by
AS/NZS 1170.2, Terrain Category multipliers.
(d) Definitions for Terrain Categories have been revised to be compatible with those in
AS/NZS 1170.2:2011 (as amended). The revised definitions are intended to clarify
the differences between the categories. International research has shown that the wind
speeds over water are appropriate for Terrain Category 1 multipliers, so
AS/NZS 1170.2 has included water bodies in Terrain Category 1 for all wind
Regions. In the case of water flowing over seas and oceans, shoaling waves can
introduce a near-shore roughness that means this water can be considered as Terrain
Category 1.5. This change has followed through to this Standard. Terrain Category 4
is not applicable to this Standard as in Terrain Category 4, a house is embedded
within the Terrain Category 4 roughness and its wind force evaluation may require
special techniques.
(e) The calculation of Topographic Class had previously used the average of the
maximum and minimum slope on a topographic feature to determine an average
slope. While the average slope characterised a conical hill well, it significantly
underestimated the slope of a ridge or escarpment. The maximum slope is now used
to characterise the topographic feature. This will better represent the slope of a ridge
or escarpment without significantly changing the characterisation of a conical hill.
This change was recommended as a result of observation of significantly higher
levels of wind damage on ridges and escarpments in cyclonic and non-cyclonic wind
storms.

DRAFT ONLY 3 DRAFT ONLY
DR_AS_4055.doc - 28/05/2012 15:05:11
(f) In AS/NZS 1170.2_2011, the Topographic multiplier for flat land applies to hill
slopes of less than 1:20 and this revision introduces a new Topographic Class (T0) to
represent slopes from 0 to 1:20. This Class has a topographic multiplier of 1.0. The
topographic multiplier for T1 has been changed to 1.1 and includes wind for slopes
from 1:20 to 1:10. Hill slopes have also been expressed in degrees.
(g) Shielding classifications have been harmonised with those in AS/NZS 1170.2 as
appropriate for houses. For Regions A and B, large trees and heavily wooded areas
can offer shielding and have been explicitly included, whereas in Regions C and D,
the long duration of the wind event means that trees will be denuded before the
arrival of the peak gust.
(h) Shielding classifications are linked to the Topographic Classes. AS/NZS 1170.2:2011
also links shielding with topography by allowing shielding only on slopes of less than
1:5. This has also been incorporated into this Standard by allowing full shielding only
for those Topographic Classes with slopes of less than 1:5. This change in both
Standards are based on wind-field models of hills and damage surveys following
cyclonic and non-cyclonic wind events.
(j) Houses in the first row adjacent to wide, open areas are classed as Not Shielded, the
second row from wide open areas is classed as Partial Shielding and subsequent rows
Full Shielding where there are sufficient houses.
(k) Pressure zones on roofs and walls have been defined, named and illustrated on
diagrams. Edge and corner zones are subject to higher pressures due to the local
pressure factors defined in AS/NZS 1170.2. An additional zone on the windward
corners of low slope roofs allows for the RC1 zone introduced to
AS/NZS 1170.2:2011 based on recent international research.
(l) The combination factor (Kc) from AS/NZS 1170.2:2011 has been applied to all
pressures for walls and roofs. This has reduced some of the design pressures in the
Standard.
(m) A more detailed commentary has been added (Appendix A) to clarify the relationship
of this Standard to AS/NZS 1170.2 and to give background to some of the clauses.
(n) The example of Topographic Classes (Appendix B) has been changed to reflect the
changes to definition of Topographic Classes.
(o) The example of Terrain Categories and Shielding (Appendix C) has been changed to
reflect the changes to definition of Terrain Categories and Shielding.
The term ‘informative’ has been used in this Standard to define the application of the
Appendix to which it applies. An ‘informative’ appendix is only for information and
guidance.
Notes to the text contain information and guidance. They are not an integral part of the
Standard.
DRAFT ONLY 4 DRAFT ONLY
DR_AS_4055.doc - 28/05/2012 15:05:11
CONTENTS
Page
SECTION 1 SCOPE AND GENERAL
1.1 SCOPE ........................................................................................................................... 5
1.2 LIMITATIONS .............................................................................................................. 5
1.3 NORMATIVE REFERENCES ...................................................................................... 5
1.4 DEFINITIONS ............................................................................................................... 6
1.5 NOTATION ................................................................................................................... 7
SECTION 2 WIND LOADS
2.1 CLASSIFICATION ....................................................................................................... 9
2.2 RELATIONSHIP TO WIND REGION AND SITE CONDITIONS .............................. 9
2.3 SELECTION OF TERRAIN CATEGORY .................................................................. 12
2.4 SELECTION OF TOPOGRAPHIC CLASS ................................................................ 12
2.5 SELECTION OF SHIELDING CLASS ....................................................................... 14
SECTION 3 CALCULATION OF PRESSURES AND FORCES
3.1 PRESSURE ZONES .................................................................................................... 16
3.2 PRESSURE COEFFICIENTS ...................................................................................... 17
3.3 CALCULATION OF PRESSURES ............................................................................. 20
3.4 CALCULATION OF FORCES .................................................................................... 21
3.5 PRESSURES FOR TYPICAL APPLICATIONS ......................................................... 21
SECTION 4 UPLIFT FORCES
SECTION 5 RACKING FORCES
5.1 RACKING FORCES ................................................................................................... 25
5.2 AREA OF ELEVATION ............................................................................................. 25
APPENDICES
A COMMENTARY ......................................................................................................... 42
B WORKED EXAMPLE FOR THE DETERMINATION OF TOPOGRAPHIC
CLASS:........................................................................................................................ 52
C WORKED EXAMPLES FOR THE SELECTION OF TERRAIN CATEGORY AND
SHIELDING CLASS ................................................................................................... 56
D WORKED EXAMPLE FOR RACKING FORCES ...................................................... 60
DRAFT ONLY 5 DRAFT ONLY
DR_AS_4055.doc - 28/05/2012 15:05:11
STANDARDS AUSTRALIA
Australian Standard
Wind loads for housing
S E C T I O N 1 S C O P E A N D G E N E R A L
1.1 SCOPE
This Standard specifies site wind speed classes for determining design wind speeds and
wind loads for Class 1 and Class 10 housing within the geometric limits given in
Clause 1.2. The classes are for use in the design of housing and for design, manufacturing
and specifying of building products and systems used for housing.
Wind loads for houses not complying with the geometric limits given in Clause 1.2 are
outside the scope of this Standard.
NOTES:
1 Commentary on the clauses of this Standard is given in Appendix A.
2 A worked example for the determination of topography is given in Appendix B.
3 Worked examples for the determination of terrain category and shielding class are given in
Appendix C.
4 A worked example for racking forces is given in Appendix D.
5 Where houses do not comply with the geometric and other limitations of this Standard, use
AS/NZS 1170.0 and AS/NZS 1170.2.
6 Class 1 and 10 buildings are defined in the BCA.
1.2 LIMITATIONS
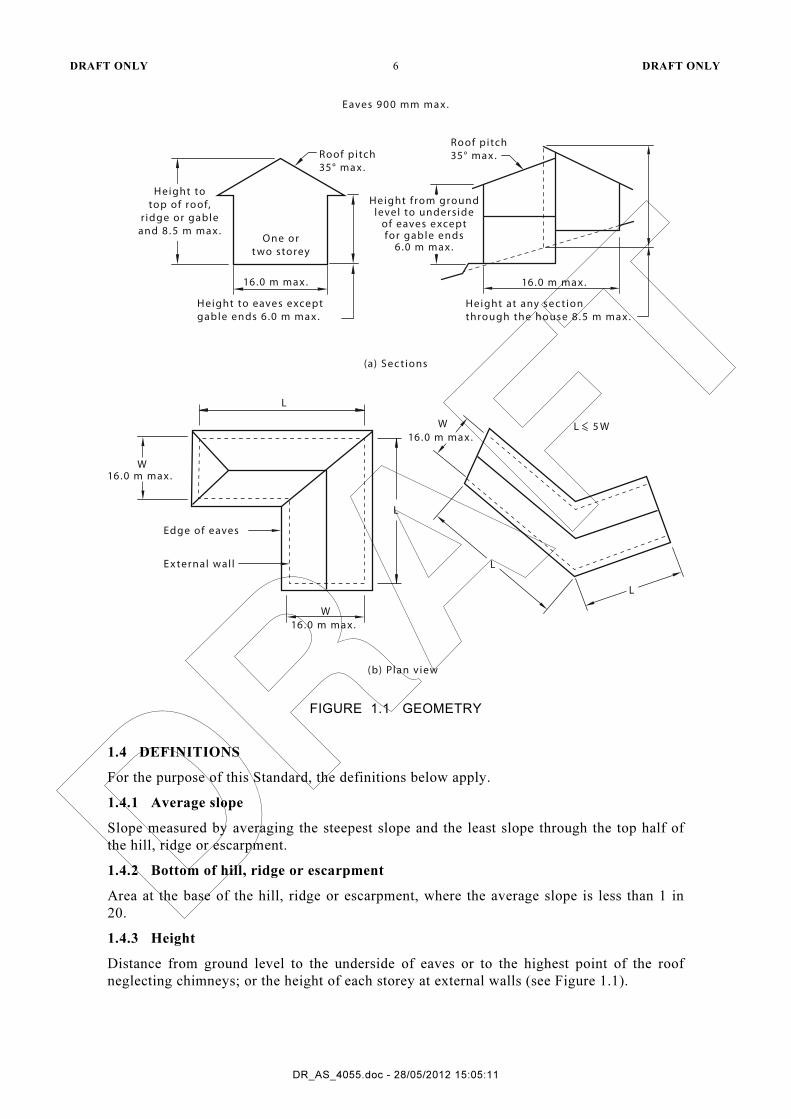
For the purpose of this Standard, the following conditions (geometric limits) shall apply
(see Figure 1.1):
(a) The distance from ground level to the underside of eaves shall not exceed 6.0 m. The
distance from ground level to the highest point of the roof, not including chimneys,
shall not exceed 8.5 m.
(b) The width (W) including roofed verandas, excluding eaves, shall not exceed 16.0 m,
and the length (L) shall not exceed five times the width.
(c) The roof pitch shall not exceed 35°.
The tables in Section 5 are based on floor to ceiling height of 2.4 m and a floor depth of
0.3 m (floor level down to ceiling below).
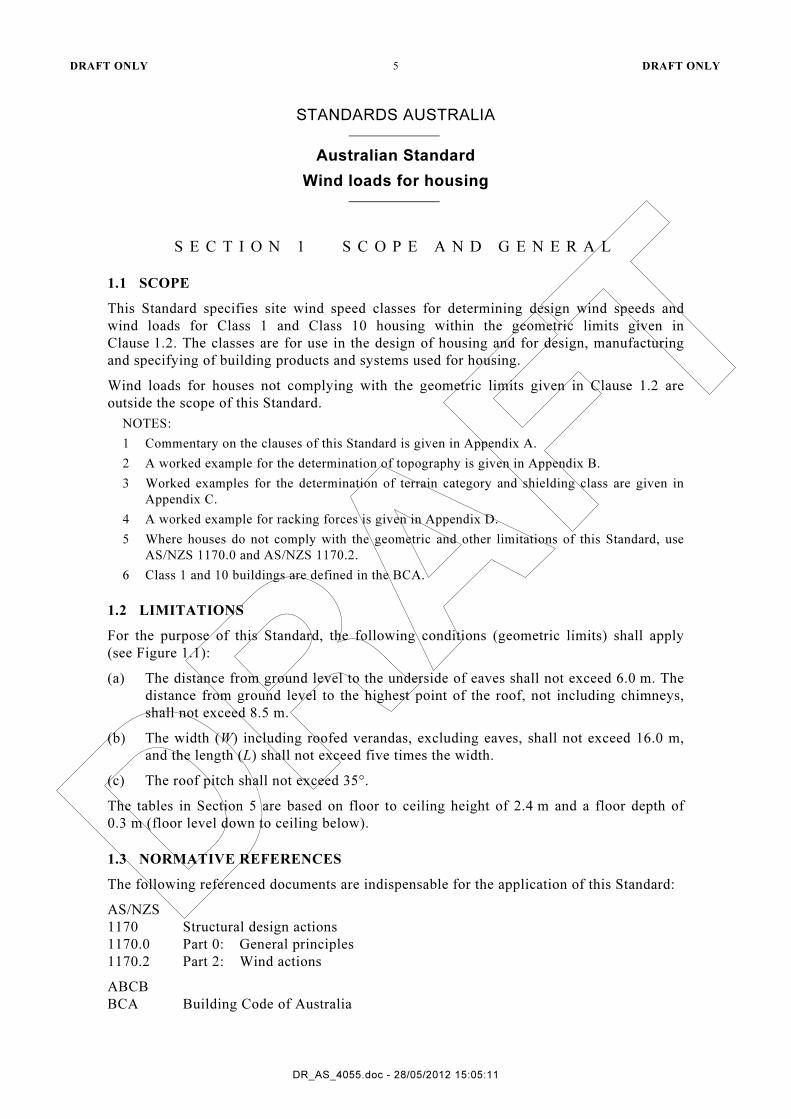
1.3 NORMATIVE REFERENCES
The following referenced documents are indispensable for the application of this Standard:
AS/NZS
1170 Structural design actions
1170.0 Part 0: General principles
1170.2 Part 2: Wind actions
ABCB
BCA Building Code of Australia
DRAFT ONLY 6 DRAFT ONLY
DR_AS_4055.doc - 28/05/2012 15:05:11
Height totop of roof,
r idge or gableand 8 . 5 m ma x .
One ort wo storey
Roof pitch35° ma x .
Roof pitch35° ma x .
16.0 m ma x .
Height to eaves exceptgable ends 6 .0 m ma x .
16.0 m ma x .
Height at any sec tionthrough the house 8 . 5 m ma x .
Height f rom groundlevel to underside
of eaves exceptfor gable ends
6.0 m ma x .
Eaves 9 0 0 mm ma x .
(a) Sec tions
(b) Plan v iew
W16.0 m ma x .
Edge of eaves
E x ternal wal l
W16.0 m ma x .
L
L
W16.0 m ma x .
L 5 W
L
L
FIGURE 1.1 GEOMETRY
1.4 DEFINITIONS
For the purpose of this Standard, the definitions below apply.
1.4.1 Average slope
Slope measured by averaging the steepest slope and the least slope through the top half of
the hill, ridge or escarpment.
1.4.2 Bottom of hill, ridge or escarpment
Area at the base of the hill, ridge or escarpment, where the average slope is less than 1 in
20.
1.4.3 Height
Distance from ground level to the underside of eaves or to the highest point of the roof
neglecting chimneys; or the height of each storey at external walls (see Figure 1.1).
DRAFT ONLY 7 DRAFT ONLY
DR_AS_4055.doc - 28/05/2012 15:05:11
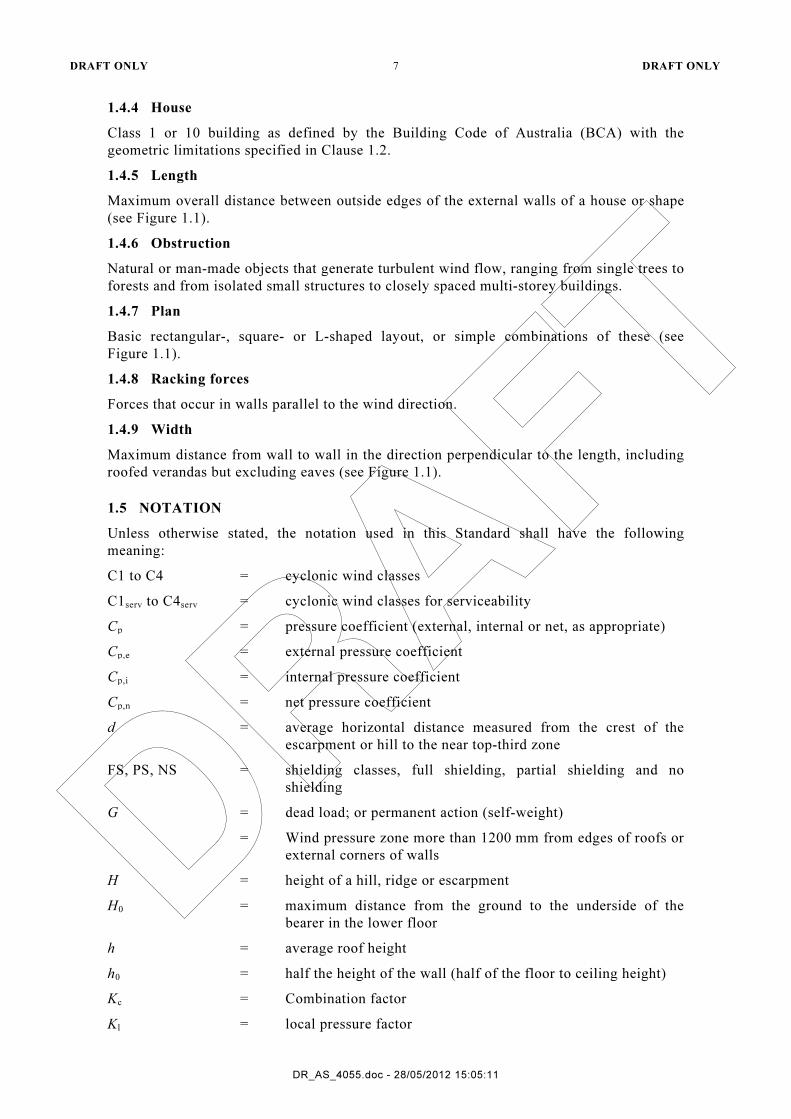
1.4.4 House
Class 1 or 10 building as defined by the Building Code of Australia (BCA) with the
geometric limitations specified in Clause 1.2.
1.4.5 Length
Maximum overall distance between outside edges of the external walls of a house or shape
(see Figure 1.1).
1.4.6 Obstruction
Natural or man-made objects that generate turbulent wind flow, ranging from single trees to
forests and from isolated small structures to closely spaced multi-storey buildings.
1.4.7 Plan
Basic rectangular-, square- or L-shaped layout, or simple combinations of these (see
Figure 1.1).
1.4.8 Racking forces
Forces that occur in walls parallel to the wind direction.
1.4.9 Width
Maximum distance from wall to wall in the direction perpendicular to the length, including
roofed verandas but excluding eaves (see Figure 1.1).
1.5 NOTATION
Unless otherwise stated, the notation used in this Standard shall have the following
meaning:
C1 to C4 = cyclonic wind classes
C1serv to C4serv = cyclonic wind classes for serviceability
Cp = pressure coefficient (external, internal or net, as appropriate)
Cp,e = external pressure coefficient
Cp,i = internal pressure coefficient
Cp,n = net pressure coefficient
d = average horizontal distance measured from the crest of the
escarpment or hill to the near top-third zone
FS, PS, NS = shielding classes, full shielding, partial shielding and no
shielding
G = dead load; or permanent action (self-weight)
= Wind pressure zone more than 1200 mm from edges of roofs or
external corners of walls
H = height of a hill, ridge or escarpment
H0 = maximum distance from the ground to the underside of the
bearer in the lower floor
h = average roof height
h0 = half the height of the wall (half of the floor to ceiling height)
Kc = Combination factor
Kl = local pressure factor
DRAFT ONLY 8 DRAFT ONLY
DR_AS_4055.doc - 28/05/2012 15:05:11
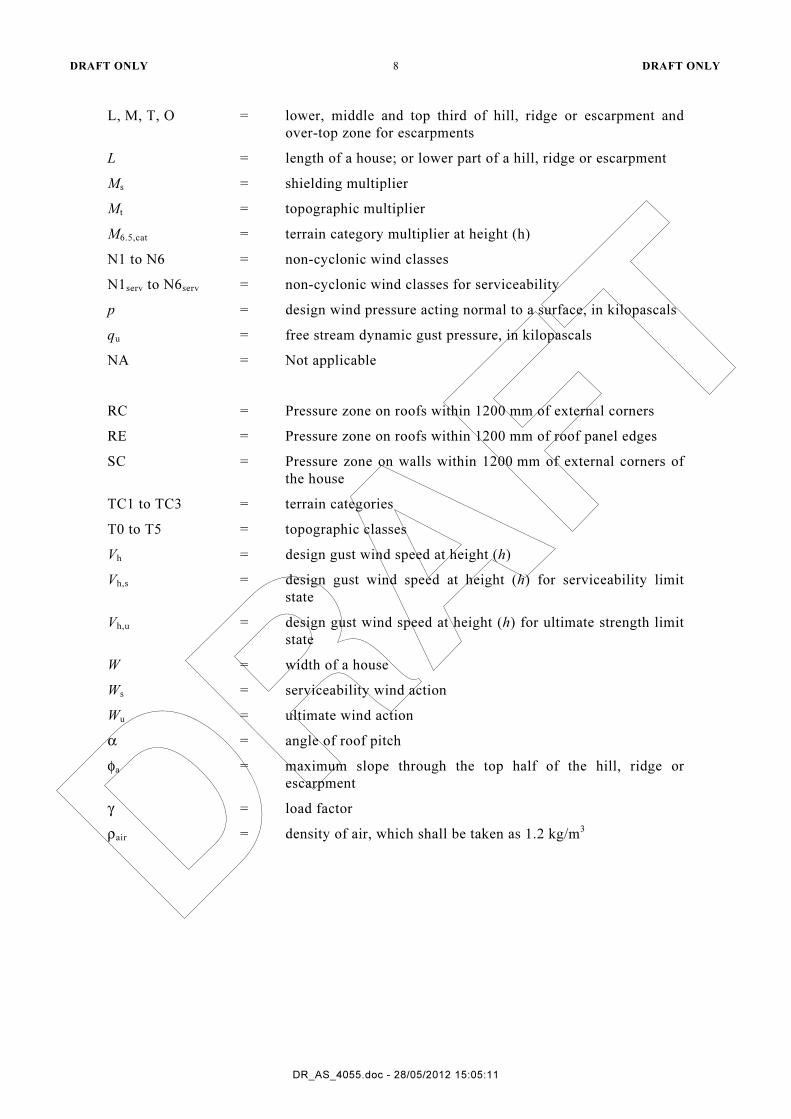
L, M, T, O = lower, middle and top third of hill, ridge or escarpment and
over-top zone for escarpments
L = length of a house; or lower part of a hill, ridge or escarpment
Ms = shielding multiplier
Mt = topographic multiplier
M6.5,cat = terrain category multiplier at height (h)
N1 to N6 = non-cyclonic wind classes
N1serv to N6serv = non-cyclonic wind classes for serviceability
p = design wind pressure acting normal to a surface, in kilopascals
qu = free stream dynamic gust pressure, in kilopascals
NA = Not applicable
RC = Pressure zone on roofs within 1200 mm of external corners
RE = Pressure zone on roofs within 1200 mm of roof panel edges
SC = Pressure zone on walls within 1200 mm of external corners of
the house
TC1 to TC3 = terrain categories
T0 to T5 = topographic classes
Vh = design gust wind speed at height (h)
Vh,s = design gust wind speed at height (h) for serviceability limit
state
Vh,u = design gust wind speed at height (h) for ultimate strength limit
state
W = width of a house
Ws = serviceability wind action
Wu = ultimate wind action
α = angle of roof pitch
φa = maximum slope through the top half of the hill, ridge or
escarpment
γ = load factor
ρair = density of air, which shall be taken as 1.2 kg/m3

DRAFT ONLY 9 DRAFT ONLY
DR_AS_4055.doc - 28/05/2012 15:05:11
S E C T I O N 2 W I N D L O A D S
2.1 CLASSIFICATION
The system of 10 classes is set out in Table 2.1 together with the associated design gust
wind speeds (Vh) for the serviceability and ultimate limit states. It incorporates both non-
cyclonic (N) and cyclonic (C) winds.
TABLE 2.1A
DESIGN GUST WIND SPEED (Vh) FOR NON CYCLONIC CLASSIFICATIONS
Wind class Design gust wind speed (Vh) at height (h)
m/s
Regions A and B
(non-cyclonic)
Serviceability limit state
(Vh,s)
Ultimate limit state
(Vh,u)
N1
N2
N3
26
26
32
34
40
50
N4
N5
N6
39
47
55
61
74
86
TABLE 2.1B
DESIGN GUST WIND SPEED (Vh) FOR CYCLONIC CLASSIFICATION
Wind class Design gust wind speed (Vh) at height (h)
m/s
Regions C and D
(cyclonic)
Serviceability limit state
(Vh,s)
Ultimate limit state
(Vh,u)
C1
C2
C3
C4
32
39
47
55
50
61
74
86
NOTE: Section 3 may present different pressures for the same wind speed depending on classification.
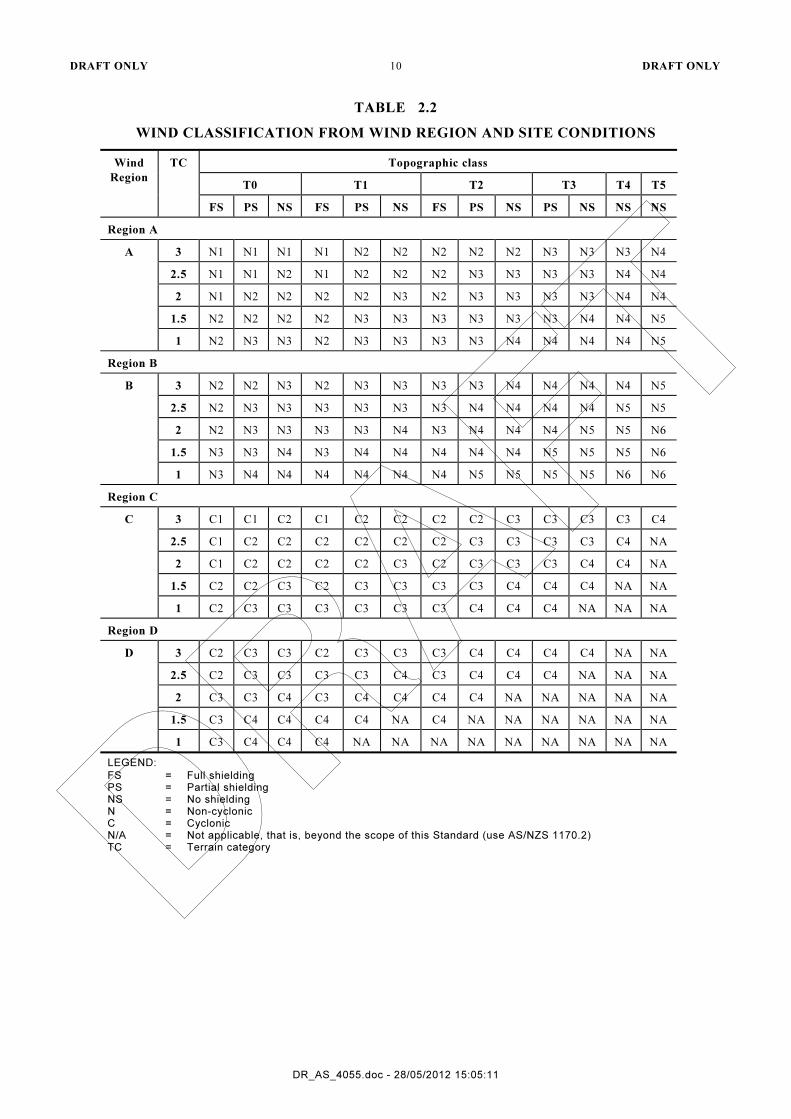
2.2 RELATIONSHIP TO WIND REGION AND SITE CONDITIONS
The selection of wind speed class for a house depends on the conditions at the site of the
house. The class shall be determined from Table 2.2 using the following site conditions
determined as stated:
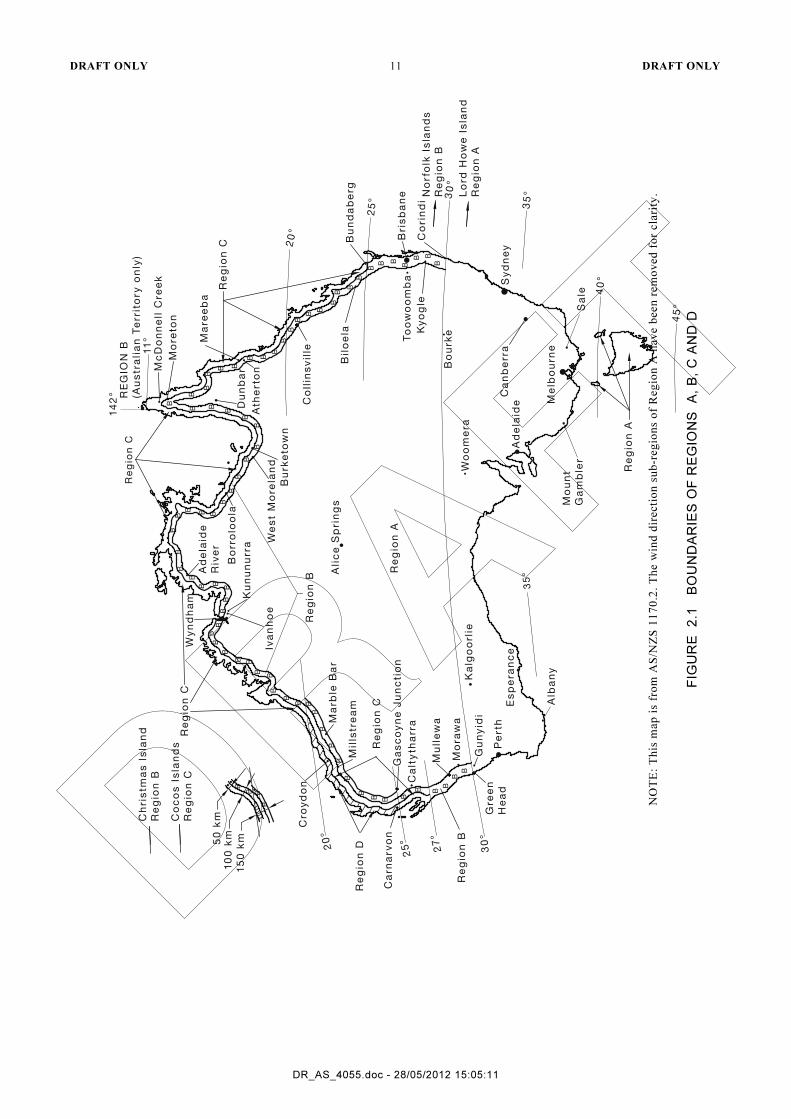
(a) Geographic wind speed region of the site as defined in Figure 2.1 (Region A, B, C or
D, as given in AS/NZS 1170.2).
(b) The terrain category that surrounds or is likely to surround the site within the next 5
years, as defined in Clause 2.3 (TC1, TC2, TC2.5 or TC3).
(c) The topographic class of the site, as defined in Clause 2.4 (T1, T2, T3, T4 or T5).
(d) The shielding class of the house, as defined in Clause 2.5 (FS, PS or NS).
DRAFT ONLY 10 DRAFT ONLY
DR_AS_4055.doc - 28/05/2012 15:05:11
TABLE 2.2
WIND CLASSIFICATION FROM WIND REGION AND SITE CONDITIONS
Wind
Region
TC Topographic class
T0 T1 T2 T3 T4 T5
FS PS NS FS PS NS FS PS NS PS NS NS NS
Region A
A 3 N1 N1 N1 N1 N2 N2 N2 N2 N2 N3 N3 N3 N4
2.5 N1 N1 N2 N1 N2 N2 N2 N3 N3 N3 N3 N4 N4
2 N1 N2 N2 N2 N2 N3 N2 N3 N3 N3 N3 N4 N4
1.5 N2 N2 N2 N2 N3 N3 N3 N3 N3 N3 N4 N4 N5
1 N2 N3 N3 N2 N3 N3 N3 N3 N4 N4 N4 N4 N5
Region B
B 3 N2 N2 N3 N2 N3 N3 N3 N3 N4 N4 N4 N4 N5
2.5 N2 N3 N3 N3 N3 N3 N3 N4 N4 N4 N4 N5 N5
2 N2 N3 N3 N3 N3 N4 N3 N4 N4 N4 N5 N5 N6
1.5 N3 N3 N4 N3 N4 N4 N4 N4 N4 N5 N5 N5 N6
1 N3 N4 N4 N4 N4 N4 N4 N5 N5 N5 N5 N6 N6
Region C
C 3 C1 C1 C2 C1 C2 C2 C2 C2 C3 C3 C3 C3 C4
2.5 C1 C2 C2 C2 C2 C2 C2 C3 C3 C3 C3 C4 NA
2 C1 C2 C2 C2 C2 C3 C2 C3 C3 C3 C4 C4 NA
1.5 C2 C2 C3 C2 C3 C3 C3 C3 C4 C4 C4 NA NA
1 C2 C3 C3 C3 C3 C3 C3 C4 C4 C4 NA NA NA
Region D
D 3 C2 C3 C3 C2 C3 C3 C3 C4 C4 C4 C4 NA NA
2.5 C2 C3 C3 C3 C3 C4 C3 C4 C4 C4 NA NA NA
2 C3 C3 C4 C3 C4 C4 C4 C4 NA NA NA NA NA
1.5 C3 C4 C4 C4 C4 NA C4 NA NA NA NA NA NA
1 C3 C4 C4 C4 NA NA NA NA NA NA NA NA NA
LEGEND:
FS = Full shielding PS = Partial shielding NS = No shielding N = Non-cyclonic C = Cyclonic N/A = Not applicable, that is, beyond the scope of this Standard (use AS/NZS 1170.2) TC = Terrain category
DRAFT ONLY 11 DRAFT ONLY
DR_AS_4055.doc - 28/05/2012 15:05:11
Wo
om
era
We
st
Mo
rela
nd
Bo
rro
loo
la
Mc
Do
nn
ell
Cre
ek
Ma
ree
ba
Bu
rke
tow
n
Du
nb
ar
Ath
erto
n
Mo
reto
n
Co
llin
sv
ille
Ca
nb
err
a
Me
lbo
urn
e
To
ow
oo
mb
a
Ad
ela
ide
Sy
dn
ey
Gre
en
He
ad
Ga
sc
oy
ne
Ju
nc
tio
n
27
°
30
°
25
°
Ca
rna
rv
on
Ka
lgo
orl
ieG
un
yid
i
Mo
raw
a
Mu
lle
wa
Ca
lty
tha
rra
20
°
Cro
yd
on
Wy
nd
ha
m
Ma
rble
Ba
r
Mil
lstr
ea
m
Iva
nh
oe
Ku
nu
nu
rra
Ad
ela
ide
Riv
er
B
B
B
BB
B B B
B
BB
B
BB
BB
B
BB
BBB
B
BB
BB
BB
BB
B
BB
BB
B B B
B
BB
B
B
Re
gio
n C
Re
gio
n B
15
0 k
m
10
0 k
m5
0 k
m
BBB
B
Co
co
s I
sla
nd
s
Re
gio
n C
Ch
ris
tma
s I
sla
nd
Re
gio
n B
B
B
B
BBB
B
BB
B B
B B
B
BB
B
B
B
BB
B
B
B
B B
B
B B
B
Re
gio
n C
14
2°
11
°
RE
GIO
N B
(Au
str
ali
an
Te
rrit
ory
on
ly)
Lo
rd H
ow
e I
sla
nd
Re
gio
n A
No
rfo
lk I
sla
nd
s
Re
gio
n B
Bu
nd
ab
erg
20
°
35
°
Bri
sb
an
e 30
°
Re
gio
n C
25
°
Bil
oe
la Ky
og
le
Bo
urk
e
Co
rin
di
40
°
45
°
Re
gio
n A
Ali
ce
Sp
rin
gs
35
°Re
gio
n A
Re
gio
n D
Re
gio
n C
Pe
rth
Alb
an
y
Es
pe
ran
ce
Re
gio
n B
Mo
un
t
Ga
mb
ler
Sa
le
NO
TE
: T
his
map
is
fro
m A
S/N
ZS
11
70
.2.
Th
e w
ind
dir
ecti
on
su
b-r
eg
ion
s o
f R
eg
ion
A h
av
e b
een
rem
ov
ed
fo
r cla
rity
.
FIG
UR
E
2.1
B
OU
ND
AR
IES
OF
RE
GIO
NS
A
, B
, C
AN
D D
DRAFT ONLY 12 DRAFT ONLY
DR_AS_4055.doc - 28/05/2012 15:05:11
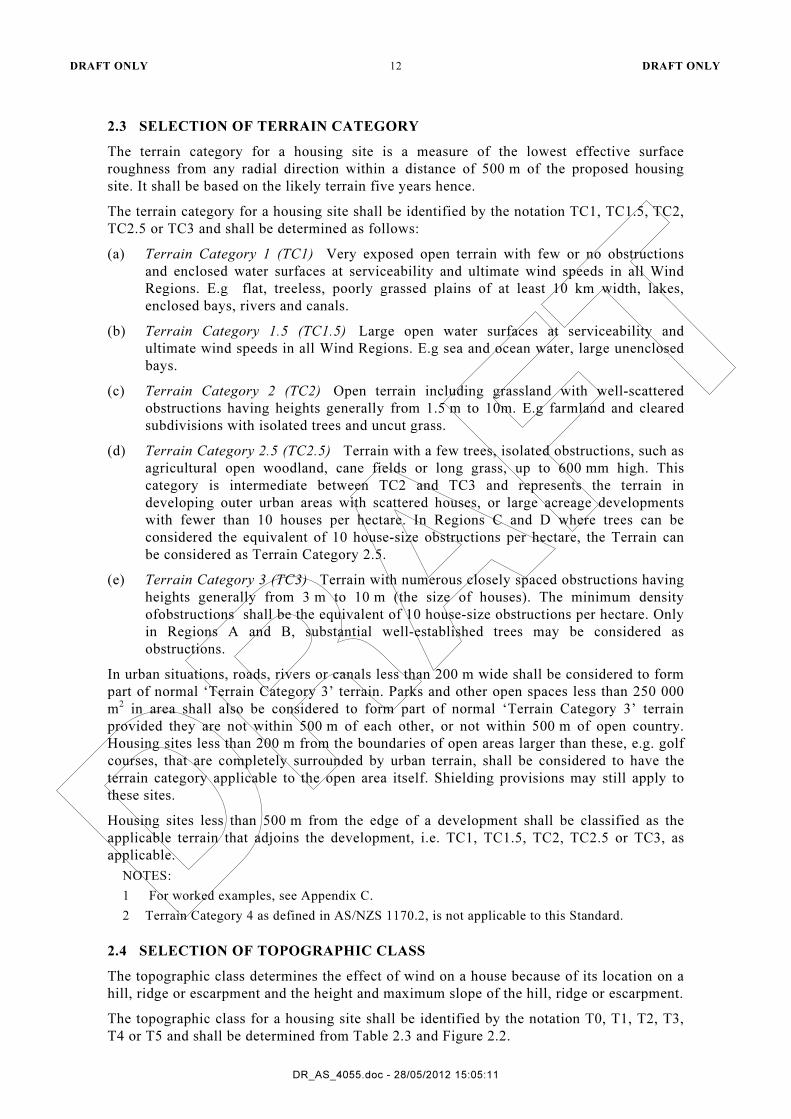
2.3 SELECTION OF TERRAIN CATEGORY
The terrain category for a housing site is a measure of the lowest effective surface
roughness from any radial direction within a distance of 500 m of the proposed housing
site. It shall be based on the likely terrain five years hence.
The terrain category for a housing site shall be identified by the notation TC1, TC1.5, TC2,
TC2.5 or TC3 and shall be determined as follows:
(a) Terrain Category 1 (TC1) Very exposed open terrain with few or no obstructions
and enclosed water surfaces at serviceability and ultimate wind speeds in all Wind
Regions. E.g flat, treeless, poorly grassed plains of at least 10 km width, lakes,
enclosed bays, rivers and canals.
(b) Terrain Category 1.5 (TC1.5) Large open water surfaces at serviceability and
ultimate wind speeds in all Wind Regions. E.g sea and ocean water, large unenclosed
bays.
(c) Terrain Category 2 (TC2) Open terrain including grassland with well-scattered
obstructions having heights generally from 1.5 m to 10m. E.g farmland and cleared
subdivisions with isolated trees and uncut grass.
(d) Terrain Category 2.5 (TC2.5) Terrain with a few trees, isolated obstructions, such as
agricultural open woodland, cane fields or long grass, up to 600 mm high. This
category is intermediate between TC2 and TC3 and represents the terrain in
developing outer urban areas with scattered houses, or large acreage developments
with fewer than 10 houses per hectare. In Regions C and D where trees can be
considered the equivalent of 10 house-size obstructions per hectare, the Terrain can
be considered as Terrain Category 2.5.
(e) Terrain Category 3 (TC3) Terrain with numerous closely spaced obstructions having
heights generally from 3 m to 10 m (the size of houses). The minimum density
ofobstructions shall be the equivalent of 10 house-size obstructions per hectare. Only
in Regions A and B, substantial well-established trees may be considered as
obstructions.
In urban situations, roads, rivers or canals less than 200 m wide shall be considered to form
part of normal ‘Terrain Category 3’ terrain. Parks and other open spaces less than 250 000
m2 in area shall also be considered to form part of normal ‘Terrain Category 3’ terrain
provided they are not within 500 m of each other, or not within 500 m of open country.
Housing sites less than 200 m from the boundaries of open areas larger than these, e.g. golf
courses, that are completely surrounded by urban terrain, shall be considered to have the
terrain category applicable to the open area itself. Shielding provisions may still apply to
these sites.
Housing sites less than 500 m from the edge of a development shall be classified as the
applicable terrain that adjoins the development, i.e. TC1, TC1.5, TC2, TC2.5 or TC3, as
applicable.
NOTES:
1 For worked examples, see Appendix C.
2 Terrain Category 4 as defined in AS/NZS 1170.2, is not applicable to this Standard.
2.4 SELECTION OF TOPOGRAPHIC CLASS
The topographic class determines the effect of wind on a house because of its location on a
hill, ridge or escarpment and the height and maximum slope of the hill, ridge or escarpment.
The topographic class for a housing site shall be identified by the notation T0, T1, T2, T3,
T4 or T5 and shall be determined from Table 2.3 and Figure 2.2.
DRAFT ONLY 13 DRAFT ONLY
DR_AS_4055.doc - 28/05/2012 15:05:11
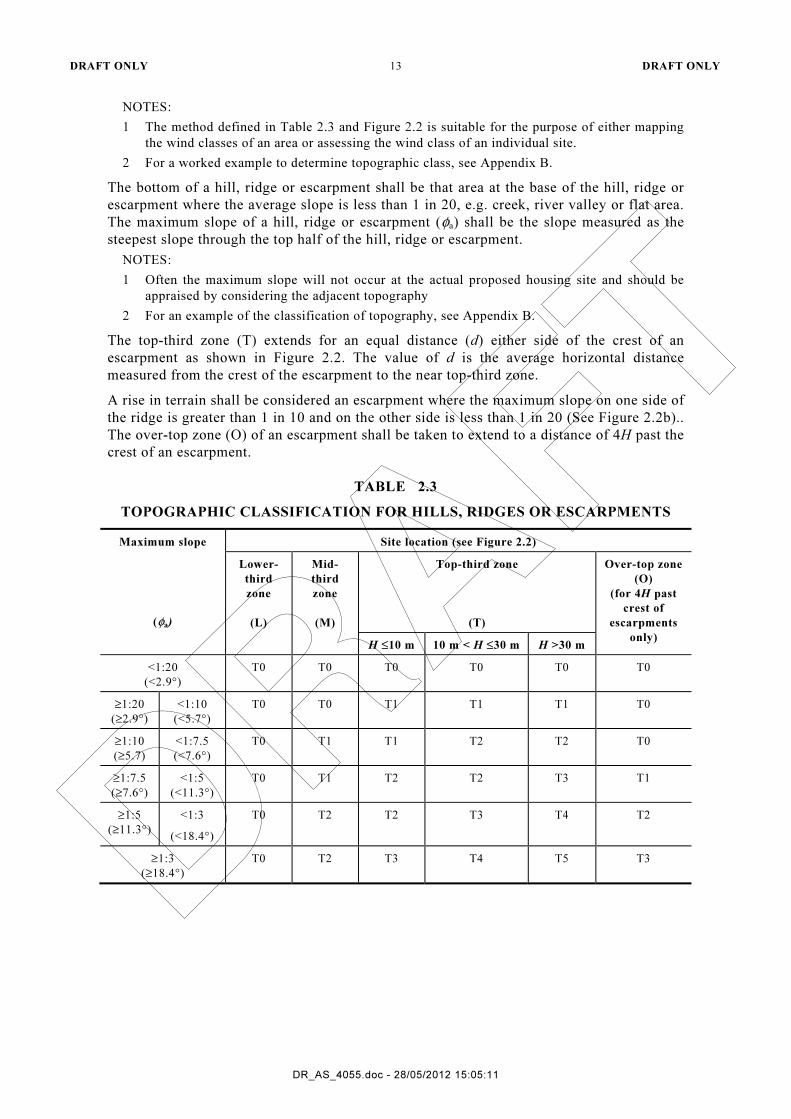
NOTES:
1 The method defined in Table 2.3 and Figure 2.2 is suitable for the purpose of either mapping
the wind classes of an area or assessing the wind class of an individual site.
2 For a worked example to determine topographic class, see Appendix B.
The bottom of a hill, ridge or escarpment shall be that area at the base of the hill, ridge or
escarpment where the average slope is less than 1 in 20, e.g. creek, river valley or flat area.
The maximum slope of a hill, ridge or escarpment (φa) shall be the slope measured as the
steepest slope through the top half of the hill, ridge or escarpment.
NOTES:
1 Often the maximum slope will not occur at the actual proposed housing site and should be
appraised by considering the adjacent topography
2 For an example of the classification of topography, see Appendix B.
The top-third zone (T) extends for an equal distance (d) either side of the crest of an
escarpment as shown in Figure 2.2. The value of d is the average horizontal distance
measured from the crest of the escarpment to the near top-third zone.
A rise in terrain shall be considered an escarpment where the maximum slope on one side of
the ridge is greater than 1 in 10 and on the other side is less than 1 in 20 (See Figure 2.2b)..
The over-top zone (O) of an escarpment shall be taken to extend to a distance of 4H past the
crest of an escarpment.
TABLE 2.3
TOPOGRAPHIC CLASSIFICATION FOR HILLS, RIDGES OR ESCARPMENTS
Maximum slope
(φa)
Site location (see Figure 2.2)
Lower-
third
zone
(L)
Mid-
third
zone
(M)
Top-third zone
(T)
Over-top zone
(O)
(for 4H past
crest of
escarpments
only) H ≤10 m 10 m < H ≤30 m H >30 m
<1:20
(<2.9°)
T0 T0 T0 T0 T0 T0
≥1:20
(≥2.9°)
<1:10
(<5.7°)
T0 T0 T1 T1 T1 T0
≥1:10
(≥5.7)
<1:7.5
(<7.6°)
T0 T1 T1 T2 T2 T0
≥1:7.5
(≥7.6°)
<1:5
(<11.3°)
T0 T1 T2 T2 T3 T1
≥1:5
(≥11.3°)
<1:3
(<18.4°)
T0 T2 T2 T3 T4 T2
≥1:3
(≥18.4°)
T0 T2 T3 T4 T5 T3

DRAFT ONLY 14 DRAFT ONLY
DR_AS_4055.doc - 28/05/2012 15:05:11
H /3
H /3
H /3
M
L
d d
T O
Average slop e 1:20
Average slop e 1:10
4 H
Average slop e 1:20
(b) Escarpments
LEGEND:
Hd
LMTO
==
====
height of the hi l l , r idge or escarpmentaverage horizontal distance measured f rom thecrest of the escarpment to the near top -third zonelower third of the hi l l , r idge or escarpmentmiddle third of the hi l l , r idge or escarpmenttop third of the hi l l , r idge or escarpmentover top zone (for escarpment only)
H /3
H /3
H /3
M
L
d d
T
Average slop e 1:20
(a) Hi l ls
FIGURE 2.2 TOPOGRAPHIC ZONES FOR AVERAGE SLOPE
2.5 SELECTION OF SHIELDING CLASS
Where the wind speed on a house is influenced by obstructions of similar size to the house,
shielding shall be considered and shall be based on the likely shielding five years hence.
In Regions A and B trees and vegetation may be considered as shielding elements and in
Regions C and D trees and vegetation shall not be considered as shielding elements.
The shielding class for a housing site shall be identified by the notation FS, PS or NS, and
shall be determined as follows:

DRAFT ONLY 15 DRAFT ONLY
DR_AS_4055.doc - 28/05/2012 15:05:11
(a) Full shielding (FS) Full shielding shall apply where at least two rows of houses or
similar size permanent obstructions surround the house being considered. In Regions
A and B, permanent heavily wooded areas within 100 m of site provide full shielding.
Full shielding is only possible for houses within Topographic Classes T0, T1, and T2.
The application of full shielding shall be appropriate for typical suburban
development greater than or equal to 10 houses, or similar size obstructions per
hectare.
The effects of roads or other open areas with a distance measured in any direction of
less than 100 m shall be ignored. However, the first two rows of houses abutting
permanent open areas with a least dimension greater than 100 m, such as parklands,
large expanses of water and airfields, shall be considered to have either partial
shielding or no shielding.
(b) Partial shielding (PS) Partial shielding shall apply to intermediate situations where
there are at least 2.5 houses or sheds per hectare, such as acreage type suburban
development or wooded parkland.. Partial shielding is only possible for houses within
Topographic Classes T0, T1, T2, and T3. The second row of houses abutting open
parkland, open water or airfields may be classified as having partial shielding.
(c) No shielding (NS) No shielding shall apply where there are no permanent
obstructions or where there are less than 2.5 obstructions per hectare, such as the row
of houses or single houses abutting open parklands, open water or airfields.
NOTE: For worked examples, see Appendix C.
DRAFT ONLY 16 DRAFT ONLY
DR_AS_4055.doc - 28/05/2012 15:05:11
S E C T I O N 3 C A L C U L A T I O N O F P R E S S U R E S
A N D F O R C E S
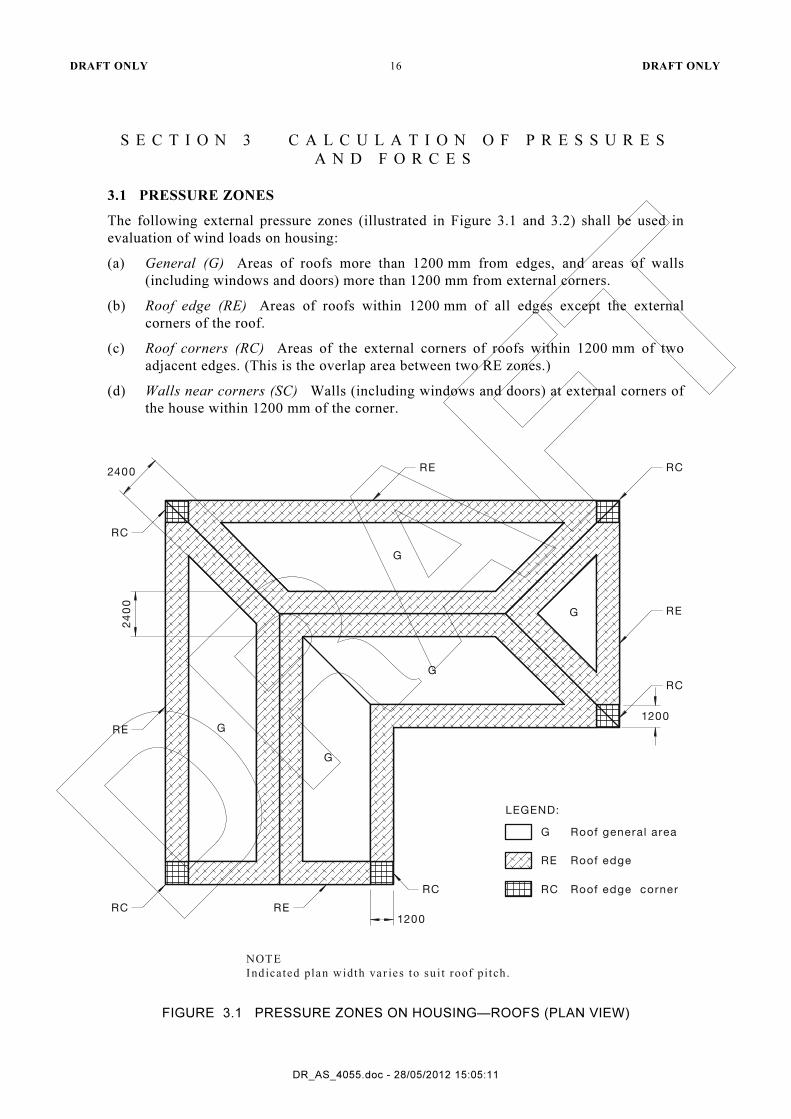
3.1 PRESSURE ZONES
The following external pressure zones (illustrated in Figure 3.1 and 3.2) shall be used in
evaluation of wind loads on housing:
(a) General (G) Areas of roofs more than 1200 mm from edges, and areas of walls
(including windows and doors) more than 1200 mm from external corners.
(b) Roof edge (RE) Areas of roofs within 1200 mm of all edges except the external
corners of the roof.
(c) Roof corners (RC) Areas of the external corners of roofs within 1200 mm of two
adjacent edges. (This is the overlap area between two RE zones.)
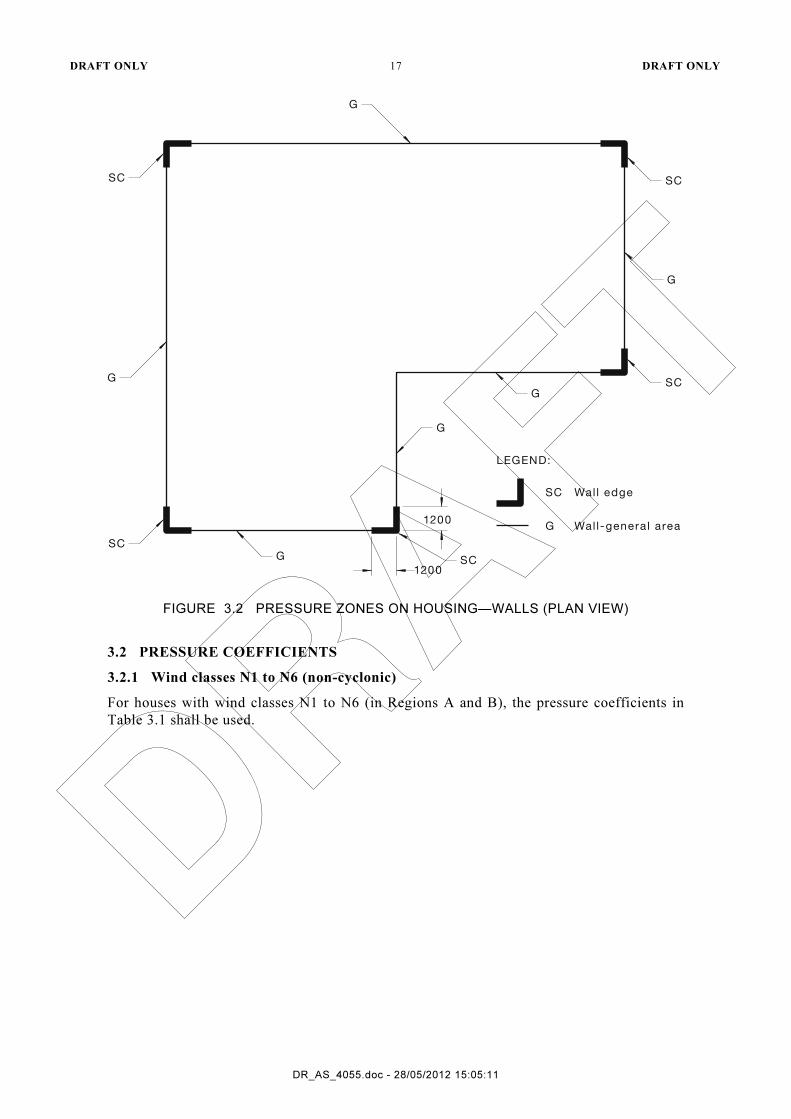
(d) Walls near corners (SC) Walls (including windows and doors) at external corners of
the house within 1200 mm of the corner.
G Roof general area
RE Roof edge
RC Roof edge corner
NOTEIndicated plan width var ies to su it roof pitch.
G
G
G
G
G
LEGEND:
1200
RC
RERC
RE
RC
24
00
2400 RE RC
RE
RC
1200
FIGURE 3.1 PRESSURE ZONES ON HOUSING—ROOFS (PLAN VIEW)
DRAFT ONLY 17 DRAFT ONLY
DR_AS_4055.doc - 28/05/2012 15:05:11
Wall edgeSC
Wall-genera l areaG
LEGEND:
1200
1200
G
G
SC
SC
G
SC
SC
G
G
G
SC
FIGURE 3.2 PRESSURE ZONES ON HOUSING—WALLS (PLAN VIEW)
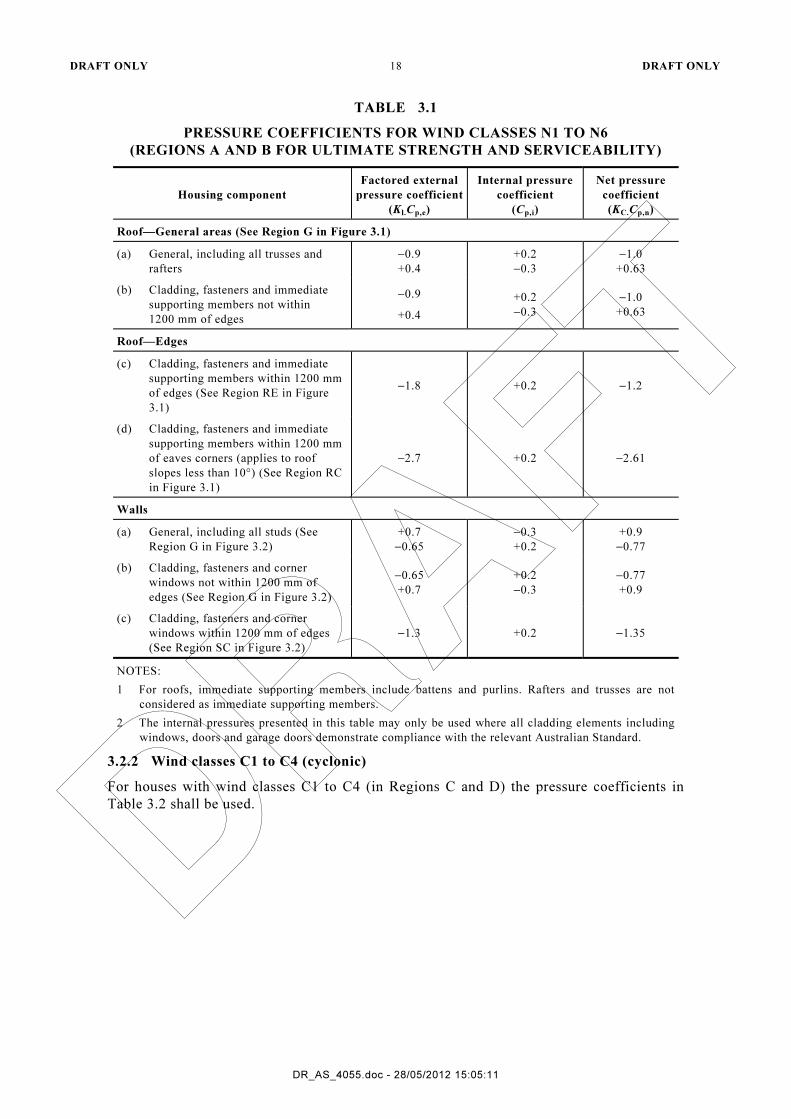
3.2 PRESSURE COEFFICIENTS
3.2.1 Wind classes N1 to N6 (non-cyclonic)
For houses with wind classes N1 to N6 (in Regions A and B), the pressure coefficients in
Table 3.1 shall be used.
DRAFT ONLY 18 DRAFT ONLY
DR_AS_4055.doc - 28/05/2012 15:05:11
TABLE 3.1
PRESSURE COEFFICIENTS FOR WIND CLASSES N1 TO N6
(REGIONS A AND B FOR ULTIMATE STRENGTH AND SERVICEABILITY)
Housing component
Factored external
pressure coefficient
(Kl.Cp,e)
Internal pressure
coefficient
(Cp,i)
Net pressure
coefficient
(KC.Cp,n)
Roof—General areas (See Region G in Figure 3.1)
(a) General, including all trusses and
rafters
−0.9
+0.4
+0.2
−0.3
−1.0
+0.63
(b) Cladding, fasteners and immediate
supporting members not within
1200 mm of edges
−0.9
+0.4
+0.2
−0.3
−1.0
+0.63
Roof—Edges
(c)
Cladding, fasteners and immediate
supporting members within 1200 mm
of edges (See Region RE in Figure
3.1)
−1.8 +0.2 −1.2
(d)
Cladding, fasteners and immediate
supporting members within 1200 mm
of eaves corners (applies to roof
slopes less than 10°) (See Region RC
in Figure 3.1)
−2.7 +0.2 −2.61
Walls
(a) General, including all studs (See
Region G in Figure 3.2)
+0.7
−0.65
−0.3
+0.2
+0.9
−0.77
(b) Cladding, fasteners and corner
windows not within 1200 mm of
edges (See Region G in Figure 3.2)
−0.65
+0.7
+0.2
−0.3
−0.77
+0.9
(c)
Cladding, fasteners and corner
windows within 1200 mm of edges
(See Region SC in Figure 3.2)
−1.3 +0.2 −1.35
NOTES:
1 For roofs, immediate supporting members include battens and purlins. Rafters and trusses are not
considered as immediate supporting members.
2 The internal pressures presented in this table may only be used where all cladding elements including
windows, doors and garage doors demonstrate compliance with the relevant Australian Standard.
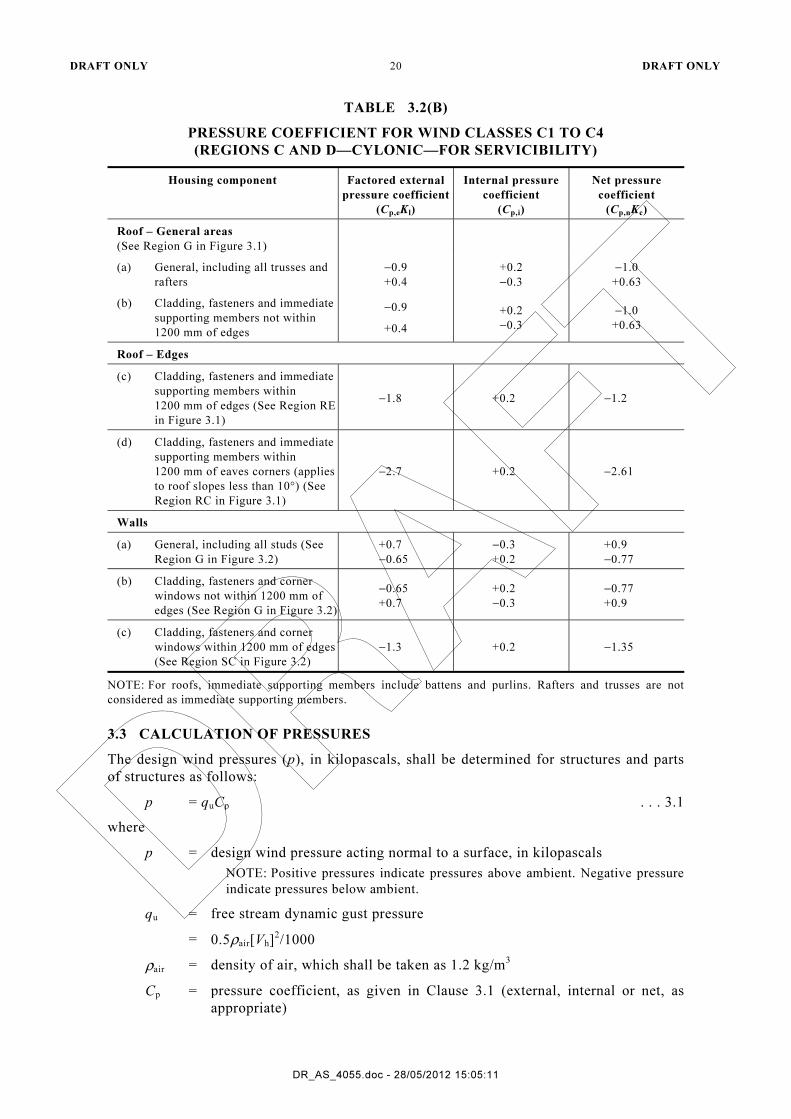
3.2.2 Wind classes C1 to C4 (cyclonic)
For houses with wind classes C1 to C4 (in Regions C and D) the pressure coefficients in
Table 3.2 shall be used.

DRAFT ONLY 19 DRAFT ONLY
DR_AS_4055.doc - 28/05/2012 15:05:11
TABLE 3.2(A)
PRESSURE COEFFICIENTS FOR WIND CLASSES C1 TO C4
(REGIONS C AND D—CYCLONIC—FOR ULTIMATE STRENGTH)
Housing component
Factored external
pressure coefficient
(Kl.Cp,e)
Internal pressure
coefficient
(Cp,i)
Net pressure
coefficient
(KC.Cp,n)
Roof—General areas (See Region G in Figure 3.1)
(a) General, including all trusses and
rafters
−0.9
+0.4
+0.7
−0.65
−1.44
+0.95
(b) Cladding, fasteners and immediate
supporting members not within
1200 mm of edges
−0.9
+0.4
+0.7
−0.65
−1.44
+0.95
Roof - Edges
(c) Cladding, fasteners and immediate
supporting members within
1200 mm of edges (See Region RE
in Figure 3.1)
−1.8 +0.7 −2.25
(d) Cladding, fasteners and immediate
supporting members within
1200 mm of eaves corners (applies
to roof slopes less than 10°) (See
Region RC in Figure 3.1)
−2.7 +0.7 −3.06
Walls
(a) General, including all studs (See
Region G in Figure 3.2)
−0.65
+0.7
+0.7
−0.65
−1.22
+1.22
(b) Cladding, fasteners and corner
windows not within 1200 mm of
edges (See Region G in Figure 3.2)
−0.65
+0.7
+0.7
−0.65
−1.22
+1.22
(c)
Cladding, fasteners and corner
windows within 1200 mm of edges
(See Region SC in Figure 3.2)
−1.3 +0.7 −1.8
NOTE: For roofs, immediate supporting members include battens and purlins. Rafters and
trusses are not considered as immediate supporting members.
DRAFT ONLY 20 DRAFT ONLY
DR_AS_4055.doc - 28/05/2012 15:05:11
TABLE 3.2(B)
PRESSURE COEFFICIENT FOR WIND CLASSES C1 TO C4
(REGIONS C AND D—CYLONIC—FOR SERVICIBILITY)
Housing component Factored external
pressure coefficient
(Cp,eKl)
Internal pressure
coefficient
(Cp,i)
Net pressure
coefficient
(Cp,nKc)
Roof – General areas
(See Region G in Figure 3.1)
(a) General, including all trusses and
rafters
−0.9
+0.4
+0.2
−0.3
−1.0
+0.63
(b) Cladding, fasteners and immediate
supporting members not within
1200 mm of edges
−0.9
+0.4
+0.2
−0.3
−1.0
+0.63
Roof – Edges
(c) Cladding, fasteners and immediate
supporting members within
1200 mm of edges (See Region RE
in Figure 3.1)
−1.8 +0.2 −1.2
(d) Cladding, fasteners and immediate
supporting members within
1200 mm of eaves corners (applies
to roof slopes less than 10°) (See
Region RC in Figure 3.1)
−2.7 +0.2 −2.61
Walls
(a) General, including all studs (See
Region G in Figure 3.2)
+0.7
−0.65
−0.3
+0.2
+0.9
−0.77
(b) Cladding, fasteners and corner
windows not within 1200 mm of
edges (See Region G in Figure 3.2)
−0.65
+0.7
+0.2
−0.3
−0.77
+0.9
(c) Cladding, fasteners and corner
windows within 1200 mm of edges
(See Region SC in Figure 3.2)
−1.3 +0.2 −1.35
NOTE: For roofs, immediate supporting members include battens and purlins. Rafters and trusses are not
considered as immediate supporting members.
3.3 CALCULATION OF PRESSURES
The design wind pressures (p), in kilopascals, shall be determined for structures and parts
of structures as follows:
p = quCp . . . 3.1
where
p = design wind pressure acting normal to a surface, in kilopascals
NOTE: Positive pressures indicate pressures above ambient. Negative pressure
indicate pressures below ambient.
qu = free stream dynamic gust pressure
= 0.5ρair[Vh]2/1000
ρair = density of air, which shall be taken as 1.2 kg/m3
Cp = pressure coefficient, as given in Clause 3.1 (external, internal or net, as
appropriate)
DRAFT ONLY 21 DRAFT ONLY
DR_AS_4055.doc - 28/05/2012 15:05:11
This Standard does not require evaluation of pressures across internal walls. (Where design
requires pressures across internal walls, see AS/NZS 1170.2.)
3.4 CALCULATION OF FORCES
The design wind forces shall be determined for structures and parts of structures by
multiplying the pressure by the area under consideration and applying the resultant force at
the centre of the area normal to the surface.
NOTE: Additional information on calculating pressures and forces may be found in
AS/NZS 1170.2.
Uplift forces are determined by taking the uplift pressure (negative pressure coefficients
indicate outward forces on a surface) by the total area of the roof (see Section 4).
Racking forces are determined for the overall house by taking the appropriate vertical
projected area and applied by distributing the force to the bracing walls or panels (see
Section 5).
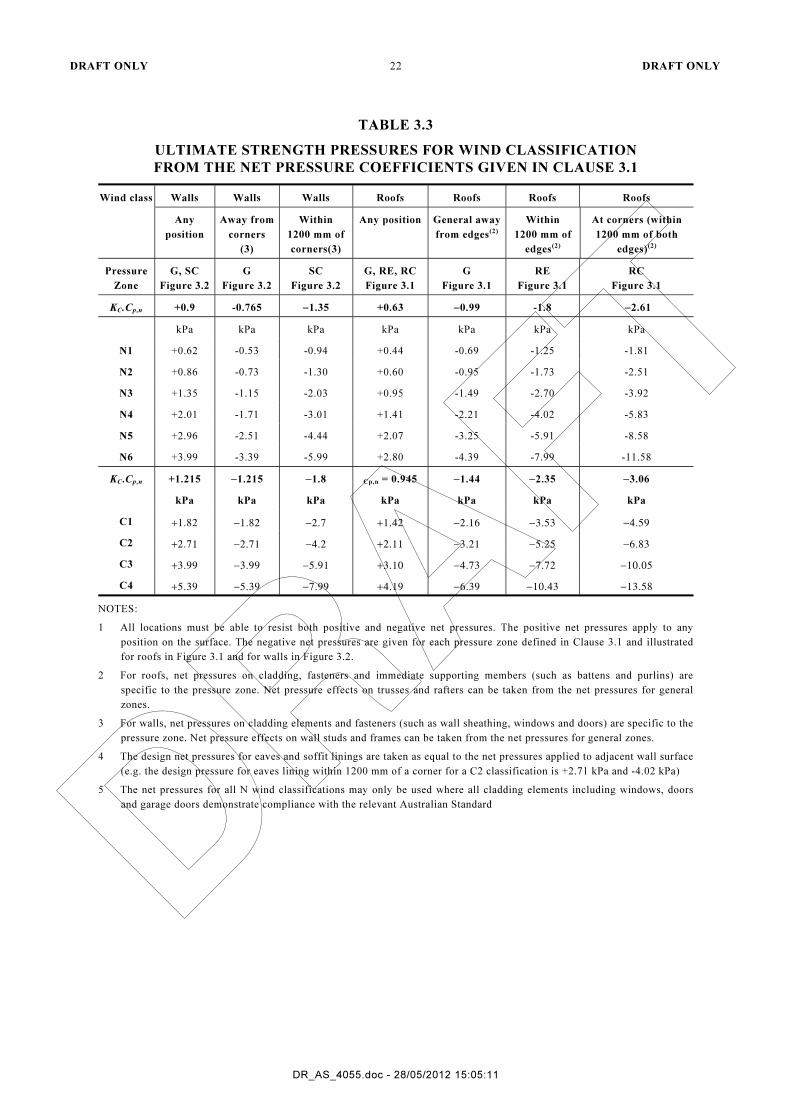
3.5 PRESSURES FOR TYPICAL APPLICATIONS
Based on the net pressure coefficients in Tables 3.1 and 3.2, ultimate limit state design
pressures (tabulated as ‘ultimate strength pressure’) for the N and C categories are as given
in Table 3.3. Serviceability limit state design pressures (tabulated as ‘serviceability
pressure’) from N and C categories are as given in Table 3.4.
DRAFT ONLY 22 DRAFT ONLY
DR_AS_4055.doc - 28/05/2012 15:05:11
TABLE 3.3
ULTIMATE STRENGTH PRESSURES FOR WIND CLASSIFICATION
FROM THE NET PRESSURE COEFFICIENTS GIVEN IN CLAUSE 3.1
Wind class Walls Walls Walls Roofs Roofs Roofs Roofs
Any
position
Away from
corners
(3)
Within
1200 mm of
corners(3)
Any position General away
from edges(2)
Within
1200 mm of
edges(2)
At corners (within
1200 mm of both
edges)(2)
Pressure
Zone
G, SC
Figure 3.2
G
Figure 3.2
SC
Figure 3.2
G, RE, RC
Figure 3.1
G
Figure 3.1
RE
Figure 3.1
RC
Figure 3.1
KC.Cp,n +0.9 -0.765 −1.35 +0.63 −0.99 -1.8 −2.61
kPa kPa kPa kPa kPa kPa kPa
N1 +0.62 -0.53 -0.94 +0.44 -0.69 -1.25 -1.81
N2 +0.86 -0.73 -1.30 +0.60 -0.95 -1.73 -2.51
N3 +1.35 -1.15 -2.03 +0.95 -1.49 -2.70 -3.92
N4 +2.01 -1.71 -3.01 +1.41 -2.21 -4.02 -5.83
N5 +2.96 -2.51 -4.44 +2.07 -3.25 -5.91 -8.58
N6 +3.99 -3.39 -5.99 +2.80 -4.39 -7.99 -11.58
KC.Cp,n +1.215 −1.215 −1.8 Cp,n = 0.945 −1.44 −2.35 −3.06
kPa kPa kPa kPa kPa kPa kPa
C1 +1.82 −1.82 −2.7 +1.42 −2.16 −3.53 −4.59
C2 +2.71 −2.71 −4.2 +2.11 −3.21 −5.25 −6.83
C3 +3.99 −3.99 −5.91 +3.10 −4.73 −7.72 −10.05
C4 +5.39 −5.39 −7.99 +4.19 −6.39 −10.43 −13.58
NOTES:
1 All locations must be able to resist both positive and negative net pressures. The positive net pressures apply to any
position on the surface. The negative net pressures are given for each pressure zone defined in Clause 3.1 and illustrated
for roofs in Figure 3.1 and for walls in Figure 3.2.
2 For roofs, net pressures on cladding, fasteners and immediate supporting members (such as battens and purlins) are
specific to the pressure zone. Net pressure effects on trusses and rafters can be taken from the net pressures for general
zones.
3 For walls, net pressures on cladding elements and fasteners (such as wall sheathing, windows and doors) are specific to the
pressure zone. Net pressure effects on wall studs and frames can be taken from the net pressures for general zones.
4 The design net pressures for eaves and soffit linings are taken as equal to the net pressures applied to adjacent wall surface
(e.g. the design pressure for eaves lining within 1200 mm of a corner for a C2 classification is +2.71 kPa and -4.02 kPa)
5 The net pressures for all N wind classifications may only be used where all cladding elements including windows, doors
and garage doors demonstrate compliance with the relevant Australian Standard
DRAFT ONLY 23 DRAFT ONLY
DR_AS_4055.doc - 28/05/2012 15:05:11
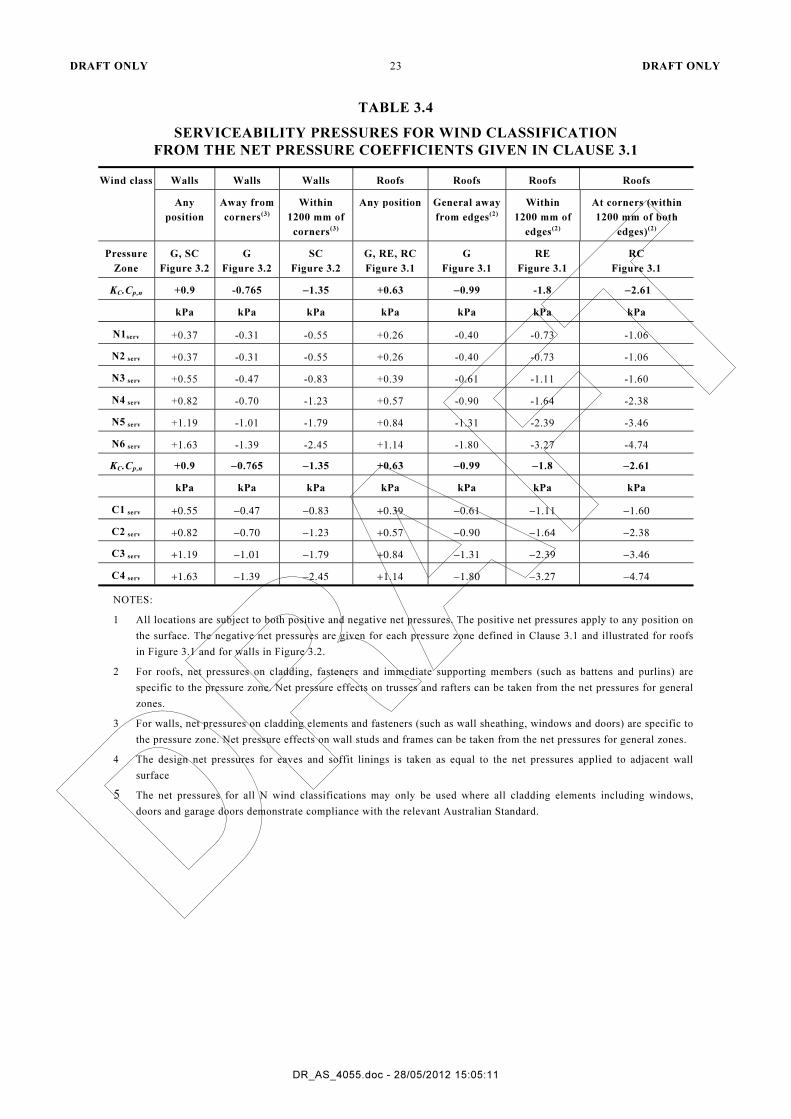
TABLE 3.4
SERVICEABILITY PRESSURES FOR WIND CLASSIFICATION
FROM THE NET PRESSURE COEFFICIENTS GIVEN IN CLAUSE 3.1
Wind class Walls Walls Walls Roofs Roofs Roofs Roofs
Any
position
Away from
corners(3)
Within
1200 mm of
corners(3)
Any position General away
from edges(2)
Within
1200 mm of
edges(2)
At corners (within
1200 mm of both
edges)(2)
Pressure
Zone
G, SC
Figure 3.2
G
Figure 3.2
SC
Figure 3.2
G, RE, RC
Figure 3.1
G
Figure 3.1
RE
Figure 3.1
RC
Figure 3.1
KC.Cp,n +0.9 -0.765 −1.35 +0.63 −0.99 -1.8 −2.61
kPa kPa kPa kPa kPa kPa kPa
N1serv +0.37 -0.31 -0.55 +0.26 -0.40 -0.73 -1.06
N2 serv +0.37 -0.31 -0.55 +0.26 -0.40 -0.73 -1.06
N3 serv +0.55 -0.47 -0.83 +0.39 -0.61 -1.11 -1.60
N4 serv +0.82 -0.70 -1.23 +0.57 -0.90 -1.64 -2.38
N5 serv +1.19 -1.01 -1.79 +0.84 -1.31 -2.39 -3.46
N6 serv +1.63 -1.39 -2.45 +1.14 -1.80 -3.27 -4.74
KC.Cp,n +0.9 −0.765 −1.35 +0.63 −0.99 −1.8 −2.61
kPa kPa kPa kPa kPa kPa kPa
C1 serv +0.55 −0.47 −0.83 +0.39 −0.61 −1.11 −1.60
C2 serv +0.82 −0.70 −1.23 +0.57 −0.90 −1.64 −2.38
C3 serv +1.19 −1.01 −1.79 +0.84 −1.31 −2.39 −3.46
C4 serv +1.63 −1.39 −2.45 +1.14 −1.80 −3.27 −4.74
NOTES:
1 All locations are subject to both positive and negative net pressures. The positive net pressures apply to any position on
the surface. The negative net pressures are given for each pressure zone defined in Clause 3.1 and illustrated for roofs
in Figure 3.1 and for walls in Figure 3.2.
2 For roofs, net pressures on cladding, fasteners and immediate supporting members (such as battens and purlins) are
specific to the pressure zone. Net pressure effects on trusses and rafters can be taken from the net pressures for general
zones.
3 For walls, net pressures on cladding elements and fasteners (such as wall sheathing, windows and doors) are specific to
the pressure zone. Net pressure effects on wall studs and frames can be taken from the net pressures for general zones.
4 The design net pressures for eaves and soffit linings is taken as equal to the net pressures applied to adjacent wall
surface
5 The net pressures for all N wind classifications may only be used where all cladding elements including windows,
doors and garage doors demonstrate compliance with the relevant Australian Standard.

DRAFT ONLY 24 DRAFT ONLY
DR_AS_4055.doc - 28/05/2012 15:05:11
S E C T I O N 4 U P L I F T F O R C E S
Table 4.1 gives net design uplift pressures for the determination of anchoring requirements
at tops of walls. The pressures shall be applied as uplift on the entire roof surface.
TABLE 4.1
NET DESIGN UPLIFT PRESSURES FOR DETERMINATION OF ANCHORING
REQUIREMENTS AT TOP OF WALLS, kPa
Wind class Serviceability limit state Ultimate strength limit state
Roof type Roof type
Tile roof Sheet roof
(see Note 4) Tile roof
Sheet roof
(see Note 4)
N1 0 −0.08 0 −0.37
N2 0 −0.08 −0.23 −0.63
N3 0 −0.30 −0.77 −1.17
N4 −0.18 −0.58 −1.50 −1.90
N5 −0.60 −1.00 −2.53 −2.93
N6 −1.08 −1.48 −3.67 −4.07
C1 0 −0.30 −1.44 −1.84
C2 −0.18 −0.58 −2.50 −2.90
C3 −0.60 −1.00 −4.00 −4.40
C4 −1.08 −1.48 −5.67 −6.07
NOTES:
1 The net design uplift pressures given in Table 4.1 are based on the following load
combinations:
(a) Serviceability limit state: Ws – γG.
(b) Ultimate strength limit state: Wu – γG.
2 Wu and Ws have been calculated as set out in Section 3 where Vh = Vh,u or Vh,s as
appropriate, using the pressure coefficients as given in Section 3.
3 Load combination factor γ = 0.8.
4 The values for G = 0.9 kPa for tile roof, G = 0.4 kPa for sheet roof have been taken
from AS 1684.
5 Sheet roof includes metal tile roof.
DRAFT ONLY 25 DRAFT ONLY
DR_AS_4055.doc - 28/05/2012 15:05:11
S E C T I O N 5 R A C K I N G F O R C E S
5.1 RACKING FORCES
Racking forces are lateral (horizontal) forces transferred to the foundations through bracing
provided for each storey of the house and the subfloor.
The forces occur in walls parallel to the wind direction and are calculated from the
horizontal component of wind blowing on the external envelope of the house and resisted
by bracing walls.
Racking forces shall be calculated as follows:
(a) Determine the wind class as given in Section 2.
(b) Determine area of elevation of the house as given in Clause 5.2.
(c) Determine the wind pressure as given in Tables 5.1 for buildings presenting a flat
vertical surface to the wind.
(d) Determine the wind pressure as given in Tables 5.2 to 5.13 using the width (shorter
dimension) of the building and roof pitch of the building being designed. Pressures
are given for single storey and upper storey of two storeys for both long and short
sides of the building, and for lower storey of two storeys or subfloor for both long
and short sides of the building.
(e) Calculate racking force, in kN, as follows:
Total racking force = Area of elevation (m2) × Lateral wind pressure (kPa).
The racking force shall be calculated for both directions (long and short sides) of the
building. The total racking force for each storey or level of the building shall be determined
as the sum of the forces on each of the areas facing the direction being considered. Racking
forces shall be calculated to address the most adverse loading situation.
NOTES:
1 For intermediate values between those given in Tables 5.1 to 5.13, use linear interpolation.
2 For the explanation of Tables 5.1 to 5.13, see Appendix A.
3 For worked examples, see Appendix D.
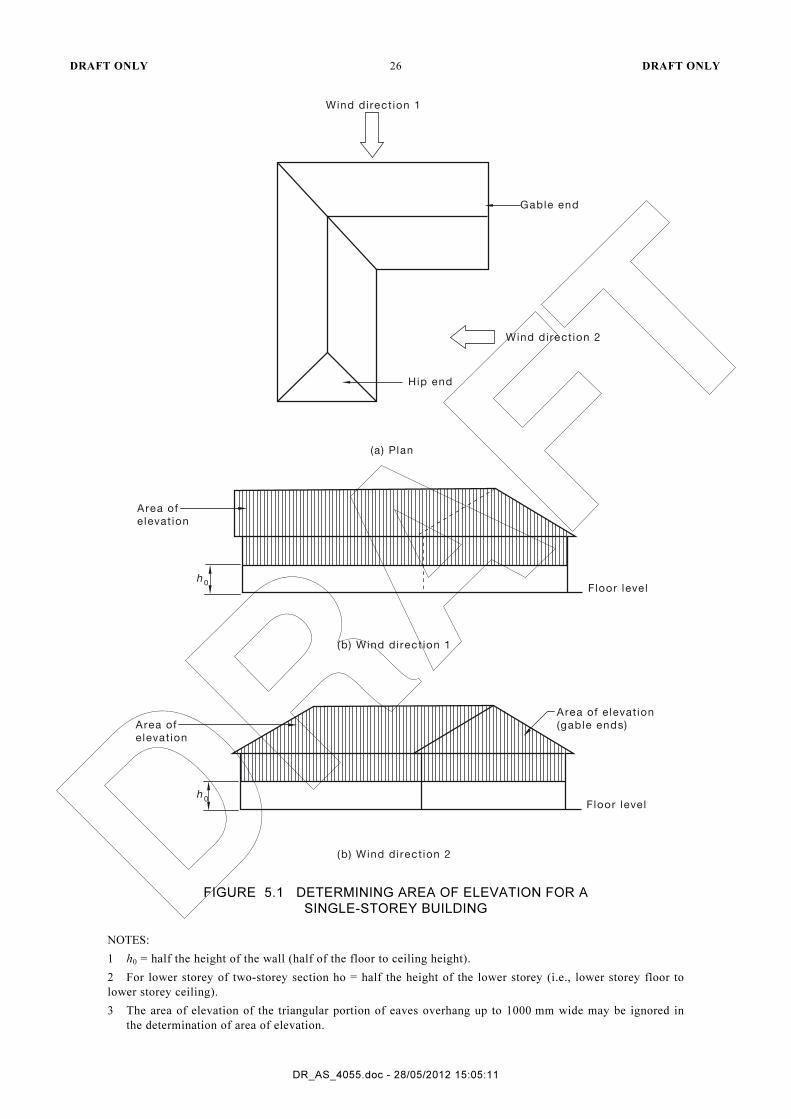
5.2 AREA OF ELEVATION
Area of elevation appropriate for calculation of racking forces shall be as shown in Figures
5.1 to 5.3.
The wind direction used shall be that resulting in the greatest load for the length and width
of the building, respectively. As wind can blow from any direction, the elevation used shall
be that for the worst direction. In the case of a single-storey house with a gable at one end
and a hip at the other, the gable end facing the wind will result in a greater amount of load
at right angles to the width of the house than the hip end facing the wind.
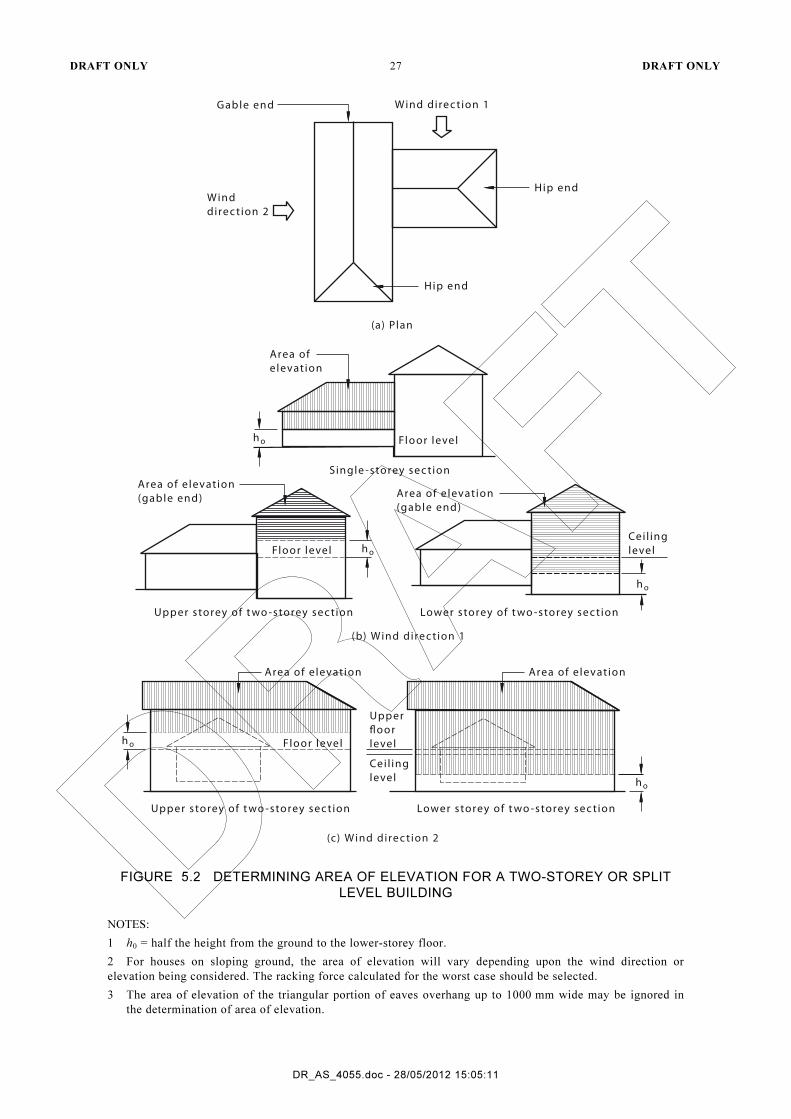
For complex building shapes, buildings that are composed of a combination of storeys or
rectangles (that is, L, H or U shapes) the shapes may be considered individually and forces
added together later or the total area as a whole can be calculated. Irrespective of which
method is used, racking forces shall be calculated to address the most adverse situation.
If a veranda, or the like, is present and is to be enclosed, it shall be included in the ‘area of
elevation’ calculations.
Where there is more than one floor level in a building, each level shall be considered
separately for the purpose of calculating the racking forces at each level.
DRAFT ONLY 26 DRAFT ONLY
DR_AS_4055.doc - 28/05/2012 15:05:11
Wind direct ion 1
Wind direct ion 2
Gable end
Hip end
Area of
e levat ion
Floor level
Area of e levat ion
(gable ends)
Area of
e levat ion
h0
h0
Floor level
(a) Plan
(b) Wind direct ion 1
(b) Wind direct ion 2
FIGURE 5.1 DETERMINING AREA OF ELEVATION FOR A
SINGLE-STOREY BUILDING
NOTES:
1 h0 = half the height of the wall (half of the floor to ceiling height).
2 For lower storey of two-storey section ho = half the height of the lower storey (i.e., lower storey floor to
lower storey ceiling).
3 The area of elevation of the triangular portion of eaves overhang up to 1000 mm wide may be ignored in
the determination of area of elevation.
DRAFT ONLY 27 DRAFT ONLY
DR_AS_4055.doc - 28/05/2012 15:05:11
(a) Plan
(b) Wind direc t ion 1
(c) Wind direc t ion 2
Wind direc t ion 1
Winddirec tion 2
Gable end
Hip end
Hip end
h o
h o
h o
Floor level
Cei l inglevelFloor level
Upp er s torey of t wo -storey sec tion
Single -storey sec tion
Area of e levation(gable end)
Lower storey of t wo -storey sec tion
Area ofelevation
Area of e levation(gable end)
Area of e levationArea of e levation
h o
h o
Lower storey of t wo -storey sec tionUpp er s torey of t wo -storey sec tion
Cei l inglevel
Upp erfloorlevelFloor level
FIGURE 5.2 DETERMINING AREA OF ELEVATION FOR A TWO-STOREY OR SPLIT
LEVEL BUILDING
NOTES:
1 h0 = half the height from the ground to the lower-storey floor.
2 For houses on sloping ground, the area of elevation will vary depending upon the wind direction or
elevation being considered. The racking force calculated for the worst case should be selected.
3 The area of elevation of the triangular portion of eaves overhang up to 1000 mm wide may be ignored in
the determination of area of elevation.

DRAFT ONLY 28 DRAFT ONLY
DR_AS_4055.doc - 28/05/2012 15:05:11
Wind direct ion 2 Wind direct ion 3
Gable endHip end
Wind direct ion 1
Floor
Area of
e levat ion
H0
h0
Area of
e levat ion
Floor
Floor
Area of
e levat ion
h0
h0
(a) Plan
(b) Wind direct ion 1
(c) Wind direct ion 2—Hip end (d) Wind direct ion 3—Gable end
In the subf loor of a two-storey construct ion, the maximum distance (H0) f rom the
ground to the unders ide of the bearer in the lower f loor shal l be 1800 mm.
FIGURE 5.3 DETERMINING AREA OF ELEVATION FOR SUBFLOORS
NOTES:
1 h0 = half the height of the wall (half of the floor to ceiling height).
2 For wind direction 2, the pressure on the gable end is determined from Table 5.1 and the pressure on the
hip section of the elevation is determined from Tables 5.2 to 5.13. The total of racking forces is the sum of the
forces calculated for each section.
3 The area of elevation of the triangular portion of eaves overhang up to 1000 mm wide may be ignored in
the determination of area of elevation.
DRAFT ONLY 29 DRAFT ONLY
DR_AS_4055.doc - 28/05/2012 15:05:11
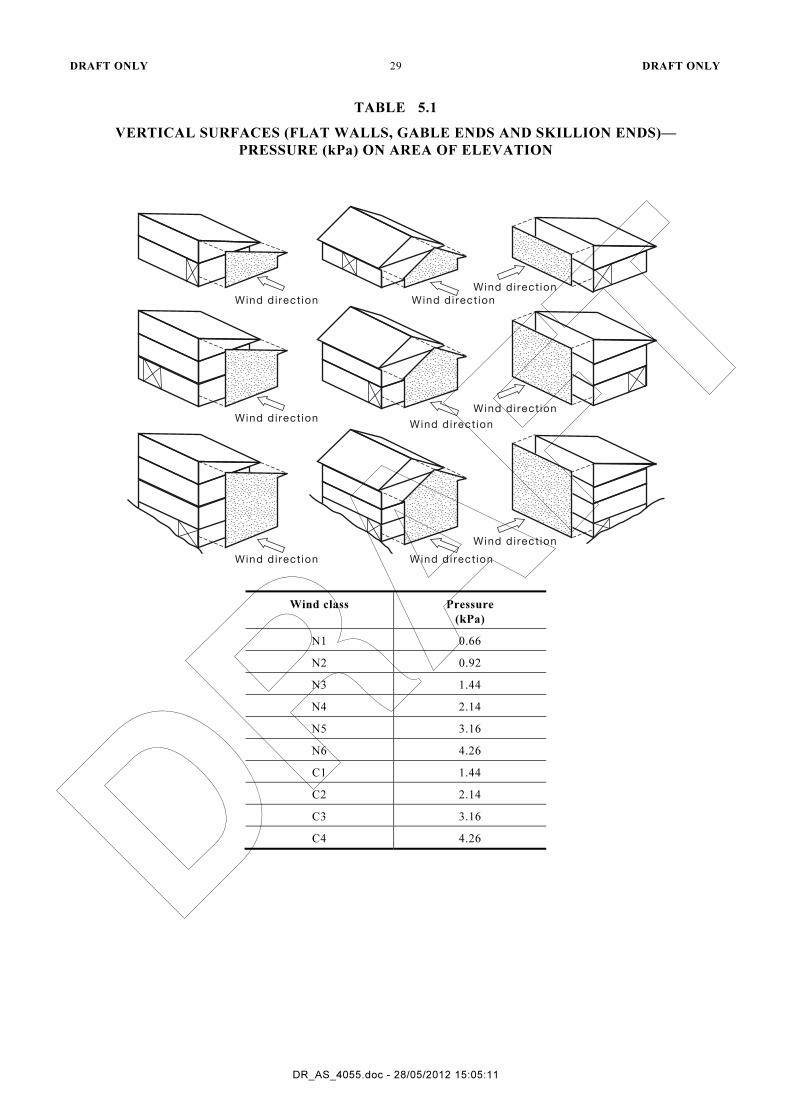
TABLE 5.1
VERTICAL SURFACES (FLAT WALLS, GABLE ENDS AND SKILLION ENDS)—
PRESSURE (kPa) ON AREA OF ELEVATION
Wind direct ion Wind direct ion
Wind direct ion
Wind direct ion
Wind direct ion
Wind direct ion
Wind direct ion
Wind direct ion
Wind direct ion
Wind class Pressure
(kPa)
N1 0.66
N2 0.92
N3 1.44
N4 2.14
N5 3.16
N6 4.26
C1 1.44
C2 2.14
C3 3.16
C4 4.26

DRAFT ONLY 30 DRAFT ONLY
DR_AS_4055.doc - 28/05/2012 15:05:11
TABLE 5.2
HIP ROOFS AND SIDE WIND ON GABLE ROOFS—PRESSURE (kPa) ON AREA
OF ELEVATION—SINGLE STOREY OR UPPER FLOOR OF TWO STOREYS
Single storey or upper floor of two storeys, 2.4 m storey, 0.3 m floor
Width (m) Roof pitch (degrees)
0 5 10 15 20 25 30 35
Wind di rect ion Wind di rect ion
WW
N1: Wind on side
4 0.61 0.53 0.48 0.44 0.44 0.52 0.56 0.55
5 0.61 0.52 0.46 0.41 0.42 0.50 0.54 0.53
6 0.61 0.50 0.44 0.39 0.42 0.50 0.53 0.54
7 0.61 0.49 0.42 0.38 0.43 0.51 0.53 0.54
8 0.61 0.47 0.40 0.37 0.43 0.51 0.52 0.54
9 0.61 0.46 0.39 0.36 0.44 0.52 0.51 0.54
10 0.61 0.45 0.38 0.35 0.44 0.52 0.51 0.54
11 0.61 0.44 0.36 0.35 0.45 0.52 0.51 0.55
12 0.61 0.42 0.34 0.35 0.45 0.52 0.51 0.55
13 0.61 0.41 0.33 0.36 0.46 0.52 0.52 0.55
14 0.61 0.40 0.31 0.36 0.46 0.53 0.52 0.56
15 0.61 0.39 0.30 0.36 0.47 0.53 0.52 0.56
16 0.61 0.39 0.29 0.37 0.47 0.53 0.52 0.56
Wind di rect ion Wind di rect ionW W
N1: Wind on end
4 0.67 0.62 0.59 0.55 0.55 0.57 0.59 0.58
5 0.67 0.61 0.57 0.53 0.53 0.56 0.58 0.57
6 0.67 0.60 0.56 0.52 0.53 0.56 0.57 0.57
7 0.67 0.59 0.54 0.50 0.52 0.56 0.56 0.57
8 0.67 0.58 0.53 0.49 0.52 0.56 0.56 0.57
9 0.67 0.57 0.51 0.48 0.52 0.56 0.55 0.57
10 0.67 0.56 0.50 0.47 0.52 0.56 0.54 0.57
11 0.67 0.55 0.49 0.46 0.52 0.56 0.54 0.57
12 0.67 0.55 0.47 0.46 0.52 0.56 0.54 0.57
13 0.67 0.54 0.46 0.46 0.52 0.56 0.55 0.57
14 0.67 0.53 0.45 0.46 0.53 0.56 0.55 0.57
15 0.67 0.52 0.44 0.46 0.53 0.56 0.55 0.58
16 0.67 0.52 0.43 0.46 0.53 0.56 0.55 0.58

DRAFT ONLY 31 DRAFT ONLY
DR_AS_4055.doc - 28/05/2012 15:05:11
TABLE 5.3
HIP ROOFS AND SIDE WIND ON GABLE ROOFS—PRESSURE (kPa) ON AREA
OF ELEVATION—LOWER STOREY OF TWO STOREYS
Lower storey of two storeys, 2.4 m storey, 0.3 m
Width (m) Roof pitch (degrees)
0 5 10 15 20 25 30 35
Wind direction Wind direction
W W
N1: Wind on side
4 0.61 0.58 0.56 0.54 0.54 0.60 0.62 0.61
5 0.61 0.58 0.55 0.53 0.53 0.59 0.61 0.60
6 0.61 0.57 0.54 0.52 0.52 0.59 0.60 0.59
7 0.61 0.57 0.53 0.51 0.52 0.59 0.59 0.59
8 0.61 0.56 0.53 0.50 0.52 0.58 0.58 0.59
9 0.61 0.55 0.52 0.49 0.52 0.58 0.58 0.59
10 0.61 0.55 0.51 0.48 0.52 0.58 0.57 0.59
11 0.61 0.54 0.50 0.48 0.52 0.58 0.57 0.59
12 0.61 0.54 0.49 0.48 0.52 0.58 0.57 0.59
13 0.61 0.53 0.48 0.48 0.52 0.58 0.57 0.59
14 0.61 0.53 0.47 0.48 0.52 0.58 0.57 0.59
15 0.61 0.52 0.46 0.48 0.53 0.58 0.57 0.59
16 0.61 0.52 0.45 0.48 0.53 0.58 0.57 0.59
Wind direction
W
N1: Wind on end
4 0.67 0.65 0.64 0.63 0.62 0.63 0.64 0.63
5 0.67 0.65 0.63 0.62 0.61 0.62 0.63 0.63
6 0.67 0.64 0.63 0.61 0.61 0.62 0.63 0.62
7 0.67 0.64 0.62 0.60 0.61 0.62 0.62 0.62
8 0.67 0.64 0.62 0.60 0.61 0.62 0.62 0.62
9 0.67 0.63 0.61 0.59 0.60 0.62 0.61 0.62
10 0.67 0.63 0.60 0.58 0.60 0.61 0.61 0.61
11 0.67 0.63 0.60 0.58 0.60 0.61 0.60 0.61
12 0.67 0.62 0.59 0.58 0.60 0.61 0.60 0.61
13 0.67 0.62 0.58 0.58 0.60 0.61 0.60 0.61
14 0.67 0.62 0.58 0.58 0.60 0.61 0.60 0.61
15 0.67 0.61 0.57 0.57 0.60 0.61 0.60 0.61
16 0.67 0.61 0.57 0.57 0.60 0.61 0.60 0.61
DRAFT ONLY 32 DRAFT ONLY
DR_AS_4055.doc - 28/05/2012 15:05:11
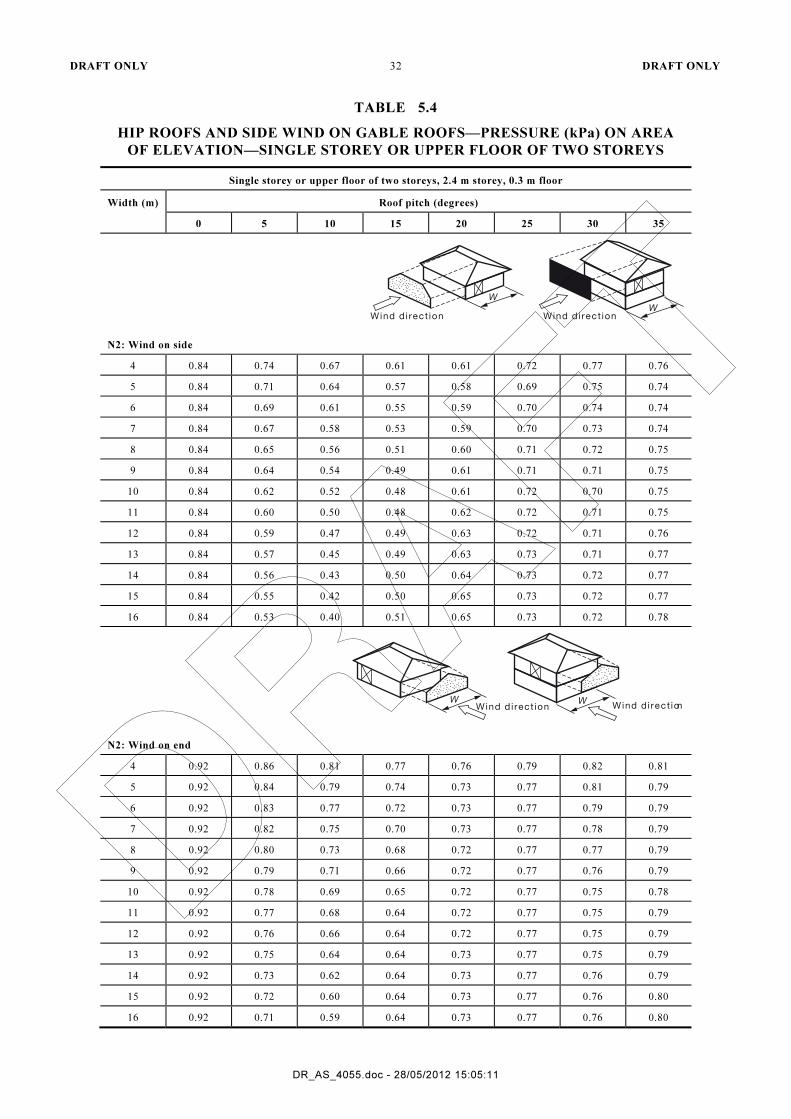
TABLE 5.4
HIP ROOFS AND SIDE WIND ON GABLE ROOFS—PRESSURE (kPa) ON AREA
OF ELEVATION—SINGLE STOREY OR UPPER FLOOR OF TWO STOREYS
Single storey or upper floor of two storeys, 2.4 m storey, 0.3 m floor
Width (m) Roof pitch (degrees)
0 5 10 15 20 25 30 35
Wind di rect ion Wind di rect ion
WW
N2: Wind on side
4 0.84 0.74 0.67 0.61 0.61 0.72 0.77 0.76
5 0.84 0.71 0.64 0.57 0.58 0.69 0.75 0.74
6 0.84 0.69 0.61 0.55 0.59 0.70 0.74 0.74
7 0.84 0.67 0.58 0.53 0.59 0.70 0.73 0.74
8 0.84 0.65 0.56 0.51 0.60 0.71 0.72 0.75
9 0.84 0.64 0.54 0.49 0.61 0.71 0.71 0.75
10 0.84 0.62 0.52 0.48 0.61 0.72 0.70 0.75
11 0.84 0.60 0.50 0.48 0.62 0.72 0.71 0.75
12 0.84 0.59 0.47 0.49 0.63 0.72 0.71 0.76
13 0.84 0.57 0.45 0.49 0.63 0.73 0.71 0.77
14 0.84 0.56 0.43 0.50 0.64 0.73 0.72 0.77
15 0.84 0.55 0.42 0.50 0.65 0.73 0.72 0.77
16 0.84 0.53 0.40 0.51 0.65 0.73 0.72 0.78
Wind di rect ion Wind di rect ionW W
N2: Wind on end
4 0.92 0.86 0.81 0.77 0.76 0.79 0.82 0.81
5 0.92 0.84 0.79 0.74 0.73 0.77 0.81 0.79
6 0.92 0.83 0.77 0.72 0.73 0.77 0.79 0.79
7 0.92 0.82 0.75 0.70 0.73 0.77 0.78 0.79
8 0.92 0.80 0.73 0.68 0.72 0.77 0.77 0.79
9 0.92 0.79 0.71 0.66 0.72 0.77 0.76 0.79
10 0.92 0.78 0.69 0.65 0.72 0.77 0.75 0.78
11 0.92 0.77 0.68 0.64 0.72 0.77 0.75 0.79
12 0.92 0.76 0.66 0.64 0.72 0.77 0.75 0.79
13 0.92 0.75 0.64 0.64 0.73 0.77 0.75 0.79
14 0.92 0.73 0.62 0.64 0.73 0.77 0.76 0.79
15 0.92 0.72 0.60 0.64 0.73 0.77 0.76 0.80
16 0.92 0.71 0.59 0.64 0.73 0.77 0.76 0.80
DRAFT ONLY 33 DRAFT ONLY
DR_AS_4055.doc - 28/05/2012 15:05:11
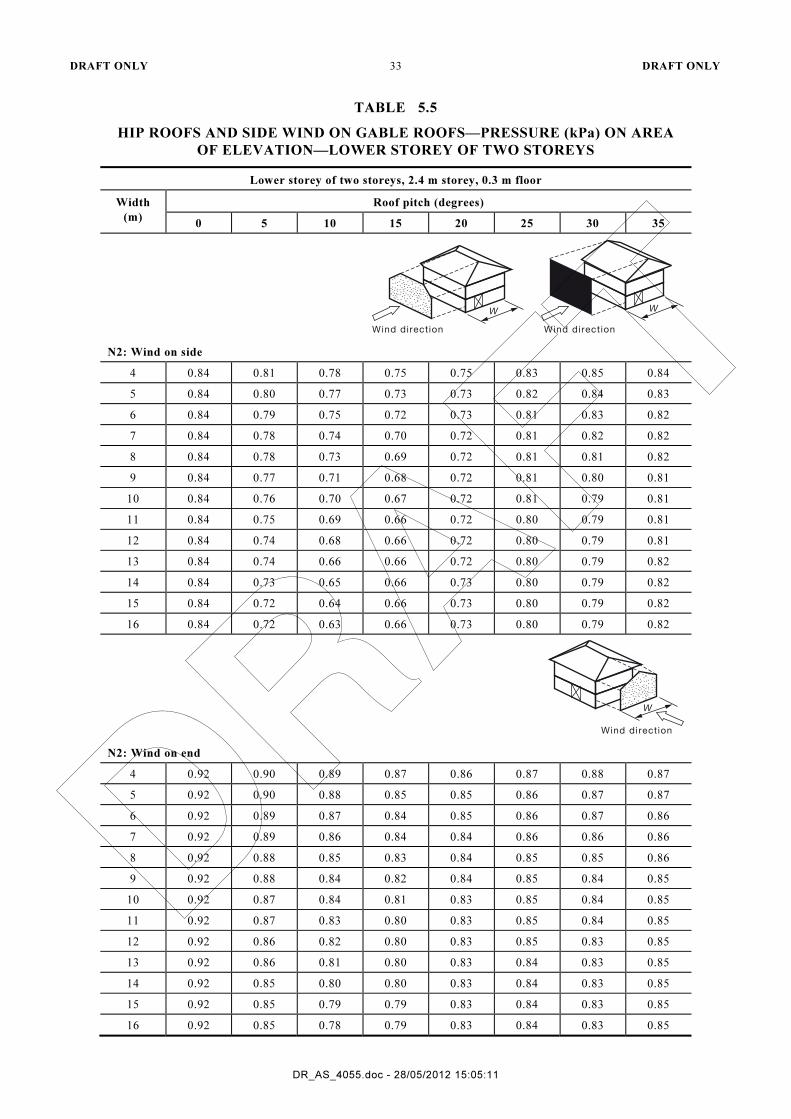
TABLE 5.5
HIP ROOFS AND SIDE WIND ON GABLE ROOFS—PRESSURE (kPa) ON AREA
OF ELEVATION—LOWER STOREY OF TWO STOREYS
Lower storey of two storeys, 2.4 m storey, 0.3 m floor
Width
(m)
Roof pitch (degrees)
0 5 10 15 20 25 30 35
Wind direction Wind direction
W W
N2: Wind on side
4 0.84 0.81 0.78 0.75 0.75 0.83 0.85 0.84
5 0.84 0.80 0.77 0.73 0.73 0.82 0.84 0.83
6 0.84 0.79 0.75 0.72 0.73 0.81 0.83 0.82
7 0.84 0.78 0.74 0.70 0.72 0.81 0.82 0.82
8 0.84 0.78 0.73 0.69 0.72 0.81 0.81 0.82
9 0.84 0.77 0.71 0.68 0.72 0.81 0.80 0.81
10 0.84 0.76 0.70 0.67 0.72 0.81 0.79 0.81
11 0.84 0.75 0.69 0.66 0.72 0.80 0.79 0.81
12 0.84 0.74 0.68 0.66 0.72 0.80 0.79 0.81
13 0.84 0.74 0.66 0.66 0.72 0.80 0.79 0.82
14 0.84 0.73 0.65 0.66 0.73 0.80 0.79 0.82
15 0.84 0.72 0.64 0.66 0.73 0.80 0.79 0.82
16 0.84 0.72 0.63 0.66 0.73 0.80 0.79 0.82
Wind direction
W
N2: Wind on end
4 0.92 0.90 0.89 0.87 0.86 0.87 0.88 0.87
5 0.92 0.90 0.88 0.85 0.85 0.86 0.87 0.87
6 0.92 0.89 0.87 0.84 0.85 0.86 0.87 0.86
7 0.92 0.89 0.86 0.84 0.84 0.86 0.86 0.86
8 0.92 0.88 0.85 0.83 0.84 0.85 0.85 0.86
9 0.92 0.88 0.84 0.82 0.84 0.85 0.84 0.85
10 0.92 0.87 0.84 0.81 0.83 0.85 0.84 0.85
11 0.92 0.87 0.83 0.80 0.83 0.85 0.84 0.85
12 0.92 0.86 0.82 0.80 0.83 0.85 0.83 0.85
13 0.92 0.86 0.81 0.80 0.83 0.84 0.83 0.85
14 0.92 0.85 0.80 0.80 0.83 0.84 0.83 0.85
15 0.92 0.85 0.79 0.79 0.83 0.84 0.83 0.85
16 0.92 0.85 0.78 0.79 0.83 0.84 0.83 0.85

DRAFT ONLY 34 DRAFT ONLY
DR_AS_4055.doc - 28/05/2012 15:05:11
TABLE 5.6
HIP ROOFS AND SIDE WIND ON GABLE ROOFS—
PRESSURE (kPa) ON AREA OF ELEVATION—
SINGLE STOREY OR UPPER FLOOR OF TWO STOREYS
Single storey or upper floor of two storeys, 2.4 m storey, 0.3 m floor
Width (m) Roof pitch (degrees)
0 5 10 15 20 25 30 35
Wind di rect ion Wind di rect ion
WW
N3, C1: Wind on side
4 1.30 1.20 1.00 0.95 0.96 1.10 1.20 1.20
5 1.30 1.10 1.00 0.89 0.91 1.10 1.20 1.20
6 1.30 1.10 0.95 0.85 0.91 1.10 1.20 1.20
7 1.30 1.10 0.91 0.82 0.93 1.10 1.10 1.20
8 1.30 1.00 0.88 0.79 0.94 1.10 1.10 1.20
9 1.30 0.99 0.84 0.77 0.95 1.10 1.10 1.20
10 1.30 0.97 0.81 0.75 0.95 1.10 1.10 1.20
11 1.30 0.94 0.78 0.75 0.97 1.10 1.10 1.20
12 1.30 0.92 0.74 0.76 0.98 1.10 1.10 1.20
13 1.30 0.90 0.71 0.77 0.99 1.10 1.10 1.20
14 1.30 0.87 0.68 0.78 1.00 1.10 1.10 1.20
15 1.30 0.85 0.65 0.79 1.00 1.10 1.10 1.20
16 1.30 0.83 0.62 0.79 1.00 1.10 1.10 1.20
Wind di rect ion Wind di rect ionW W
N3, C1: Wind on end
4 1.40 1.30 1.30 1.20 1.20 1.20 1.30 1.30
5 1.40 1.30 1.20 1.20 1.10 1.20 1.30 1.20
6 1.40 1.30 1.20 1.10 1.10 1.20 1.20 1.20
7 1.40 1.30 1.20 1.10 1.10 1.20 1.20 1.20
8 1.40 1.30 1.10 1.10 1.10 1.20 1.20 1.20
9 1.40 1.20 1.10 1.00 1.10 1.20 1.20 1.20
10 1.40 1.20 1.10 1.00 1.10 1.20 1.20 1.20
11 1.40 1.20 1.10 1.00 1.10 1.20 1.20 1.20
12 1.40 1.20 1.00 1.00 1.10 1.20 1.20 1.20
13 1.40 1.20 1.00 1.00 1.10 1.20 1.20 1.20
14 1.40 1.10 0.97 1.00 1.10 1.20 1.20 1.20
15 1.40 1.10 0.94 1.00 1.10 1.20 1.20 1.20
16 1.40 1.10 0.92 1.00 1.10 1.20 1.20 1.20
DRAFT ONLY 35 DRAFT ONLY
DR_AS_4055.doc - 28/05/2012 15:05:11
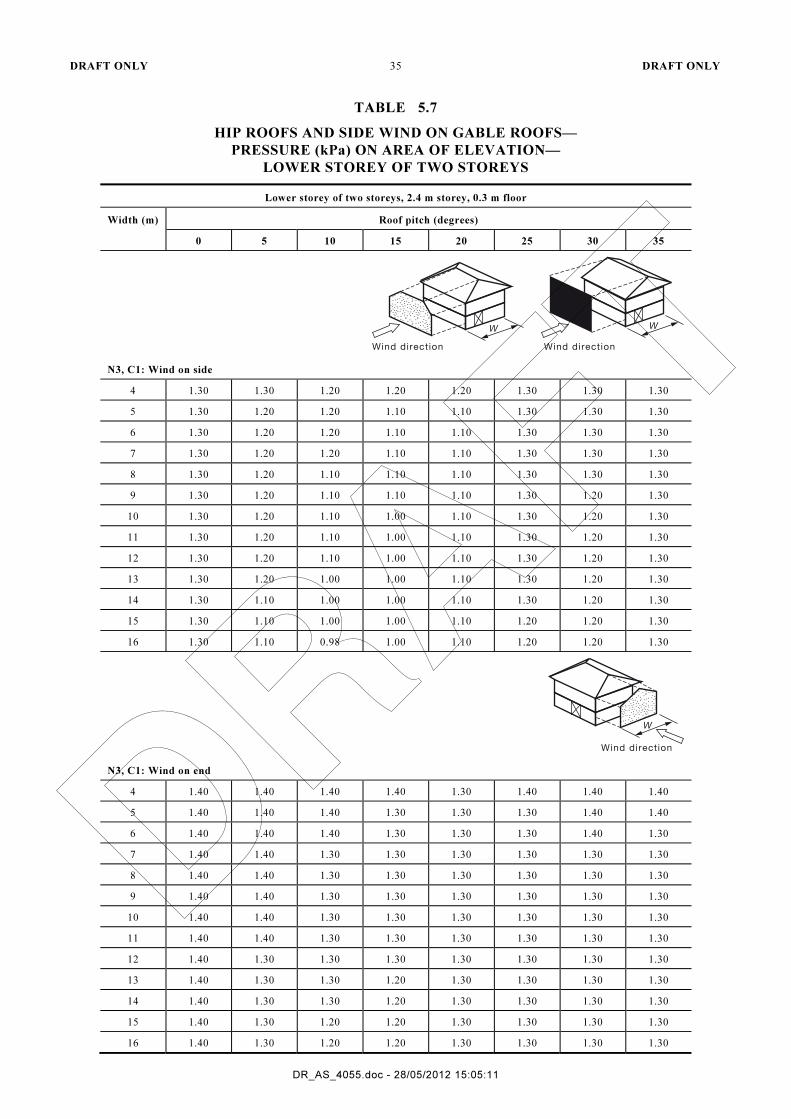
TABLE 5.7
HIP ROOFS AND SIDE WIND ON GABLE ROOFS—
PRESSURE (kPa) ON AREA OF ELEVATION—
LOWER STOREY OF TWO STOREYS
Lower storey of two storeys, 2.4 m storey, 0.3 m floor
Width (m) Roof pitch (degrees)
0 5 10 15 20 25 30 35
Wind direction Wind direction
W W
N3, C1: Wind on side
4 1.30 1.30 1.20 1.20 1.20 1.30 1.30 1.30
5 1.30 1.20 1.20 1.10 1.10 1.30 1.30 1.30
6 1.30 1.20 1.20 1.10 1.10 1.30 1.30 1.30
7 1.30 1.20 1.20 1.10 1.10 1.30 1.30 1.30
8 1.30 1.20 1.10 1.10 1.10 1.30 1.30 1.30
9 1.30 1.20 1.10 1.10 1.10 1.30 1.20 1.30
10 1.30 1.20 1.10 1.00 1.10 1.30 1.20 1.30
11 1.30 1.20 1.10 1.00 1.10 1.30 1.20 1.30
12 1.30 1.20 1.10 1.00 1.10 1.30 1.20 1.30
13 1.30 1.20 1.00 1.00 1.10 1.30 1.20 1.30
14 1.30 1.10 1.00 1.00 1.10 1.30 1.20 1.30
15 1.30 1.10 1.00 1.00 1.10 1.20 1.20 1.30
16 1.30 1.10 0.98 1.00 1.10 1.20 1.20 1.30
Wind direction
W
N3, C1: Wind on end
4 1.40 1.40 1.40 1.40 1.30 1.40 1.40 1.40
5 1.40 1.40 1.40 1.30 1.30 1.30 1.40 1.40
6 1.40 1.40 1.40 1.30 1.30 1.30 1.40 1.30
7 1.40 1.40 1.30 1.30 1.30 1.30 1.30 1.30
8 1.40 1.40 1.30 1.30 1.30 1.30 1.30 1.30
9 1.40 1.40 1.30 1.30 1.30 1.30 1.30 1.30
10 1.40 1.40 1.30 1.30 1.30 1.30 1.30 1.30
11 1.40 1.40 1.30 1.30 1.30 1.30 1.30 1.30
12 1.40 1.30 1.30 1.30 1.30 1.30 1.30 1.30
13 1.40 1.30 1.30 1.20 1.30 1.30 1.30 1.30
14 1.40 1.30 1.30 1.20 1.30 1.30 1.30 1.30
15 1.40 1.30 1.20 1.20 1.30 1.30 1.30 1.30
16 1.40 1.30 1.20 1.20 1.30 1.30 1.30 1.30
DRAFT ONLY 36 DRAFT ONLY
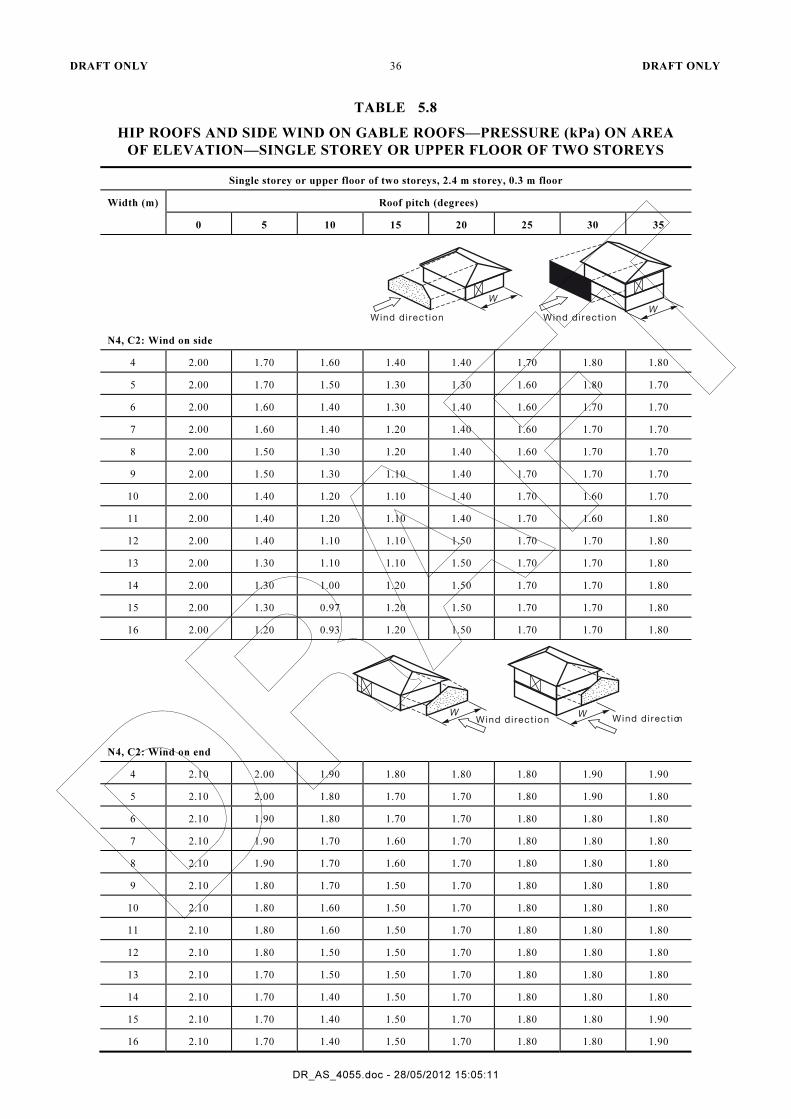
DR_AS_4055.doc - 28/05/2012 15:05:11
TABLE 5.8
HIP ROOFS AND SIDE WIND ON GABLE ROOFS—PRESSURE (kPa) ON AREA
OF ELEVATION—SINGLE STOREY OR UPPER FLOOR OF TWO STOREYS
Single storey or upper floor of two storeys, 2.4 m storey, 0.3 m floor
Width (m) Roof pitch (degrees)
0 5 10 15 20 25 30 35
Wind di rect ion Wind di rect ion
WW
N4, C2: Wind on side
4 2.00 1.70 1.60 1.40 1.40 1.70 1.80 1.80
5 2.00 1.70 1.50 1.30 1.30 1.60 1.80 1.70
6 2.00 1.60 1.40 1.30 1.40 1.60 1.70 1.70
7 2.00 1.60 1.40 1.20 1.40 1.60 1.70 1.70
8 2.00 1.50 1.30 1.20 1.40 1.60 1.70 1.70
9 2.00 1.50 1.30 1.10 1.40 1.70 1.70 1.70
10 2.00 1.40 1.20 1.10 1.40 1.70 1.60 1.70
11 2.00 1.40 1.20 1.10 1.40 1.70 1.60 1.80
12 2.00 1.40 1.10 1.10 1.50 1.70 1.70 1.80
13 2.00 1.30 1.10 1.10 1.50 1.70 1.70 1.80
14 2.00 1.30 1.00 1.20 1.50 1.70 1.70 1.80
15 2.00 1.30 0.97 1.20 1.50 1.70 1.70 1.80
16 2.00 1.20 0.93 1.20 1.50 1.70 1.70 1.80
Wind di rect ion Wind di rect ionW W
N4, C2: Wind on end
4 2.10 2.00 1.90 1.80 1.80 1.80 1.90 1.90
5 2.10 2.00 1.80 1.70 1.70 1.80 1.90 1.80
6 2.10 1.90 1.80 1.70 1.70 1.80 1.80 1.80
7 2.10 1.90 1.70 1.60 1.70 1.80 1.80 1.80
8 2.10 1.90 1.70 1.60 1.70 1.80 1.80 1.80
9 2.10 1.80 1.70 1.50 1.70 1.80 1.80 1.80
10 2.10 1.80 1.60 1.50 1.70 1.80 1.80 1.80
11 2.10 1.80 1.60 1.50 1.70 1.80 1.80 1.80
12 2.10 1.80 1.50 1.50 1.70 1.80 1.80 1.80
13 2.10 1.70 1.50 1.50 1.70 1.80 1.80 1.80
14 2.10 1.70 1.40 1.50 1.70 1.80 1.80 1.80
15 2.10 1.70 1.40 1.50 1.70 1.80 1.80 1.90
16 2.10 1.70 1.40 1.50 1.70 1.80 1.80 1.90
DRAFT ONLY 37 DRAFT ONLY
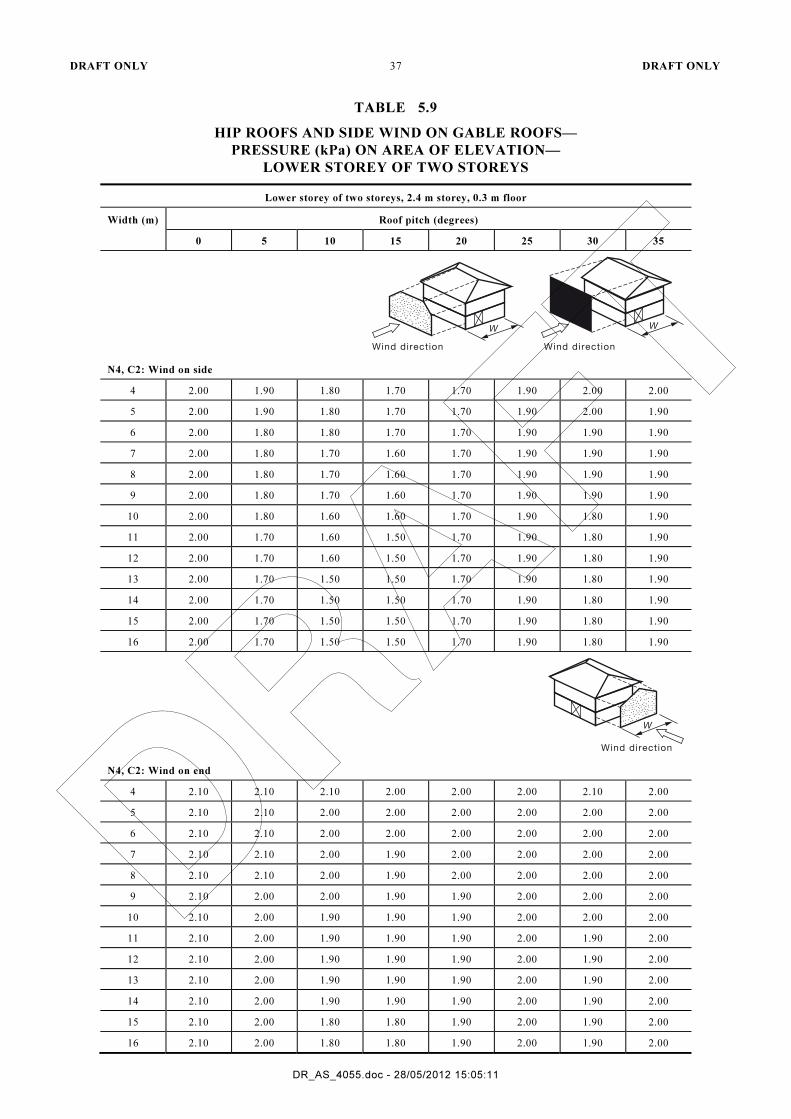
DR_AS_4055.doc - 28/05/2012 15:05:11
TABLE 5.9
HIP ROOFS AND SIDE WIND ON GABLE ROOFS—
PRESSURE (kPa) ON AREA OF ELEVATION—
LOWER STOREY OF TWO STOREYS
Lower storey of two storeys, 2.4 m storey, 0.3 m floor
Width (m) Roof pitch (degrees)
0 5 10 15 20 25 30 35
Wind direction Wind direction
W W
N4, C2: Wind on side
4 2.00 1.90 1.80 1.70 1.70 1.90 2.00 2.00
5 2.00 1.90 1.80 1.70 1.70 1.90 2.00 1.90
6 2.00 1.80 1.80 1.70 1.70 1.90 1.90 1.90
7 2.00 1.80 1.70 1.60 1.70 1.90 1.90 1.90
8 2.00 1.80 1.70 1.60 1.70 1.90 1.90 1.90
9 2.00 1.80 1.70 1.60 1.70 1.90 1.90 1.90
10 2.00 1.80 1.60 1.60 1.70 1.90 1.80 1.90
11 2.00 1.70 1.60 1.50 1.70 1.90 1.80 1.90
12 2.00 1.70 1.60 1.50 1.70 1.90 1.80 1.90
13 2.00 1.70 1.50 1.50 1.70 1.90 1.80 1.90
14 2.00 1.70 1.50 1.50 1.70 1.90 1.80 1.90
15 2.00 1.70 1.50 1.50 1.70 1.90 1.80 1.90
16 2.00 1.70 1.50 1.50 1.70 1.90 1.80 1.90
Wind direction
W
N4, C2: Wind on end
4 2.10 2.10 2.10 2.00 2.00 2.00 2.10 2.00
5 2.10 2.10 2.00 2.00 2.00 2.00 2.00 2.00
6 2.10 2.10 2.00 2.00 2.00 2.00 2.00 2.00
7 2.10 2.10 2.00 1.90 2.00 2.00 2.00 2.00
8 2.10 2.10 2.00 1.90 2.00 2.00 2.00 2.00
9 2.10 2.00 2.00 1.90 1.90 2.00 2.00 2.00
10 2.10 2.00 1.90 1.90 1.90 2.00 2.00 2.00
11 2.10 2.00 1.90 1.90 1.90 2.00 1.90 2.00
12 2.10 2.00 1.90 1.90 1.90 2.00 1.90 2.00
13 2.10 2.00 1.90 1.90 1.90 2.00 1.90 2.00
14 2.10 2.00 1.90 1.90 1.90 2.00 1.90 2.00
15 2.10 2.00 1.80 1.80 1.90 2.00 1.90 2.00
16 2.10 2.00 1.80 1.80 1.90 2.00 1.90 2.00
DRAFT ONLY 38 DRAFT ONLY
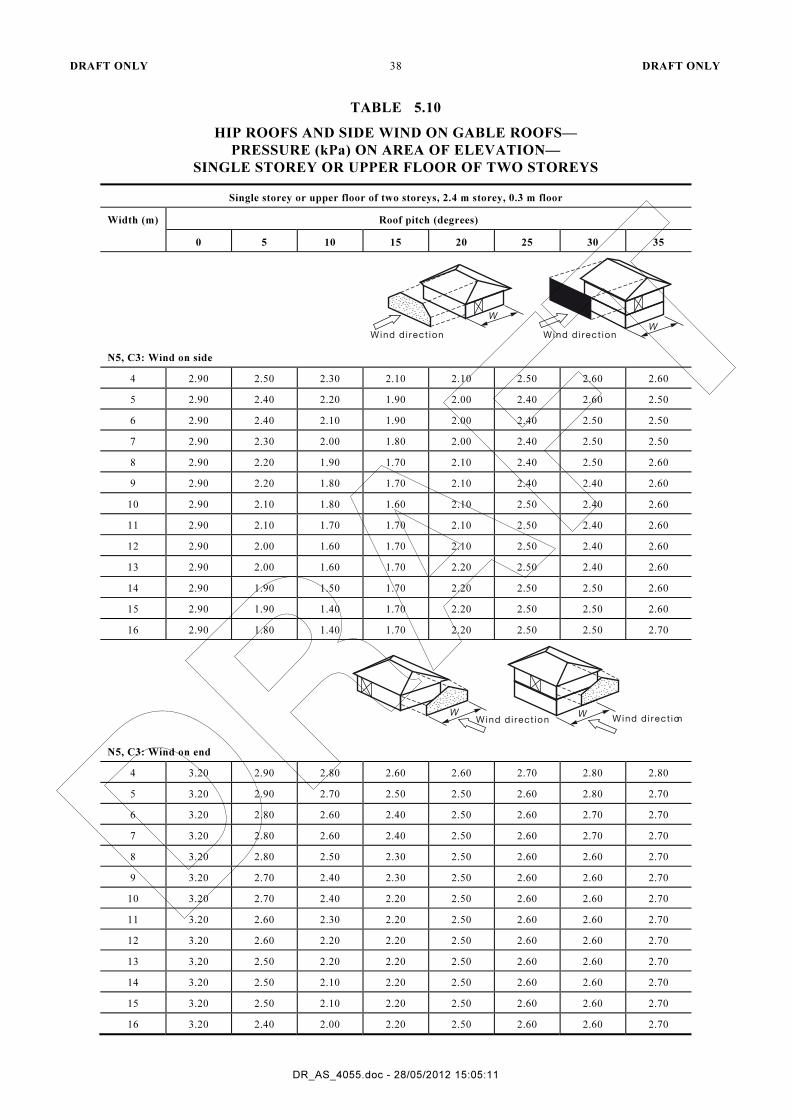
DR_AS_4055.doc - 28/05/2012 15:05:11
TABLE 5.10
HIP ROOFS AND SIDE WIND ON GABLE ROOFS—
PRESSURE (kPa) ON AREA OF ELEVATION—
SINGLE STOREY OR UPPER FLOOR OF TWO STOREYS
Single storey or upper floor of two storeys, 2.4 m storey, 0.3 m floor
Width (m) Roof pitch (degrees)
0 5 10 15 20 25 30 35
Wind di rect ion Wind di rect ion
WW
N5, C3: Wind on side
4 2.90 2.50 2.30 2.10 2.10 2.50 2.60 2.60
5 2.90 2.40 2.20 1.90 2.00 2.40 2.60 2.50
6 2.90 2.40 2.10 1.90 2.00 2.40 2.50 2.50
7 2.90 2.30 2.00 1.80 2.00 2.40 2.50 2.50
8 2.90 2.20 1.90 1.70 2.10 2.40 2.50 2.60
9 2.90 2.20 1.80 1.70 2.10 2.40 2.40 2.60
10 2.90 2.10 1.80 1.60 2.10 2.50 2.40 2.60
11 2.90 2.10 1.70 1.70 2.10 2.50 2.40 2.60
12 2.90 2.00 1.60 1.70 2.10 2.50 2.40 2.60
13 2.90 2.00 1.60 1.70 2.20 2.50 2.40 2.60
14 2.90 1.90 1.50 1.70 2.20 2.50 2.50 2.60
15 2.90 1.90 1.40 1.70 2.20 2.50 2.50 2.60
16 2.90 1.80 1.40 1.70 2.20 2.50 2.50 2.70
Wind di rect ion Wind di rect ionW W
N5, C3: Wind on end
4 3.20 2.90 2.80 2.60 2.60 2.70 2.80 2.80
5 3.20 2.90 2.70 2.50 2.50 2.60 2.80 2.70
6 3.20 2.80 2.60 2.40 2.50 2.60 2.70 2.70
7 3.20 2.80 2.60 2.40 2.50 2.60 2.70 2.70
8 3.20 2.80 2.50 2.30 2.50 2.60 2.60 2.70
9 3.20 2.70 2.40 2.30 2.50 2.60 2.60 2.70
10 3.20 2.70 2.40 2.20 2.50 2.60 2.60 2.70
11 3.20 2.60 2.30 2.20 2.50 2.60 2.60 2.70
12 3.20 2.60 2.20 2.20 2.50 2.60 2.60 2.70
13 3.20 2.50 2.20 2.20 2.50 2.60 2.60 2.70
14 3.20 2.50 2.10 2.20 2.50 2.60 2.60 2.70
15 3.20 2.50 2.10 2.20 2.50 2.60 2.60 2.70
16 3.20 2.40 2.00 2.20 2.50 2.60 2.60 2.70
DRAFT ONLY 39 DRAFT ONLY
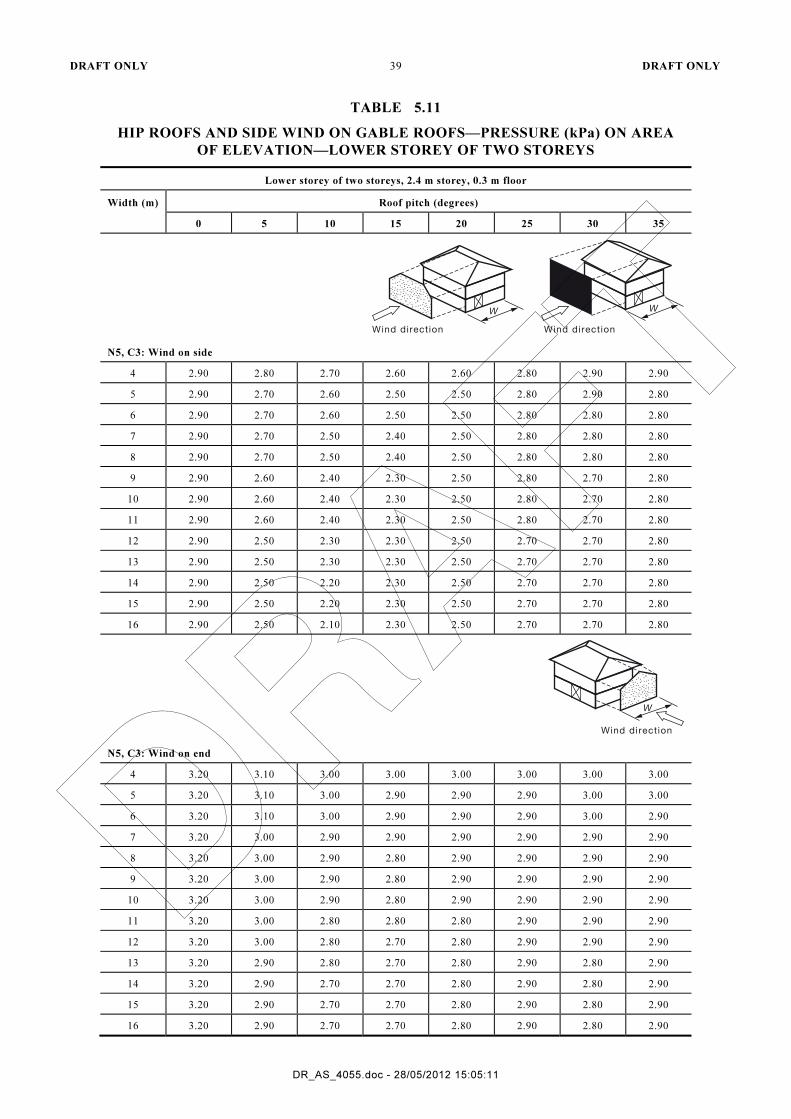
DR_AS_4055.doc - 28/05/2012 15:05:11
TABLE 5.11
HIP ROOFS AND SIDE WIND ON GABLE ROOFS—PRESSURE (kPa) ON AREA
OF ELEVATION—LOWER STOREY OF TWO STOREYS
Lower storey of two storeys, 2.4 m storey, 0.3 m floor
Width (m) Roof pitch (degrees)
0 5 10 15 20 25 30 35
Wind direction Wind direction
W W
N5, C3: Wind on side
4 2.90 2.80 2.70 2.60 2.60 2.80 2.90 2.90
5 2.90 2.70 2.60 2.50 2.50 2.80 2.90 2.80
6 2.90 2.70 2.60 2.50 2.50 2.80 2.80 2.80
7 2.90 2.70 2.50 2.40 2.50 2.80 2.80 2.80
8 2.90 2.70 2.50 2.40 2.50 2.80 2.80 2.80
9 2.90 2.60 2.40 2.30 2.50 2.80 2.70 2.80
10 2.90 2.60 2.40 2.30 2.50 2.80 2.70 2.80
11 2.90 2.60 2.40 2.30 2.50 2.80 2.70 2.80
12 2.90 2.50 2.30 2.30 2.50 2.70 2.70 2.80
13 2.90 2.50 2.30 2.30 2.50 2.70 2.70 2.80
14 2.90 2.50 2.20 2.30 2.50 2.70 2.70 2.80
15 2.90 2.50 2.20 2.30 2.50 2.70 2.70 2.80
16 2.90 2.50 2.10 2.30 2.50 2.70 2.70 2.80
Wind direction
W
N5, C3: Wind on end
4 3.20 3.10 3.00 3.00 3.00 3.00 3.00 3.00
5 3.20 3.10 3.00 2.90 2.90 2.90 3.00 3.00
6 3.20 3.10 3.00 2.90 2.90 2.90 3.00 2.90
7 3.20 3.00 2.90 2.90 2.90 2.90 2.90 2.90
8 3.20 3.00 2.90 2.80 2.90 2.90 2.90 2.90
9 3.20 3.00 2.90 2.80 2.90 2.90 2.90 2.90
10 3.20 3.00 2.90 2.80 2.90 2.90 2.90 2.90
11 3.20 3.00 2.80 2.80 2.80 2.90 2.90 2.90
12 3.20 3.00 2.80 2.70 2.80 2.90 2.90 2.90
13 3.20 2.90 2.80 2.70 2.80 2.90 2.80 2.90
14 3.20 2.90 2.70 2.70 2.80 2.90 2.80 2.90
15 3.20 2.90 2.70 2.70 2.80 2.90 2.80 2.90
16 3.20 2.90 2.70 2.70 2.80 2.90 2.80 2.90

DRAFT ONLY 40 DRAFT ONLY
DR_AS_4055.doc - 28/05/2012 15:05:11
TABLE 5.12
HIP ROOFS AND SIDE WIND ON GABLE ROOFS—
PRESSURE (kPa) ON AREA OF ELEVATION—
SINGLE STOREY OR UPPER FLOOR OF TWO STOREYS
Single storey or upper floor of two storeys, 2.4 m storey, 0.3 m floor
Width (m) Roof pitch (degrees)
0 5 10 15 20 25 30 35
Wind di rect ion Wind di rect ion
WW
N6, C4: Wind on side
4 3.92 3.38 3.11 2.84 2.84 3.38 3.51 3.51
5 3.92 3.24 2.97 2.57 2.70 3.24 3.51 3.38
6 3.92 3.24 2.84 2.57 2.70 3.24 3.38 3.38
7 3.92 3.11 2.70 2.43 2.70 3.24 3.38 3.38
8 3.92 2.97 2.57 2.30 2.84 3.24 3.38 3.51
9 3.92 2.97 2.43 2.30 2.84 3.24 3.24 3.51
10 3.92 2.84 2.43 2.16 2.84 3.38 3.24 3.51
11 3.92 2.84 2.30 2.30 2.84 3.38 3.24 3.51
12 3.92 2.70 2.16 2.30 2.84 3.38 3.24 3.51
13 3.92 2.70 2.16 2.30 2.97 3.38 3.24 3.51
14 3.92 2.57 2.03 2.30 2.97 3.38 3.38 3.51
15 3.92 2.57 1.89 2.30 2.97 3.38 3.38 3.51
16 3.92 2.43 1.89 2.30 2.97 3.38 3.38 3.65
Wind di rect ion Wind di rect ionW W
N6, C4: Wind on end
4 4.32 3.92 3.78 3.51 3.51 3.65 3.78 3.78
5 4.32 3.92 3.65 3.38 3.38 3.51 3.78 3.65
6 4.32 3.78 3.51 3.24 3.38 3.51 3.65 3.65
7 4.32 3.78 3.51 3.24 3.38 3.51 3.65 3.65
8 4.32 3.78 3.38 3.11 3.38 3.51 3.51 3.65
9 4.32 3.65 3.24 3.11 3.38 3.51 3.51 3.65
10 4.32 3.65 3.24 2.97 3.38 3.51 3.51 3.65
11 4.32 3.51 3.11 2.97 3.38 3.51 3.51 3.65
12 4.32 3.51 2.97 2.97 3.38 3.51 3.51 3.65
13 4.32 3.38 2.97 2.97 3.38 3.51 3.51 3.65
14 4.32 3.38 2.84 2.97 3.38 3.51 3.51 3.65
15 4.32 3.38 2.84 2.97 3.38 3.51 3.51 3.65
16 4.32 3.24 2.70 2.97 3.38 3.51 3.51 3.65

DRAFT ONLY 41 DRAFT ONLY
DR_AS_4055.doc - 28/05/2012 15:05:11
TABLE 5.13
HIP ROOFS AND SIDE WIND ON GABLE ROOFS—
PRESSURE (kPa) ON AREA OF ELEVATION—
LOWER STOREY OF TWO STOREYS
Lower storey of two storeys, 2.4 m storey, 0.3 m floor
Width (m) Roof pitch (degrees)
0 5 10 15 20 25 30 35
Wind direction Wind direction
W W
N6, C4: Wind on side
4 3.92 3.78 3.65 3.51 3.51 3.78 3.92 3.92
5 3.92 3.65 3.51 3.38 3.38 3.78 3.92 3.78
6 3.92 3.65 3.51 3.38 3.38 3.78 3.78 3.78
7 3.92 3.65 3.38 3.24 3.38 3.78 3.78 3.78
8 3.92 3.65 3.38 3.24 3.38 3.78 3.78 3.78
9 3.92 3.51 3.24 3.11 3.38 3.78 3.65 3.78
10 3.92 3.51 3.24 3.11 3.38 3.78 3.65 3.78
11 3.92 3.51 3.24 3.11 3.38 3.78 3.65 3.78
12 3.92 3.38 3.11 3.11 3.38 3.65 3.65 3.78
13 3.92 3.38 3.11 3.11 3.38 3.65 3.65 3.78
14 3.92 3.38 2.97 3.11 3.38 3.65 3.65 3.78
15 3.92 3.38 2.97 3.11 3.38 3.65 3.65 3.78
16 3.92 3.38 2.84 3.11 3.38 3.65 3.65 3.78
Wind direction
W
N6, C4: Wind on end
4 4.32 4.19 4.05 4.05 4.05 4.05 4.05 4.05
5 4.32 4.19 4.05 3.92 3.92 3.92 4.05 4.05
6 4.32 4.19 4.05 3.92 3.92 3.92 4.05 3.92
7 4.32 4.05 3.92 3.92 3.92 3.92 3.92 3.92
8 4.32 4.05 3.92 3.78 3.92 3.92 3.92 3.92
9 4.32 4.05 3.92 3.78 3.92 3.92 3.92 3.92
10 4.32 4.05 3.92 3.78 3.92 3.92 3.92 3.92
11 4.32 4.05 3.78 3.78 3.78 3.92 3.92 3.92
12 4.32 4.05 3.78 3.65 3.78 3.92 3.92 3.92
13 4.32 3.92 3.78 3.65 3.78 3.92 3.78 3.92
14 4.32 3.92 3.65 3.65 3.78 3.92 3.78 3.92
15 4.32 3.92 3.65 3.65 3.78 3.92 3.78 3.92
16 4.32 3.92 3.65 3.65 3.78 3.92 3.78 3.92
DRAFT ONLY 42 DRAFT ONLY
DR_AS_4055.doc - 28/05/2012 15:05:11
APPENDIX A
COMMENTARY
(Informative)
A1 COMMENTARY ON SCOPE AND GENERAL
A1.1 Genereal
This Standard has been derived for houses as a group or large numbers of buildings. In
general, the level of reliability for the group is similar to that found, by applying
AS/NZS 1170.2. However, it is recognized that a correct application of this Standard may
lead to some houses with more conservative design loads, and others with less conservative
design loads.
It is important to categorize each building on a case-by-case basis. Each site should be
assessed individually for its wind classification. Each building must be assessed for
compliance with geometry and for evaluation of pressures.
A1.2 Comment on Clause 1.3—Geometric Limits
The geometric limits presented in Clause 1.3 have been provided to enable some
simplifications to the AS/NZS 1170.2 methods for the most common geometries of housing.
It is intended that 16 m width limit be applied to the width of the tallest section of the
house. For example, in many cases the various sections of a house (that is the basic
rectangular box shapes) may be displaced horizontally with respect to each other. This
could make the overall floor plan dimension greater than the 16 m limit even though none
of the sections of roof might be wider than 16 m.
Such a house should be within the limits provided that none of the roof sections parallel to
the wind direction being considered are greater than 16 m (neglecting the width of eaves).
A2 COMMENT ON TABLE 2.1—WIND CLASSIFICATION
An approximate 50% increase in wind pressures occurs from one class to the next higher
one, that is, N2 to N3, N3 to N4, etc.
Once a particular building site has been classified using the methods set out in Section 2,
the ultimate wind speed for that class represents the design wind speed for the house and
includes the effects of—
(a) the importance level which is set by the BCA (the design wind loading level
associated with housing)
(b) directionality (the likelihood of wind occurring at its maximum from the direction for
which the house is most vulnerable in terms of the pressures on the envelope);
(c) height (of the building above the ground);
(d) terrain roughness (sizes of the obstructions in the wider area around the building site
such as water, grass, open space and size of buildings);
(e) topography (the position of the site on hills or in valleys); and
(f) shielding (the effect of specific buildings and other obstructions near to the proposed
building).
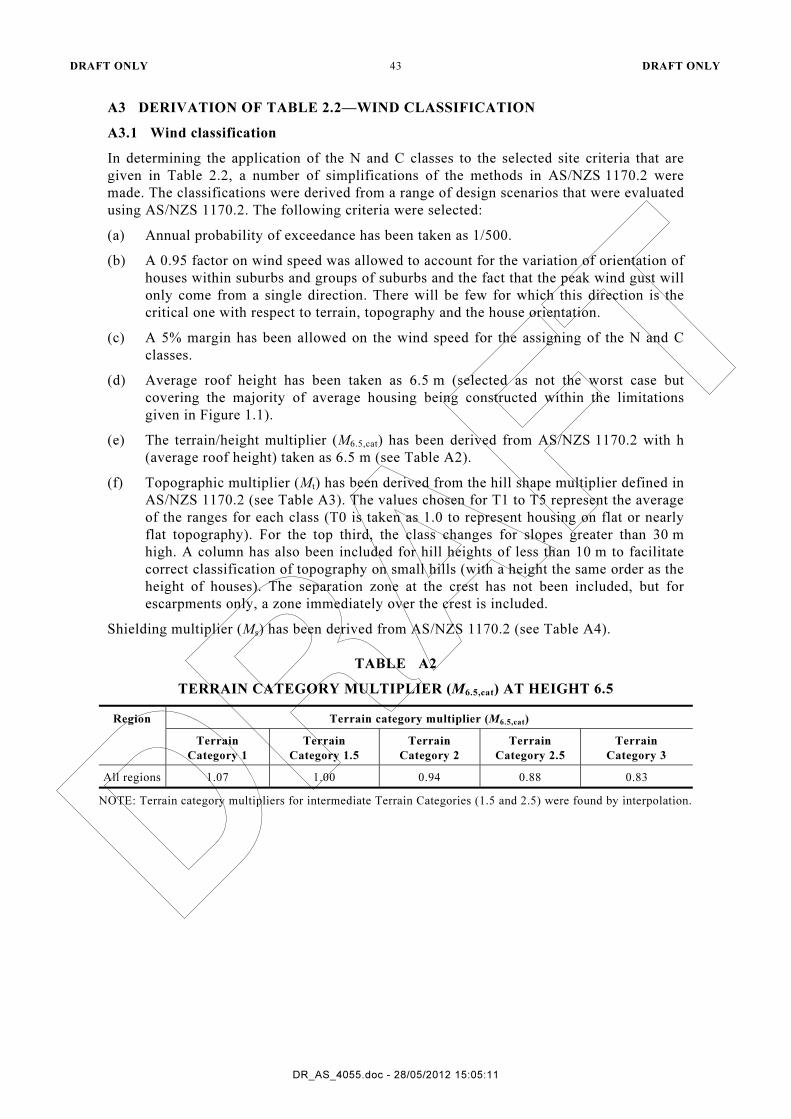
DRAFT ONLY 43 DRAFT ONLY
DR_AS_4055.doc - 28/05/2012 15:05:11
A3 DERIVATION OF TABLE 2.2—WIND CLASSIFICATION
A3.1 Wind classification
In determining the application of the N and C classes to the selected site criteria that are
given in Table 2.2, a number of simplifications of the methods in AS/NZS 1170.2 were
made. The classifications were derived from a range of design scenarios that were evaluated
using AS/NZS 1170.2. The following criteria were selected:
(a) Annual probability of exceedance has been taken as 1/500.
(b) A 0.95 factor on wind speed was allowed to account for the variation of orientation of
houses within suburbs and groups of suburbs and the fact that the peak wind gust will
only come from a single direction. There will be few for which this direction is the
critical one with respect to terrain, topography and the house orientation.
(c) A 5% margin has been allowed on the wind speed for the assigning of the N and C
classes.
(d) Average roof height has been taken as 6.5 m (selected as not the worst case but
covering the majority of average housing being constructed within the limitations
given in Figure 1.1).
(e) The terrain/height multiplier (M6.5,cat) has been derived from AS/NZS 1170.2 with h
(average roof height) taken as 6.5 m (see Table A2).
(f) Topographic multiplier (Mt) has been derived from the hill shape multiplier defined in
AS/NZS 1170.2 (see Table A3). The values chosen for T1 to T5 represent the average
of the ranges for each class (T0 is taken as 1.0 to represent housing on flat or nearly
flat topography). For the top third, the class changes for slopes greater than 30 m
high. A column has also been included for hill heights of less than 10 m to facilitate
correct classification of topography on small hills (with a height the same order as the
height of houses). The separation zone at the crest has not been included, but for
escarpments only, a zone immediately over the crest is included.
Shielding multiplier (Ms) has been derived from AS/NZS 1170.2 (see Table A4).
TABLE A2
TERRAIN CATEGORY MULTIPLIER (M6.5,cat) AT HEIGHT 6.5
Region Terrain category multiplier (M6.5,cat)
Terrain
Category 1
Terrain
Category 1.5
Terrain
Category 2
Terrain
Category 2.5
Terrain
Category 3
All regions 1.07 1.00 0.94 0.88 0.83
NOTE: Terrain category multipliers for intermediate Terrain Categories (1.5 and 2.5) were found by interpolation.
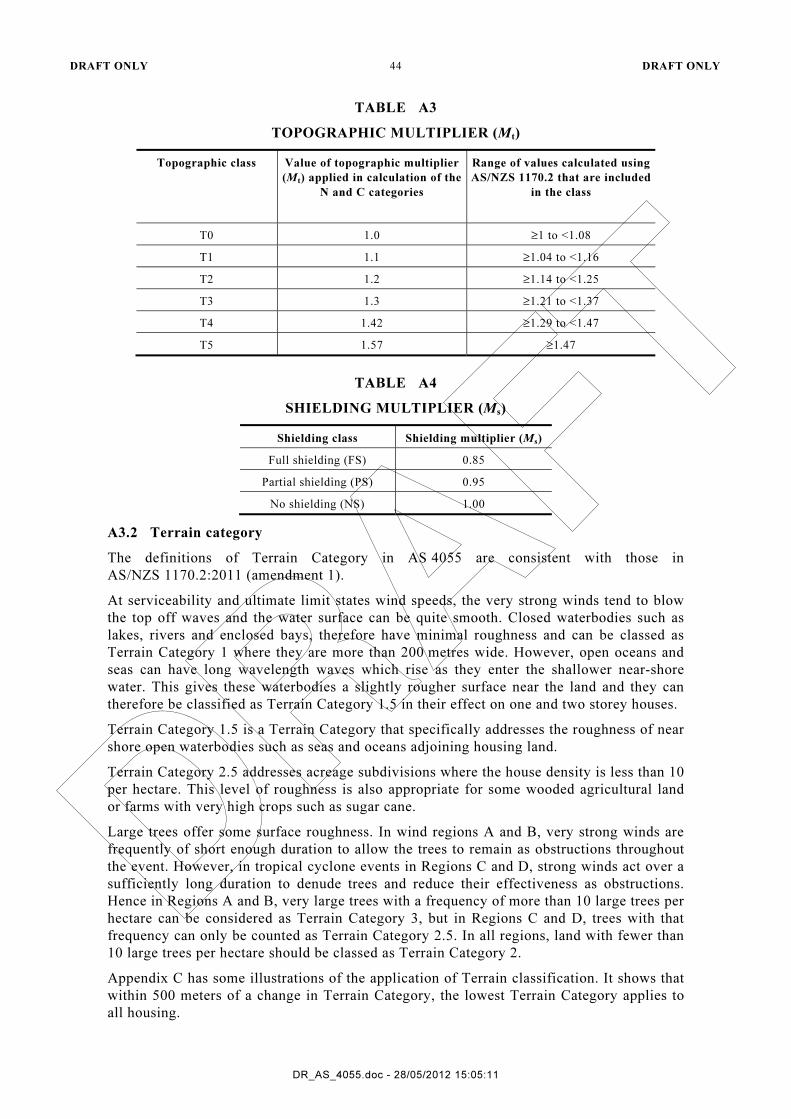
DRAFT ONLY 44 DRAFT ONLY
DR_AS_4055.doc - 28/05/2012 15:05:11
TABLE A3
TOPOGRAPHIC MULTIPLIER (Mt)
Topographic class Value of topographic multiplier
(Mt) applied in calculation of the
N and C categories
Range of values calculated using
AS/NZS 1170.2 that are included
in the class
T0 1.0 ≥1 to <1.08
T1 1.1 ≥1.04 to <1.16
T2 1.2 ≥1.14 to <1.25
T3 1.3 ≥1.21 to <1.37
T4 1.42 ≥1.29 to <1.47
T5 1.57 ≥1.47
TABLE A4
SHIELDING MULTIPLIER (Ms)
Shielding class Shielding multiplier (Ms)
Full shielding (FS) 0.85
Partial shielding (PS) 0.95
No shielding (NS) 1.00
A3.2 Terrain category
The definitions of Terrain Category in AS 4055 are consistent with those in
AS/NZS 1170.2:2011 (amendment 1).
At serviceability and ultimate limit states wind speeds, the very strong winds tend to blow
the top off waves and the water surface can be quite smooth. Closed waterbodies such as
lakes, rivers and enclosed bays, therefore have minimal roughness and can be classed as
Terrain Category 1 where they are more than 200 metres wide. However, open oceans and
seas can have long wavelength waves which rise as they enter the shallower near-shore
water. This gives these waterbodies a slightly rougher surface near the land and they can
therefore be classified as Terrain Category 1.5 in their effect on one and two storey houses.
Terrain Category 1.5 is a Terrain Category that specifically addresses the roughness of near
shore open waterbodies such as seas and oceans adjoining housing land.
Terrain Category 2.5 addresses acreage subdivisions where the house density is less than 10
per hectare. This level of roughness is also appropriate for some wooded agricultural land
or farms with very high crops such as sugar cane.
Large trees offer some surface roughness. In wind regions A and B, very strong winds are
frequently of short enough duration to allow the trees to remain as obstructions throughout
the event. However, in tropical cyclone events in Regions C and D, strong winds act over a
sufficiently long duration to denude trees and reduce their effectiveness as obstructions.
Hence in Regions A and B, very large trees with a frequency of more than 10 large trees per
hectare can be considered as Terrain Category 3, but in Regions C and D, trees with that
frequency can only be counted as Terrain Category 2.5. In all regions, land with fewer than
10 large trees per hectare should be classed as Terrain Category 2.
Appendix C has some illustrations of the application of Terrain classification. It shows that
within 500 meters of a change in Terrain Category, the lowest Terrain Category applies to
all housing.

DRAFT ONLY 45 DRAFT ONLY
DR_AS_4055.doc - 28/05/2012 15:05:11
A3.3 Topographic class
The topographic class in AS 4055 is derived from the topographic multipliers used in
AS/NZS 1170.2 as shown in Table A3.
A3.4 Shielding
In assessing shielding, permanent obstructions of the same size as the house designed with a
frequency of more than 10 per hectare within 100 m of the site, can be considered as
providing full shielding. This means that two full rows of housing are required on all sides
to give permanent shielding. If only one full row of housing is available on one side, then
the site is categorised as Partially Shielded. If there are no shielding obstructions on at least
one side, then it is classified as Not Shielded.
In assessing shielding, a reasonable estimate should be made about infill development in the
next five years, as it is the anticipated development five years after construction that is
assessed.
Consistent with the classification of trees for Terrain Categories, large trees in regions A
and B can be treated as obstructions, but not in regions C and D. This is because the long
duration of the wind events in tropical cyclones can denude the trees and reduce their
effectiveness as obstructions.
A4 COMMENTARY ON PRESSURE COEFFICIENTS (Section 3)
The pressure coefficients given in Section 3 have been based on AS/NZS 1170.2. The
following criteria were used:
(a) The house comprises basically rectangular bluff bodies within the geometric shape
limits given in Clause 1.5.
(b) Roofs are of normal shape (for example, not arched).
(c) Net pressure coefficients comprise the addition of internal and external pressures on
the building envelope.
(d) Pressures include the effects of dominant openings for Regions C and D only.
(e) Pressures include the effects of local high-pressure zones on the leading edges of
surfaces of the building envelope.
The pressure factors given for the 1200 mm zones near corners and near edges of roofs
reflect the local pressures known to occur in these areas of buildings. AS/NZS 1170.2
includes a local pressure factor to account for this effect.
A5 COMMENTARY ON PRESSURES FOR DETERMINATION OF RACKING
FORCES (SECTION 5)
A5.1 General, notation and assumptions
A5.1.1 General
This Paragraph describes how the equivalent pressures tabulated in Section 5 for use with
projected areas, for the calculation of racking loads to be resisted by bracing have been
derived. The methods of determination of equivalent pressures for the calculation of racking
forces in orthogonal directions for single or upper storey, for lower of two storeys and for
subfloor level are given.
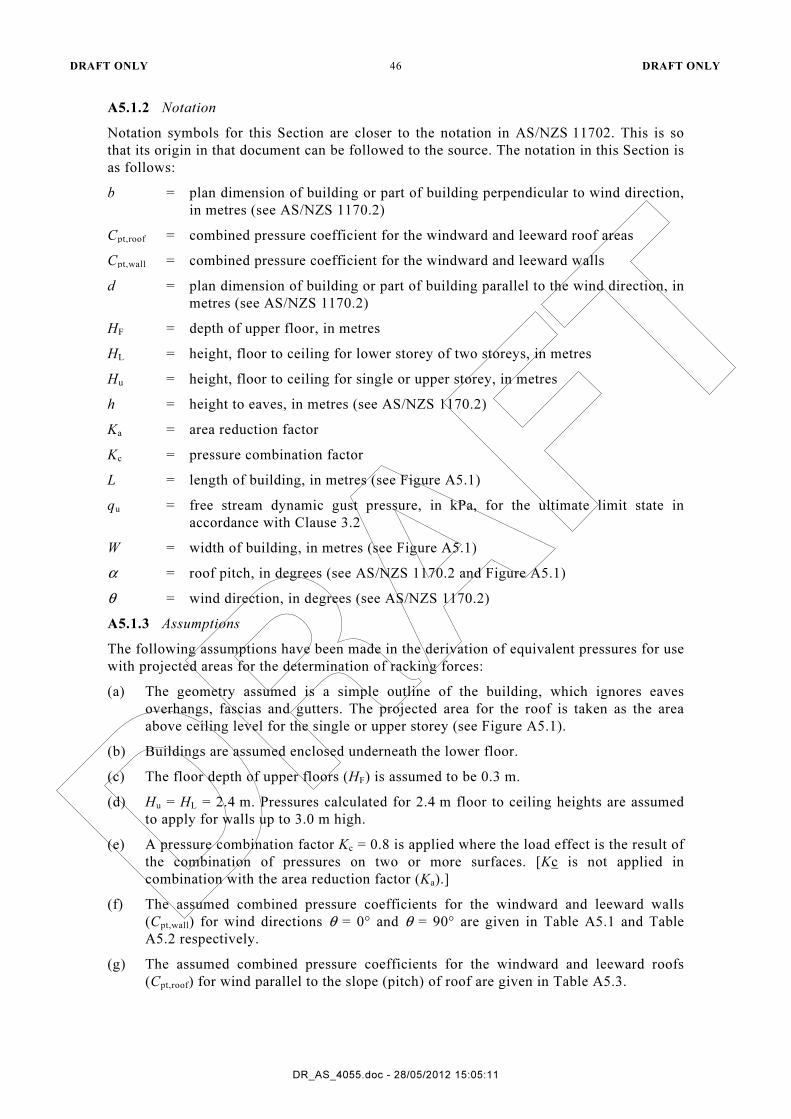
DRAFT ONLY 46 DRAFT ONLY
DR_AS_4055.doc - 28/05/2012 15:05:11
A5.1.2 Notation
Notation symbols for this Section are closer to the notation in AS/NZS 11702. This is so
that its origin in that document can be followed to the source. The notation in this Section is
as follows:
b = plan dimension of building or part of building perpendicular to wind direction,
in metres (see AS/NZS 1170.2)
Cpt,roof = combined pressure coefficient for the windward and leeward roof areas
Cpt,wall = combined pressure coefficient for the windward and leeward walls
d = plan dimension of building or part of building parallel to the wind direction, in
metres (see AS/NZS 1170.2)
HF = depth of upper floor, in metres
HL = height, floor to ceiling for lower storey of two storeys, in metres
Hu = height, floor to ceiling for single or upper storey, in metres
h = height to eaves, in metres (see AS/NZS 1170.2)
Ka = area reduction factor
Kc = pressure combination factor
L = length of building, in metres (see Figure A5.1)
qu = free stream dynamic gust pressure, in kPa, for the ultimate limit state in
accordance with Clause 3.2
W = width of building, in metres (see Figure A5.1)
α = roof pitch, in degrees (see AS/NZS 1170.2 and Figure A5.1)
θ = wind direction, in degrees (see AS/NZS 1170.2)
A5.1.3 Assumptions
The following assumptions have been made in the derivation of equivalent pressures for use
with projected areas for the determination of racking forces:
(a) The geometry assumed is a simple outline of the building, which ignores eaves
overhangs, fascias and gutters. The projected area for the roof is taken as the area
above ceiling level for the single or upper storey (see Figure A5.1).
(b) Buildings are assumed enclosed underneath the lower floor.
(c) The floor depth of upper floors (HF) is assumed to be 0.3 m.
(d) Hu = HL = 2.4 m. Pressures calculated for 2.4 m floor to ceiling heights are assumed
to apply for walls up to 3.0 m high.
(e) A pressure combination factor Kc = 0.8 is applied where the load effect is the result of
the combination of pressures on two or more surfaces. [Kc is not applied in
combination with the area reduction factor (Ka).]
(f) The assumed combined pressure coefficients for the windward and leeward walls
(Cpt,wall) for wind directions θ = 0° and θ = 90° are given in Table A5.1 and Table
A5.2 respectively.
(g) The assumed combined pressure coefficients for the windward and leeward roofs
(Cpt,roof) for wind parallel to the slope (pitch) of roof are given in Table A5.3.
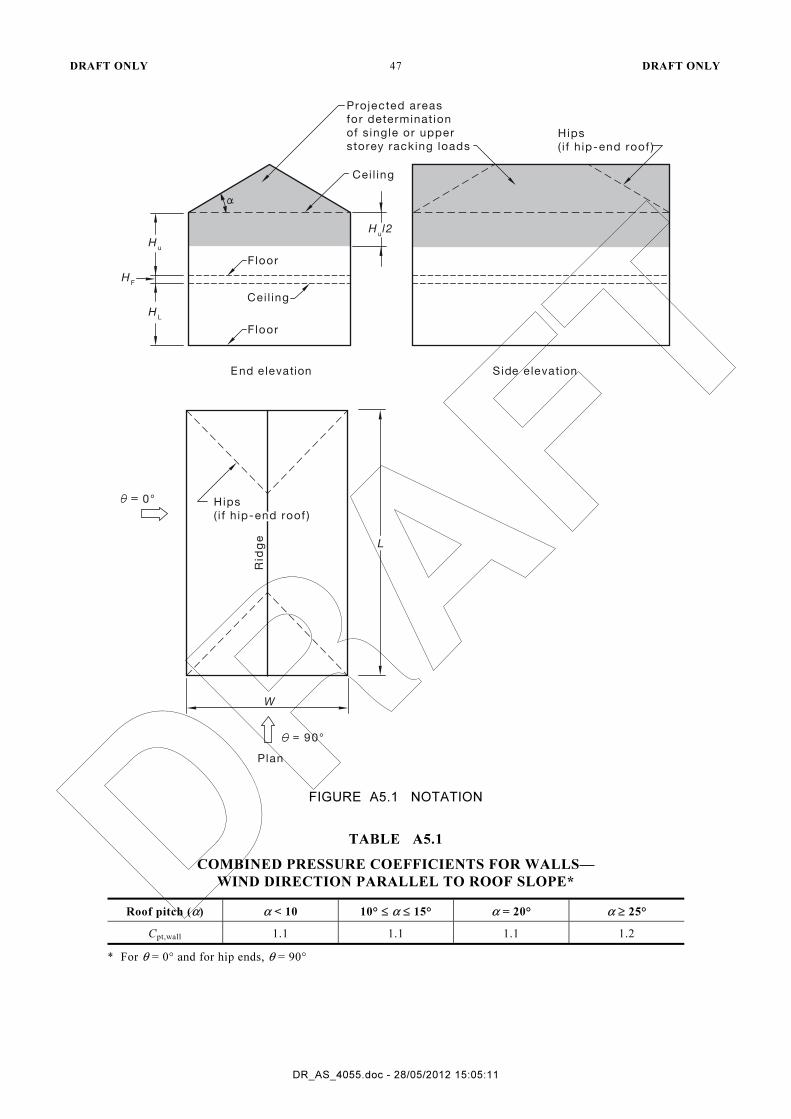
DRAFT ONLY 47 DRAFT ONLY
DR_AS_4055.doc - 28/05/2012 15:05:11
Hips
( i f h ip-end roof )
Hips
( i f h ip-end roof )
Rid
ge L
W
Plan
0°
90°
noitavele ediSnoitavele dnE
Cei l ing
Floor
Floor
Projected areas
for determinat ion
of s ingle or upper
storey racking loads
Hips
( i f h ip-end roof )
Cei l ing
Hu
HL
HF
Hul2
FIGURE A5.1 NOTATION
TABLE A5.1
COMBINED PRESSURE COEFFICIENTS FOR WALLS—
WIND DIRECTION PARALLEL TO ROOF SLOPE*
Roof pitch (α) α < 10 10° ≤ α ≤ 15° α = 20° α ≥ 25°
Cpt,wall 1.1 1.1 1.1 1.2
* For θ = 0° and for hip ends, θ = 90°
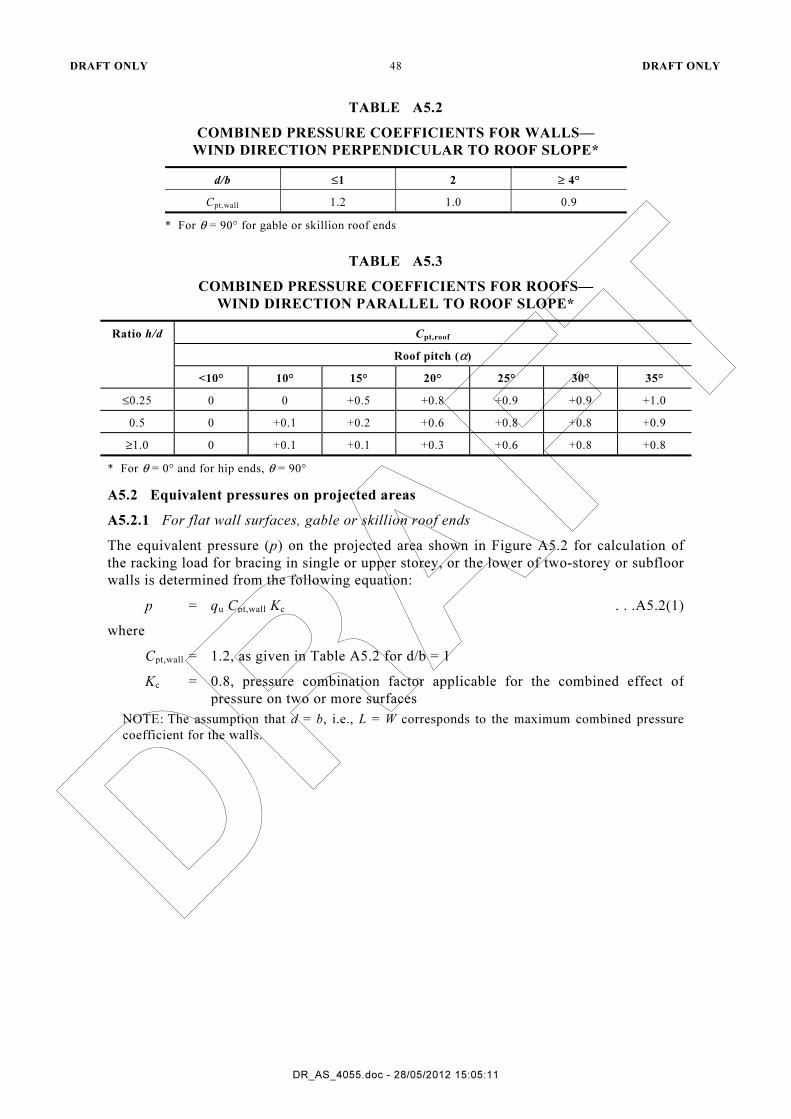
DRAFT ONLY 48 DRAFT ONLY
DR_AS_4055.doc - 28/05/2012 15:05:11
TABLE A5.2
COMBINED PRESSURE COEFFICIENTS FOR WALLS—
WIND DIRECTION PERPENDICULAR TO ROOF SLOPE*
d/b ≤1 2 ≥ 4°
Cpt,wall 1.2 1.0 0.9
* For θ = 90° for gable or skillion roof ends
TABLE A5.3
COMBINED PRESSURE COEFFICIENTS FOR ROOFS—
WIND DIRECTION PARALLEL TO ROOF SLOPE*
Ratio h/d Cpt,roof
Roof pitch (α)
<10° 10° 15° 20° 25° 30° 35°
≤0.25 0 0 +0.5 +0.8 +0.9 +0.9 +1.0
0.5 0 +0.1 +0.2 +0.6 +0.8 +0.8 +0.9
≥1.0 0 +0.1 +0.1 +0.3 +0.6 +0.8 +0.8
* For θ = 0° and for hip ends, θ = 90°
A5.2 Equivalent pressures on projected areas
A5.2.1 For flat wall surfaces, gable or skillion roof ends
The equivalent pressure (p) on the projected area shown in Figure A5.2 for calculation of
the racking load for bracing in single or upper storey, or the lower of two-storey or subfloor
walls is determined from the following equation:
p = qu Cpt,wall Kc . . .A5.2(1)
where
Cpt,wall = 1.2, as given in Table A5.2 for d/b = 1
Kc = 0.8, pressure combination factor applicable for the combined effect of
pressure on two or more surfaces
NOTE: The assumption that d = b, i.e., L = W corresponds to the maximum combined pressure
coefficient for the walls.

DRAFT ONLY 49 DRAFT ONLY
DR_AS_4055.doc - 28/05/2012 15:05:11
Wind direct ion
Wind direct ionWind direct ion
W
W W
WW
W
Wind direct ion
Wind direct ion
Wind direct ion
FIGURE A5.2 FLAT WALL SURFACES—GABLE AND SKILLION ROOF ENDS
A5.2.2 For side elevations, single or upper storey, gable- or hip-ended roofs
The equivalent pressure (p) for the projected areas shown in Figure A5.3 for calculation of
the racking load for bracing in single or upper storey walls is determined from the
following equation:
p = ( ) ( )[ ]( ) ( ) α
αtan22
tan22C
u
roofptwallptcu
//
//,,
WH
WCHKqu
++
. . .A5.2(2)
where
Cpt,wall = value from Table A5.1 for roof pitch, α
Cpt,roof = value from Table A5.3, for roof pitch α, and assuming (h/d) = (Hu/W)
Kc = 0.8, pressure combination factor
NOTES:
1 The assumption that h/d = Hu/W maximizes the assumed combined pressure coefficients for
the roof.
2 The reduction in projected area for hip-ended roofs has been ignored in the determination of
the equivalent pressures to be applied to the projected areas corresponding to either gable- or
hip-ended roofs.
Wind direct ionWind direct ion
W
W
FIGURE A5.3 SIDE ELEVATIONS—SINGLE OR UPPER STOREY—
GABLE- OR HIP-ENDED ROOFS
A5.2.3 Side elevation, lower storey of two storeys or subfloor, gable- or hip-ended roof
The design wind pressure (p) on the projected area shown in Figure A5.4 for calculation of
the racking force for bracing in the lower storey of two-storey walls is determined from the
following equation:
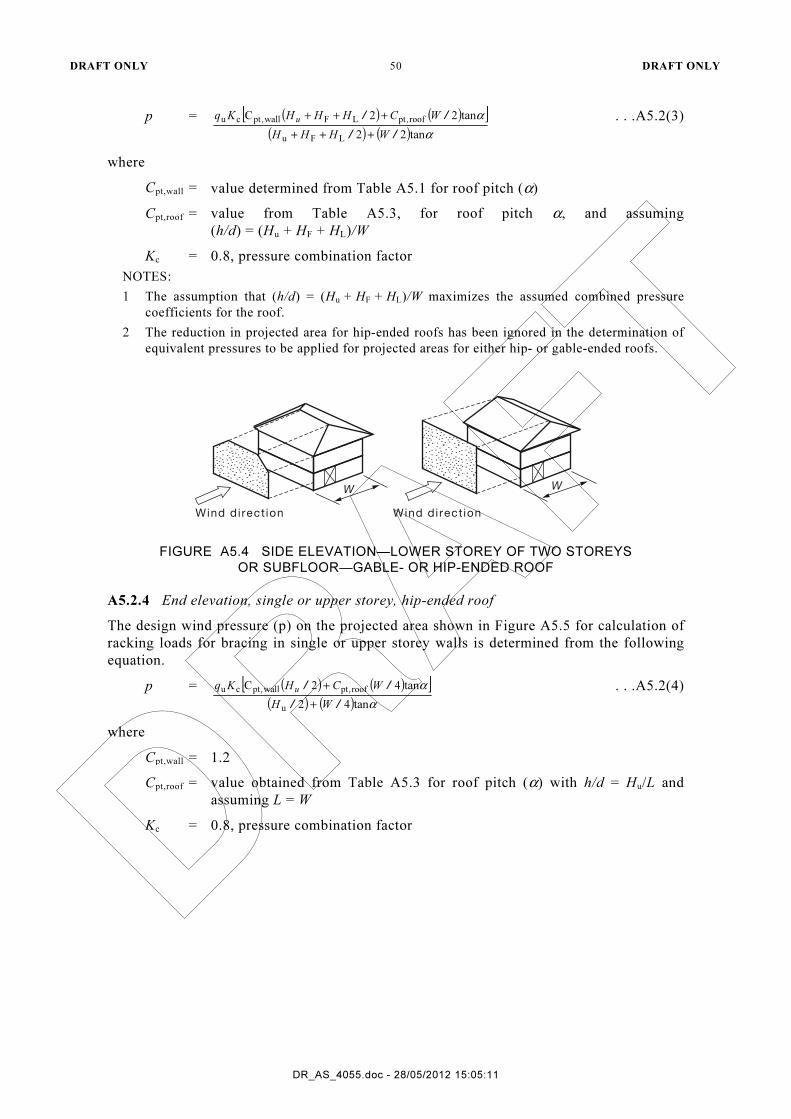
DRAFT ONLY 50 DRAFT ONLY
DR_AS_4055.doc - 28/05/2012 15:05:11
p = ( ) ( )[ ]( ) ( ) α
αtan22
tan22C
LFu
roofptLFwallptcu
//
//,,
WHHH
WCHHHKqu
++++++
. . .A5.2(3)
where
Cpt,wall = value determined from Table A5.1 for roof pitch (α)
Cpt,roof = value from Table A5.3, for roof pitch α, and assuming
(h/d) = (Hu + HF + HL)/W
Kc = 0.8, pressure combination factor
NOTES:
1 The assumption that (h/d) = (Hu + HF + HL)/W maximizes the assumed combined pressure
coefficients for the roof.
2 The reduction in projected area for hip-ended roofs has been ignored in the determination of
equivalent pressures to be applied for projected areas for either hip- or gable-ended roofs.
W W
Wind direct ionWind direct ion
FIGURE A5.4 SIDE ELEVATION—LOWER STOREY OF TWO STOREYS
OR SUBFLOOR—GABLE- OR HIP-ENDED ROOF
A5.2.4 End elevation, single or upper storey, hip-ended roof
The design wind pressure (p) on the projected area shown in Figure A5.5 for calculation of
racking loads for bracing in single or upper storey walls is determined from the following
equation.
p = ( ) ( )[ ]( ) ( ) α
αtan42
tan42C
u
roofptwallptcu
//
//,,
WH
WCHKqu
++
. . .A5.2(4)
where
Cpt,wall = 1.2
Cpt,roof = value obtained from Table A5.3 for roof pitch (α) with h/d = Hu/L and
assuming L = W
Kc = 0.8, pressure combination factor

DRAFT ONLY 51 DRAFT ONLY
DR_AS_4055.doc - 28/05/2012 15:05:11
Wind direct ionW
FIGURE A5.5 END ELEVATION—SINGLE OR UPPER STOREY—HIP-ENDED ROOF
A5.2.5 End elevation, lower storey of two storeys, hip-ended roof
The equivalent pressure (p) on the projected area shown in Figure A5.6 for calculating
racking loads for bracing in walls of the lower storey of two-storey walls is determined
from the following equation:
p = ( ) ( )[ ]( ) ( ) α
αtan42
tan42C
LFu
roofptLFwallptcu
//
//,,
WHHH
WCHHHKqu
++++++
. . .A5.2(5)
where
Cpt,wall = 1.2
Cpt,roof = value from Table A5.3, for roof pitch α, and assuming
(h/d) = (Hu + HF + HL)/L and = 1.5W
Kc = 0.8, pressure combination factor
Wind direct ion
W
FIGURE A5.6 END ELEVATION—LOWER STOREY OF TWO STOREYS—
HIP-ENDED ROOF
A6 CONVERTING WIND SPEEDS
Wind speeds may be approximately converted from metres per second (m/s) to other
commonly reported measures of speed as follows:
1 m/s × 3.6 = 1 km/h.
1 m/s × 1.94 = 1 knot.
1 m/s × 2.24 = 1 mile/h.

DRAFT ONLY 52 DRAFT ONLY
DR_AS_4055.doc - 28/05/2012 15:05:11
APPENDIX B
WORKED EXAMPLE FOR THE DETERMINATION OF TOPOGRAPHIC CLASS
(Informative)
B1 GENERAL
In order to illustrate how to determine the appropriate topographic class, the following two examples are provided:
(a) Houses on an escarpment which relates to Figure B1.
(b) Houses on more complex topography which relates to Figure B2.
(c) Each example has two individual house sites shown to illustrate the use of the
Standard. In practice, the Standard will generally be used for one house site at a time.
B2 HOUSES ON AN ESCARPMENT
Figure B1 shows an escarpment with the slope rising steadily from 20 m to around 120 m at
the top.
The first steps in the process focus on the escarpment and in this case, the section line will
be drawn as close as practical to the site being considered. This is because the slope
anywhere on the side of the escarpment will be much the same and so the slope through the
house sites is of most relevance to the houses.
The later steps (Steps 6 and 7) take into account the location of the house site relative to the
top of the topographic feature.
Step 1 Identify the top of the escarpment: RL 120 m.
Step 2 Identify the bottom of the escarpment: RL 20 m (Bottom of the slope where
the contours spread out indicating a slope of less than 1 in 20 – 10 m contours
around 200 m apart).
Calculate height of the feature as 120 m – 20 m = 100 m.
Step 3 Calculate the mid-height of the escarpment: (120 + 20)/2 = RL 70 m.
Step 4 Identify the steepest slope in the top half of the escarpment:
(a) As shown on Figure B1, the distance across the contours from the top of
the escarpment to the mid height of the escarpment is 380 metres.
(b) Steepest slope of top half of escarpment = (120 – 70)/380 = 0.131
(c) This can be expressed as 1:run by taking the inverse 1/0.131 = 1:7.6 or
as an angle by finding the angle with a tan of 0.131, tan-1 (0.131) = 7.5°
Step 5 Identify the three zones of the escarpment:
(a) Bottom third zone will be below contour 20 + 100 x ⅓ = 53 m
(b) Top third zone will be above contour 20 + 100 x ⅔ = 87 m
(c) Middle third zone will be between contour 53 m and 87 m
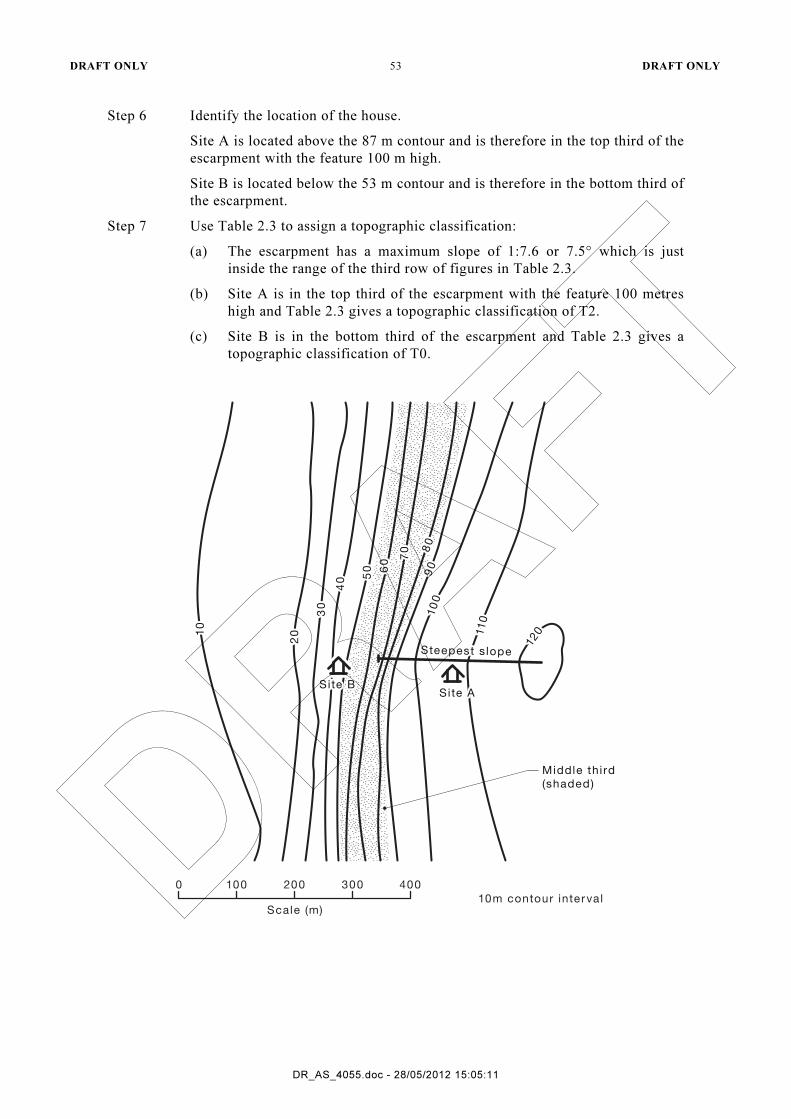
DRAFT ONLY 53 DRAFT ONLY
DR_AS_4055.doc - 28/05/2012 15:05:11
Step 6 Identify the location of the house.
Site A is located above the 87 m contour and is therefore in the top third of the
escarpment with the feature 100 m high.
Site B is located below the 53 m contour and is therefore in the bottom third of
the escarpment.
Step 7 Use Table 2.3 to assign a topographic classification:
(a) The escarpment has a maximum slope of 1:7.6 or 7.5° which is just
inside the range of the third row of figures in Table 2.3.
(b) Site A is in the top third of the escarpment with the feature 100 metres
high and Table 2.3 gives a topographic classification of T2.
(c) Site B is in the bottom third of the escarpment and Table 2.3 gives a
topographic classification of T0.
Scale (m)
0 400300200100
10m contour interval
10
10
S i te BSite BSite ASite A
20
20
30
30
40
40 5
05
0 60
60
70
70 8
08
09
09
01
00
10
0
11
011
0
120
120
Middle third
(shaded)
Steepest s lope Steepest s lope
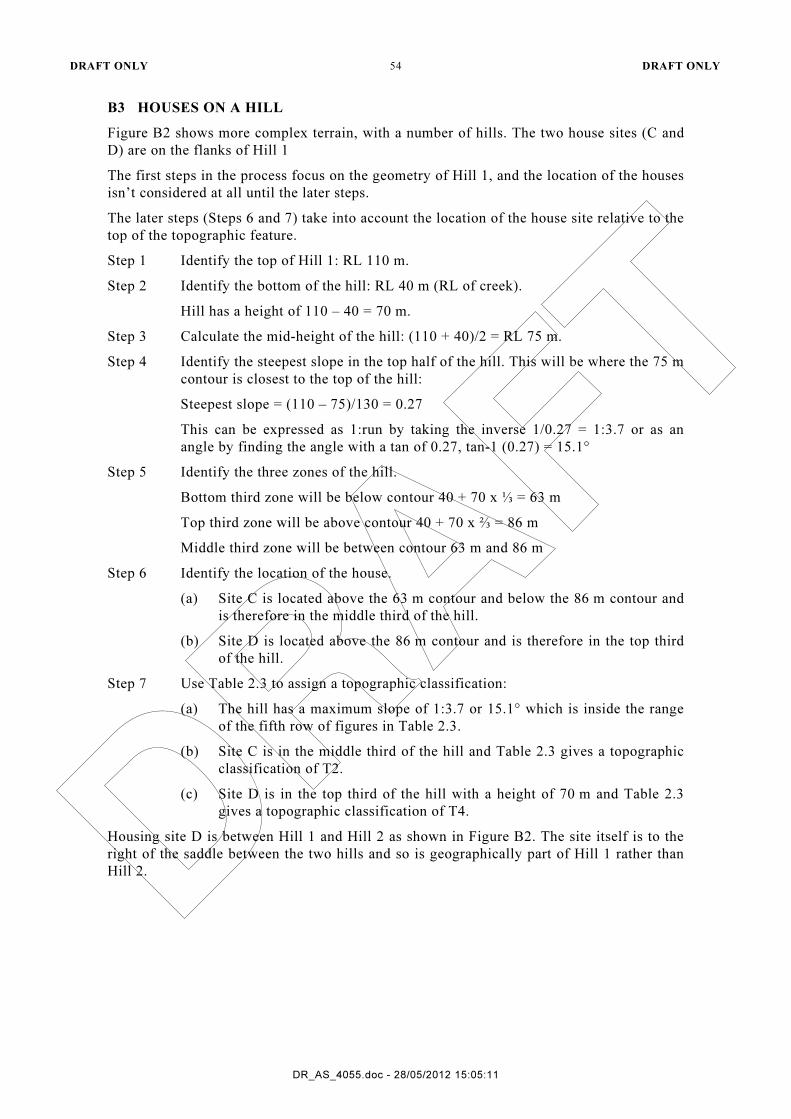
DRAFT ONLY 54 DRAFT ONLY
DR_AS_4055.doc - 28/05/2012 15:05:11
B3 HOUSES ON A HILL
Figure B2 shows more complex terrain, with a number of hills. The two house sites (C and
D) are on the flanks of Hill 1
The first steps in the process focus on the geometry of Hill 1, and the location of the houses
isn’t considered at all until the later steps.
The later steps (Steps 6 and 7) take into account the location of the house site relative to the
top of the topographic feature.
Step 1 Identify the top of Hill 1: RL 110 m.
Step 2 Identify the bottom of the hill: RL 40 m (RL of creek).
Hill has a height of 110 – 40 = 70 m.
Step 3 Calculate the mid-height of the hill: (110 + 40)/2 = RL 75 m.
Step 4 Identify the steepest slope in the top half of the hill. This will be where the 75 m
contour is closest to the top of the hill:
Steepest slope = (110 – 75)/130 = 0.27
This can be expressed as 1:run by taking the inverse 1/0.27 = 1:3.7 or as an
angle by finding the angle with a tan of 0.27, tan-1 (0.27) = 15.1°
Step 5 Identify the three zones of the hill.
Bottom third zone will be below contour 40 + 70 x ⅓ = 63 m
Top third zone will be above contour 40 + 70 x ⅔ = 86 m
Middle third zone will be between contour 63 m and 86 m
Step 6 Identify the location of the house.
(a) Site C is located above the 63 m contour and below the 86 m contour and
is therefore in the middle third of the hill.
(b) Site D is located above the 86 m contour and is therefore in the top third
of the hill.
Step 7 Use Table 2.3 to assign a topographic classification:
(a) The hill has a maximum slope of 1:3.7 or 15.1° which is inside the range
of the fifth row of figures in Table 2.3.
(b) Site C is in the middle third of the hill and Table 2.3 gives a topographic
classification of T2.
(c) Site D is in the top third of the hill with a height of 70 m and Table 2.3
gives a topographic classification of T4.
Housing site D is between Hill 1 and Hill 2 as shown in Figure B2. The site itself is to the
right of the saddle between the two hills and so is geographically part of Hill 1 rather than
Hill 2.
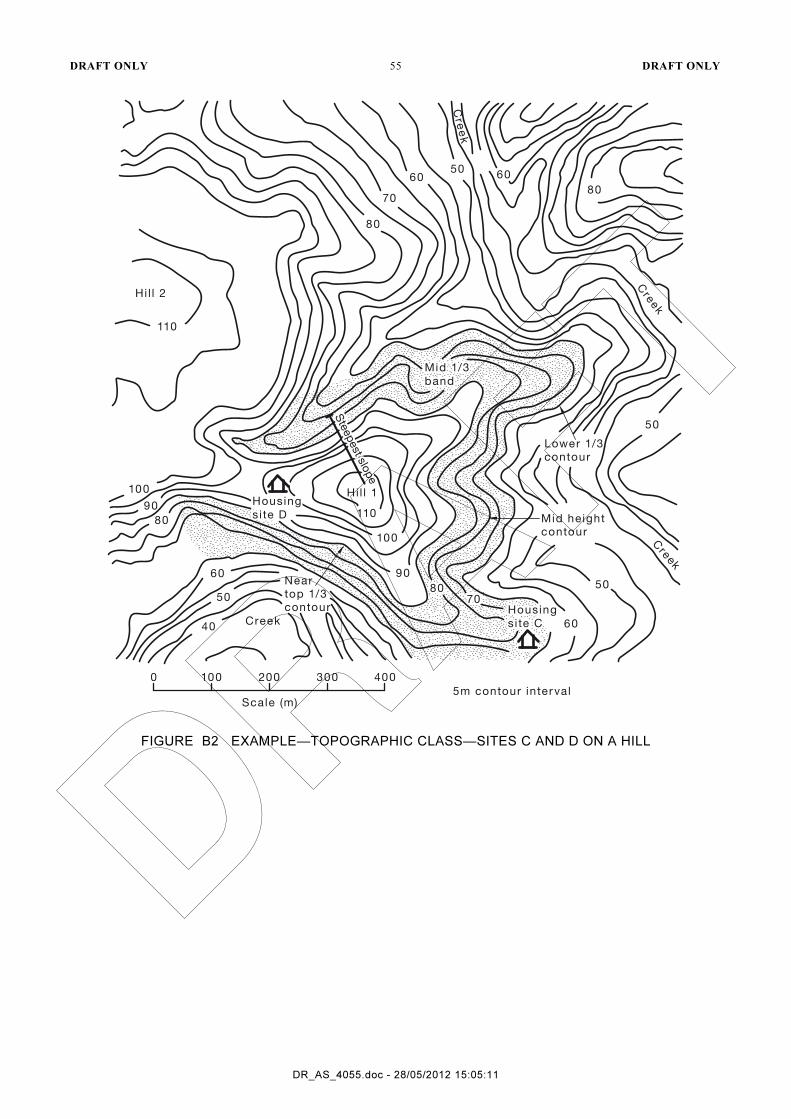
DRAFT ONLY 55 DRAFT ONLY
DR_AS_4055.doc - 28/05/2012 15:05:11
Creek40
50
60
80
90
100Housing
site D
Housing
si te D
Near
top 1/3
contour
Hi l l 2
110
90
100
110
Hi l l 1
80807070
Mid 1/3
band
Mid 1/3
band
80
70
6050
60
Mid height
contour
60
50
Lower 1/3
contour
Cre
ek
50
Cre
ek
Cre
ek
80
Scale (m)
0 400300200100
5m contour interval
Ste
epest slo
pe
Ste
epest slo
pe
Housing
site C
Housing
si te C
FIGURE B2 EXAMPLE—TOPOGRAPHIC CLASS—SITES C AND D ON A HILL
DRAFT ONLY 56 DRAFT ONLY
DR_AS_4055.doc - 28/05/2012 15:05:11
APPENDIX C
WORKED EXAMPLES FOR THE SELECTION OF TERRAIN CATEGORY AND SHIELDING CLASS
(Informative)
The typical surface roughness types encountered in an urban area are represented in Table
C1, and in outer suburban areas in Table C2. These examples are provided to assist in the
selection of terrain categories and shielding classes of particular sites.
In conjunction with deriving the correct topographic class from Table 2.3, the terrain
category and shielding class selected for each site are applied to Table 2.2 for the
appropriate geographic region to determine the rationalized wind class for the design of
houses or structures.
The following examples are provided.
Example A:
The house at Location A, shown in Table C1, is sited in the second row of houses facing
open water such as an ocean or larger bay. The site may be thought of as a part of suburbia,
but the terrain and shielding are classified as follows:
(a) A 500 m radius circle centred on the house site will take in some of the open water.
The smoothest terrain within the circle will be the water with a Terrain Category (TC)
of 1.5. Here the water is given TC1.5 as it is open water. (Had the water been in an
enclosed bay or lake, it would have been TC 1.)
(b) For shielding, this site has at least one side (the side facing the water) which has only
one row of houses that can be regarded as shielding. It is therefore classified as
Partially Shielded (PS). Even though there may have been three sides of the site that
had many rows of houses, it is the side with the least shielding that dictates the
shielding class.
The terrain category of the site is therefore TC1.5 and the shielding class PS.
Note that houses must be more than 500 m from the ocean shore before the site can be
classed as TC 3.
Example B:
The house at Location B, shown in Table C1, is sited more than two rows back from the
edge of a very large area of parkland. While the house is surrounded by normal suburban
housing, the terrain and shielding are classified as follows:
(a) A 500 m radius circle centred on the house site will take in some of the large park.
The smoothest terrain within the circle will be the open terrain of the park with a
Terrain Category (TC) of 2.
(b) For shielding, this site has all sides with at least two rows of houses that can be
regarded as shielding. It is therefore classified as Fully Shielded (FS).
The terrain category of the site is therefore TC2 and the shielding class FS.
Note that sites must be more than 500 m from the park before they can be classed as TC 3.
DRAFT ONLY 57 DRAFT ONLY
DR_AS_4055.doc - 28/05/2012 15:05:11
Example C:
The house at Location C, shown in Table C2, is sited immediately adjacent to a small park
with a width of 150 m, but an area of less than 250000 m2. Because the park is relatively
small, the house is still regarded as being within normal suburbia.
(a) A 500 m radius circle centred on the house site will take in the small park, but it is
too small (<250000 m2) to allow the wind to speed up as it passes over. The Standard
ignores small parks in classifying terrain. The smoothest terrain within the circle will
therefore be the suburban housing with a Terrain Category (TC) of 3.
(b) For shielding, this site has at least one side with no houses that can be regarded as
shielding (the side facing the small park). It is therefore classified as Not Shielded
(NS).
The terrain category of the site is therefore TC3 and the shielding class NS.
Note that the small park in this case was big enough to affect the shielding (more than
100 m wide), but small enough not to affect the terrain roughness (less than 200 m wide).
Example D:
The house site at Location D, shown in Table C2, is to be sited within an acreage
development with fewer than 10 houses per hectare anticipating development in five years
time.
(a) A 500 m radius circle centred on the house site will take in the acreage development
and some nearby suburban housing. The smoothest terrain within the circle will be
the acreage development with a Terrain Category (TC) of 2.5.
(b) For shielding, this site will have houses on all sides, but as they are sparse, it is
therefore classified as Partially Shielded (PS).
The terrain category of the site is therefore TC2.5 and the shielding class PS.
Note that the first row of housing in the normal suburban development has some shielding
on the side of the acreage development, so even though it is the first row of suburbia, it
takes the same shielding as the acreage development.

DR
_A
S_
40
55
.do
c - 2
8/0
5/2
01
2 1
5:0
5:1
1
58
D
RA
FT
ON
LY
D
RA
FT
ON
LY
TABLE C1
TERRAIN CATEGORY AND SHIELDING CLASSIFICATION FOR REGIONS A AND B
EXAMPLE WHERE THERE IS OPEN WATER, SUBURBAN
HOUSING AND A LARGE PARK
Description
Ocean Waterfront suburbia
Location A
Residential suburbia
Location B
Large Park > 250,000 m2
Surface roughness
Open Water (TC1.5)
Houses >10 per hectare (TC3)
Scattered trees (TC2)
Design TC for
houses in this area N/A 500 m
TC1.5 TC3
500 m
TC2 N/A
Shielding for houses
in this area N/A
1st row NS
2nd row PS FS FS FS 2nd row PS 1st row NS N/A
Design Criteria for
houses in this area N/A
TC1.5, NS
TC1.5, PS TC1.5, FS TC3, FS TC2, FS TC2, PS TC2, NS N/A
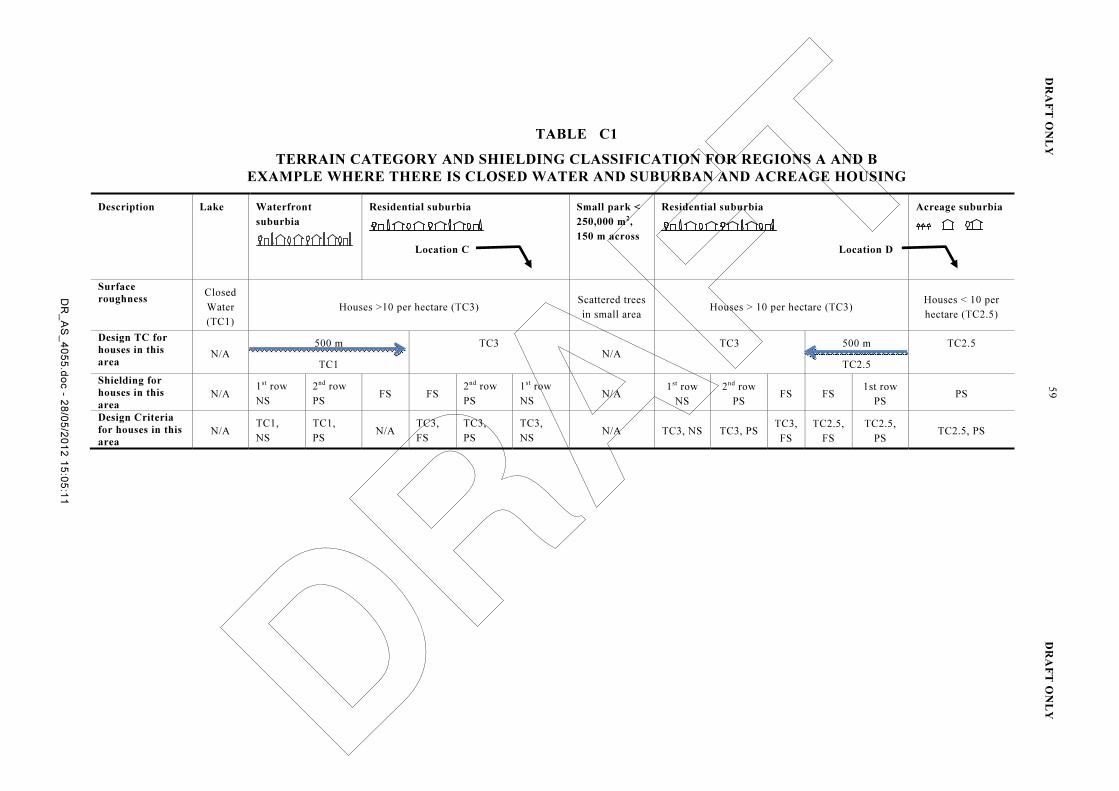
DR
_A
S_
40
55
.do
c - 2
8/0
5/2
01
2 1
5:0
5:1
1
59
D
RA
FT
ON
LY
D
RA
FT
ON
LY
TABLE C1
TERRAIN CATEGORY AND SHIELDING CLASSIFICATION FOR REGIONS A AND B
EXAMPLE WHERE THERE IS CLOSED WATER AND SUBURBAN AND ACREAGE HOUSING
Description Lake Waterfront
suburbia
Residential suburbia
Location C
Small park <
250,000 m2,
150 m across
Residential suburbia
Location D
Acreage suburbia
Surface
roughness Closed
Water
(TC1)
Houses >10 per hectare (TC3) Scattered trees
in small area Houses > 10 per hectare (TC3)
Houses < 10 per
hectare (TC2.5)
Design TC for
houses in this
area N/A
500 m
TC1
TC3 N/A
TC3 500 m
TC2.5
TC2.5
Shielding for
houses in this
area N/A
1st row
NS
2nd row
PS FS FS
2nd row
PS
1st row
NS N/A
1st row
NS
2nd row
PS FS FS
1st row
PS PS
Design Criteria
for houses in this
area N/A
TC1,
NS
TC1,
PS N/A
TC3,
FS
TC3,
PS
TC3,
NS N/A TC3, NS TC3, PS
TC3,
FS
TC2.5,
FS
TC2.5,
PS TC2.5, PS

DRAFT ONLY 60 DRAFT ONLY
DR_AS_4055.doc - 28/05/2012 15:05:11
APPENDIX D
WORKED EXAMPLE FOR RACKING FORCES
(Informative)
The example given in this Appendix, using ultimate limit states design, illustrates the
method of determining racking forces on a two-storey house located in Region B, Terrain
Category 2.5, having partial shielding and a topographic class T2.
For the example, assume that the house is 16 m long, 8 m wide and has a 17.5° pitched,
gable-end roof.
Step 1 From Table 2.2 (for Region B, TC2.5, T2 and PS) the wind class is N4.
Step 2 Calculate the upper storey racking for wind normal to ridge.
From Table 5.8, for W = 8 m and roof slope = 17.5°, the pressure for wind on
side are determined: (1.2 + 1.4)/2 = 1.3.
Determine area on which the pressure is to be applied and multiply the area by
the pressure to give the racking force in kN. Provide bracing appropriate to
resist this force.
Step 3 Calculate the upper storey racking for wind parallel to ridge (wind on end).
From Table 5.8, for W = 8 m and roof slope = 17.5°, the pressure for wind on
side are determined: (1.6 + 1.7)/2 = 1.65.
Determine area on which the pressure is to be applied and multiply the area by
the pressure to give the racking force in kN. Provide bracing appropriate to
resist this force.
Step 4 Calculate lower storey racking for wind normal to ridge.
From Table 5.9, for W = 8 m and roof slope = 17.5°, the pressure for wind on
side are determined: (1.6 + 1.7)/2 = 1.65.
Determine area on which the pressure is to be applied and multiply the area by
the pressure to give the racking force in kN. Provide bracing appropriate to
resist this force.
Step 5 Calculate lower storey racking for wind parallel to ridge (wind on end).
From Table 5.9, for W = 8 m and roof slope = 17.5°, the pressure for wind on
side are determined: (1.9 + 2.0)/2 = 1.95.
Determine area on which the pressure is to be applied and multiply the area by
the pressure to give the racking force in kN. Provide bracing appropriate to
resist this force.
*** END OF DRAFT ***
PREPARATION OF AUSTRALIAN STANDARDS
Australian Standards are prepared by a consensus process involving representatives
nominated by organizations drawn from all major interests associated with the subject.
Australian Standards may be derived from existing industry Standards, from established
international Standards and practices or may be developed within a Standards Australia
technical committee.
During the development process, Australian Standards are made available in draft form at
all sales offices and through affiliated overseas bodies in order that all interests concerned
with the application of a proposed Standard are given the opportunity to submit views on
the requirements to be included.
The following interests are represented on the committee responsible for this draft
Australian Standard:
Australian Building Codes Board
Australian Window Association
Concrete Masonry Association of Australia
Cyclone Testing Station
Engineers Australia
Forest and Wood Products Australia
Housing Industry Association
Masters Builder Association
Roofing Tile Association of Australia
Think Brick Australia

Standards Australia
Standards Australia is an independent company, limited by guarantee, which prepares and publishes
most of the voluntary technical and commercial standards used in Australia. These standards are
developed through an open process of consultation and consensus, in which all interested parties are
invited to participate. Through a Memorandum of Understanding with the Commonwealth government,
Standards Australia is recognized as Australia’s peak national standards body.
Australian Standards
Australian Standards are prepared by committees of experts from industry, governments, consumers
and other relevant sectors. The requirements or recommendations contained in published Standards are
a consensus of the views of representative interests and also take account of comments received from
other sources. They reflect the latest scientific and industry experience. Australian Standards are kept
under continuous review after publication and are updated regularly to take account of changing
technology.
International Involvement
Standards Australia is responsible for ensuring that the Australian viewpoint is considered in the
formulation of international Standards and that the latest international experience is incorporated in
national Standards. This role is vital in assisting local industry to compete in international markets.
Standards Australia represents Australia at both ISO (The International Organization
for Standardization) and the International Electrotechnical Commission (IEC).
Electronic Standards
All Australian Standards are available in electronic editions, either downloaded individually from SAI
Global, or via on-line and CD ROM subscription services. For more information phone 131 242 or visit
www.saiglobal.com/shop


