
Property Efficiency Report This report demonstrates the Western Cape Government’s commitment to
managing and improving the efficiency, effectiveness and sustainability of its property holdings.

Contents
FOREWORD 2
Robin Carlisle, Minister of Transport and Public Works 2
Gary Fisher, Head of Provincial Public Works 3
EXECUTIVE SUMMARY 4
CHAPTER 1: ABOUT THIS REPORT 5
The Reporting Period 5
The Size and Cost of the WCG Property Portfolio 5
The Office Portfolio 6
Management of the WCG’s Property Portfolio 6
Management Information 7
IPD Occupiers 7
Case Study 1: The WCG Building Audit 8
Case Study 2: Improving the UK Government Estate through Measurement and Benchmarking 9
Case Study 3: Benchmarking Initiatives to Improve the Management of Healthcare Facilities 10
CHAPTER 2: PERFORMANCE MEASUREMENT 11
Office Efficiency: Cost per FTE 11
Space Utilisation 12
Case Study 4: The Face of the Province Project 13
Case Study 5: Modernisation of WCG Offices in the Cape Town CBD 15
Cost per Square Metre 16
Measuring Performance in Schools 16
Case Study 6: Improving Efficiencies through Public Private Partnerships 17
CHAPTER 3: SUSTAINABILITY 18
An Introduction to Sustainability 18
Performance 19
Case Study 7: Investigating Environmental Performance in Western Cape Schools 20
Supporting Travel SMART 21
Creating an Energy Saving Culture 21
CHAPTER 4 – FORWARD LOOK 22
Performance Measurement 22
Strategic Asset Management 22
APPENDIX 23
Offices 23
Schools 23
GLOSSARY 24

here. We will therefore no longer have a property budget that
is asset rich but cash poor; rather a budget that has a better
balance between asset worth and cash generation.
We have already started to make these improvements in public
projects that have been completed recently, are underway or are
planned, including three significant public private partnership
regeneration projects, a number of sustainability initiatives and
the refurbishment of parts of 4 and 9 Dorp Street. However,
when we compare the performance of our buildings to corporate
occupiers in South Africa, it is clear that there is much more that
needs to be done and that we need to go further and faster in
improving our existing infrastructure and facilities in order to
make savings that will be re-invested to benefit the community.
We will not be able to achieve this unless we can measure how
the portfolio is performing now and how it can be improved,
set targets for making these improvements and by when, and
monitor the progress towards making those improvements.
This report sets us on the journey to do this, using data
predominantly from the office portfolio. It proves the value
of property performance measurement and benchmarking,
establishes a baseline and allows us to set improvement targets.
Subsequent annual reports will cover more of the portfolio
providing a larger set of performance data.
I am very proud to announce that this is the first time that any
provincial government in South Africa has issued a report that
measures its property asset management performance in this way
and which puts in place the basis for modernising that portfolio
in order to deliver significant benefits for the community. My
congratulations and thanks go to Gary Fisher and his team for
this very important achievement.
Robin Carlisle, Minister of Transport and Public Works
Property is the Western Cape
Government’s second most
expensive and valuable asset
after its staff. Our portfolio of
buildings has a replacement
value of more than R80 billion.
We therefore have to ensure
that we maximise the use we
make of it, and that we manage
our buildings in the most efficient, effective and sustainable
way possible. Our use of property impacts on the services
we provide, and the development of efficient and effective
workplace environments also contributes positively to staff
performance and productivity.
Our property therefore needs to be the most efficient and
sustainable possible and the facilities need to be the best
possible for the public who use them and the employees who
work in them. My ambition is to make our buildings among
the best in the world in line with our objective to become the
most strategic, sustainable and effective regional government
in the world. I want to see asset management delivered as a
centre of excellence in South Africa and to see this recognised
internationally.
My goal is to make significant savings in the cost of running the
portfolio that will be re-invested in services that most benefit
our taxpayers and citizens. Savings of 10% or more have
already been achieved by some other countries including the
United Kingdom, and should be achievable if not exceeded
Foreword
2
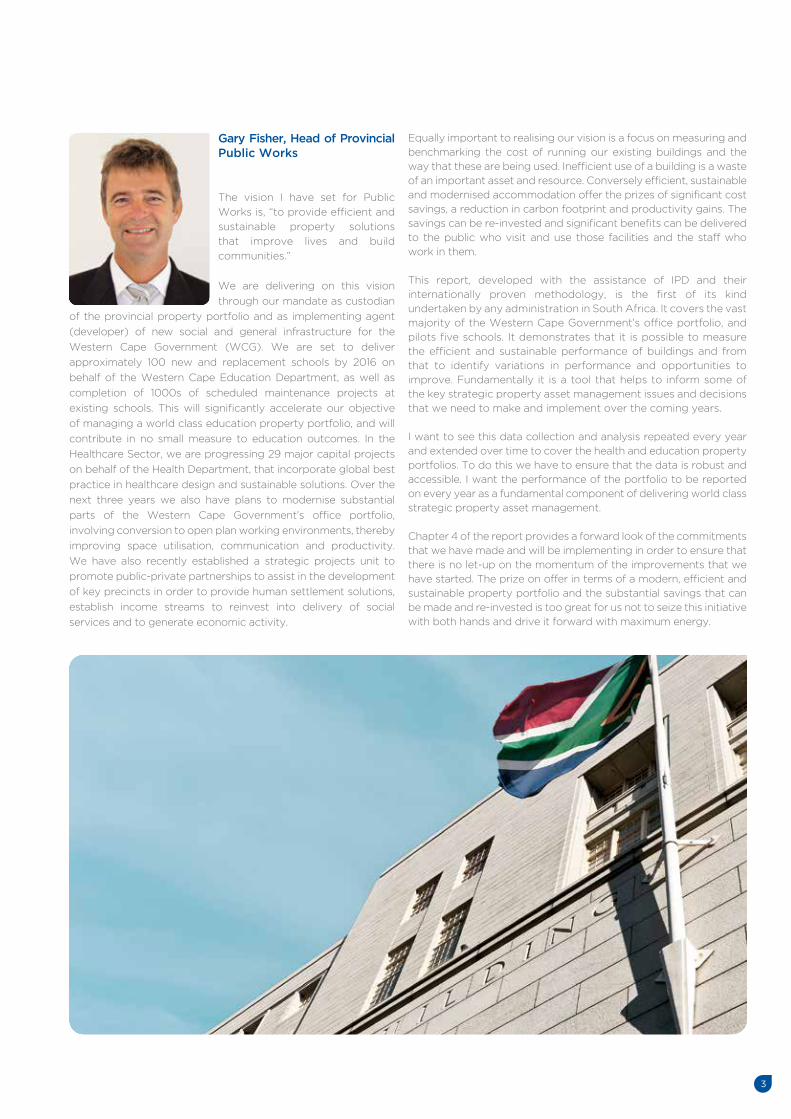
Gary Fisher, Head of Provincial Public Works
The vision I have set for Public
Works is, “to provide efficient and
sustainable property solutions
that improve lives and build
communities.”
We are delivering on this vision
through our mandate as custodian
of the provincial property portfolio and as implementing agent
(developer) of new social and general infrastructure for the
Western Cape Government (WCG). We are set to deliver
approximately 100 new and replacement schools by 2016 on
behalf of the Western Cape Education Department, as well as
completion of 1000s of scheduled maintenance projects at
existing schools. This will significantly accelerate our objective
of managing a world class education property portfolio, and will
contribute in no small measure to education outcomes. In the
Healthcare Sector, we are progressing 29 major capital projects
on behalf of the Health Department, that incorporate global best
practice in healthcare design and sustainable solutions. Over the
next three years we also have plans to modernise substantial
parts of the Western Cape Government’s office portfolio,
involving conversion to open plan working environments, thereby
improving space utilisation, communication and productivity.
We have also recently established a strategic projects unit to
promote public-private partnerships to assist in the development
of key precincts in order to provide human settlement solutions,
establish income streams to reinvest into delivery of social
services and to generate economic activity.
3
Equally important to realising our vision is a focus on measuring and
benchmarking the cost of running our existing buildings and the
way that these are being used. Inefficient use of a building is a waste
of an important asset and resource. Conversely efficient, sustainable
and modernised accommodation offer the prizes of significant cost
savings, a reduction in carbon footprint and productivity gains. The
savings can be re-invested and significant benefits can be delivered
to the public who visit and use those facilities and the staff who
work in them.
This report, developed with the assistance of IPD and their
internationally proven methodology, is the first of its kind
undertaken by any administration in South Africa. It covers the vast
majority of the Western Cape Government’s office portfolio, and
pilots five schools. It demonstrates that it is possible to measure
the efficient and sustainable performance of buildings and from
that to identify variations in performance and opportunities to
improve. Fundamentally it is a tool that helps to inform some of
the key strategic property asset management issues and decisions
that we need to make and implement over the coming years.
I want to see this data collection and analysis repeated every year
and extended over time to cover the health and education property
portfolios. To do this we have to ensure that the data is robust and
accessible. I want the performance of the portfolio to be reported
on every year as a fundamental component of delivering world class
strategic property asset management.
Chapter 4 of the report provides a forward look of the commitments
that we have made and will be implementing in order to ensure that
there is no let-up on the momentum of the improvements that we
have started. The prize on offer in terms of a modern, efficient and
sustainable property portfolio and the substantial savings that can
be made and re-invested is too great for us not to seize this initiative
with both hands and drive it forward with maximum energy.

This report, the first of its kind produced by an admin-
istration in South Africa, demonstrates the Western Cape
Government’s commitment to managing and improving
the effectiveness of its property portfolio to enhance the
lives and well-being of every citizen.
The report summarises the findings of an investigation
into the efficiency and sustainability performance of a
portfolio of provincial government buildings including 18
offices, predominantly in the Cape Town CBD, and a pilot
study of 5 schools across the Province.
The report draws on baseline data collected by the
Department of Transport and Public Works (the
Department) as part of an on-going audit and condition
survey of the entire provincial portfolio. The data was
analysed with the assistance of IPD.
The analysis indicates that on a cost per square metre basis,
the average performance of the WCG office holdings is
largely on a par with South African corporate occupiers.
However, when factoring in the efficiency of occupation,
a cost of R46,000/Full Time Employee (FTE) indicates
that substantial potential savings are possible. The current
cost/FTE is 54% above the South African corporate office
occupier average.
The average office space usage of the WCG is 28 m2/FTE.
This is significantly less efficient than the 14m2 reported by
South African corporate occupiers. Occupancy is also well
in excess of the Government’s new workplace standard of
15 m2/FTE.
Within the portfolio there are wide variations in performance.
Some offices perform considerably better than others. The
most space inefficient department uses over 40 m2/FTE in
contrast to the most efficient departments which operate
with less than 20 m2/FTE.
In an effort to deliver an environmentally sustainable portfolio,
monitoring and reducing energy and water consumption
across the WCG holdings is an equally important consideration
to the Department. This focus on understanding consumption
will make a significant contribution to the WCG achieving its
carbon emissions targets.
Average energy consumption per FTE across the WCG
offices stands at around 6,474 kWh/FTE, above the current
corporate office occupier performance of close to 4,300
kWh/FTE. Average water consumption per FTE stands at
14.6m3, again above the office benchmark average of 9,3m3.
The report identifies potential sources available to the
Department to realise savings. Rationalising the WCG’s
office accommodation by implementing the 15 m2/FTE
space standard will deliver significant savings. In addition,
considerable savings can be achieved through improved
sustainability performance. Better data will help target
future actions for improvement.
In order to deliver efficiencies in the medium term and
realise the full potential savings, the Department is likely to
have to make up-front investments in its properties that will
allow it to build and move to more efficient holdings.
The Department is embarking on an ambitious programme
to realise these savings with clear commitments and actions
over the next twelve months and subsequently. These
include: -
Introducing standards for the cost per person, cost per
m2, consumption of utilities, and the effectiveness and
productivity of the working environment;
Improving property performance monitoring and
benchmarking as an integral part of strategic
management of the provincial property portfolio;
Reporting annually on the progress being made on
achieving efficient, sustainable and effective buildings;
and
Undertaking a strategic review of its property portfolio,
starting with the General Infrastructure portfolio that
will examine the scope for rationalising and reducing
the number of buildings and for greater co-location in
buildings.
Executive Summary
4

Chapter 1: About this Report
This paper reports on the efficiency, effectiveness and environmental performance of 18 WCG offices and a portfolio of 5 schools.
The report establishes a baseline for future performance reporting and sets out a process for standardised performance measurement.
The report underpins the WCG’s obligations and commitment to ensure that it manages its property portfolio in an efficient and sustainable manner, providing facilities that are fit-for-purpose benefiting citizens and those who work in them.
The data used in this report has been drawn from baseline information collected as part of an on-going audit and condition survey of the entire provincial property portfolio. The information has been analysed with the assistance of IPD to identify performance in terms of cost, utilisation and sustainability.
The report finds that there is significant scope for the Provincial property portfolio to be used more efficiently and effectively and identifies opportunities for generating considerable savings to be re-invested for the benefit of the community.
It is intended that future annual reports will begin to cover the performance of the Health and Education
property portfolios.
Education
Health
General Infrastructure
WCG Portfolio
1,631
221
104
1,956
5,300,000
1,500,000
525,000
7,325,00
R53 bn
R19,8 bn
R7,3 bn
R80,1 bn
Capital
Replacement Value
Construction
Area (m2)
Number
of Facilities
Figure 1.1
Estimated size of WCG portfolio
5
This is the WCG’s first annual report measuring the efficiency,
effectiveness and sustainability performance of its property
portfolio. It demonstrates the Department’s commitment
to safeguard and enhance the WCG’s property holdings for
the benefit and well-being of all the citizens of the province.
The Reporting Period
This report examines the performance of a provincial office
and education portfolio for the financial year 2011/2012 and
is based on information as at 31 March 2012.
The Size and Cost of the WCG Property Portfolio
The WCG’s property portfolio covers a wide range of
assets and liabilities, comprising properties registered in the
name of, or vesting in the Provincial Government, leased
properties, sites reserved for roads and unutilised road
reserves.
The portfolio consists of a diverse range of assets including
offices, schools and health facilities; reflecting the wide
spread of functions the government supports. The main
source of assets and liabilities is shown in Table 1.1.
Source: GAPP Architects & Planners, Talani Quantity Surveyors (Pty) Ltd and GIBB Engineering. May 2013.

The replacement value of the WCGs property portfolio is estimated at R80,1 billion. The estimated annual cost of managing the portfolio is R34,8 million. This includes the cost of managing both freehold and leasehold interests.
The Office Portfolio
This report examines the performance of 18 offices, predominantly in the Cape Town CBD (see Appendix for details of the portfolio), accounting for some 151,881 m2 of occupied office space. Figure 1.2 summarises the extent of the office portfolio and the annual cost of holding and managing the portfolio. The locations of the CBD offices are illustrated in the map below.
The report also covers a pilot study of 5 schools in the Province to illustrate the value of performance assessment across other asset classes. The schools nominated for inclusion in this pilot are detailed in the Appendix.
The benefits of extending benchmarking beyond the education sector to other non-office portfolios prove compelling. Future reports will consider performance
assessment across the provincial property portfolio.
Management of the WCG’s Property Portfolio
The WCG occupies a range of properties accommodating
a workforce of staff covering all aspects of its devolved
functions.
The management of the property portfolio is delegated
to the Department of Transport and Public Works. The
Department takes its mandate from legislative prescripts,
specifically the Government Immovable Asset Management
Act (2007) (GIAMA) which requires provincial departments
to use immovable assets efficiently.
GIAMA specifically requires the Department to optimise
the cost of service delivery, not to hold onto properties for
longer than necessary, and to dispose of surplus provincial
properties that no longer support service delivery objectives.
To deliver on this mandate, the Department has set the
following strategic asset management objectives:
To reduce the overall size of the property portfolio;
To increase the efficiency of the office portfolio; and
To improve the environmental performance of the
portfolio.
The use of the portfolio as a corporate resource to support
the service delivery objectives of all user departments is kept
under constant review via the Custodian Immovable Asset
Management Plan and the requirements of the Public Service
Regulations (2001).
Through this process, the Department delivers on its
commitment to ensure that the property portfolio responds
properly to changes in the business landscape driven by
operational requirements and strategic objectives, that its
operational property portfolio is reduced through increased
Occupied Area
FTE office staff
Annual total property cost
151,881 m2
5,638
R 256,904,731
Figure 1.2
Western Capeoffice estate
utilisation and greater property collaboration, and that
operational assets are fully exploited and surplus assets are
brought forward for disposal as quickly as it is practical to
do so.
Existing Annual Performance Plans (APP) will be further
enhanced by access to more effective, standardised base
information and benchmarking data and, as such, become
a more useful tool for effective management decision
making and planning. Key performance indicators form a
fundamental component of these plans and provide a useful
mechanism to challenge and review asset performance.
Chapter 1: About this Report
6
Adder
ley
St
Que
en V
icto
ria S
t
Keero
m S
t
Parlia
men
t St
Plein
St
Wale St
Bree
St
Long
StLo
op St
Hout St
Strand St
Leeuwene St
Church St

Management Information
Accurate and reliable information is a fundamental requirement for effective planning and property asset management. Good data informs strategic decision making by senior management, assists monitoring of departmental performance, benchmarking and performance targeting.
This report draws on data collected from a number of different sources. The principal source of baseline data was the Department’s Asset Register and the on-going Building Audit project.
In addition, data was collected from the Department’s financial and management reporting systems, Provincial User Departments’ own data, property information held by some end-users and the City of Cape Town’s records.
IPD, a market leader in benchmarking for occupiers internationally, was appointed to assist the Department compile this report. The evidence gathered from the above sources formed the basis for the analysis contained in this report. IPD also benchmarked the WCG’s performance against South African corporate occupiers.
IPD Occupiers
IPD SA, an independent South African company, has
utilised the best practice methodology of IPD Occupiers
in the analysis of data for this report. IPD Occupiers is the
global leader of property performance data and analytics; it
collates, validates and reports annually on over 100,000,000
m2 of space internationally in both the public and private
sector.
The engagement of IPD brings additional management
expertise using their industry standards for measuring
and benchmarking Facilities Management (FM), Corporate
Real Estate (CRE) and space utilisation across complex
properties. IPD’s independent reputation for statistical
analysis will provide the WCG with robust, independent and
authoritative performance analysis of its property holdings
that is aligned to a world class standard.
The main areas of performance measurement used in this
report are the cost per FTE, space used per FTE, energy
consumption; and water consumption.
Obtaining and compiling data on the performance of the
portfolio proved challenging and highlighted the need for
information to be collated centrally. In addition, the absence
of a common standard limited the usefulness of the data.
The reliability of existing data also varied, suggesting that
data collection requires careful oversight and guidance. A
central system would support the Department’s objective
for the standardisation of data collection and benchmarking.
A central management information system creates a cross-
departmental database and would allow the Department to
measure and manage performance consistently, allowing
performance to be tracked over time and compared with
other departments.
The system would promote informed decision-making and facilitate comprehensive property planning and asset management. It would also offer the Department a lever to begin to impose efficiency strategies such as benchmarking.However a centralised system will only work if all provincial user departments make use of such a system. Figure 1.3 illustrates the fragmented sources of data which typify the office estate and associated constraints this has had during
data collection and consolidation.
PROPERTYMANAGEMENT
Dept of Environmental
Affairs and Development
Planning
LettingAgents
UTILITIES - WATER &
SEWERAGE
PARKING SERVICE CHARGE
RENT RATES
WORKSGENERAL
Landlords
Community Safety
REPAIRS & MAINTENANCE
MOVESVACANCY AUDIT
SECURITY STAFF & EQUIPMENT
WORKSADMINISTRATION
Letting Agents
CLEANING WASTE DISPOSAL
WORKSFACILITIES
FIT OUT &IMPROVEMENTS
BUILDING AUDIT
SPACEPROPERTY DETAILS
ROBUST PERFORMANCE DATA
BENCHMARK
7
Figure 1.3

Case Study 1: The WCG Building Audit
Data on the condition and maintenance backlog of the
WCG property portfolio required consolidation, update and
standardisation. A comprehensive and accurate view of
the portfolio was essential to ensure the integrity of future
decision making and informed allocation of budgets.
In January 2010 a team of professionals consisting of GAPP
Architects, Talani Quantity Surveyors and Gibb Engineers
was appointed to complete a comprehensive review of
the property portfolio and develop an asset management
information system - the Building Audit.
The Audit comprised a detailed review of all assets in the
WCG property portfolio. As at the end of June 2013 the
team has surveyed 75% of the estimated 7 million m2 in the
portfolio. The data and information obtained during the audit
has is stored in the SPM Asset Management database*.
Research on the most suitable system took place during
2010, and the pilot phase of the survey of about 1 million m2
was completed at the end of the 2011 financial year. It is
anticipated that the audit will be completed by the end of the
2013 financial year and that the transitional phase involving
the transfer and embedding of data and management
systems will take until the end of the 2015 financial year.
Developing and supporting access to valuable management
data was at the heart of the Audit. The information generated
by the Audit has specifically identified the replacement costs
of building components in 5 condition categories. This data
has provided information which can be related to the level of
service targets of individual departments and users will now
be trained to keep the information live; in addition the SPM
Asset Management Information system will be actively used
in decision making.
The SPM database can be accessed at various management
levels to provide data for use in the compilation of reports,
assessment of compliance to disabled access requirements,
sustainability and space utilisation performance targets,
as well as the management of the critical maintenance
programme. Some of the data which the Audit has provided
is also used in the production of this report to help measure
building performances.
* The SPM Asset Management database is a web based repository of information related to the
Western Cape Provincial Government’s property portfolio. It provides functionalities that allow
comprehensive data extraction for annual reporting and life-cycle maintenance purposes across
all Provincial Departments.
The work that informed this report included a review of the
United Kingdom Government’s approach to the management
of public sector property, performance measurement and
benchmarking.
Chapter 1: About this Report
Case Study 2: Improving the UK Government Estate through Measurement and Benchmarking
In 2006 the UK central government office portfolio
comprised over 10,000 buildings covering 13 million m2, was
run by 300 individual property centres, and cost around £6
billion a year to operate.
An asset of this size and cost was an obvious target for
Ministers and departments to make significant improvement
and savings. In 2006, the UK Government launched a seven
year property asset management improvement strategy,
called “High Performing Property”, led by the Treasury. The
strategy’s key target was to achieve annual savings of £1,5
billion by 2013 - a 25% saving on the then cost of running
the portfolio- that would be available to departments for
re-investing in public services that would otherwise not
have been funded. It also focused directly on improving the
strategic and professional management of the estate and
incorporated the new concepts for office design and use
including the extensive move to open plan offices, reduced
workstation to employee allocation, and flexible and remote
working.
Measurement of individual building, and therefore whole
portfolio, performance and benchmarking that against
private sector equivalents, were fundamental to achieving
the savings and continuous improvement targets. IPD had
been contracted to run a proof of concept pilot in 2004 to
establish a performance measurement methodology, and
on the successful conclusion of this in 2005, to roll this out
to all central government organisations.
The methodology developed by IPD is centred on three key
performance areas:
Efficiency – cost and utilisation;
Effectiveness – workplace productivity and operability;
and
Sustainability – energy and water consumption, and
waste recycling.
In order to strengthen and consolidate the initiative,
property performance measurement and benchmarking was
made a mandatory requirement on all central government
organisations in 2008.
The successful initiative is now delivering a number of key
benefits including:
A sound basis for measuring improvement progress on
efficiency, effectiveness and sustainability on a building
by building basis;
Increasingly accurate, robust and comprehensive data;
A sound basis for measuring performance against
private sector equivalents; and
A comprehensive overview of the performance of the
provincial office portfolio.
Sound quality data has also allowed the Government to
set a range of stretching efficiency standards and key
8

performance indicators against which improvement would
be measured. These include: cost per FTE employee, m2
per FTE, and cost per m2. Figure 1.4 illustrates the space
utilisation per FTE in Europe. The workspace standard of
10m2 per FTE is a key part of the UK Government’s focus
on “sweating” the property asset more effectively and on
improving workplace efficiency through the move from
cellular to open plan offices, and harnessing information
technology to increase flexible and remote working. These
efficiency standards complemented sustainability targets
that had been set by the Government covering energy use,
water consumption and waste recycling.
The Outcomes
Having a robust performance measurement methodology
has allowed the government to respond strongly to the legal
requirement, in the Climate Change Act 2008, for it to report
annually to Parliament on progress being made towards
improving the efficiency and environmental sustainability
of the central Government property portfolio. The annual
‘State of the Estate’ report provides a comprehensive
picture of government performance, tracking progress. The
following has been achieved so far:
The size of the central government property portfolio
has reduced by over a quarter in the last 5 years;
Annual savings of around £1,3 billion have been achieved
over the last 5 years;
Use of workspace has improved by 24%;
Cost of space is 16% below the private sector benchmark
for 2010/11;
The emissions reduction target has been exceeded
with more than 50% of central government buildings
showing a better energy performance than benchmark;
Over half of the waste arising from government buildings
is now recycled; and
Water consumption reduction targets have been met.
Work on performance measurement is already being taken
forward within the Department of Health of the WCG.
This is being used to improve the design of new facilities
and monitor the efficient and sustainable performance of
existing buildings.
9
34
,6 m
2
34
,2 m
2
27
,9 m
2
25
,5 m
2
22
,8 m
2
18,7
m2
13,2
m2
12,1
m2
12,1
m2
11,9
m2
10,8
m2
Sw
ed
en
Fin
lan
d
No
rway
Bra
zil
Sw
itze
rland
Glo
bal A
vera
ge
Ire
lan
d
Jap
an
Ch
ina
Po
lan
d
UK
35
30
25
20
15
10
5
0
M2 P
ER
FT
E O
CC
UP
AN
TFigure 1.4
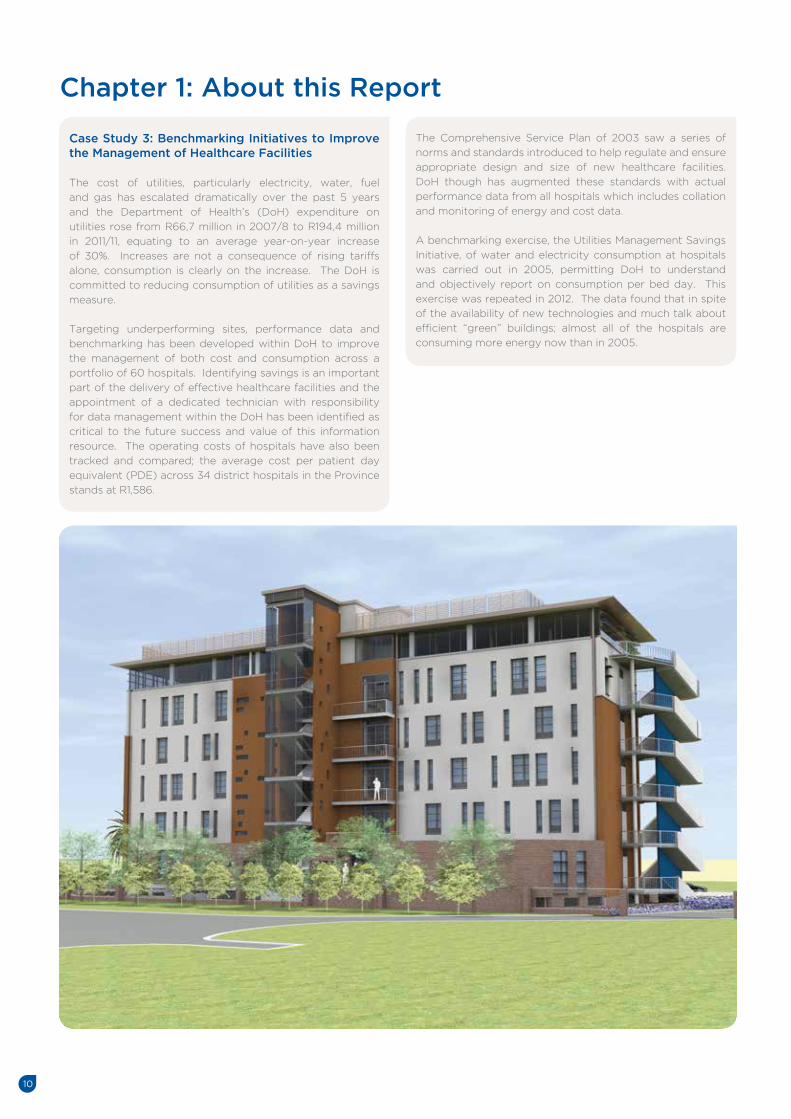
Case Study 3: Benchmarking Initiatives to Improve the Management of Healthcare Facilities
The cost of utilities, particularly electricity, water, fuel
and gas has escalated dramatically over the past 5 years
and the Department of Health’s (DoH) expenditure on
utilities rose from R66,7 million in 2007/8 to R194,4 million
in 2011/11, equating to an average year-on-year increase
of 30%. Increases are not a consequence of rising tariffs
alone, consumption is clearly on the increase. The DoH is
committed to reducing consumption of utilities as a savings
measure.
Targeting underperforming sites, performance data and
benchmarking has been developed within DoH to improve
the management of both cost and consumption across a
portfolio of 60 hospitals. Identifying savings is an important
part of the delivery of effective healthcare facilities and the
appointment of a dedicated technician with responsibility
for data management within the DoH has been identified as
critical to the future success and value of this information
resource. The operating costs of hospitals have also been
tracked and compared; the average cost per patient day
equivalent (PDE) across 34 district hospitals in the Province
stands at R1,586.
The Comprehensive Service Plan of 2003 saw a series of
norms and standards introduced to help regulate and ensure
appropriate design and size of new healthcare facilities.
DoH though has augmented these standards with actual
performance data from all hospitals which includes collation
and monitoring of energy and cost data.
A benchmarking exercise, the Utilities Management Savings
Initiative, of water and electricity consumption at hospitals
was carried out in 2005, permitting DoH to understand
and objectively report on consumption per bed day. This
exercise was repeated in 2012. The data found that in spite
of the availability of new technologies and much talk about
efficient “green” buildings; almost all of the hospitals are
consuming more energy now than in 2005.
Chapter 1: About this Report
10

Table 2.1: Key Performance Data
Cost per FTE
Cost per m2
m2 per FTE
The operating cost of the WCG office portfolio is
estimated at R46, 000 per FTE. This exceeds the South
African corporate-occupier benchmark of approximately
R30,000.
The high cost per FTE of WCG office space is largely a
function of poor space utilisation whilst the average cost
per m2 is below the South African corporate-occupier
average.
Variations in the efficiency performance of individual
office holdings expose opportunities for significant
improvement and savings.
Occupying office space more intensively will lead to
a decrease in the average cost per FTE.
Office Efficiency: Cost per FTE
The efficiency of the WCG office portfolio is assessed through the measurement and reporting of cost per FTE. This provides an effective metric which incorporates aspects of both cost and space performance and is reported in terms of annual R/ FTE.
The average cost per FTE across the office portfolio stands at around R46,000. At this level, the overall cost per FTE is around 54% higher than the average reported by South African corporate occupiers and clearly highlights scope for improvements in efficiency. Despite varying levels of efficiency across the portfolio, the cost per FTE in all WCG offices is higher than a corporate occupier average of around R30,000.
To develop an understanding of the WCG’s office efficiency, two key contributors of performance have been assessed – the costs of occupancy and the utilisation of space.
Figure 2.1 illustrates that the overall cost per FTE is impacted most significantly by the sub-optimal use of office space.
Colour denotes relative performance compared to a benchmark
average of South African corporate occupiers:
(>10% higher), (in line), (>10% lower).
11
Chapter 2: Performance Measurement
R45,567
R1,627
28,0 m2
R29,567
R2,006
14,2 m2
WCG OFFICE AVERAGE
CORPORATE OFFICE
BENCHMARK AVERAGE
Space per FTE(m2/FTE)
28.0 m2 94%
Total property cost(R/m2)
R1,627 -19%
Total property cost per FTE
R45,567 54%
Accommodation costs per FTE vary widely. The annual
cost per FTE varies between R29,000 and R76,000. Figure
2.2 reflects the range of performances. Understanding
and challenging the variation across buildings will enable
the Department to support cases for change and identify
opportunities for improvement. Figure 2.2 also illustrates
that tenure has little impact on cost per FTE and both owned
and leased offices demonstrate a variety of performance.
Comparative measures of cost per FTE illustrate the
need to focus attention on the efficiency of many of the
larger offices where the most significant improvements to
workplaces and to efficiency could be achievable.
R24,62311 LEEUWEN ST
R27,317UNION
R30,61027 WALE ST
R33,555DORP/LEEUWEN ST
R39,079GOLDEN ACRE
R40,463HUGUENOT
R40,54068 ORANGE ST
R41,48935 WALE ST
R42,727YORK PARK
R43,7334 DORP ST
R46,4429 DORP ST
R47,163GOV GARAGE
R47,585GRAND CENTRAL
R48,451ATTERBURY HSE
R55,275PROTEA
R59,353NORTON ROSE
R60,166WALDORF
R75,7727 & 15 WALE ST
R0
R20
,00
0
R4
0,0
00
R6
0,0
00
R8
0,0
00
SA
PR
IVA
TE
SE
CT
OR
AV
ER
AG
E
Figure 2.1
Figure 2.2
LE
AS
ED
OW
NE
D

12
Space Utilisation
At an average of 28 m2/FTE, the WCG performs poorly
on space usage averaging twice that reported by South
African corporate occupiers and far above the WCG
workplace standard of 15 m2/FTE.
Despite instances of better performance, all WCG offices
are above the current workplace standard of 15 m2/FTE.
There is ample capacity to accommodate more users
in the existing office accommodation and thereby
rationalise existing space and reduce overall costs.
Poor utilisation characterises the portfolio and offers the
greatest opportunities for realising savings. There is a high
allocation of space per FTE and a high workstation: fulltime
staff equivalent ratio which suggests a 20% over provision of
workstations.
Space efficiency is measured by the amount of space per
FTE (m2/FTE) and represents an important driver of overall
efficiency. In 2011/12 the WCG office portfolio operated at
28 m2/FTE. Currently all offices operate above the WCG
space standard of 15 m2/FTE and above the South African
corporate occupier average utilisation rate of 14,2 m2/FTE.
The capacity to accommodate increased staff in many
existing buildings is high and the current levels of office
utilisation present ideal opportunities to consolidate the
portfolio, for co-location and for rationalisation. The benefits
of the latter changes will deliver improvements in the overall
carbon footprint, better workspace and significant annual
cost savings from the portfolio.
The need to improve the use of office space is already being
taken forward in the refurbishment projects at 4 and 9 Dorp
Street and the Goulburn Centre in Goodwood.
Chapter 2: Performance Measurement

13
Case Study 4: The Face of the Province Project
4 Dorp Street is a 25 storey building of approximately 21,350
m2 and was constructed in 1974. 7 & 15 Wale Street is an
8 storey building and the original Provincial Administration
building comprising approximately 26,500 m2 and was built
in 1938.
These buildings accommodate the Provincial Legislature,
the Department of the Premier, the Director General, two
MECs and three Government departments as well as a
canteen and a gym for the use of Provincial Government
workers. A public street, owned by the City, also runs under
the complex and through a courtyard between the two
buildings.
Both buildings suffer dark and unattractive public spaces as
half the courtyard has had to be covered by a crash deck to
prevent delaminating plaster falling from the 4 Dorp Street
facade and injuring pedestrians. There are four entrances
into the two buildings, two of which are controlled by the
SA Police and two of which do not have disability access.
In 2010 it was proposed that a public interface be created
on the ground floor utilising the public street to create
a concourse. All functions in the two buildings and the
buildings on Long Street dealing with the general public
will be relocated to this concourse. This will considerably
improve public access to services as it will avoid the
necessity to enter the building through the access controlled
entrances.
The following functions are brought together on the ground
floor:
Cape Gateway – public information centre
CIDB – Construction Industry Development Board
Walk-in centre for the Government HR component
Media centre
Cash Teller and the Provincial banking outlet
Parliamentary Entrance
Restaurant and gym.
The project budget is R94 million. The project is managed
by Public Works General Facilities. The design team were
appointed from the roster of approved built environment
consultants and the building contractors were appointed
on an open bid. The main contractors are Status Africa
Construction and Group 5 Construction.
The expected outcomes are the following; -
To improve service delivery capacity of the WCG through
ease of public access to the WCG services, promoting
transparency, public service and accessibility;
To improve working conditions of the government
employees through increasing accessibility to the staff
restaurant and common area facilities for all users who
work in other buildings in the Provincial office precinct;
and
Contribution to the regeneration of the City Centre
through enlivening the facade along the Long Street
and creating new jobs in the retail sector.

14
The range in office utilisation varies between 17 and 47 m2/
FTE and is illustrated in Figure 2.3. The chart also illustrates
clearly how all offices currently exceed both benchmark and
the workplace standard of 15 m2/FTE.
Figure 2.3: Variations in Square Metres per FTE
Chapter 2: Performance Measurement
47.3 m27 & 15 WALE
34.2 m2YORK PARK
32.7 m2HUGENOT
31.7 m2GRAND CENTRAL
31.5 m2PROTEA
30.5 m2WALDORF
29.8 m2GOV GARAGE
26.6 m2NORTON ROSE
26.3 m235 WALE STR
24.0 m2DORP/LEEUWEN
22.6 m227 WALE
22.4 m2GOLDEN ACRE
22.3 m29 DORP
21.5 m24 DORP
20.7 m2ATTERBURY HSE
19.5 m2UNION HOUSE
18.7 m268 ORANGE STR
16.7 m211 LEEUWEN STR
0 m
2
SA
PR
IVA
TE
SE
CT
OR
AV
ER
AG
E
5 m
2
10 m
2
15 m
2
20
m2
25
m2
30
m2
35
m2
40
m2
45
m2
50
m2
LE
AS
ED
OW
NE
D
Performance data will provide a useful basis for inter-
departmental comparisons and expose opportunities for
consolidation and in some cases better provision of services
to the public. Figure 2.4 illustrates the m2/FTE performances
of most departments.
Figure 2.4: Departmental Variations in Square Metres per FTE
18.7
m2
GA
MB
LIN
G B
OA
RD
21.
8 m
2S
OC
IAL
DE
V. &
PO
VE
RT
Y
22
.6 m
2L
OC
AL
GO
V &
HU
MA
N S
ET
T.
22
.7 m
2T
RA
NS
PO
RT
AN
D P
UB
LIC
WO
RK
S
24
.3 m
2H
EA
LT
H
24
.5 m
2E
NV
.AF
FA
IRS
& D
EV
. P
LA
N
26
.3 m
2C
OM
MU
NIT
Y S
AF
ET
Y
28
.0 m
2T
RE
AS
UR
Y
28
.3 m
2P
RE
MIE
R
30
.0 m
2E
DU
CA
TIO
N
30
.5 m
2E
CO
NO
MIC
DE
VE
LO
PM
EN
T A
ND
TO
UR
ISM
31.
5 m
2C
UL
TU
RA
L A
FF
AIR
S A
ND
SP
OR
T
34
.2 m
2C
AP
E N
AT
UR
E
34
.2 m
2L
IBR
AR
Y S
ER
VIC
ES
34
.2 m
2H
UM
AN
SE
TT
LE
ME
NT
S
34
.2 m
2A
GR
ICU
LT
UR
E
47
.3 m
2W
ES
TE
RN
CA
PE
PR
OV
INC
IAL P
AR
LIA
ME
NT
10 m
215
m2
20
m2
25
m2
30
m2
35
m2
40
m2
45
m2
50
m2
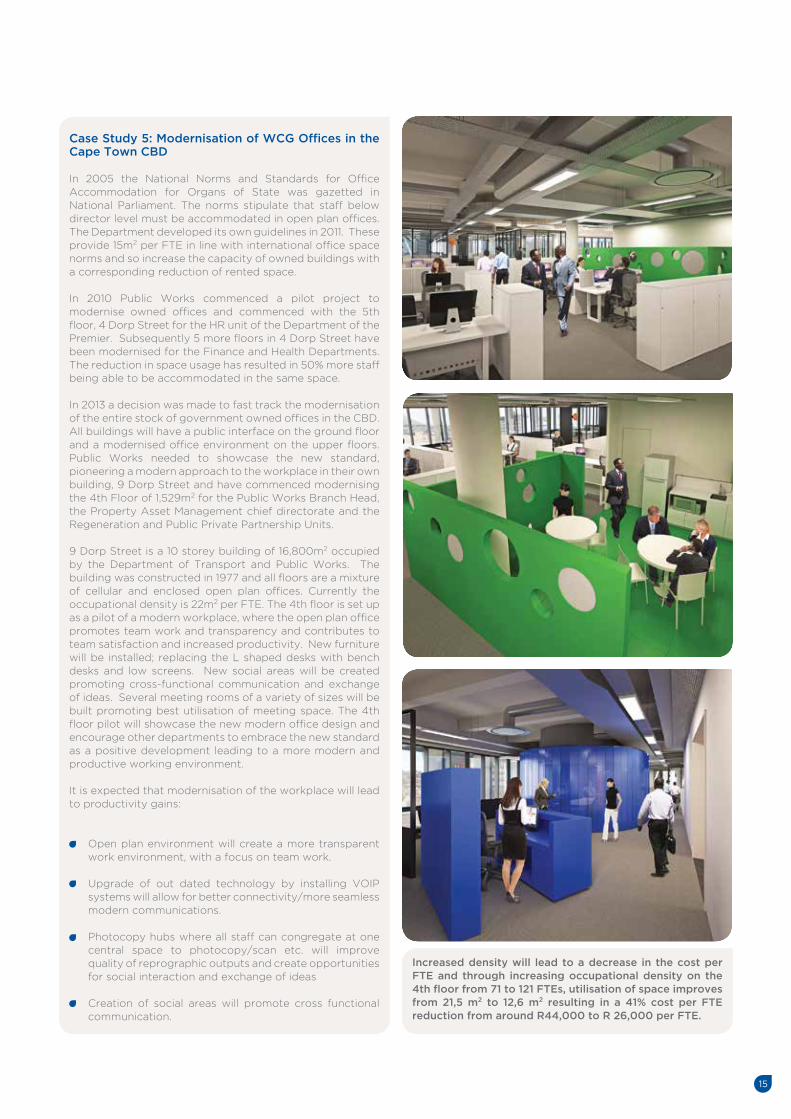
Increased density will lead to a decrease in the cost per FTE and through increasing occupational density on the 4th floor from 71 to 121 FTEs, utilisation of space improves from 21,5 m2 to 12,6 m2 resulting in a 41% cost per FTE reduction from around R44,000 to R 26,000 per FTE.
Case Study 5: Modernisation of WCG Offices in the Cape Town CBD
In 2005 the National Norms and Standards for Office Accommodation for Organs of State was gazetted in National Parliament. The norms stipulate that staff below director level must be accommodated in open plan offices. The Department developed its own guidelines in 2011. These provide 15m2 per FTE in line with international office space norms and so increase the capacity of owned buildings with a corresponding reduction of rented space.
In 2010 Public Works commenced a pilot project to modernise owned offices and commenced with the 5th floor, 4 Dorp Street for the HR unit of the Department of the Premier. Subsequently 5 more floors in 4 Dorp Street have been modernised for the Finance and Health Departments. The reduction in space usage has resulted in 50% more staff being able to be accommodated in the same space.
In 2013 a decision was made to fast track the modernisation of the entire stock of government owned offices in the CBD. All buildings will have a public interface on the ground floor and a modernised office environment on the upper floors. Public Works needed to showcase the new standard, pioneering a modern approach to the workplace in their own building, 9 Dorp Street and have commenced modernising the 4th Floor of 1,529m2 for the Public Works Branch Head, the Property Asset Management chief directorate and the Regeneration and Public Private Partnership Units.
9 Dorp Street is a 10 storey building of 16,800m2 occupied by the Department of Transport and Public Works. The building was constructed in 1977 and all floors are a mixture of cellular and enclosed open plan offices. Currently the occupational density is 22m2 per FTE. The 4th floor is set up as a pilot of a modern workplace, where the open plan office promotes team work and transparency and contributes to team satisfaction and increased productivity. New furniture will be installed; replacing the L shaped desks with bench desks and low screens. New social areas will be created promoting cross-functional communication and exchange of ideas. Several meeting rooms of a variety of sizes will be built promoting best utilisation of meeting space. The 4th floor pilot will showcase the new modern office design and encourage other departments to embrace the new standard as a positive development leading to a more modern and productive working environment.
It is expected that modernisation of the workplace will lead to productivity gains:
Open plan environment will create a more transparent work environment, with a focus on team work.
Upgrade of out dated technology by installing VOIP systems will allow for better connectivity/more seamless modern communications.
Photocopy hubs where all staff can congregate at one central space to photocopy/scan etc. will improve quality of reprographic outputs and create opportunities for social interaction and exchange of ideas
Creation of social areas will promote cross functional communication.
15
16
Cost per Square Metre
At present the average cost per m2 stands at just over
R1,600. This is 19% below the current South African
corporate occupier average.
Some component costs appear very low and the low
relative cost of repair per m2 exposes a possible under
investment in maintenance.
The cost per m2 of occupied space stands at R1, 627. This is
19% lower than the corporate occupier average and indicates
an overall level of cost per m2 which is aligned to benchmark.
It is however important to understand variations at office
level which will invite further review to identify where cost
improvements and savings may be realised.
Cost per m2 reflects the main component costs of property
occupation incorporating rent, rates, net service charges,
utilities, cleaning, security and repair and maintenance but
specifically excludes capital costs.
Review of the operational costs at office level exposes some
offices where costs of operation are more than double the
per m2 rate incurred at other offices. These instances identify
where costs might reasonably be challenged and where
further analysis may drive improvement.
The low relative cost of cleaning per m2 appears to reflect
the benefits of competitive tendering practices in some
buildings.
The average cost of repairs per m2 is 24% below the typical
level of investment per m2 reported by corporate occupiers
in South Africa. This might mean that backlog maintenance
issues need to be addressed and funded more directly and
will link to the Building Audit initiative which has already
been taken forward.
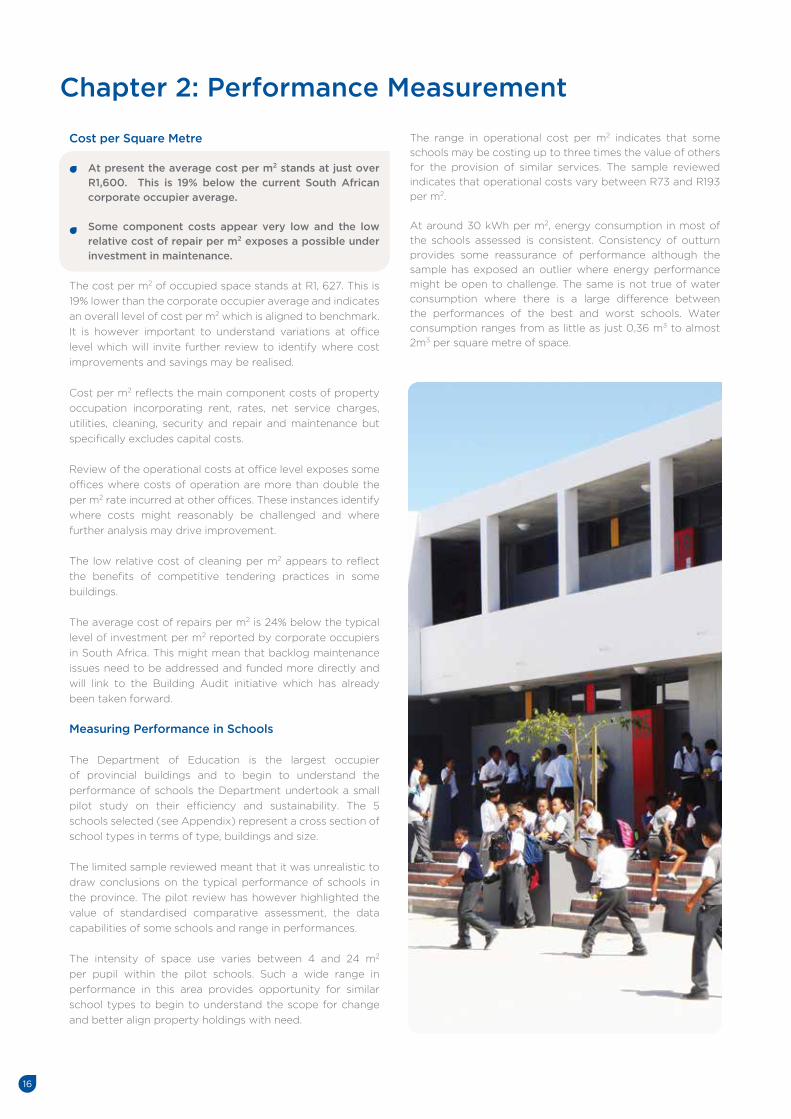
Measuring Performance in Schools
The Department of Education is the largest occupier
of provincial buildings and to begin to understand the
performance of schools the Department undertook a small
pilot study on their efficiency and sustainability. The 5
schools selected (see Appendix) represent a cross section of
school types in terms of type, buildings and size.
The limited sample reviewed meant that it was unrealistic to
draw conclusions on the typical performance of schools in
the province. The pilot review has however highlighted the
value of standardised comparative assessment, the data
capabilities of some schools and range in performances.
The intensity of space use varies between 4 and 24 m2
per pupil within the pilot schools. Such a wide range in
performance in this area provides opportunity for similar
school types to begin to understand the scope for change
and better align property holdings with need.
Chapter 2: Performance Measurement
The range in operational cost per m2 indicates that some
schools may be costing up to three times the value of others
for the provision of similar services. The sample reviewed
indicates that operational costs vary between R73 and R193
per m2.
At around 30 kWh per m2, energy consumption in most of
the schools assessed is consistent. Consistency of outturn
provides some reassurance of performance although the
sample has exposed an outlier where energy performance
might be open to challenge. The same is not true of water
consumption where there is a large difference between
the performances of the best and worst schools. Water
consumption ranges from as little as just 0,36 m3 to almost
2m3 per square metre of space.

Case Study 6: Improving Efficiencies through Public Private Partnerships
The Department’s landholdings cover a wide range of assets
and liabilities, comprising freehold interests registered in the
name of, or vesting in the WCG and a substantial portfolio
of leasehold accommodation.
By utilising its freehold assets more efficiently, the
Department intends achieving 31,028 m2 of operational
efficiencies over the term of the Provincial Modernisation
Programme. However the modernisation programme is
only part of the solution. The Department has embarked on
a project to replace 20,486 m2 of office accommodation
currently leased by the Western Cape Education
Department, the Province’s single largest occupier of leased
accommodation in the CBD, with new space to be procured
via a Public Private Partnership.
The proposed transaction aligns with the Department’s
strategic objectives as its execution will significantly
contribute towards reducing its leasehold liabilities. It will
leverage private sector capacity and capital to develop this
under-utilised property.
Objectives of the project are to procure a new working
environment located in the Provincial Government Precinct
for the WCED, which currently operates from leased
premises in the CBD, and to achieve a reduction in the
Department’s operational liabilities through increased
operational efficiencies resulting from accommodating
whole departments in single accommodation.
In 2009, the Department acquired a portfolio of sites known
as the Leeuwen-Loop precinct to expand the Provincial
Government Precinct for user departments currently
operating from leased premises.
The Department appointed KPMG, as its Transaction
Advisor, to undertake a feasibility study to provide suitable
owned office accommodation for provincial departments in
leased space.
The project will provide user departments with office
accommodation in accordance with the Department’s new
draft Office Accommodation Norms and Space Standards
published in September 2011. The project will result in
a more efficient and effective utilisation of future office
accommodation as a result of the application of the new
norms and standards and moving from cellular offices to an
open plan environment. Other intended outcomes include:
Efficiency improvements and reduced costs through
provincial departments operating from one building,
rather than being located across a range of CBD sites,
with public interface facilities on the ground floor.
Improved space planning as a result of the application
of the Department’s norm of 15m2 of rentable area per
FTE as opposed to the current average space per FTE
of around 28 m2.
A reduction in above-market lease costs in moving
provincial staff from leased space to owned
accommodation.
17

18
Chapter 3: Sustainability
The Department, as a custodian of provincial state land, in
its Strategic Plan 2010 – 2014 has set out how it intends
promoting sustainable development and contributing
toward Government’s Millennium Development Goals.
Beyond 2015, the Government has recommitted itself to the
promotion of sustainable development in Chapter 5 of the
National Development Plan (NDP).
The Department aims to demonstrate how the government’s
environmental objectives can be practically and cost-
effectively delivered by: -
Ensuring that all future provincial government buildings
procured by the Department meet green principles of
design and achieve a minimum Greenstar rating of 4;
and
Demonstrating leadership regarding environmental
considerations within the built environment. In this
regard, construction of the new Khayelitsha Shared
Services Centre is underway. This building is the first
WCG asset to target a Greenstar rating of 5 from the
Green Building Council of South Africa (GBCSA).
The Department’s 2010 – 2014 Strategic Plan targeted a
5% reduction in energy consumption across the provincial
portfolio by 2014. In terms of PSO7, the WCG is seeking to
enhance the environmental performance of the provincial
property portfolio by targeting the following energy and
water savings: -
The generation of 15% of the electricity used by the
Provincial property portfolio from renewable sources
by 2014; and
Achieving 15% reduction in water usage in selected
provincial buildings, including schools and hospitals, via
water re-use (grey water and rainwater harvesting).
Table 3.1: Key Performance Data
Energy consumed
per FTE (kWh)
Water consumed
per FTE (m3)
The potential to enhance the environmental
performance of the WCG’s property portfolio relies on
more accurate data and performance reporting. The
Department’s strategy to focus on under-performing
buildings in both the Health and Education sectors,
combined with a range of greening initiatives will
assist the Department to deliver on the Government’s
objectives.
The average energy consumption per FTE across the
WCG’s office portfolio is 6,474 kWh. Our consumption
is higher than the South African corporate office occupier
average of 4,300 kWh/FTE. Under-utilisation of WCG
offices compromises performance.
Average water consumption per FTE stands at 14,6 m3/FTE.
This compares to the average South African corporate
office occupier usage of 9,3 m3/FTE.
An Introduction to Sustainability
Sustainability is an increasingly important consideration
and all government departments have targets to reduce
their carbon footprint and the proportion of energy they
use from renewable sources.
This chapter reports on the energy and water consumptions
across the WCG office portfolio. Key sustainability metrics
for buildings include the energy consumption per FTE and
per m2, the proportion of energy from renewable sources
and the quantity of water used.
These metrics are used to report and compare performances
which will help further understand where opportunities to
improve exist, as well as more accurately track progress to
achieving a sustainable property portfolio.
Property is a significant contributor to greenhouse gas
emissions and while good progress has been made in
reducing emissions and water use in the case of individual
projects, the challenge to further improve on sustainability
performance remains a high priority across the Province.
The South African Constitution places a statutory duty
on government in relation to sustainable development.
In the Western Cape, the Provincial Government has
committed via Provincial Strategic Objective 7 (PSO 7) to
mainstreaming sustainability and optimising resource usage
efficiency.
6,474 kWh
14,6 m3
4,300 kWh
9,3 m3
WCG OFFICE AVERAGE
CORPORATE OFFICE
BENCHMARK AVERAGE
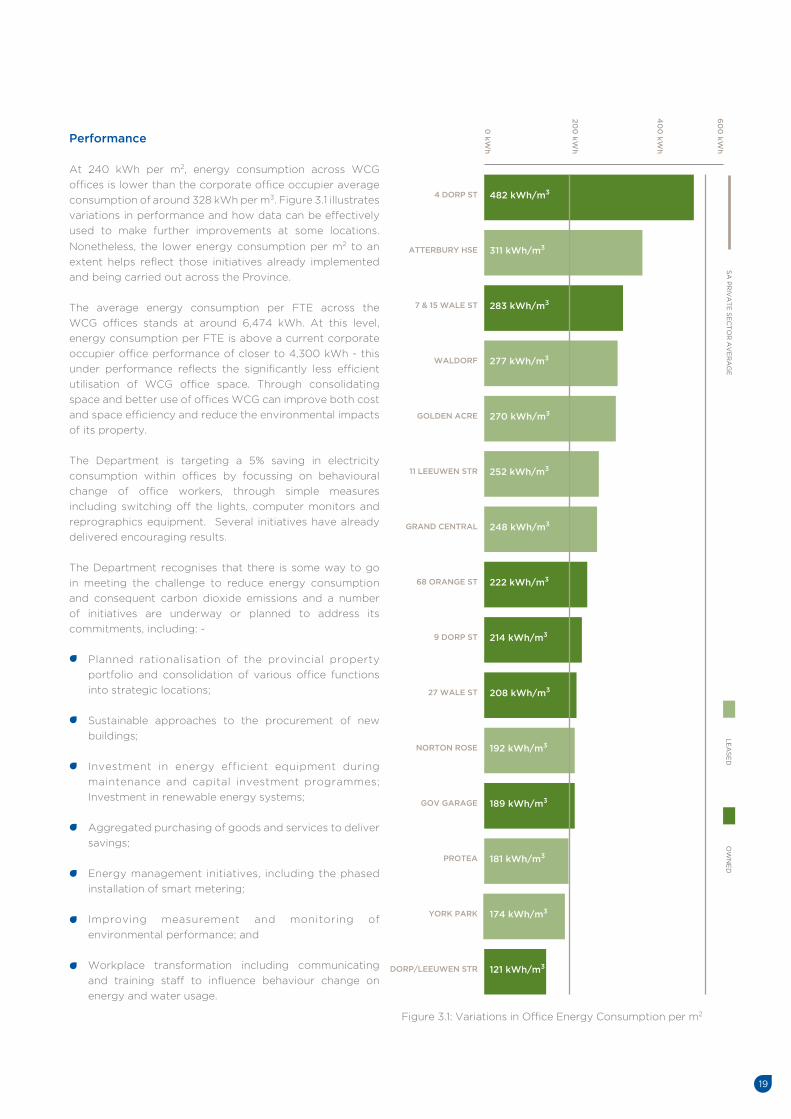
Performance
At 240 kWh per m2, energy consumption across WCG
offices is lower than the corporate office occupier average
consumption of around 328 kWh per m3. Figure 3.1 illustrates
variations in performance and how data can be effectively
used to make further improvements at some locations.
Nonetheless, the lower energy consumption per m2 to an
extent helps reflect those initiatives already implemented
and being carried out across the Province.
The average energy consumption per FTE across the
WCG offices stands at around 6,474 kWh. At this level,
energy consumption per FTE is above a current corporate
occupier office performance of closer to 4,300 kWh - this
under performance reflects the significantly less efficient
utilisation of WCG office space. Through consolidating
space and better use of offices WCG can improve both cost
and space efficiency and reduce the environmental impacts
of its property.
The Department is targeting a 5% saving in electricity
consumption within offices by focussing on behavioural
change of office workers, through simple measures
including switching off the lights, computer monitors and
reprographics equipment. Several initiatives have already
delivered encouraging results.
The Department recognises that there is some way to go
in meeting the challenge to reduce energy consumption
and consequent carbon dioxide emissions and a number
of initiatives are underway or planned to address its
commitments, including: -
Planned rationalisation of the provincial property
portfolio and consolidation of various office functions
into strategic locations;
Sustainable approaches to the procurement of new
buildings;
Investment in energy efficient equipment during
maintenance and capital investment programmes;
Investment in renewable energy systems;
Aggregated purchasing of goods and services to deliver
savings;
Energy management initiatives, including the phased
installation of smart metering;
Improving measurement and monitoring of
environmental performance; and
Workplace transformation including communicating
and training staff to influence behaviour change on
energy and water usage.
19
482 kWh/m34 DORP ST
311 kWh/m3ATTERBURY HSE
283 kWh/m37 & 15 WALE ST
277 kWh/m3WALDORF
270 kWh/m3GOLDEN ACRE
252 kWh/m311 LEEUWEN STR
248 kWh/m3GRAND CENTRAL
222 kWh/m368 ORANGE ST
214 kWh/m39 DORP ST
208 kWh/m327 WALE ST
192 kWh/m3NORTON ROSE
189 kWh/m3GOV GARAGE
181 kWh/m3PROTEA
174 kWh/m3YORK PARK
121 kWh/m3DORP/LEEUWEN STR
0 k
Wh
SA
PR
IVA
TE
SE
CT
OR
AV
ER
AG
E
20
0 k
Wh
40
0 k
Wh
LE
AS
ED
OW
NE
D6
00
kW
h
Figure 3.1: Variations in Office Energy Consumption per m2

20
Chapter 3: Sustainability
Design will incorporate passive solutions including orientation, maximising natural ventilation and lighting. Recycling and bicycle facilities will be provided at all new schools. Water saving measures including boreholes and rainwater tanks will be considered for irrigation and drought tolerant indigenous landscaping will be prioritised.
The campaign has assisted WCED to identify schools in need of support and those where savings, both in utility consumption and cost, can be actively improved. The campaign has also demonstrated the benefits and applications for fundamental management information and already actions have been taken to improve utility management at various schools across the province.
Case Study 7: Investigating Environmental Perform-ance in Western Cape Schools
The Western Cape Education Department (WCED) is responsible for providing education services in the province. The schools portfolio is the largest in the provincial portfolio and accordingly is responsible for significant energy and water consumption across the province.
As part of the WCG’s commitment to reduce energy and water usage by 15% by 2014, the WCED has partnered with the Department of Environmental Affairs and Development Planning to launch a campaign to raise awareness amongst educators on environmental issues and identify practical steps to target savings.
The first stage of the campaign has focussed on the value of basic performance data. Data has been collected as part of a pilot survey of 200 schools with the highest consumption metrics across the school portfolio over a three year period. The information will be used to assess, compare and target improvements amongst schools.
WCED has also commenced a capital programme that will see the installation of bulk water metering devices across the schools portfolio. The first phase of the programme will see some 520 schools receive metering devices over the following three years.
By 2016, the WCG plans to build close to 100 new or replacement schools, budgeted at R3.3billion and WCED will ensure the highest standards of environmental performance from this investment.

Supporting Travel SMART
As a significant employer within the CBD, the WCG has
signed-up to the City of Cape Town’s Travel SMART
programme. The programme aims to encourage cheaper,
greener and healthier alternatives to motor vehicle use.
Travel SMART provides information to staff on public
transport, lift clubs and promotes cycling and walking.
The following interventions within our buildings can
promote smart travel, such as,
Increased accessibility to public transport interchanges;
Access to safe and secure bicycle storage, shower and
change room facilities;
Preferential parking allocation to car poolers; and
Electric vehicle charging points within parking areas.
Creating an Energy Saving Culture
To promote behaviour change, advanced electricity
meter reading technology was installed within the DEADP
complex as a pilot project. This technology allows for
the real-time electricity consumption measurement and
monitoring of the building (or floor) remotely via a web
portal. Providing building users with this real time electricity
consumption, together with energy saving tips, has resulted
in a significant savings of 17% overall and up to 29% during
after work hour periods.
Monitoring and reducing water use in WCG properties is an
equally important component in efforts to deliver a more
sustainable property portfolio. The aim is to reduce water
consumption by 15% across the provincial portfolio by 2014,
using 2009 as the baseline year. Access to robust data is
fundamental to achieving and tracking this ambition.
The office portfolio consumes water at an average rate of
14,6 m3/FTE which is higher than an external benchmark
level of 9,3 m3/FTE. Figure 3.2 reveals the relative
differences in water consumed per FTE across many of the
WCG office buildings. By consolidating office space and
improving intensity of use, metering at building level and
other green initiatives, significant improvements can be
made in the overall volume of water consumed.
Average water consumption per m2 in WCG office buildings
stands currently at around 0,5 m3 per annum which is lower
than a corporate office occupier average of 0,72 m3 per m2.
On a per m2 basis, WCG office water consumption lies well
within a typical corporate office occupiers’ consumption
range of between 0,4 m2 and 1,1 m2.
21
43.9 m3/FTEYORK PARK
40.3 m3/FTEGOV GARAGE
32.6 m3/FTE11 LEEUWEN STR
21.5 m3/FTE7 & 15 WALE ST
21.3 m3/FTE9 DORP ST
19.8 m3/FTEGOLDEN ACRE
16.6 m3/FTE27 WALE ST
15.7 m3/FTEATTERBURY HOUSE
13.1 m3/FTEDORP/LEEUWEN ST
11.6 m3/FTE4 DORP ST
6.4 m3/FTEGRAND CENTRAL
0 m
3
SA
PR
IVA
TE
SE
CT
OR
AV
ER
AG
E
10 m
3
20
m3
30
m3
40
m3
50
m3
Figure 3.2: Variations in Office Water Consumption per FTE
LE
AS
ED
OW
NE
D
22
Performance Measurement
This report establishes the baseline for future reporting on the performance of the WCG’s property holdings. The report has found that there is significant scope for the Provincial property portfolio to be used more efficiently and effectively, in particular through improving the way that occupied space is used.
The decision to undertake the performance measurement of the WCG’s property portfolio, and the results that have emerged from this initial work, demonstrate the Government’s commitment to improve the management and use of its immovable assets for the benefit of the citizens of the Western Cape and its workforce.
The good start that has been made now needs to be developed and embedded in the future strategic and operational management decisions of the Department. This will require considerable commitment and leadership to achieve the anticipated results. It will also require strong and dedicated implementation staffed by the right people with the right skills.
In the coming months, the Department will: -
Drive the efficient use of property across the WCG by
improving the accessibility and quality of data, including
the centralisation of data storage in the SPM database;
Develop the methodology and systems for measuring
both the efficiency and effectiveness performance of the
provincial property portfolio;
Formalise annual reporting on progress to achieve an
efficient, effective and sustainable portfolio;
Complete the coverage of the General Infrastructure
portfolio and extend the report to include the Health and
Education portfolios;
Develop further standards for the efficient, effective and
sustainable use of buildings that complement the 15 m2/
FTE space standard;
Accelerate the implementation of the WCG’s energy and
water reduction targets;
Build on the success of the modernisation and
refurbishment programme by rolling-out delivery to
other owned buildings; and
Institutionalise a clear mandate to implement the
improvements and savings that have been, and will
be, identified through the performance measurement
process.
Strategic Asset Management
To achieve compliance with GIAMA, the Department will adopt a more strategic approach to the management of its property holdings. The Department’s primary objective is to ensure that the portfolio occupied by the WCG is fit-
Chapter 4: Forward Look
for-purpose and meets departmental requirements, whilst delivering efficiency savings.
A centralised management information system would promote the integration of strategies on matters such as vacant space management and portfolio rationalisation aimed at improving the effectiveness of occupation and reducing costs through greater efficiency savings.
The Department’s future asset management priorities include:
Accelerating the implementation of the Office Accommodation Norms and Standards (2011) across the office portfolio to deliver a more efficient portfolio;
Implementing a rationalisation plan aimed at reducing the size of the provincial property portfolio. Encouraging multiple occupancy (e.g. greater co-location of departments - Khayelitsha Shared Service Centre) and exercising lease break options and expiries where it gives best value for money (e.g. acquisition of York Park);
Realising capital receipts from the disposal of under-utilised and surplus provincial land and property, for reinvestment in other capital projects or payment to the Asset Finance Reserve. Disposals need to be carefully planned to maximise value for the public sector, especially in the light of current property market conditions; and
As regards environmental initiatives, grant funding has been approved by the United States Trade and Development Agency to investigate the feasibility of installing photovoltaic solar panels on WCG buildings in the CBD.
This ambitious programme will build on, and complement, the Department’s achievements to date. In revitalising the WCG’s school, health and office infrastructure, the Department will seek investment in PPP contracts and the Provincial Regeneration Programme.

23
Appendix
Offices
The table below identifies those office buildings reviewed by this report and for which data was assembled. The offices are
arranged in descending order by size. Three measures of office efficiency (cost per FTE, space per FTE and cost per m2)
and two basic measures of environmental performance are shown for each location.
Note. Where requisite data was not accessible “n/a” has been reported.
Schools
The table below identifies the schools reviewed in the pilot study.
Note. The costs reported for the pilot schools are operating costs only (cleaning, security, maintenance and utilities).
The range of school types reviewed in this small sample means it was not realistic to apply any rental cost estimations.
Data on rates payments were assembled but are not included in the costs presented in the table above.
GRAND CENTRAL
7 & 15 WALE STREET
4 DORP STREET
9 DORP STREET COMPLEX
27 WALE STREET
WALDORF
GOLDEN ACRE 10,11,12,13,15,17,18,19,22 & 23
13 DORP STREET, 4 LEEUWEN STREET
PROTEA ASSURANCE
YORK PARK
UNION HOUSE
35 WALE STREET
NORTON ROSE 1,2,3 & 6
GOVERNMENT GARAGE
HUGUENOT BUILDING
ATTERBURY HOUSE 3rd & 4th FLOOR
11 LEEUWEN STREET
68 ORANGE STREET
24,159 m2
21,809 m2
17,118 m2
15,652 m2
12,445 m2
9,262 m2
7,563 m2
7,002 m2
6,888 m2
6,151 m2
6,001 m2
5,022 m2
3,730 m2
2,291 m2
2,123 m2
1,759 m2
1,538 m2
1,368 m2
31,7 m2
47,3 m2
21,5 m2
22,3 m2
22,6 m2
30,5 m2
22,4 m2
24,0 m2
31,5 m2
34,2 m2
19,5 m2
26,3 m2
26,6 m2
29,8 m2
32,7 m2
20,7 m2
16,7 m2
18,7 m2
R47,585
R75,772
R43,733
R46,442
R30,610
R60,166
R39,079
R33,555
R55,275
R42,727
R27,317
R41,489
R59,353
R47,163
R40,463
R48,451
R24,623
R40,540
R1,503
R1,602
R2,039
R2,080
R1,355
R1,975
R1,747
R1,399
R1,757
R1,250
R1,402
R1,578
R2,228
R1,585
R1,239
R2,341
R1,473
R2,163
248 kWh
283 kWh
482 kWh
214 kWh
208 kWh
277 kWh
270 kWh
121 kWh
181 kWh
174 kWh
n/a
n/a
192 kWh
189 kWh
n/a
311 kWh
252 kWh
222 kWh
6,4 m3
21,5 m3
11,6 m3
21,3 m3
16,6 m3
n/a
19,8 m3
13,1 m3
n/a
43,9 m3
n/a
n/a
n/a
40,3 m3
n/a
15,7 m3
32,6 m3
72,0 m3
Occupied NIA Cost per FTE Space per FTE Cost per m2Energy consumed per m2
Waterconsumed per m2
RONDEBOSCH BOYS HIGH SCHOOL
GOOD HOPE SEMINARY SCHOOL
ATLANTIS SECONDARY SCHOOL
MASIYELE SENIOR SECONDARY SCHOOL
TAFELSIG SECONDARY SCHOOL
19,299 m2
8,521 m2
6,507 m2
6,399 m2
5,464 m2
23,8 m2
20,7 m2
3,8 m2
5 m2
3,8 m2
R4,587
R1,545
R461
R368
R300
R193
R75
R120
R73
R79
28 kWh
48 kWh
29 kWh
30 kWh
32 kWh
1,1 m3
0,4 m3
2 m3
1 m3
0,1 m3
Occupied NIA Cost per pupil Space per pupil Cost per m2Energy consumed per m2
Waterconsumed per m2

APP Annual Performance Plan
Benchmark In this report the benchmark represents the average performance reported by South African corporate occupiers. It provides context for results and does not necessarily reflect best practice. The average reflects a typical performance based on evidence from corporate occupiers. The sample of offices (approximating to 750,000 m2 occupied office space) will include performances above and below the benchmark reported. The benchmark data represents real evidence collected from occupiers and reported to the same standards.
Cost References in this report to cost and total costs represent the IPD Total Property Cost. Total Property Cost is defined specifically to include only a set of costs which represent the core costs of building occupation and operation and for which data in most organisations is accessible and cost definitions are based on the latest edition of the IPD Cost Code. The data has been assembled from within Departments and across Public Works.
Total property cost includes Net Rent (for owned offices an average cost per m2 has been applied to approximate to an equivalent market rental cost and to facilitate direct comparison against leased space), rates and local property taxes, parking charges, net service charges, internal repair and maintenance, mechanical and electrical repair and maintenance, external and structural repair and maintenance, minor improvements, security, cleaning and waste disposal, internal plants and decorations, grounds maintenance, water and sewerage and energy. Total property cost excludes any capital expenditure.
DEADP Department of Environmental Affairs and Development Planning
DoH Department of Health
FTE Full Time Equivalent (staff member)
IPD IPD is a leading provider of worldwide critical business intelligence, including analytical services, indices and market information, to the property industry. IPDs clients from private and public sector include directors, facilities managers and property management companies.
IPDs only business is reporting property performance and IPD works with a diverse range of organisations to help raise the value of property performance data.
Glossary
Based in Johannesburg, IPD South Africa is now in its 15th year of reporting on the South African commercial property market.
kWh The kilowatt hour is a unit of energy equal to 1000 watt hours. The kilowatt hour is the most commonly known unit to measure energy delivered. Average annual power consumption can be expressed in kilowatt hours per year, per m2 or per FTE user.
Occupied space The net internal area, measured in m2, of office space occupied by organisations. The space has been defined in accordance with SAPOA guidelines and is equivalent to the SAPOA usable area.
Office portfolio The report examines the performance of 18 offices, predominantly in the Cape Town CBD, which represent around 152,000 m2 of occupied office space. The portfolio represents the vast majority of the provinces office accommodation.
Performance Performance of the Western Cape office portfolio (and selected schools) has been assessed using three standard metrics of property efficiency (cost per m2, space per FTE and cost per FTE) to report internal efficiencies and also through comparison to a benchmark average of South African corporate occupiers. Additionally, sustainability performances have been assessed using data to develop energy and water consumption metrics.
Public Works The Department of Transport and Public Works (Western Cape). Public Works develops and maintains appropriate infrastructure and related services for sustainable economic development which generates growth in jobs and facilitates empowerment and opportunity.
SAPOA South African Property Owners Association
WCED Western Cape Education Department
24


Department of Transport and Public Works
Head Office, 9 Dorp Street, Cape Town, 8001.
Tel: 021 483 4391
www.westerncape.gov.za


