
Asian Century or
Multi-polar Century?
By David Dollar*
World Bank Country Director, China and Mongolia
Summary
The “rise of Asia” is something of a myth. During 1990–2005 China accounted for 28% of global growth, measured at PPP. India accounted for 9%. The rest of developing Asia, with nearly a billion people, accounted for only 7%, the same as Latin America. Hence there is no general success of Asian developing economies. China has grown better than its developing neighbors because it started its reform with a better base of human capital, has been more open to foreign trade and investment, and created good investment climates in coastal cities. China’s success changes the equation going forward: its wages are now two to three times higher than in the populous Asian countries (India, Pakistan, Bangladesh, Vietnam, Indonesia), and China will become an ever-larger importer of natural resource and labor-intensive products. Developing countries need to become more open and improve their investment climates to benefit from these opportunities. China itself faces new challenges that could hamper its further development: unsustainable trade imbalance with the U.S., energy and water scarcity and unsustainable use of natural resources, and growing inequality and social tension. To address the first two of these challenges, good cooperation between China and the U.S. is essential. I conclude that we are more likely to be facing a “multi-polar century,” than an Asian century.
World Bank Policy Research Working Paper 4174, March 2007
The Policy Research Working Paper Series disseminates the findings of work in progress to encourage the exchange of ideas about development issues. An objective of the series is to get the findings out quickly, even if the presentations are less than fully polished. The papers carry the names of the authors and should be cited accordingly. The findings, interpretations, and conclusions expressed in this paper are entirely those of the authors. They do not necessarily represent the view of the World Bank, its Executive Directors, or the countries they represent. Policy Research Working Papers are available online at http://econ.worldbank.org.
*I thank Pieter Bottelier, Lant Pritchett, Wang Shuilin, Xue Lan, and Ernesto Zedillo for helpful comments on an earlier draft, which was prepared for the GDN annual conference in Beijing, January 2007.
WPS4174
Pub
lic D
iscl
osur
e A
utho
rized
Pub
lic D
iscl
osur
e A
utho
rized
Pub
lic D
iscl
osur
e A
utho
rized
Pub
lic D
iscl
osur
e A
utho
rized
Pub
lic D
iscl
osur
e A
utho
rized
Pub
lic D
iscl
osur
e A
utho
rized
Pub
lic D
iscl
osur
e A
utho
rized
Pub
lic D
iscl
osur
e A
utho
rized
1
Introduction The Asian Century is a term used to describe the belief that, if certain
demographic and economic trends persist, the 21st century will be dominated by
Asian politics and culture, similarly to how the 20th century is sometimes called
the American Century. – Wikipedia
The emergence of big developing countries, notably China and India, from a long
period of self-imposed isolation is the most distinctive feature of the modern era of
globalization. In the 15 years between 1990 and 2005, developing economies of Asia
accounted for 44% of global economic growth, measured at purchasing power parity.
The established industrial powers of the OECD accounted for 41%. Many observers
believe that these trends will continue and that we are on the verge of an “Asian Century”
that will be dominated by Asian economics, politics, and culture.
This paper examines the Asia’s recent development, future prospects, and impact
on the rest of the developing world. I address this topic by dividing Asia into three
roughly equal parts—China, India, and the rest of developing Asia (RODA)—and by
comparing their economic performances and future prospects.
Just separating the region into these three parts quickly reveals that the notion of
the rise of Asia is something of a myth. In the next section I look at the recent economic
performance of China, India, and RODA (each of which has, roughly speaking, about a
billion people). China’s economic performance has been spectacular and the “rise of
China” is a real phenomenon. India has done well, but over a 15-year period its per
capita GDP growth averaged 4%, far behind China’s performance. That growth rate has
accelerated in recent years and a key issue for India is whether it can sustain this higher
growth. The rest of developing Asia has grown at 2.7%, just slightly better than the world

2
average. Within RODA, there is large heterogeneity, with Thailand and Vietnam
growing quite well, while other large economies such as Bangladesh, Indonesia,
Myanmar, Pakistan, and the Philippines have performed from poor to average. The
weaker performances of India and of RODA, compared to China, can be traced to a
weaker base of human capital, less openness to foreign trade and investment, and
relatively poor investment climate, compared to Chinese coastal locations.
As a result of its rapid growth, China has emerged with significantly higher per
capita income than either India or RODA, and higher wages – wages have been rising
rapidly in Chinese coastal cities, in real terms. Exchange rate appreciation will
strengthen this tendency for China to be the high-wage producer in developing Asia.
China has also become a major importer of various natural resources including oil,
natural gas, copper, and timber. Looking forward, there are good opportunities for other
developing countries to expand trade with China based on greater resource and labor
abundance (Section 3). There is already some shift of labor-intensive manufacturing out
of China to other Asian developing countries. But to really reap the potential benefits
Asian developing countries need to continue to open up to foreign trade and investment
and to strengthen investment climates. Much of what is important in the investment
climate is determined at the local level, so the next period will see intense competition
among cities to create good environments and attract both firms and talent. It is very
likely that within Asia some cities will do much better than others in this competition.
As noted, the rise of China is a real phenomenon, and China’s continued growth
will be increasingly important for the global economy and for developing economies. In
Section 4 I examine some of the key issues that China faces. The fact that China has

3
grown well for 25 years does not guarantee continued growth. Its demographics,
openness, and investment climate lay a foundation for further rapid growth for 15 years
or so, but the country also faces some new challenges in the short and medium term. In
the immediate future, the trade imbalance between China and the rest of the world is a
real worry; the current situation is not sustainable and China needs to shift its production
to some extent away from exports toward internal needs such as better social services and
higher household consumption.
In the medium term, the resource-intensity of China’s growth is not sustainable.
Energy efficiency has actually declined over the past five years. Inefficient use of energy
is contributing to serious pollution problems, with very high human costs, and also
making China increasingly dependent on an imported commodity that is in ever-scarcer
supply. The third big issue that China faces is that recent growth has been accompanied
by a sharp rise in inequality and by surprisingly little social improvement – so that there
is growing popular demand for more public support to education and health and better
designed safety nets.
Section 5 focuses on implications for the rest of the developing world. Continued
success by China will pose challenges to the rest of the developing world, but also large
opportunities. On the other hand, if China does not do a good job of addressing its
challenges, the consequences for the rest of the developing world will be mostly negative.
I also introduce the idea that in addressing its key challenges, cooperation between China
and the U.S. will be crucial. If the two countries do not cooperate on resolving the trade
imbalance through higher savings in the U.S. and greater consumption in China
(including public spending on health and education), there could be a nasty global

4
recession with high U.S. dollar interest rates and sharply falling commodity prices, which
would create a very poor environment for the rest of the developing world.
Looking to the longer term, China and the U.S. are the two big consumers of energy
and the two big emitters of greenhouse gases. They could cooperate on developing new
energy-efficient technologies and capping greenhouse gas emissions. Or they could
compete to try to lock up declining supply of oil and gas with negative consequences for
global stability and for the global climate. The Stern review suggests that the economic
impact of climate change will be quite devastating for many poor countries, so how
China and the U.S. deal with their energy needs will have major ramifications for the
developing world.
I conclude that the next century is more likely to be a “Multi-polar Century” than
an “Asian Century.” There is too much heterogeneity within Asia to make “Asian
Century” a very useful concept. If current trends continue, the U.S. and China will be the
main sources of global growth. Good cooperation between China and the U.S. on
important global issues such as maintaining an open trading system, resolving global
imbalances, and managing energy scarcity and global climate change could usher in an
era of harmony and successful development throughout much of the world. On the other
hand, if there is poor cooperation and lack of progress on these issues, much of the cost
will be borne by people in the developing world. If India continues its recent strong
growth performance it will become a third significant force in the global economy, and
one can imagine scenarios in which China stumbles while India surges ahead. So “multi-
polar” seems a good adjective to describe this moment in global economic history.
1. The rise of Asia?
5
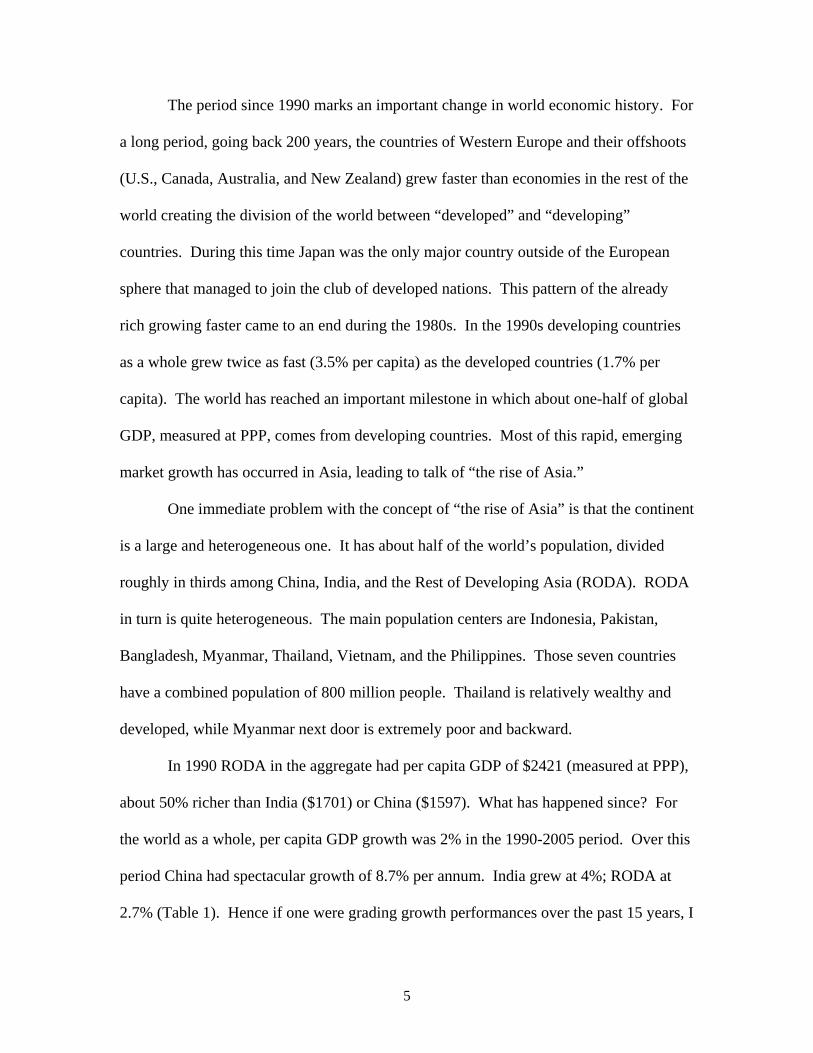
The period since 1990 marks an important change in world economic history. For
a long period, going back 200 years, the countries of Western Europe and their offshoots
(U.S., Canada, Australia, and New Zealand) grew faster than economies in the rest of the
world creating the division of the world between “developed” and “developing”
countries. During this time Japan was the only major country outside of the European
sphere that managed to join the club of developed nations. This pattern of the already
rich growing faster came to an end during the 1980s. In the 1990s developing countries
as a whole grew twice as fast (3.5% per capita) as the developed countries (1.7% per
capita). The world has reached an important milestone in which about one-half of global
GDP, measured at PPP, comes from developing countries. Most of this rapid, emerging
market growth has occurred in Asia, leading to talk of “the rise of Asia.”
One immediate problem with the concept of “the rise of Asia” is that the continent
is a large and heterogeneous one. It has about half of the world’s population, divided
roughly in thirds among China, India, and the Rest of Developing Asia (RODA). RODA
in turn is quite heterogeneous. The main population centers are Indonesia, Pakistan,
Bangladesh, Myanmar, Thailand, Vietnam, and the Philippines. Those seven countries
have a combined population of 800 million people. Thailand is relatively wealthy and
developed, while Myanmar next door is extremely poor and backward.
In 1990 RODA in the aggregate had per capita GDP of $2421 (measured at PPP),
about 50% richer than India ($1701) or China ($1597). What has happened since? For
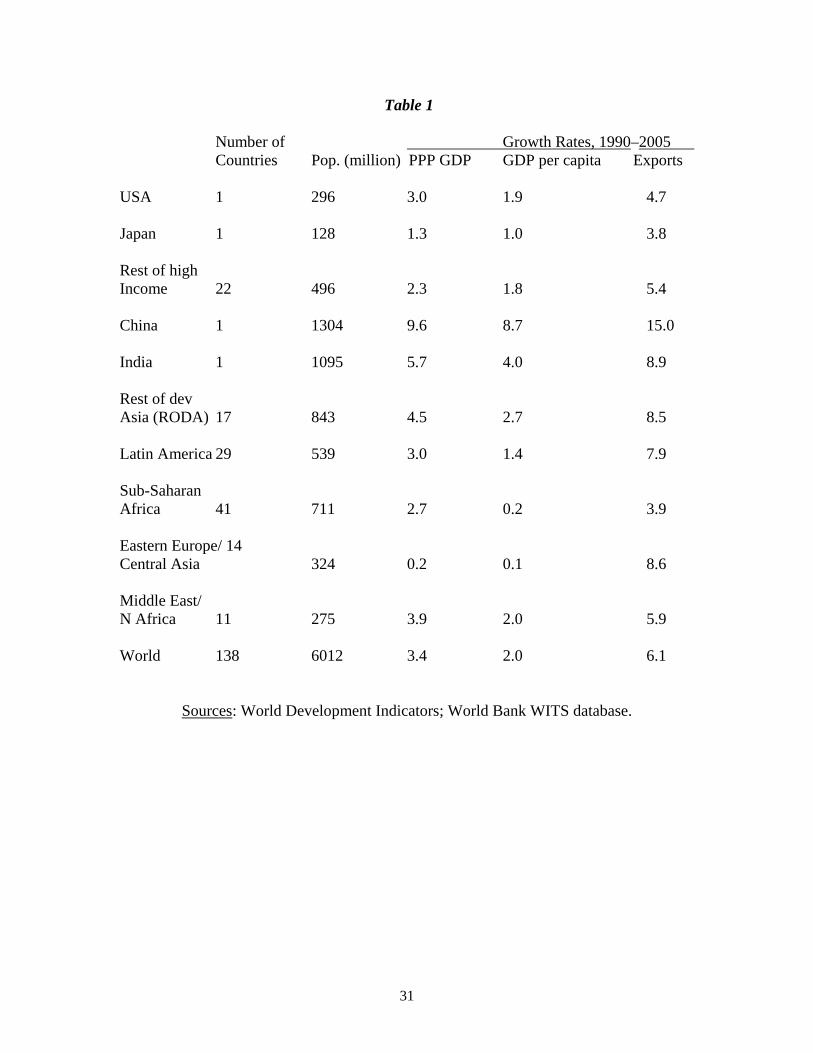
the world as a whole, per capita GDP growth was 2% in the 1990-2005 period. Over this
period China had spectacular growth of 8.7% per annum. India grew at 4%; RODA at
2.7% (Table 1). Hence if one were grading growth performances over the past 15 years, I
6
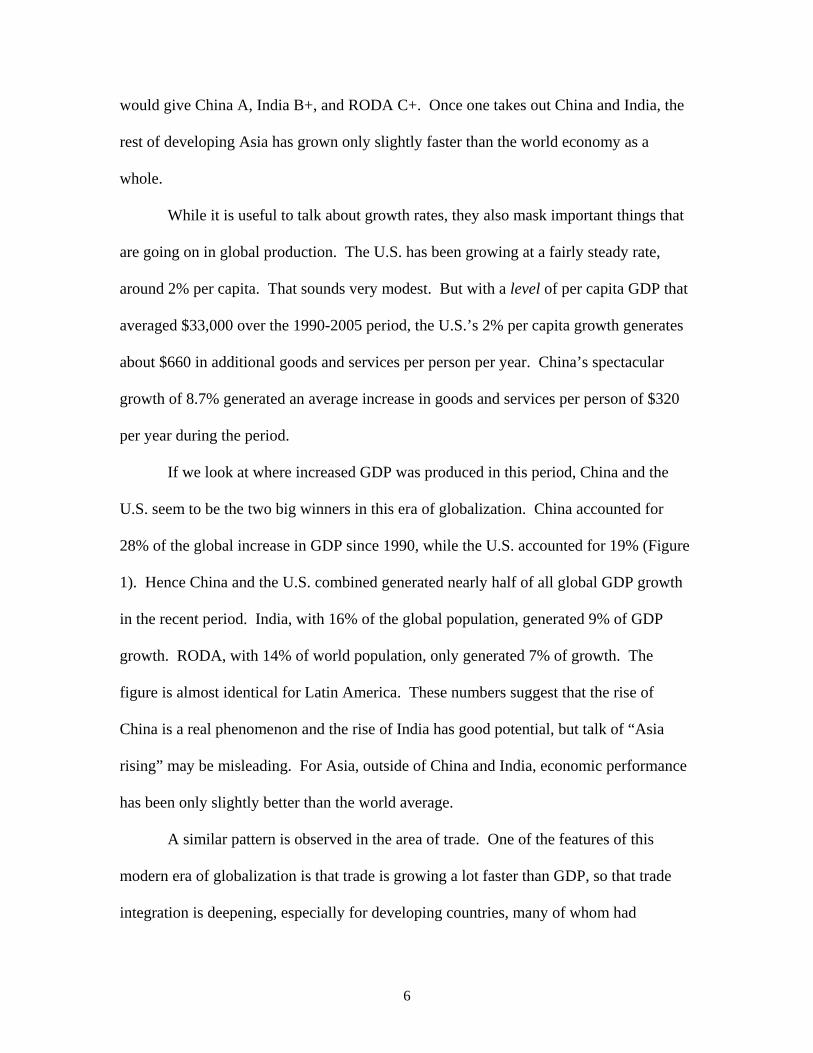
would give China A, India B+, and RODA C+. Once one takes out China and India, the
rest of developing Asia has grown only slightly faster than the world economy as a
whole.
While it is useful to talk about growth rates, they also mask important things that
are going on in global production. The U.S. has been growing at a fairly steady rate,
around 2% per capita. That sounds very modest. But with a level of per capita GDP that
averaged $33,000 over the 1990-2005 period, the U.S.’s 2% per capita growth generates
about $660 in additional goods and services per person per year. China’s spectacular
growth of 8.7% generated an average increase in goods and services per person of $320
per year during the period.
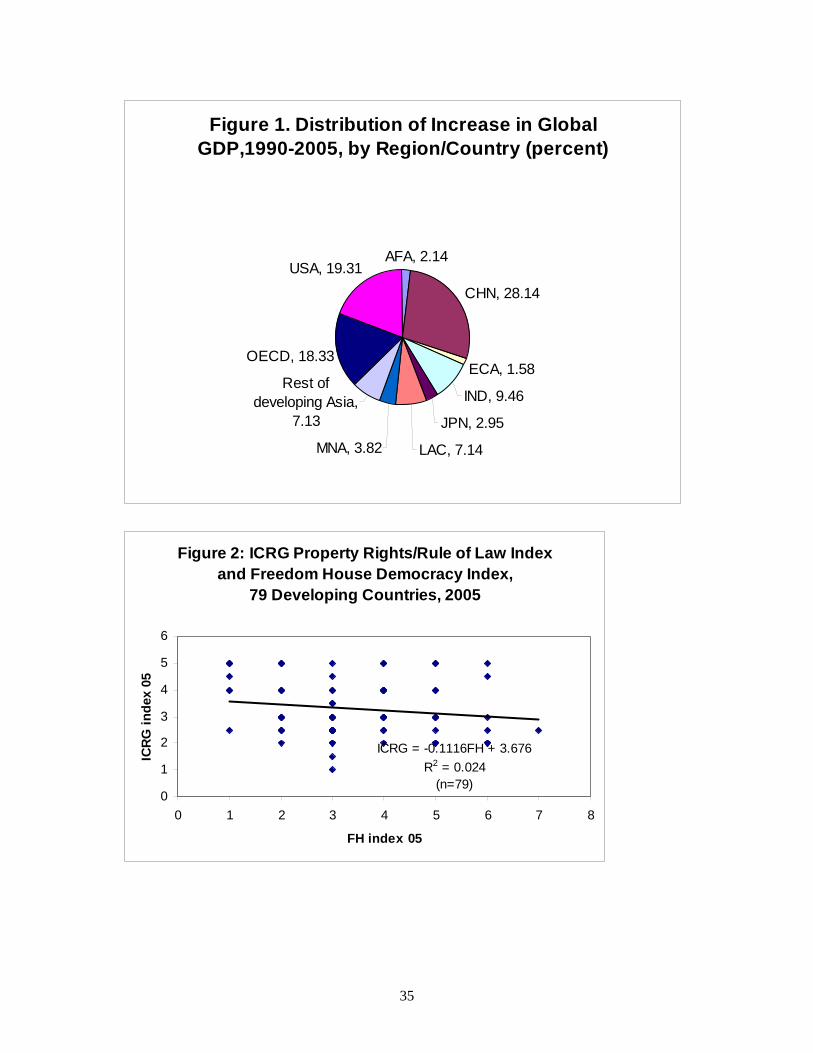
If we look at where increased GDP was produced in this period, China and the
U.S. seem to be the two big winners in this era of globalization. China accounted for
28% of the global increase in GDP since 1990, while the U.S. accounted for 19% (Figure
1). Hence China and the U.S. combined generated nearly half of all global GDP growth
in the recent period. India, with 16% of the global population, generated 9% of GDP
growth. RODA, with 14% of world population, only generated 7% of growth. The
figure is almost identical for Latin America. These numbers suggest that the rise of
China is a real phenomenon and the rise of India has good potential, but talk of “Asia
rising” may be misleading. For Asia, outside of China and India, economic performance
has been only slightly better than the world average.
A similar pattern is observed in the area of trade. One of the features of this
modern era of globalization is that trade is growing a lot faster than GDP, so that trade
integration is deepening, especially for developing countries, many of whom had

7
followed inward-oriented strategies up to the 1980s. Global per capita GDP growth has
averaged 2% since 1990, aggregate GDP growth 3.4% (adding in population growth),
while merchandise export growth has been 6%. For China, export growth has been a
spectacular 15.0% per year; for India, 8.9%; for RODA, 8.5% (Table 1).
Since China, India, and RODA all had similar per capita GDP in 1990, it is
natural to inquire why their growth performances have been so different. This is
obviously a complex question involving many factors. I would highlight three factors in
particular that help to explain the divergent growth performances. First, China had a
better base of human capital in 1990 compared to India or RODA. Second, over this
period China has been more open to foreign trade and investment than India or RODA.
Third, China has created a better investment climate for the private sector than India,
which in turn had a better climate than RODA on average. The qualifier “on average” is
important because Thailand, for example, had quite a good investment climate and grew
well, but it is a relatively small part of RODA, dwarfed in size by Indonesia, Bangladesh,
and Pakistan.
In the area of human capital, it is important to note that China’s advantage has
historical roots. Already in 1870, 21% of adults in China were literate – since nearly all
of these would have been males, this means that about 40% of adult males were literate.
In South Asia the literacy rate in 1870 was 3% of the adult population, about the same as
in Africa. Latin America had a literacy rate of 15% in 1870 (Morrisson and Murtin,
2005). In 1990, even though China was poorer than India or RODA, it had a more
educated population. Average years of schooling of the adult population in China was
5.2 years in 1990, compared to 3.7 in India or 3.5 for the rest of developing Asia (Barro

8
and Lee, 2000). The superior human capital of China can be seen as well in infant
mortality data, which are a good summary indicator of health status. In 1990 China’s
infant mortality rate was 38 per 1000, far below India’s 80 or RODA’s 69 (Table 2).
Despite its good human capital, in 1990 China had about the same per capita income as
Bangladesh, India, Pakistan, and Vietnam, and was substantially poorer than Indonesia,
Philippines, and Thailand. It is hard to get reliable data on wages, but the available data
suggest that China had wages somewhat lower than those in Bangladesh, India, and
Pakistan, and far behind those in the more advanced Asian developing countries (Table
3).
The Chinese refer to their reform program as “Gai ge kai fang,” which translates
as “change the system, open the door.”1 The whole reform program is often referred to in
brief as the “open door policy.” This highlights that a key component of Chinese reform
has been trade liberalization and opening up to direct foreign investment, but not opening
the capital account more generally to portfolio flows. By 1990 China’s economy was far
more open than those of the other low-wage countries in Asia: China’s average import
tariff was 40%, well below those of Bangladesh (94%), India (82%), or Pakistan (65%).
Thailand (40%) had the same average tariff rate in 1990; the Philippines (28%) and
Indonesia (21%) were more open still, but with significantly higher wages they were not
competing directly with China (Table 3). After joining the WTO China’s average tariffs
have dropped below 10%, and to around 5% for manufactured imports.2 It initially
welcomed foreign investment into “special economic zones,” but it is important to note
that some of these were very large, amounting to urban areas of 20 million people or
more. The positive impact of foreign investment in these locations led to a more general

9
opening up of the economy to foreign investment, with the result that China has become
the largest recipient of direct investment flows in recent years. Thus, compared to other
labor-abundant countries in Asia, China has been more open to foreign trade and
investment.
The opening up measures would not have had such substantial impact if they had
not been accompanied by improvements in investment climate. This is probably one of
the least understood features of China’s recent development. There are literally dozens of
Chinese coastal cities that have developed quite good investment climates. In these cities
the private sector accounts for 90% or more of manufacturing assets and production. A
genuine Chinese private sector has emerged that is highly profitable: in 2005 average pre-
tax rate of return for domestic private firms was around 20%, similar to that for foreign-
invested firms (Dollar and Wei, 2006). World Bank investment climate surveys have
documented the differences in the objective conditions of production in Chinese cities,
compared to ones elsewhere in developing Asia. For example, firms lose a lot of output
as a result of unreliable power supply: 3.3% of output in Indonesia, 4.9% in Pakistan,
5.9% in Philippines, 7.9% in India. The figure for coastal Chinese cities was 1.0% (Table
4). Similarly, most manufacturing firms are importing some parts and material: customs
clearance time for imports is low in Chinese cities (3.2 days) compared to those in
Indonesia (4.8), India (6.6), Philippines (7.2), Bangladesh (10.6), or Pakistan (17.1).3
On a whole range of practical matters that affect production, Chinese coastal cities
outperform the best locations in Bangladesh, India, Indonesia, Pakistan, and the
Philippines. The only large Asian countries that have similarly good investment climate

10
indicators are Thailand and Vietnam, both of which have grown quite well – though not
as fast as China – in the recent period.
In summary, China, India, and RODA entered this recent era of globalization with
similar per capita GDP and wage levels. But China has done more to open its economy
to the global market, while significant numbers of its coastal cities have created sound
investment climates for private investment. The result has been a remarkable dynamic of
growth. India has followed a similar path, but more slowly in terms of opening up the
economy and with less success in creating good investment climates.4 The rest of
developing Asia has some pockets of notable success such as Malaysia, Thailand, and
Vietnam, but other large population centers such as Indonesia, Bangladesh, Pakistan, and
the Philippines have been held back, primarily by poor investment climates and weaker
connections to the global market.
3. Prospects for the rest of developing Asia
The world economy and global trade grew well in the 1990-2005 period, and the
countries of developing Asia, outside of China, did not take full advantage of the
opportunities offered by this growth. There is reason to be cautiously optimistic that in
the next period India and the economies of RODA will perform better. In the 1990s
many of the countries of Asia were competing directly with China, which was a labor-
abundant economy that was largely self-sufficient in natural resources. China’s success,
however, has changed the equation going forward. Wages have risen rapidly in coastal
cities of China. Population growth, 1990-2005, was much slower in China (0.9% per
annum) than in India (1.7%) or RODA (1.8%). So, China will have an increasingly tight
labor market, combined with a likely exchange rate appreciation. Manufacturing wages

11
in China are now two to three times as high as wages in Bangladesh, India, Pakistan, or
Vietnam (Table 3). In China’s good coastal locations manufacturing wages now reach
$2400 per year. Compared in a common currency, the wage gap between China and the
rest of developing Asia is likely to widen rapidly. Thus, comparative advantage in the
more labor-intensive production processes will shift away from China – this is already
happening.
At the same time, China has emerged as a large net importer of natural resources
such as oil, gas, timber, copper, and other minerals. Looking ahead, the rest of
developing Asia will thus be significantly more labor abundant and more resource
abundant than China. Rather than competing with China, as in the recent period, the rest
of developing Asia is looking toward an era in which its economies are more
complementary to an increasingly developed China—providing good opportunities for
mutually beneficial trade. Since China joined the WTO at the end of 2001 its imports
from the rest of Asia have been rising at more than 20% per year.
Already there is some evidence of improved economic performance in the rest of
developing Asia. For India, per capita growth accelerated from 3.5% in the 1990–2000
period to 5.1% in the subsequent five years. For RODA there was some growth
acceleration as well, though less dramatic: from 2.6% per annum (1990–2000) to 2.8%
(2000–2005). This acceleration can be seen in some of the major countries of RODA:
growth accelerated from 2.0% to 3.8% in Bangladesh; from 5.1% to 6.2% in Vietnam;
from 3.2% to 4.0% in Thailand; and from 2.1% to 2.2% in Pakistan.
Taking even more advantage of the opportunities that growth in China and the
global economy presents will require that the economies of India and RODA rectify the

12
main deficiencies that held them back in the recent period: being more closed to global
trade and direct investment than China, and having too many severe bottlenecks in the
investment climate. Progress on the trade side is easier. Vietnam recently joined the
WTO and in the process significantly liberalized its import regime, to an average tariff
rate of 14%. Bangladesh (average 2004 tariff of 18%), India (28%), and Pakistan (16%)
have lowered their trade barriers, though all are still less open than China (Table 3).
Progress on the investment climate front is more difficult, because typically there
are important special interests that benefit from cumbersome customs procedures or
complicated regimes of regulations and permits that make it difficult to start and operate
firms. Many of the important aspects of the investment climate are actually determined
by local government because local regulations and zoning (over land for example) are
critical, and because local government often has discretion in implementation of matters
that in theory are set at the national level.
In practice then we are seeing a lot of competition among cities to create better
investment climates and attract both firms as well as talented workers. This competition
among cities will be one of the hallmarks of the next 15 years. Most of the countries of
developing Asia have achieved macroeconomic stability and a trade and investment
regime that is open on paper. Competition then moves to the more micro level: which
locations can create good environments for firms to start up, access finance, find skilled
labor, and connect to the global market? The cities that succeed will be the centers of
growth in the coming period.
Some critics of globalization have feared that competition would lead to a “race to
the bottom,” but in fact the opposite seems to be happening: a “race to the top.” A World

13
Bank study of investment climate in 120 Chinese cities found that the ones that had
created a good climate for private investment had also done the best job in terms of
meeting social and environmental objectives (World Bank, 2006). In the cities with good
investment climates wages have risen rapidly leading to other social advances such as
low unemployment, low infant mortality, and high levels of investment in education.
Somewhat surprisingly, the best investment climate cities also had better environmental
indicators such as more clean airs days per year, more green space per capita, and more
industrial waste properly treated. This correlation likely arises from a number of
different sources. The same effective governments that create non-bureaucratic and
efficient production environments for private firms, seem to be better at meeting human
needs as well. Also, as cities prosper and move up the value chain to more sophisticated
products, it becomes increasingly important that they have good living environments in
order to attract and retrain the best talent. At the high end of the value chain, a good
living environment is a crucial part of a good investment climate.
I have not said anything so far about political developments. The reason for this
is that political developments are much harder to predict than economic outcomes. Also,
in developing Asia there is no clear relationship between political systems and good
economic governance. Good economic governance provides wide economic
opportunities to the populace through measures such as broad-based public education,
sound investment climate to start firms, and openness to the global market to permit
division of labor and specialization. While governance is hard to measure, researchers
have often used ICRG’s property rights/rule of law index as a summary measure of
economic governance and Freedom House’s political index as a measure of democracy.

14
Based on those indicators, among Asian developing countries, there are democracies with
strong poverty rights/rule of law (Malaysia, Thailand, and India) and democracies where
property rights/rule of law are measured to be less good (Bangladesh, Indonesia,
Philippines). Similarly, there are less politically open countries measured by ICRG to
have strong property rights/rule of law (China, Vietnam) and those measured to be less
strong (Myanmar, Pakistan).
This pattern is similar throughout the developing world. If one leaves developed
countries out of the analysis, there is no correlation between democracy as measured by
Freedom House and ICRG’s property rights/rule of law index (Figure 2).5 In the very
long run there is likely to be a relationship: all the fully industrialized countries have both
good economic governance and liberal democracy. But the lack of correlation between
democracy and economic governance among developing countries suggests that the
relationship is a long-run one, and probably a complex one with causality running both
ways. Good economic governance leads to sustained growth, higher incomes, and a
broader civil society, which are promising foundations for political reform. Well-
functioning democracy in turn provides a mechanism of accountability and checks and
balances on decision-making that tends to prevent the worst economic mistakes. (While
democracies and authoritarian states tend to grow at about the same average rate, the
growth rates of authoritarian countries have greater dispersion suggesting that
authoritarian states tend to really get it right or really get it wrong, without much
corrective mechanism.)
4. China’s challenges

15
China accounted for 28% of global growth between 1990 and 2005. Going
forward, China is likely to account for an even larger share of global growth in the next
15 years. If the growth rate of each region remained the same as in the past 15 years,
then China would account for half of all the growth in the world over the next 15. The
reason that the same growth rates produce a larger share for China is that its weight in the
global economy is increasing rapidly. Now, it is unlikely that China can maintain a
spectacular growth rate of around 9%, but it certainly has the potential to continue to
grow in the 7% range. Its demographics, good investment climate, and growing
integration with the global economy mean that the basic foundations of rapid growth
remain in place. If China’s growth rate averages 7%, while the rest of the world performs
as it did in the 1990–2015 period, then China would account for 37% of all global growth
in the next period. In that scenario the U.S. would account for 16% of global growth and
India 12%, so that these three large economies would account for about two-thirds of all
the growth in the world.
Thus, how well the world economy performs will depend a lot on China, and
hence the external environment for other developing countries will depend a lot on
China’s performance. Because China has had impressive economic success in the past
two decades, many outside observers (and investors) naively assume that the success will
continue. But the past is no guarantee of success; in the immediate future China faces
challenges of macroeconomic management that it has not faced before. It also faces
medium-term challenges of resource scarcity and growing inequality and social tension.
How well China manages these problems will have a large effect on the rest of the world.
A. Macroeconomic adjustment

16
While China has grown well since 1990, it is remarkable how much savings and
investment this has required. Since 1990 China’s investment has been growing more
rapidly than consumption – either household or government consumption. Much of this
capital formation has been aimed at external markets, and China’s export volume has
grown much faster than its GDP (so that trade to GDP keeps rising). Export orientation
has been a good development strategy for China. And in recent years its tendency in that
direction has been exacerbated by U.S. policy. U.S. fiscal stimulus after 9/11 was a
positive factor in the world, and 2004 was the best year of growth for the world economy
in 30 years. But with the U.S. and world economies growing well, there is no longer a
macroeconomic justification for such large stimulus. Yet the shift in the U.S. fiscal
position – from surplus to deficit – has been on the order of 6–7 percent of GDP. The
U.S. is now set to run large fiscal deficits into the foreseeable future. The deficit,
combined with low private savings in the U.S., then drives a large external imbalance.
The U.S. is borrowing $800 billion per year from abroad to finance its shortfall of
savings. The large trade deficit of the U.S. is necessary as long as the U.S. needs this
level of external finance.
So, U.S. policy has acted as a giant vacuum cleaner aimed at a Chinese
production machine that was already oriented towards exports. In some sense the U.S.
stimulus accelerated development that was likely to take place in China anyway, but at a
more gradual pace. This acceleration is great for China in the short run, but creates some
real adjustment problems ahead. Since joining the WTO in 2001, China’s exports have
grown at 29% per year, and its imports at 26%. Its real investment has increased at 14%
per year. These rates are clearly not sustainable. China is now a large player in the world

17
market (second largest trader after the U.S.), and it would have to find huge new external
markets every year to keep this up. And the U.S. cannot go on borrowing at its current
rate forever. But getting out of this co-dependency is no simple matter.
The smooth adjustment in this situation requires an increase in savings in the
U.S., partly through slower growth of private consumption and partly through a lower
fiscal deficit (probably through some combination of expenditure reduction and tax
increases). On the Chinese side, there is a need to encourage consumption. Further real
appreciation of the renminbi would push in this direction. Structural measures such as
collecting dividends from state enterprises, better pension and health insurance schemes,
and more public spending on health and education would both meet human needs and
tend to direct the economy away from investment and exports.
It is quite possible, however, that this adjustment could go badly. On the U.S.
side, rising dollar interest rates and the end of the housing bubble could lead to a sharp
contraction of consumption and a significant slowdown in global growth. The magnitude
of interest rate rise will depend to some extent on the willingness of foreigners to
continue to increase their holdings of U.S. bonds. If the world loses confidence in U.S.
assets, then there could be the unpleasant combination of high interest rates and global
recession.
On the Chinese side, a lot of capital stock has been built up in this boom to export
to the U.S. market, and the growth of the capital stock in export industries continues to
this day to expand at a rapid rate. As U.S. demand slows down and the real exchange
rate appreciates, however, a good chunk of that investment will turn out to be
unprofitable. Those firms will not be able to service their loans, and non-performing

18
loans will build up in the banking system. This happens in any boom in a market
economy, and a robust financial system can deal with these problems pretty quickly.
Unprofitable firms are forced into bankruptcy, their assets disposed of, and business goes
on. But China has had a very big boom, and its banking system is still weak. There has
been some reform of banking practices and regulatory supervision, and a small amount of
private entry into the sector. We will only find out how deep this reform is when the
economy experiences some kind of shock that requires the financial system to play this
disciplining and restructuring role.
B. Natural resource scarcity
If China and the U.S. can successfully manage this structural adjustment and
continue to grow well, natural resources will be one of the key constraints that China then
has to confront. The rate at which the Chinese economy has been using natural resources
in recent years is unsustainable. This is clearest in the area of energy. While China is
relatively well endowed with coal, it appears so far to be scarce in oil and natural gas.
Over the past 15 years China’s oil imports have been growing rapidly (at more than 30%
per year in volume terms), and it has emerged as the second largest importer behind the
U.S. Before long it will emerge as the largest importer. Given the supply situation in the
world and the fact that much oil and gas come from politically unstable countries, this is
clearly a risk factor for the country’s future.
While it is inevitable that energy use will grow with China’s economy, much
could be done to increase the energy efficiency of China’s development. For specific
industrial processes, China uses more energy than OECD countries. Its residential space
heating is highly inefficient, using 50–100% more energy than is used in OECD countries

19
with comparable climates. Given the rapid pace of housing construction, enforcing strict
standards now would make a big difference for future energy demand. So too with auto
standards. Thirty percent of the buildings and 60% of the cars that will be in use in five
years have not been built yet. Energy use and air pollution could be dramatically reduced
by enforcing strict energy efficiency standards for both buildings and vehicles. Air
pollution has become a serious problem in China. Of the 30 most air-polluted cities in the
world, 20 are in China. The air pollution results from the combination of (1) coal use for
power, industry, and home heating and (2) growing motorization.
Despite its extreme scarcity, many energy prices are low in China. The retail
price of gasoline (about 50 cents per liter) is below the U.S. level and far behind other
OECD countries such as Japan or Western Europe, encouraging inefficient motorization.
China’s cheap gas policy is an important factor encouraging the development of a car
culture. China in many ways is following the U.S. policy of car-led development from
the 1950s, a policy in which the U.S. built an impressive highway system and guaranteed
cheap gas to consumers. Whether or not this has been a good policy for the U.S. is
debatable, but in China’s case the fact that the country is much more densely populated
than the U.S. and that petroleum worldwide is increasingly scarce makes this a very
questionable development choice.
China’s leaders recognize the importance of energy scarcity. In recent years
China’s energy use has risen faster than GDP. For the next five-year plan the
government has set an extremely ambitious target of increasing energy efficiency by
20%. The key elements of an energy policy to meet this target are pricing and standards.
A significant petroleum tax raising the retail price of gasoline could lead to more

20
conservation and also provide a source of funds for urban planning and for public
transportation investments.
China is already the second largest emitter of greenhouse gases, after the U.S.,
and is projected to emerge by 2010 as the largest emitter. So, an important question for
the world will be whether China and the U.S., together with the other major industrial
producers, can cooperate on energy efficiency and control of greenhouse gases. Under
any scenario, demand for oil and gas (and hence prices) are likely to remain high, and the
global climate is likely to become warmer. With sound energy policies and new
technologies, the world can achieve a result of high but stable energy prices and
mitigation of climate change. Without better cooperation and policies, on the other hand,
the world could face some bad scenarios of climate change and competition over ever
scarcer oil and gas resources.
C. Can the transformation be harmonious?
China should be praised for achieving the most rapid poverty reduction in history.
The World Bank estimates that the number of people living on $1 per day (measured at
PPP) declined from over 600 million at the beginning of economic reform to 135 million
in 2004 (World Bank, 2007). The country is on track to eliminate $1 per day poverty by
2015. While poverty has been reduced, however, there has been mounting inequality in
recent years that has generated social tension. Roughly speaking, urban real incomes
have been growing at about 12% per year while rural real incomes have grown at 5–6%.
The rural-urban income gap in China is one of the largest observed in the world, fueling
massive migration from the countryside to cities. Already about 200 million people have

21
relocated. In the next 10–15 years it is likely that another 200 million will move from
countryside to city.
China’s Gini coefficient has risen from .25 at the beginning of reform to .41
today. Some increase in inequality was inevitable, starting from the 1978 situation, and
.41 is not high compared to Gini measures of inequality in large Latin American
countries (for example, Brazil .58 or Mexico .50). But still, the rapid recent increase is a
real worry. China’s recent growth is also having surprisingly little effect on social
welfare. Infant mortality declined at a rate of 2.5% per year since 1990. This rate is
higher than in Pakistan (1.5%) or India (1.7%), but slower than in other Asian countries
that have not grown as well as China: Philippines (3.0% rate of decline), Thailand
(3.6%), Bangladesh (3.8%), Indonesia (4.7%), or Vietnam (5.2%). High-income
countries in which infant mortality is already low have also managed to continue high
rates of decline (3.6% per annum). In this sense we can say that China’s growth in the
last 15 years has brought less social improvement than one would have expected. The
top leadership in China has recognized this slow social improvement and rising
inequality, and focuses now on developing a more “harmonious society.”
The lack of social progress partly reflects the pattern of growth noted above. A
lot of resources have gone into investment, especially for export. This has created a lot of
jobs and helped many poor families increase their income and move out of poverty. But
government spending has grown less rapidly, and that is reflected in the low share of
GDP that is accounted for by public health expenditure. China spends 2% of GDP on
public health, compared to 3% for other middle-income countries and much higher levels
in rich countries. It spends 2% of GDP on public education, compared to 4% in other

22
middle-income developing countries. China, ironically, has one of the most privatized
health care and education systems in the world in which the majority of expenditure is
paid for privately, out of peoples’ pockets.
Increasing the social benefit of further growth in China will require a number of
measures. One important issue concerns rights over agricultural land. The ongoing
process of urbanization requires alienating some land out of agriculture to urban uses. At
the moment this is handled in an administrative way, with relatively little benefit accruing
to the farmers who are displaced. There are reasons why the country may not want the
full market value of the land to go to individual peasant families, but there is a lot of
scope to increase the compensation to rural families. This would ease their adjustment to
urban life and reduce inequalities. Also, newspaper reports suggest that the current, non-
transparent system is often a source of abuse, leading to unhappiness and growing
protest.
To be fair to local governments, currently they have few sources of revenue to
finance their infrastructure needs and social expenditure. There is a need to overhaul the
inter-governmental fiscal system, to ensure that every community can pay for basic
health and education and to devise sustainable funding sources for local infrastructure.
Adequate financing of local services and a more market-based system of land transfer
would greatly ease the inevitable process of rural-urban migration.
While rural-urban differences are the most striking aspect of inequality in China,
another important dimension is the large gap that has opened up between coastal cities in
the southeast and cities in the interior and northeast of China. The difference in per
capita GDP between coastal cities and interior cities is eight-fold. There are a number of

23
factors at work here; coastal locations have inherent advantages of being close to the
global market. But the inherent advantages are magnified because many coastal cities
have created good investment climates for private investors. Interior cities still tend to be
dominated by state enterprises, which have about one-third the rate of return as private
enterprises (Dollar and Wei, 2006). The mindset of local government in the interior and
northeast is different from along the coast, less investor friendly and more focused on
protecting local firms.
As noted earlier, wages in coastal cities have risen sharply. There is some
ongoing labor migration into these cities, but there is not huge scope for relocation of
population to the existing production centers. A key issue for China is whether more
cities in the interior and northeast can reform their investment climates and attract labor-
intensive production. Many of these cities have 3–5 million people and thus are of scale
for efficient production; most have good transport links as well. Creating a better
investment climate in these cities is critical if China’s growth is to continue smoothly and
if the whole population is to benefit from that growth.
These different challenges that China faces are inter-related. China’s current level
of urbanization – about 40% of the population – is low for its level of income, especially
given the scarcity of arable land and water. Rural-urban migration is a source of growth
as people move from low productivity agriculture to higher productivity urban
employment and also leave the remaining rural population with a better ratio of land to
people. But for this rural-urban migration to proceed relatively smoothly, it is important
that the still large rural population have good public health and education and some assets
that they can bring to the city. Reform of interior cities is important, otherwise too many

24
people will try to move to the coast and create congestion problems. Urbanization is
much more energy-intensive than rural life, hence the explosive growth of energy
demand. Standards for buildings and cars, gasoline prices, and investments in urban
mass transit are critical if the growth of energy demand and its environmental
consequences are to be handled well. For preparation of its most recent urban plan,
Beijing took the unprecedented step of polling citizens about priorities: no surprise for
those of us living in Beijing, the two most important issues on peoples’ minds are
pollution and traffic. Redirecting Chinese production to meet these diverse domestic
needs will be good for China and also a necessary adjustment in the world economy. But
if the financial system does not handle this adjustment well, then a lot of potential output
can easily be lost in financial crisis and its aftermath.
5. The rise of China and implications for the developing world
What I have argued so far is that the “rise of Asia” is something of a myth,
whereas the rise of China is real. For a long time, the health of developing economies
depended to a considerable extent on growth in the largest economy, the U.S. The U.S.
will continue to be important, but as China moves quickly toward becoming the largest
economy in the world, the health of China’s economy will be at least as important to the
developing world as the health of the U.S. economy. Continued success of China will
pose challenges for the rest of the developing world, but also great opportunities. On the
other hand, if China manages its challenges badly, the consequences for much of the
developing world will be negative.

25
One can imagine a whole continuum of outcomes for China, but for expository
purposes I will focus on a scenario in which China handles all of its challenges badly and
one in which it handles its challenges well. The “bad scenario” starts with a sharp global
contraction sometime in the next few years. It will be a contraction with high U.S. dollar
interest rates because the U.S. has not contained its demand for overseas capital, while
the world has diminished interest in purchasing additional U.S. assets. A sharp
slowdown in the world economy would most likely lead to falls in many commodity
prices. So, the contraction could have some similarity to the one in the early 1980s, when
the combination of high interest rates and falling commodity prices led to debt crises in a
range of developing countries, particularly ones that had been dependent on commodity
exports and had prospered in the prior boom.6
In the bad scenario China is likely to have a growth recession as it finds that it can
no longer increase exports at the same rate, but the financial and corporate sectors do a
poor job of reorienting the economy toward domestic demand. There may well be some
significant losses in the banking sector that have to be covered by the government, but the
reservoir of US$1 trillion in reserves means that there is virtually no chance of a serious
crisis. To restore growth the government can resort to fiscal expansion, both social
spending and infrastructure investment, so China is likely to grow fairly well even in the
bad scenario.
A second key aspect of the bad scenario is that China does not succeed in
increasing energy efficiency and resource efficiency more generally. Once the global
recession ends, China will continue to generate large demand for commodities, benefiting
commodity exporters. But without significant increases in energy efficiency, China’s

26
growth is likely to lead to competition over ever-scarcer energy supplies. By the middle
of the century global warming will be a serious issue for the world. The specific numbers
in the Stern report on the economics of climate change can be debated, but there is
certainly a very serious risk that climate change will impose large costs on the developing
world (UK Treasury, 2006).
The third aspect of the bad scenario is that issues of inequality and social harmony
in China are not addressed very successfully. A somewhat reduced growth rate in China
makes it difficult to generate all the jobs needed to absorb surplus rural labor. If interior
cities fail to improve their investment climates, then they will continue to lag behind, and
population will try to cluster in coastal cities, creating self-defeating congestion. The
high level of inequality may well generate rising crime and social conflict.
I hope that the bad scenario sounds scary enough to convince everyone of the
importance of achieving the good scenario. The good scenario depends not just on
China’s management, but also on cooperation between China and the rest of the world,
especially the U.S. Resolving the current global economic imbalance requires
coordinated effort between China and the U.S., in which the U.S. takes fiscal steps to
increase public savings and policy measures to encourage private savings. China in turn
needs to encourage greater consumption through expansion of its pension and health
safety net to reduce household insecurity, increased public spending on education and
health, and further exchange rate appreciation. Managing this well would be the most
important contribution that China and the U.S. can make to healthy growth in the
developing world in the next five years. In the good scenario, more and more of the

27
developing world’s trading opportunities would be in China, rather than the U.S. or other
developed markets.
Looking longer term, the good scenario also has China and the U.S. cooperating
on energy efficiency and curbing greenhouse gases. Some kind of global limits on
greenhouse gas emissions with a trading system will almost certainly be required, and
China and the U.S. will be the keys to reaching this kind of agreement. The right
incentives and subsidies could well usher in a period of technological advance that
addresses energy efficiency but also has all kinds of unpredictable spillover benefits.
The final piece of the good scenario is that China successfully improves the
investment climate in a range of interior cities, while at the same time providing the rural
population with better education, health, water, and other services. The better rural
services equip some people for the successful transition to urban life, while at the same
time making a better life for the large rural population that will remain in agriculture.
These kinds of reforms will tend to keep China in labor-intensive production longer,
posing competition for the labor abundant parts of the developing world (eg, nearby
Vietnam and Bangladesh). At the same time, these reforms would keep China’s
aggregate growth rate higher and make for larger overall demand, creating greater
opportunities in the aggregate for the developing world.
6. Conclusion: a multi-polar century?
The “Asian century” is something of a myth. Looking at the past 15 years, only
China has risen strongly in the global economy. Looking ahead, China has the potential
to continue to grow well and to provide an ever greater market for products from other

28
developing countries. If India sustains its rapid growth of the past five years it will also
become a large player in the global economy. But it would be premature to write off the
rich world. The U.S. in particular, with a relatively dynamic economy and population
growth higher than China’s, is likely to be an important part of global growth in the next
few decades. Successful growth of the global economy in the near future requires that
China and the U.S. smoothly resolve the unsustainable trade imbalance; if they do a poor
job of this, it will have negative repercussions for the developing world.
Looking further down the road, China and the U.S. are the two big users of energy
and the two big emitters of greenhouse gases, and India is coming up strongly. If these
big economies do not reach some accommodation on capping global emissions and
distributing the costs fairly, the best estimates suggest that there will be disastrous
economic consequences for the developing world. Hence the label “multi-polar century”
seems more appropriate than “Asian century.” If things go badly, it will most likely be
because China, India, and the U.S. have cooperated poorly on short-term and long-term
challenges. On the other hand, good collaboration among the existing superpower and
the emerging powers could usher in a long period of harmony and successful
development.

29
References Acharya, Shankar, Ahluwalia, Isher, Krishna, K.L., Patnaik, IIa., 2003. India: Economic
Growth, 1950–2000. Available at http://www.gdnet.org/pdf2/gdn_library/global_research_projects/explaining_growth/India_Complete_31Mar04.pdf.
Barro, Robert J., Lee, Jong-Wha, 2000. International Data on Educational Attainment:
Updates and Implications. NBER Working Paper No. 7911. Available at http://www.nber.org/papers/w7911.pdf.
Deolalikar, Anil, Hasan, Rana, Khan, Haider, Quibria, M.G., 1997. Competitiveness and
Human Resource Development in Asia. Asian Development Review 15(2), 131–163.
Dollar, David R., Hallward-Driemeier, Mary, Mengistae, Taye, 2005. Investment Climate
and Firm Performance in Developing Economies. Economic Development and Cultural Change 54(1), 1–31.
Dollar, David R., Wei, Shang-Jin, 2006. Das Wasted Kapital. Working Paper. Freedom House, 2006. Civil Liberties Index Data. Available at http://earthtrends.wri.org/text/environmental-governance/variable-508.html. Felipe, Jesus, Lim, Joseph Anthony, 2005. Export or Domestic-led Growth in Asia?
Asian Development Review 22(2), 35–75. International Country Risks Guide (ICRG), 2006. Rule of Law Index Data. Available at
http://www.icrgonline.com. Lardy, Nicholas R., 2002. The Economic Future of China. Available at
http://www.asiasociety.org/speeches/lardy.html. Lin, Justin Yifu, 1988. The Household Responsibility System in China's Agricultural
Reform: A Theoretical and Empirical Study. Economic Development and Cultural Change 36(3), S199–S224.
Lin, Justin Yifu, 1992. Rural Reforms and Agricultural Growth in China. The American
Economic Review 82(1), 34–51. Lin, Justin Yifu, 2004. Development Strategies for Inclusive Growth in Developing Asia.
Asian Development Review 21(2), 1–27. Morrisson, Christian, Murtin, Fabrice, 2005. The World Distribution of Human Capital,
Life Expectancy, and Income: a Multi-Dimensional Approach. Available at http://www.paris-jourdan.ens.fr/ydepot/semin/texte0506/MUR2005WOR.pdf.

30
Rawski, Thomas G., 1994. Chinese Industrial Reform: Accomplishments, Prospects, and
Implications. The American Economic Review 84(2), 271–275. Roland-Holst, David, Verbiest, Jean-Pierre, Zhai, Fan, 2005. Growth and Trade Horizons
for Asia: Long-term Forecasts for Regional Integration. Asian Development Review 22(2), 76–107.
Roubini, Nouriel, and Setser, Brad, 2005. Will the Bretton Woods 2 Regime Unravel
Soon? The Risk of a Hard Landing in 2005–2006. Available at http://www.frbsf.org/economics/conferences/0502/Roubini.pdf.
Srinivasan, T.N., 2001. Indian Economic Reforms: Background, Rationale,
Achievements, and Future Prospects. In: Narayana, N. S. S. (ed.) Economic Policy and State Intervention: Selected Papers of T. N. Srinivasan, Oxford and New York, Oxford University Press, pp.230–70.
Great Britain, Treasury, 2006. Stern Review on the Economics of Climate Change,
London, UK, HM Treasury. Available at http://www.hm-treasury.gov.uk/independent_reviews/stern_review_economics_climate_change/stern_review_report.cfm.
Williamson, John, 2005. The Potential of International Policy Coordination. Peter G.
Peterson Institute for International Economics Working Paper. Available at http://www.iie.com/publications/papers/williamson0305.htm.
World Bank, 2006. Governance, Investment Climate, and the Harmonious Society:
Competitiveness Enhancements for 120 Cities in China. Report No. 37759–CN.
31
Table 1
Number of Growth Rates, 1990–2005 Countries Pop. (million) PPP GDP GDP per capita Exports USA 1 296 3.0 1.9 4.7 Japan 1 128 1.3 1.0 3.8 Rest of high Income 22 496 2.3 1.8 5.4 China 1 1304 9.6 8.7 15.0 India 1 1095 5.7 4.0 8.9 Rest of dev Asia (RODA) 17 843 4.5 2.7 8.5 Latin America 29 539 3.0 1.4 7.9 Sub-Saharan Africa 41 711 2.7 0.2 3.9 Eastern Europe/ 14 Central Asia 324 0.2 0.1 8.6 Middle East/ N Africa 11 275 3.9 2.0 5.9 World 138 6012 3.4 2.0 6.1
Sources: World Development Indicators; World Bank WITS database.

32
Table 2
Population GDP p.c. Infant mortality Years of schooling (millions) (2000 US$) (per 1000) (adults above 25) China 1990 1135 1597 38 5.2 2005 1304 5879 26 5.7 India 1990 850 1701 80 3.7 2005 1096 3118 61.6 4.8 Bangladesh 1990 104 1208 100 2.2 2005 142 1786 56.4 2.5 Indonesia 1990 178 2267 60 3.3 2005 221 3437 29.6 4.7 Myanmar 1990 41 n.a. 91 2.1 2005 51 n.a. 75.6 2.4 Pakistan 1990 108 1561 100 2.3 2005 156 2149 80.2 2.5 Philippines 1990 61 3877 41 7.1 2005 83 4401 26 7.6 Thailand 1990 55 4552 31 5.4 2005 64 7649 18.2 6.1 Vietnam 1990 66 1212 38 3.8 2005 83 2739 17.4 n.a. RODA7
1990 613 2209 69 3.5 2005 799 3247 45 4.1
Sources: World Development Indicators; Barro and Lee (2000).

33
Table 3
Average import tariff (percent) Annual manufacturing wages (US$) 1990 2004 1980s 2000 Bangladesh 94 18 556 671 India 82 28 1035 1192 Pakistan 65 16 664 844 Vietnam n.a. 14 n.a. 711 China 40 10 472 1766 Thailand 40 14 2305 2851 Philippines 28 6 1240 2376 Indonesia 21 7 898 3054 Source: UNCTAD TRAINS database; World Development Indicators.

34
Table 4
Average days to claim Output lost to power Imports from customs outages (percent of sales) Bangladesh (2002) 10.6 2.8 India (2002) 6.6 7.9 Indonesia (2003) 4.8 3.3 Pakistan (2002) 17.1 4.9 Philippines (2003) 7.2 5.9 Thailand (2004) 3.7 1.4 Vietnam (2005) 3.7 1.3 Coastal China (2005) Hangzhou 3.5 0.0 Jiangmen 1.7 2.2 Qingdao 2.0 1.1 Shantou 1.8 0.0 Suzhou 2.6 2.2 Weihai 3.6 0.5 Average of six Chinese cities 3.2 1.0 Sources: www.enterprisesurvyes.org; World Bank (2006).
35
Figure 1. Distribution of Increase in Global GDP,1990-2005, by Region/Country (percent)
AFA, 2.14
CHN, 28.14
ECA, 1.58
IND, 9.46
JPN, 2.95
LAC, 7.14MNA, 3.82
Rest of developing Asia,
7.13
OECD, 18.33
USA, 19.31
Figure 2: ICRG Property Rights/Rule of Law Index and Freedom House Democracy Index,
79 Developing Countries, 2005
ICRG = -0.1116FH + 3.676R2 = 0.024
(n=79)0
1
2
3
4
5
6
0 1 2 3 4 5 6 7 8
FH index 05
ICRG
inde
x 05

36
End Notes
1 Early stages of China’s reform are described in Lin (1988) and Lin (1992). See Rawski (1994) on the industrial reforms in the 1990s. 2 Lardy (2002) analyzes the importance of liberalizing foreign trade and investment for China’s modern development. 3 Dollar, Hallward-Driemeier, and Mengistae, 2005, show that these investment climate indicators affect firm productivity and profitability in a study covering Bangladesh, China, India, and Pakistan. 4 India’s reform efforts are described in Acharya et al., 2003; and Srinivasan, 2001. 5 Freedom House ranks political freedom on a scale of 1-7 with 1 most democratic and 7 most authoritarian. ICRG ranks countries’ property rights/rule of law strength on a scale of 1-5 with 1 as poor property rights and 5 as strong property rights. Figure 2 has 79 developing countries for which both data sources are available; some countries have identical data points and thus there are only 34 different combinations in the figure. There is a very slight tendency for more authoritarian countries to have weaker property rights, but the slope is not statistically different from zero and the R-squared of the relationship is 0.02, indicating no correlation. 6 For more analysis of how a hard landing may unfold, see Roubini and Setser, 2005, and Williamson, 2005.


