DI
SC
US
SI
ON
P
AP
ER
S
ER
IE
S
Forschungsinstitut zur Zukunft der ArbeitInstitute for the Study of Labor
Public Sector Employees:Risk Averse and Altruistic?
IZA DP No. 4401
September 2009
Margaretha BuurmanRobert DurSeth Van den Bossche
Public Sector Employees:
Risk Averse and Altruistic?
Margaretha Buurman Erasmus University Rotterdam
Robert Dur
Erasmus University Rotterdam, Tinbergen Institute, CESifo and IZA
Seth Van den Bossche
TNO Work and Employment
Discussion Paper No. 4401 September 2009
IZA
P.O. Box 7240 53072 Bonn
Germany
Phone: +49-228-3894-0 Fax: +49-228-3894-180
E-mail: [email protected]
Any opinions expressed here are those of the author(s) and not those of IZA. Research published in this series may include views on policy, but the institute itself takes no institutional policy positions. The Institute for the Study of Labor (IZA) in Bonn is a local and virtual international research center and a place of communication between science, politics and business. IZA is an independent nonprofit organization supported by Deutsche Post Foundation. The center is associated with the University of Bonn and offers a stimulating research environment through its international network, workshops and conferences, data service, project support, research visits and doctoral program. IZA engages in (i) original and internationally competitive research in all fields of labor economics, (ii) development of policy concepts, and (iii) dissemination of research results and concepts to the interested public. IZA Discussion Papers often represent preliminary work and are circulated to encourage discussion. Citation of such a paper should account for its provisional character. A revised version may be available directly from the author.
IZA Discussion Paper No. 4401 September 2009
ABSTRACT
Public Sector Employees: Risk Averse and Altruistic?*
We assess whether public sector employees have a stronger inclination to serve others and are more risk averse than employees in the private sector. A unique feature of our study is that we use revealed rather than stated preferences data. Respondents of a large-scale survey were offered a substantial reward and could choose between a widely redeemable gift certificate, a lottery ticket, or making a donation to a charity. Our analysis shows that public sector employees are significantly less likely to choose the risky option (lottery) and, at the start of their career, significantly more likely to choose the pro-social option (charity). However, when tenure increases, this difference in pro-social inclinations disappears and, later on, even reverses. Our results further suggest that quite a few public sector employees do not contribute to charity because they feel that they already contribute enough to society at work for too little pay. JEL Classification: H1, J45, M52 Keywords: public service motivation, risk aversion, revealed preferences data Corresponding author: Robert Dur Department of Economics Erasmus University Rotterdam P.O. Box 1738 3000 DR Rotterdam The Netherlands E-mail: [email protected]
* We gratefully acknowledge comments and suggestions by Josse Delfgaauw and participants to the 2009 CMPO Workshop “Public services and worker motivation” in Bristol.
1 Introduction
It is often argued that preferences and work motivations of public sector
employees differ from those of private sector employees. Some of these dif-
ferences stem from sectoral differences in the nature of jobs. Many jobs in
the public sector involve helping people in need or contributing to society at
large, rendering these jobs attractive to people who have a strong willingness
to serve others or the public interest.1 Another, less honorable motivation
for seeking a job in the public sector is avoidance of risk. In most countries,
employers in the public sector offer higher job security and less volatile wage
compensation than employers in the private sector (Clark and Postel-Vinay
2009, Bonin et al. 2007). As a result, highly risk-averse people may find it
attractive to opt for a job in the public sector (Bellante and Link 1981).
This paper employs a unique dataset to assess whether public sector em-
ployees have a stronger inclination to serve others and are more risk averse
than people employed in the private sector. In contrast to previous empir-
ical studies, we explore revealed preferences rather than stated preferences.
Our data come from a questionnaire held in 2000 covering more than 3000
employees in The Netherlands. Upon completing the questionnaire, each
participant was offered a reward worth 25 guilders (11,34 euro; about 15%
of daily disposable household income in 2000). Participants could choose
between receiving a widely redeemable gift certificate, receiving a national
lottery ticket, or donating the reward to a charity of their choice. We hypoth-
esize that, as compared to private sector employees, public sector employees
more likely choose to donate to charity (the safe and pro-social choice) and
less likely choose the lottery ticket (the risky choice) rather than choose the
gift certificate (the safe and selfish choice).
Our results lend strong support to the hypothesis that public sector em-
ployees are more risk averse than private sector employees. People holding a
public sector job are much less likely to choose the lottery ticket rather than
the gift certificate. This holds both before and after controlling for income,
gender, age and several other observable characteristics. The difference is
substantial: Our estimation results imply that the odds for a public sector
1See the large literature in public administration on ‘public service motivation’ (e.g.
Perry and Wise 1990, Perry 1996, Rainey and Steinbauer 1999, Wright 2001) and several
recent theoretical studies in economics (e.g. Dixit 2001, Besley and Gathak 2005, Francois
2007, Delfgaauw and Dur 2008). Perry et al. (2009) and Francois and Vlassopoulos (2008)
provide overviews of these literatures.
1
worker of choosing the lottery ticket rather than the gift certificate are 0.68
times the odds for a private sector worker.
We find only weak evidence for the hypothesis that public sector employ-
ees more likely choose the pro-social option of donating to charity rather
than choose the selfish option of taking the gift certificate. On the contrary,
our analysis reveals that, after controlling for observable individual char-
acteristics, public sector employees are significantly less likely to donate to
charity. The odds for a public sector worker of donating his reward to charity
rather than taking the gift certificate are 0.74 times the odds for a private
sector worker. Behind this average figure is a remarkable relation between
inclinations to donate to charity and employee’s tenure in a public sector
organization. Employees who have just started a job in the public sector are
significantly more likely than their private sector counterparts to donate to
charity rather than to take the gift certificate. However, within a few years,
this difference disappears and later on even reverses. Importantly, we find
no tenure effects for private sector workers’ inclination to donate to charity,
nor does tenure affect the likelihood of choosing the risky option in either of
the sectors. Moreover, the tenure effect for public sector worker’s inclination
to donate to charity remains intact when we allow for public-sector specific
age effects.
This tenure effect is well in line with the observations made by Blau
(1960: 347, 348) in his study of case workers in a public welfare agency.
He finds that “the attitudes of most new case workers toward clients were
strongly positive, if somewhat sentimental and idealistic (...) the new case
worker was typically full of sympathy for clients’ problems. But as he encoun-
tered clients who blamed him personally for not helping them enough, even
though agency procedure limited him, and clients met his trusting attitude
by cheating and lying, the newcomer tended to experience a ‘reality shock’
(...) This disillusioning experience might make a worker bitter and callous,
or induce him to leave the job, and even those who did not have either of
these extreme reactions tended to change their orientation to clients.” “In
sum, experience increased the case worker’s ability to serve recipients but
decreased his interest in doing so.” (Blau 1960: 359). Likewise, Van Maanen
(1975) reports swift declines in motivation among police recruits during their
first year in a big-city department, which are partly accounted for by more
pessimistic beliefs about the likelihood of receiving favorable responses from
the community to ‘working especially hard.’ Similar findings are reported by
De Cooman et al. (2009) using data from a repeated survey among Flemish
2
teachers who just started their professional career. They find that, within
two years time, "work values became somewhat less ideological and more
self-oriented." Further, teachers "attached greater importance to extrinsic
values, including rewards, security, career, and recognition, and less impor-
tance to altruistic values including social service, though these changes were
relatively small." (p. 105-106)2
It is important to note that our analysis gives an indication of people’s
marginal willingness to accept risk and to make charitable contributions;
it does not reveal people’s overall risk aversion or pro-social attitude. The
two need not coincide. For instance, employees in the private sector may
generally be more risk tolerant than public sector employees, but exhibit
more risk averse behavior at the margin because in their professional life
they are already exposed to more risk than public sector employees. Likewise,
public sector employees may be less willing to donate their reward to charity
as they already serve the public interest in their professional life on a day-to-
day basis. Unfortunately, we lack data on how much risk people face and how
much they contribute to the public interest in daily life. However, we do find
some indirect evidence for the idea that public sector employees less likely
donate to charity because they feel they already contribute a lot to society at
work. One of the questions in the survey asked people whether they consider
their salary to be sufficient for the work that they do. People responding
negatively to this question less likely donate their reward to charity rather
than take the gift certificate. Importantly, this effect is significantly stronger
for employees in the public sector, both statistically and economically (the
effect is twice as large). This suggests that public sector employees consider
the contributions they make on the job as a substitute for making charitable
donations. Feeling underpaid explains a large part of the average difference
between pro-social inclinations in the sectors. This is partly due to the
stronger effect of feeling underpaid on public sector employees’ likelihood to
donate. Further, a much larger fraction of employees in the public sector
feel that they are underpaid (56% in the public sector as compared to 42%
in the private sector). Comparing dissatisfied employees in the public and
private sector, we find no significant difference in the early stages of the
career, while later on public sector employees are significantly less likely to
donate. Satisfied public sector employees significantly more often choose to
2Similar patterns have been observed among volunteers, see Tschirhart et al. (2001)
and references therein.
3
donate in the early stage of their career, while later on there is no significant
difference with their private sector counterparts.
Although we can only assess people’s risk and pro-social attitude at the
margin, we do think our results are of great relevance for recent debates
about remuneration of employees in the public sector (see, e.g., Burgess and
Ratto 2003, National Commission on the Public Service 2003, OECD 2005
and 2008). First, measuring tolerance for additional risk of public sector em-
ployees gives some indication of the effects of introducing or strengthening
pay-for-performance for workers in the public sector. Making employees’ pay
more dependent of their performance usually increases the risks employees
face, as their performance not only depends on their effort, but also on ran-
dom events. Our results suggest that public sector employees have a stronger
distaste for taking risks than their counterparts in the private sector, imply-
ing that (with the current workforce) pay-for-performance is a more costly
instrument to induce effort in the public sector than in the private sector.
Second, measuring pro-social inclinations at the margin gives an idea about
how much society can rely on public sector employees’ altruistic motivations
when additional helping opportunities arise. Our results give rise to some
pessimism: Many public sector employees feel that they are underpaid rel-
ative to the contributions that they make, which makes them hesitant to
provide further contributions.
We proceed as follows. The next section briefly describes earlier studies on
differences in preferences and motivations between public and private sector
employees. Section 3 describes the data. Section 4 presents the main results
and Section 5 concludes.
2 Related literature
A rich literature in public administration and a growing number of studies
in economics have examined differences in preferences and motivations be-
tween public and private sector employees. Existing empirical studies can
be divided into two groups: those that use stated preferences or motivations
(e.g., by asking respondents how important job security or helping other peo-
ple is to them) and those that infer preferences and motivations from stated
behavior (e.g., self-reported donations to charity, self-reported purchase of in-
surance, stated willingness to pay for a hypothetical lottery, et cetera). Our
study is the first using revealed preferences data rather than stated prefer-
4
ences data; that is, we use data on what people actually do, not on what
they say they do or what they claim is important to them. This has some
clear and well-known advantages. In particular, stated preferences data may
be vulnerable to self-stereotyping, self-serving biases, lack of attention by
respondents, and strategic motives (Roszkowski and Grable 2007, Dohmen
et al. 2009). For instance, it has been shown that in experiments with hy-
pothetical payments subjects appear more generous and more risk-preferring
than when real money is at stake (Camerer and Hogarth 1999).
Most studies comparing public and private sector workers have assessed
in how far public sector workers have a particular willingness to serve the
public interest, to help others, and to make personal sacrifices in order to do
so. For instance, Rainey (1982) and Lewis and Frank (2002) find that public
sector workers more often rate work attributes such as ‘Useful to society’ and
‘Help others’ as (very) important (see also Kilpatrick et al. 1964, Buchanan
1975, Crewson 1997, Houston 2000, and Steijn 2008 among others). Houston
(2006) uses data on self-reported pro-social behavior, such as volunteering,
donating blood, and making charitable contributions. He finds that nonprofit
and public sector employees are more likely to report being a volunteer and
blood donor, while no such relation is found for charitable contributions.
Likewise, Brewer (2003) shows that public sector employees report higher
levels of participation in nonpolitical civic affairs. Recently, Gregg et al.
(2009) exploit British panel data and find that individuals who are more
inclined to donate labor (as measured by stated unpaid overtime) select into
the non-profit sector.
Other studies have examined whether public and private sector workers
differ in risk preferences. Studies using stated preferences about job security
find mixed evidence (see e.g. Rainey 1982, Crewson 1997, Houston 2000, and
Lewis and Frank 2002). By contrast, Bellante and Link (1981) use answers
to questions like the condition and insurance of cars owned, the use of seat
belts, the extent of medical coverage, and smoking and drinking habits to
construct a measure of risk aversion. They find that, thus defined, risk-averse
people are more likely to be employed in the public sector than in the pri-
vate sector. Likewise, Roszkowski and Grable (2009) use data on clients of
financial planners who had completed a test of financial risk tolerance. They
find that public sector employees score significantly lower than private sector
employees, even after controlling for a rich set of observables. Similar results
are obtained by Hartog et al. (2002) for The Netherlands and by Guiso and
Paiella (2008) for Italy using large-scale survey data on people’s willingness
5
to pay for a hypothetical lottery and for a hypothetical risky security, re-
spectively. Several recent papers in economics have added to this body of
evidence using the 2004 wave of the German Socio-Economic Panel data,
which contains questions on people’s attitude towards risk-taking. Bonin
et al. (2007) show that working in the public sector implies a significantly
lower earnings risk than working in the private sector and that individuals
who are less risk tolerant more likely end up working in an occupation with
low earnings risk. Using the same data, Luechinger et al. (2007) and Pfeifer
(2008) directly estimate the effect of self-reported risk attitude on sector of
employment and report similar findings: people who are less willing to take
risk are more likely to be found in the public sector.
3 Data and empirical strategy
We use data from the TNO Work Situation Survey (TAS), a Dutch survey
developed by TNO (an independent research organization, partly funded by
the Dutch government) in cooperation with the Ministry of Social Affairs
and Employment. The survey was conducted in 2000 among about 8000
employees and self-employed persons in all sectors of the economy. The
response rate was 53%, resulting in 4334 respondents (see Smulders et al.
2001 and Bakhuys Roozenboom et al. 2007).3 The survey includes a rich set
of demographic variables and data on a wide range of work-related topics,
such as employment conditions, pay, hours worked, job and pay satisfaction,
attitude towards work, intention to leave, job security, health-related issues,
and workplace characteristics.
Our key variable of interest is the type of reward chosen by the respon-
dents for completing the survey (see Appendix A for the exact question and
possible answers).4 Respondents could choose between receiving a widely
redeemable gift certificate, receiving a national lottery ticket, or donating
the reward to a charity of their choice. All types of reward had the same
face value: 25 guilders (11.34 euro), about 15% of daily disposable household
3See for more information in English: http://www.eurofound.europa.eu/ewco/surveys/
national/countries/netherlands2005_6_tas.htm4The survey was repeated in 2002 and 2004. We do not use these data in our analysis
because in 2002 the data-collecting company did not report data on our key variable and in
2004 the reward for respondents was substantially lower and differed between completing
the internet questionnaire (10 euros) and the written questionnaire (7,50 euros).
6
income in 2000.
Since respondents indicated their main economic sector in the survey, but
not whether their organization belongs to the public or private sector, we re-
coded the main economic sectors into public or private, using a data file we
obtained on request from Statistics Netherlands. The sectors thus included
in the public sector are education, hospitals, nursing homes, welfare work,
and central and local government. Four economic sectors contain a substan-
tial mix of private and public organizations; we omit these sectors from our
analyses.5 Furthermore, we confine ourselves to employees, leaving out the
self-employed, owners of firms, and (unpaid) family workers. We also restrict
the sample to respondents between 20 and 64 years of age, because there
are very few respondents under 20 years of age and 65 is the regular Dutch
retirement age. These selections leave us with a sample of 3126 respondents.
Our empirical strategy is to examine whether an otherwise comparable
respondent differs in his choice of reward depending on the sector of employ-
ment. If public sector workers are more altruistic and more risk averse at the
margin, we should find that public sector workers are more likely to donate
the reward to charity and less likely to choose the lottery ticket rather than to
opt for the gift certificate. Since our dependent variable has three potential
categorical outcomes (lottery ticket, charity, gift certificate) we analyze our
data using a multinomial logistic regression model. We take gift certificate
as our reference category, as this is the safe and selfish alternative.6
Obviously, the choice of the reward does not only depend on a respon-
dent’s risk preferences and pro-social attitude, but also on other characteris-
tics such as income. People with a low income may be more likely to choose
the gift certificate, as this could be exchanged for basic necessities such as
food or clothing. Therefore, we control for net monthly income in the re-
gression analyses, as well as for whether the respondent is the breadwinner
of his household. Since our categorical income measure is somewhat crude,
5These four sectors are: Other type of industry (which also comprises workers in shel-
tered employment), other type of transport and communication (which includes public
transport), other type of healthcare (among others general practitioners and midwifes)
and culture, sports, and recreation.6We also ran binary logistic regression models (grouping charity and gift certificate as
the safe options; grouping gift certificate and lottery as the selfish options; taking only
the gift certificate as the selfish option, dropping the lottery ticket; and taking only the
gift certificate as the safe option, dropping the charity). All these models produced results
similar to the multinomial logistic regression model and are for brevity not reported.
7
especially in the highest category, we also add managerial position to our
analysis. This is likely to pick up some additional income effects. Moreover,
we include the following demographic controls: Age, sex, region, education,
marital status, and the number of children living at the home.
An important issue is whether public and private sector employees had dif-
ferent attitudes before they sorted into their sector of employment or changed
their attitudes afterwards. To account for such tenure effects, we add em-
ployee’s tenure at the organization and interact it with the employee’s sector
of employment.7 Finally, we check whether feelings of underpayment affect
employee’s choice of reward using the question “Is your salary sufficient for
the work that you do?” and we also interact this variable with the employee’s
sector of employment.
Table 1 contains the descriptive statistics of our subsample. Some inter-
esting differences between public and private sector employees are visible.
First of all, private sector employees choose the lottery ticket (48%) more of-
ten than public sector employees (36%). Public sector employees on the other
hand choose to donate to charity (23%) somewhat more often than private
sector employees (21%). Further, there are substantial differences in socio-
demographic variables. Public sector workers are slightly older on average
than private sector employees, 44 versus 42 years old, and are far more often
female, 42% versus 18%. Public sector employees are (therefore) also less
likely to be the breadwinner in the household than private sector employees
(67% versus 79%). The majority of public sector employees completed higher
vocational education or university studies (66%), against only a minority of
private sector employees (36%). Nevertheless, the differences in income are
not that large. There is, however, a large difference in the answers to the
question “Is your salary sufficient for the work you do?”. Less than half of
public sector employees answers this question in the affirmative (44%), while
more than half of the private sector employees is satisfied with their salary
(58%). Finally, tenure among public sector employees in our sample is also
longer than that of private sector employees, 13.8 versus 11.8 years.
7Unfortunately, we lack data on respondent’s sectoral tenure.
8
4 Results
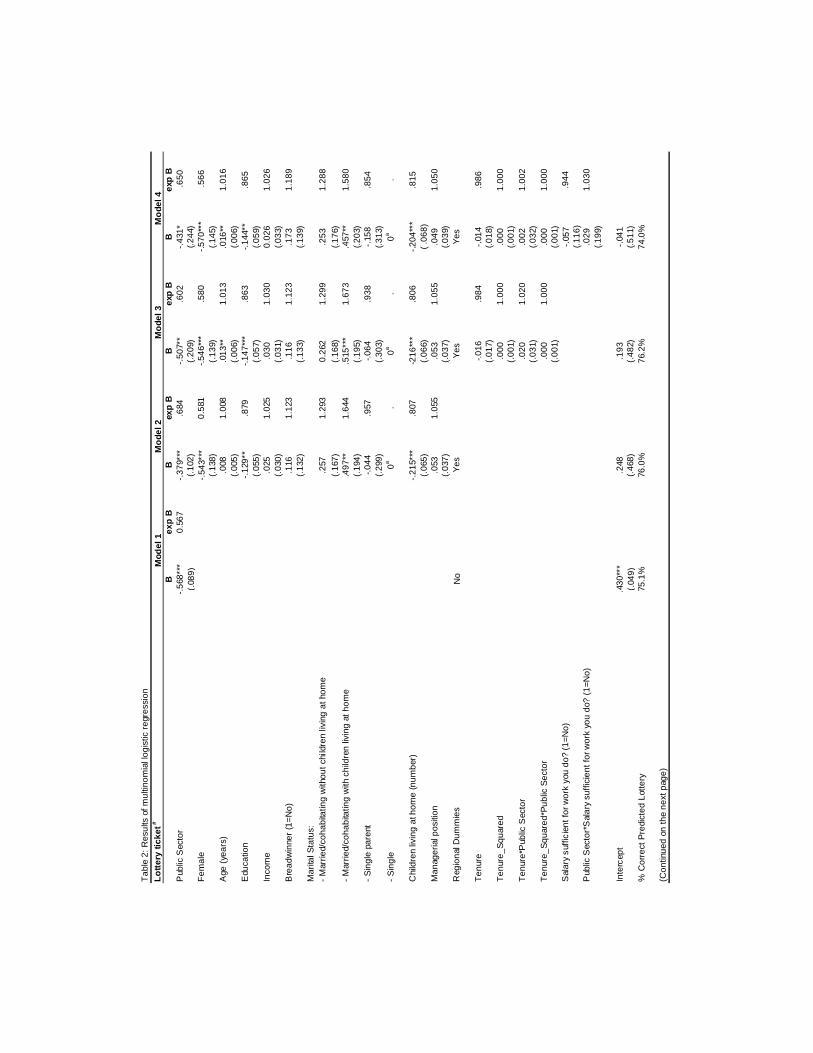
Table 2 reports the results of our multinomial logistic regression analyses.8 In
model 1 we take up the public sector dummy as the sole explanatory variable.
Public sector employees are, as expected, significantly less likely than private
sector employees to choose the lottery ticket rather than the gift certificate.
However, in contrast to our expectations, public sector employees are also
less likely than private sector employees to opt for a donation to charity
rather than for the gift certificate. This effect, however, is not significant
and relatively small. Model 1 only explains little variation in the choice of
reward. Although it does fine in predicting the choice of the lottery ticket, it
performs extremely poor in predicting the choice of the charity. As we noticed
in the previous section, there are many more differences between public and
private sector employees than just sector of employment. Therefore, we add
several controls in model 2.
Remarkably, model 2 shows results quite close to model 1: Compared to
private sector employees, public sector employees are 0.74 times less likely
to choose the charity rather than the gift certificate. This time, the effect is
significant at the 5%-level. Public sector employees are also significantly less
likely to choose the lottery ticket over the gift certificate, as in the previous
model. Our estimation results imply that the odds for a public sector worker
of choosing the lottery ticket rather than the gift certificate are 0.68 times
the odds for a private sector worker.
The choice for the lottery ticket is significantly related to some of the
demographic variables. Women are less likely to choose the lottery ticket
over the gift certificate, as are employees with a higher level of education.
Couples with children living at home are more likely to choose the lottery
ticket than singles. However, the larger the number of children, the less likely
employees choose the lottery ticket. Finally, income and other variables af-
fecting people’s budget do not really matter.9 Income does, however, matter
for donating to charity. All budget-related variables show that as people’s
budget increases, the odds of choosing the charity over the gift certificate
8For ease of presentation, we treated managerial position, income, and education as
continuous variables in table 2. We also ran regressions using the ordinal categories of
these variables. This gave nearly the same results at the same significance levels.9The results for the control variables are close to those of Hartog et al. (2002) and
Dohmen et al. (2009), except for the effect of education, which is positive in these earlier
studies.
9
increase as well. A higher income or higher managerial position increases
the odds of choosing the charity over the gift certificate significantly, as does
not being the breadwinner. Furthermore, some of the demographic variables
also have an effect. Couples with children living at home are less likely to
choose the charity over the gift certificate than singles, although this effect is
only significant at the 10%-level. Older employees are more likely to choose
the charity over the gift certificate, as are employees with a higher level of
education.10 Lastly, note that the fit of model 2 is substantially better than
that of the previous model.11
Model 3 examines whether and if so how public sector workers’ risk and
pro-social attitudes develop during their career. As we discussed in the Intro-
duction, several earlier studies have found that altruistic motivations decline
with tenure among public sector employees (Blau 1960, Van Maanen 1975,
and Cooman et al. 2009). We therefore add to model 2 employee’s tenure at
the organization as well as tenure interacted with the employee’s sector, and
similarly for tenure squared to allow for nonlinear effects.12 Tenure does not
affect the chances of taking the lottery ticket rather than the gift certificate
in either of the sectors. Figure 1a plots the point-estimates of the combined
public sector dummies against tenure. Clearly, public sector employees are
significantly more risk averse than private sector employees for almost all
levels of tenure and there is no clear pattern in this difference over people’s
tenure. However, we do find strong tenure differences for public sector em-
ployees in the odds of taking the charity rather than the gift certificate, while
there is no such tenure effect for private sector employees. Figure 1b, which
is again based on the estimation results of model 3, shows that at the start
of their careers, public sector employees are more likely to donate to charity
rather than take the gift certificate than their private sector counterparts,
although this is effect is not significant. After a few years, this (insignificant)
10Houston (2006) reports similar findings for these socio-demographic variables, except
for gender. He obtains a significant positive effect of being female on the odds of donating
to charity, whereas we find a negative, but not significant effect.11We included ethnic minority, firm size, and age squared as additional contols in pre-
vious regressions. However, as those variables had no significant effect, we left them out
of our final regressions.12We also ran regressions including interaction terms of age and public sector so as to rule
out that any possible tenure effects are actually driven by respondent’s age. The interaction
effect with age was never significant, nor did it change the effects and significance of tenure.
Obviously, since our data are cross-sectional, we can not completely rule out that tenure
effects are intertwined with cohort effects.
10
positive effect has disappeared and even reverses. Indeed, during the main
part of their careers, public sector employees are significantly less likely to
donate to charity than private sector employees.
One of the reasons for a negative effect of tenure on pro-social inclina-
tions of public sector employees might be that their tenure-wage profile is
flatter than that of private sector employees, which may give rise to grow-
ing feelings of underpayment. We control for these feelings of underpayment
using the variable “Is your salary sufficient for the work that you do?” and
its interaction with the public sector dummy. We are particularly interested
in whether public sector employees’ likelihood of donating to charity is more
strongly affected by feelings of underpayment than that of private sector
employees. This would support the idea that donations to charity and con-
tributions to society at the workplace are considered as substitutes by public
sector employees.
Model 4 shows no significant effect of feeling underpaid on the odds of
choosing the lottery ticket over the gift certificate. The other coefficients
explaining the choice of the lottery over the gift certificate are not much
affected. Figure 2a plots the point-estimates of the combined public sector
dummies for employees who think their salary is sufficient for the work they
do. During the main part of their career public sector employees are signif-
icantly less likely to choose the lottery ticket over the gift certificate than
private sector employees. This pattern is almost identical for employees who
do feel underpaid, as we can see in figure 2b.
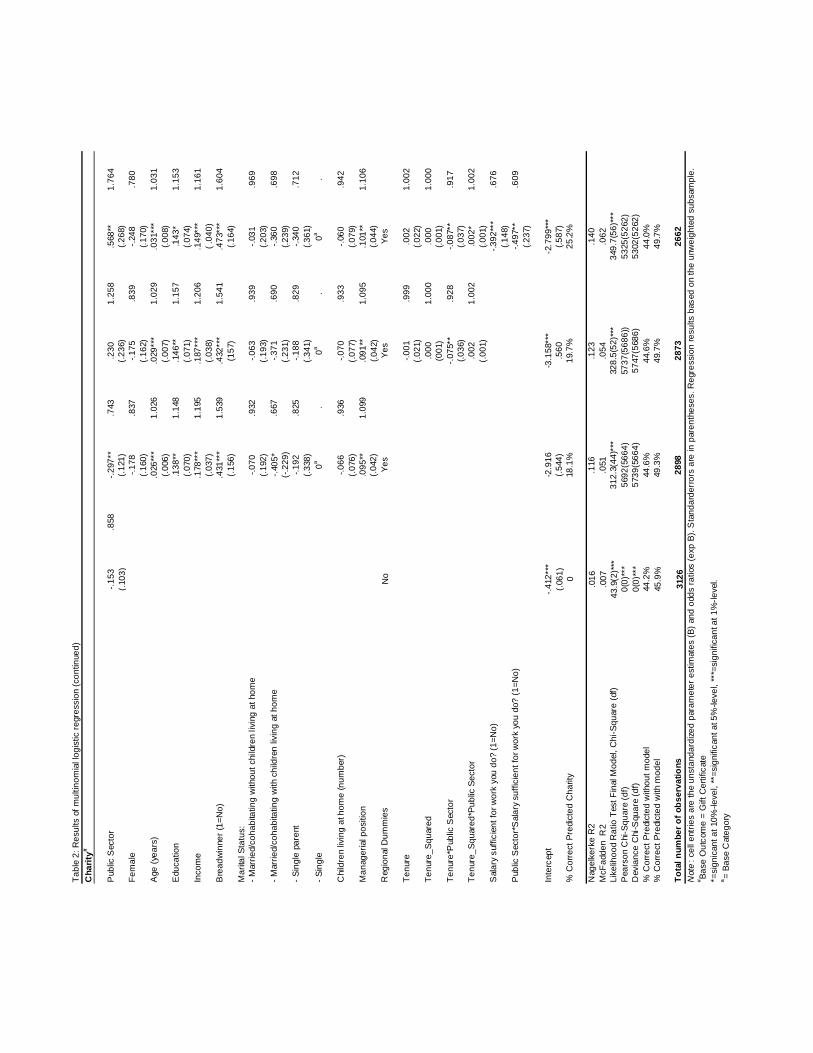
We find striking effects of feelings of underpayment on the odds of choos-
ing the charity over the gift certificate. Employees who feel underpaid are
significantly less likely to donate to charity, and particularly so in the public
sector. The odds for a dissatisfied employee of donating his reward to charity
rather than taking the gift certificate are 0.68 and 0.41 times the odds for a
satisfied employee, in respectively the private and public sector.13 As is clear
from table 2, this difference between private and public sector workers is also
statistically significant. We thus find a clear indication that public sector
employees consider donations to charity as a substitute for their job-related
net contribution to society. Further, it can be seen from table 2 that among
the satisfied employees, public sector employees are significantly more likely
to donate than private sector employees at the start of their career. How-
13The odds for the public sector can easily be computed using the estimated coefficients
in table 2.
11
ever, as before, within a few years this effect disappears, see figure 2c. Figure
2d plots the point estimates of the public sector dummy for dissatisfied em-
ployees. Clearly, among these employees, there is no significant difference
in pro-social inclinations between public and private sector employees at the
start of their career. As tenure increases, public sector employees become less
and less inclined to donate to charity. After about seven years, the difference
becomes statistically significant. Comparing figures 1b, 2c, and 2d, it follows
that controlling for feelings of underpayment hardly affect the tenure profile
in public sector employee’s inclination to donate to charity. Inspection of
the data shows that, somewhat surprisingly, there is no clear relationship
between feelings of underpayment and tenure. Hence, other factors seem to
play a role here, e.g. Blau (1960)’s disillusionment effect, which we discussed
in the Introduction.
5 Conclusion
Summarizing, we have found clear support for the hypothesis that public
sector employees are more risk averse than private sector employees. How-
ever, in contrast to our expectations, we have also found that public sector
employees are on average less inclined to make charitable contributions than
private sector employees. This effect is partly due to the fact that many
more people in the public sector feel underpaid. Moreover, we have found
that feelings of underpayment have much larger repercussions for the odds
of donating to charity in the public sector than in the private sector, sug-
gesting that public sector employees consider the contributions they make on
the job as a substitute for charitable donations. Our findings suggest that
many public sector employees feel that they already donate a lot to society
by exerting effort on the job for relatively little pay and, therefore, are less
willing to make any further contributions than their private sector counter-
parts. Lastly, we have found a clear effect of tenure on pro-social inclinations
in the public sector, which arises independently of feelings of dissatisfaction
about pay. As public sector employees’ tenure increases, they become less
and less inclined to make charitable contributions, while there is no tenure
effect for private sector employees. Such evolution of preferences for pub-
lic sector employees is well in line with studies by Blau (1960), Van Maanen
(1975), and De Cooman et al. (2009) documenting swift declines in altruistic
motivations with tenure among public sector employees.
12
A Appendix
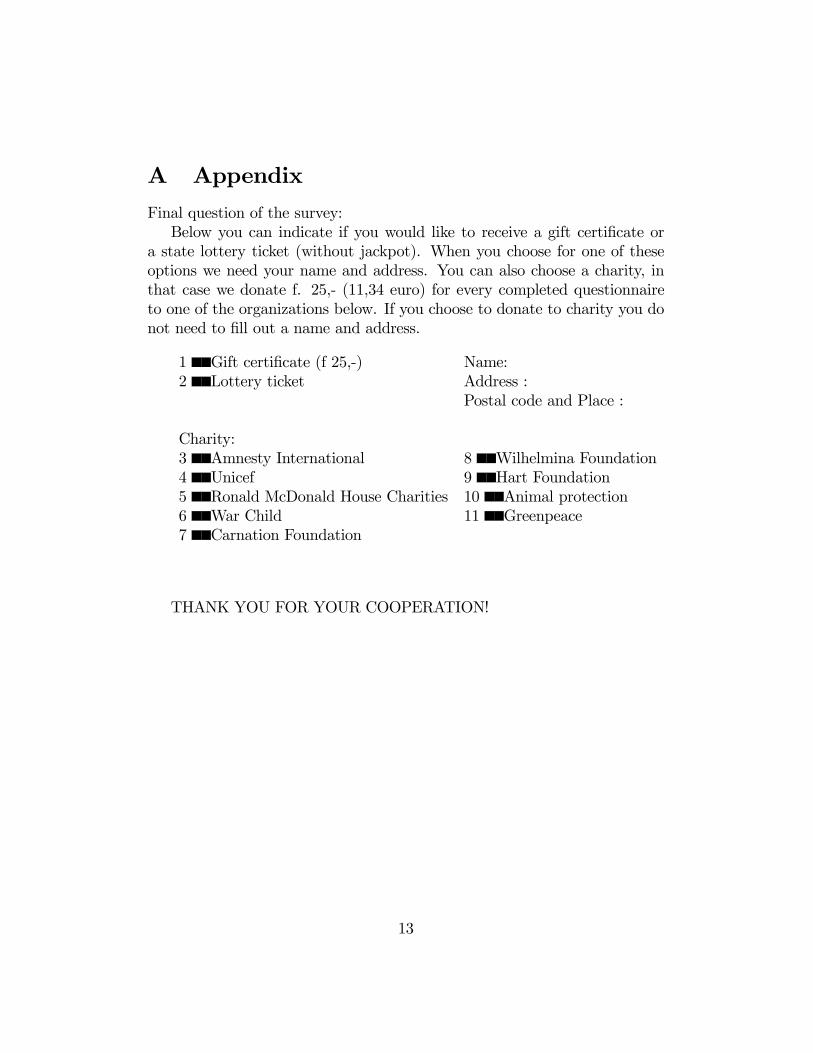
Final question of the survey:
Below you can indicate if you would like to receive a gift certificate or
a state lottery ticket (without jackpot). When you choose for one of these
options we need your name and address. You can also choose a charity, in
that case we donate f. 25,- (11,34 euro) for every completed questionnaire
to one of the organizations below. If you choose to donate to charity you do
not need to fill out a name and address.
1 Gift certificate (f 25,-) Name:
2 Lottery ticket Address :
Postal code and Place :
Charity:
3 Amnesty International 8 Wilhelmina Foundation
4 Unicef 9 Hart Foundation
5 Ronald McDonald House Charities 10 Animal protection
6 War Child 11 Greenpeace
7 Carnation Foundation
THANK YOU FOR YOUR COOPERATION!
13
References
[1] Bakhuys Roozeboom, Maartje, Ernest de Vroome, Peter Smulders, and
Seth van den Bossche (2007), Trends in de arbeid in Nederland tussen
2000 en 2004, Hoofddorp: TNO.
[2] Bellante, Don and Albert N. Link (1981), Are Public Sector Workers
More Risk Averse Than Private Sector Workers?, Industrial and Labor
Relations Review, 34(3): 408-412.
[3] Blau, Peter M. (1960), Orientation toward Clients in a Public Welfare
Agency, Administrative Science Quaterly, 5(3): 341-361.
[4] Bonin, Holger, Thomas Dohmen, Armin Falk, David Huffman, and Uwe
Sunde (2007), Cross-sectional Earnings Risk and Occupational Sorting:
The Role of Risk Attitudes, Labour Economics, 14(6): 926-937.
[5] Brewer, Gene A. (2003), Building Social Capital: Civic Attitudes and
Behavior of Public Servants, Journal of Public Administration Research
and Theory, 13(1): 5-26.
[6] Buchanan, Bruce (1975), Government Managers, Business Executives,
and Organizational Commitment, Public Administration Review, 34(4):
339-347.
[7] Burgess, Simon and Marisa Ratto (2003), The Role of Incentives in the
Public Sector: Issues and Evidence, Oxford Review of Economic Policy,
19(2): 285-300.
[8] Camerer, Colin F. and Robin M. Hogarth (1999), The Effects of Finan-
cial Incentives in Experiments: A Review and Capital-Labor-Production
Framework, Journal of Risk and Uncertainty, 19(1-3): 7-42.
[9] Clark, Andrew and Fabien Postel-Vinay (2009), Job Security and Job
Protection, Oxford Economic Papers, 61(2): 207-239.
[10] Crewson, Philip E. (1997), Public-Service Motivation: Building Empir-
ical Evidence of Incidence and Effect, Journal of Public Administration
Research and Theory, 7(4): 499-518.
14
[11] De Cooman, Rein, Sara De Gieter, Roland Pepermans, Sabrina Her-
mans, Cindy Du Bois, Ralf Caers, Marc Jegers (2009), Person—
Organization Fit: Testing Socialization and Attraction—Selection—
Attrition Hypotheses, Journal of Vocational Behavior, 74(1): 102-107.
[12] Delfgaauw, Josse and Robert Dur (2008), Incentives and Workers’ Mo-
tivation in the Public Sector, Economic Journal, 118(525): 171—191.
[13] Dohmen, Thomas, Armin Falk, David Huffman, Uwe Sunde, Jürgen
Schupp, and Gert G. Wagner (2009), Individual Risk Attitudes: Mea-
surement, Determinants, and Behavioral Consequences, Journal of the
European Economic Association, forthcoming.
[14] Francois, Patrick (2007), Making a Difference, RAND Journal of Eco-
nomics, 38(3): 714-732.
[15] Francois, Patrick and Michael Vlassopoulos (2008), Pro-social Motiva-
tion and the Delivery of Social Services, CESifo Economic Studies, 54(1):
22-54.
[16] Gregg, Paul, Paul Grout, Anita Ratcliffe, Sarah Smith and Frank Wind-
meijer (2008), How Important Is Pro-Social Behaviour in the Delivery
of Public Services?, CMPO Working Paper Series No. 08/197.
[17] Guiso, Luigi and Monica Paiella (2008), Risk Aversion, Wealth, and
Background Risk, Journal of the European Economic Association, 6(6):
1109—1150.
[18] Hartog, Joop, Ada Ferrer-i-Carbonell, and Nicole Jonker (2002), Linking
Measured Risk Aversion to Individual Characteristics, Kyklos, 55(1): 3-
26.
[19] Houston, David J. (2000), Public-Service Motivation: A Multivariate
Test, Journal of Public Administration Research and Theory, 10(4): 713-
727.
[20] Houston, David J. (2006), "Walking the Walk" of Public Service Mo-
tivation: Public Employees and Charitable Gifts of Time, Blood, and
Money, Journal of Public Administration Research and Theory, 16(1):
67-86.
15
[21] Kilpatrick, Franklin P., Milton C. Cummings, and M. Kent Jennings
(1964), The Image of the Federal Service, Washington, D.C.: Brookings
Institute.
[22] Lewis, Gregory B. and Sue A. Frank (2002), Who Wants to Work for
the Government?, Public Administration Review, 62(4): 395-404.
[23] Luechinger, Simon, Alois Stutzer, and Rainer Winkelmann (2007), The
Happiness Gains from Sorting andMatching in the Labor Market, SOEP
Working Paper no. 45.
[24] National Commission on the Public Service (2003), Urgent Business
for America: Revitalizing the Federal Government for the 21st Century,
Washington, DC: The Brookings Institution.
[25] OECD (2005), Performance-Related Pay Policies for Government Em-
ployees, Paris: OECD.
[26] OECD (2008), The State of the Public Service, Paris: OECD.
[27] Perry, James L. (1996), Measuring Public Service Motivation: An As-
sessment of Construct Reliability and Validity, Journal of Public Ad-
ministration Research and Theory, 6(1): 5-22.
[28] Perry, James L. and Lois R. Wise (1990), The Motivational Basis of
Public Service, Public Administration Review, 50(3): 367-373.
[29] Perry, James L., Annie Hondeghem, and Lois R. Wise (2009), Revisiting
the Motivational Bases of Public Service: Twenty Years of Research and
an Agenda for the Future, Mimeo, Indiana University, Bloomington.
[30] Pfeifer, Christian (2008), Risk Aversion and Sorting into Public Sector
Employment, IZA Discussion Paper No. 3503.
[31] Rainey, Hal G. (1982), Reward Preferences among Public and Private
Managers: In Search of the Service Ethic, American Review of Public
Administration, 16(4): 288-302.
[32] Rainey, Hal. G. and Paula Steinbauer (1999), Galloping Elephants: De-
veloping Elements of a Theory of Effective Government Organizations,
Journal of Public Administration Research and Theory, 9(1): 1-32.
16
[33] Roszkowski, Michael J. and John E. Grable (2007), Self-Assessments
of Risk Tolerance by Women and Men, Psychological Reports, 100(3):
795-802.
[34] Roszkowski, Michael J. and John E. Grable (2009), Evidence of Lower
Risk Tolerance Among Public Sector Employees in Their Personal Fi-
nancial Matters, Journal of Occupational and Organizational Psychol-
ogy, 82(2): 453-463.
[35] Smulders, P.G.W., F. Andries, and F.W.J. Otten (2001), Hoe denken
Nederlanders over hun werk? Opzet, kwaliteit en eerste resultaten van
de TNO Arbeidssituatie Survey, Hoofddorp: TNO.
[36] Steijn, Bram (2008), Person-Environment Fit and Public Service Moti-
vation, International Public Management Journal, 11(1): 13-27.
[37] Tschirhart, Mary, Debra J. Mesch, James L. Perry, Theodore K. Miller,
and Geunjoo Lee (2001), Stipended Volunteers: Their Goals, Expe-
riences, Satisfaction, and Likelihood of Future Service, Nonprofit and
Voluntary Sector Quarterly, 30(3): 422-443.
[38] Van Maanen, John (1975), Police Socialization: A Longitudinal Exami-
nation of Job Attitudes in an Urban Police Department, Administrative
Science Quarterly, 20(2): 207-228.
[39] Wright, Bradley E. (2001), Public-Sector Work Motivation: A Review
of the Current Literature and a Revised Conceptual Model, Journal of
Public Administration Research and Theory, 11(4): 559-586.
17
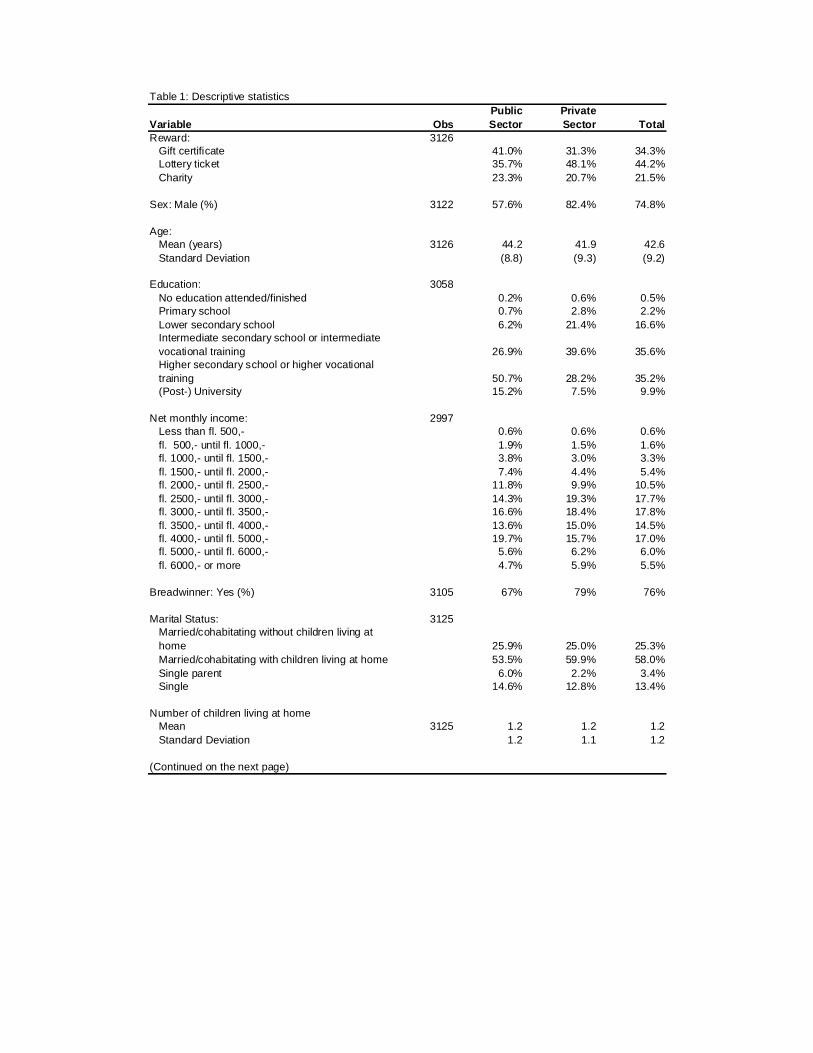
Table 1: Descriptive statistics
Variable ObsPublic Sector
Private Sector Total
Reward: 3126Gift certificate 41.0% 31.3% 34.3%Lottery ticket 35.7% 48.1% 44.2%Charity 23.3% 20.7% 21.5%
Sex: Male (%) 3122 57.6% 82.4% 74.8%
Age:Mean (years) 3126 44.2 41.9 42.6Standard Deviation (8.8) (9.3) (9.2)
Education: 3058No education attended/finished 0.2% 0.6% 0.5%Primary school 0.7% 2.8% 2.2%Lower secondary school 6.2% 21.4% 16.6%Intermediate secondary school or intermediate vocational training 26.9% 39.6% 35.6%Higher secondary school or higher vocational training 50.7% 28.2% 35.2%(Post-) University 15.2% 7.5% 9.9%
Net monthly income: 2997Less than fl. 500,- 0.6% 0.6% 0.6%fl. 500,- until fl. 1000,- 1.9% 1.5% 1.6%fl. 1000,- until fl. 1500,- 3.8% 3.0% 3.3%fl. 1500,- until fl. 2000,- 7.4% 4.4% 5.4%fl. 2000,- until fl. 2500,- 11.8% 9.9% 10.5%fl. 2500,- until fl. 3000,- 14.3% 19.3% 17.7%fl. 3000,- until fl. 3500,- 16.6% 18.4% 17.8%fl. 3500,- until fl. 4000,- 13.6% 15.0% 14.5%fl. 4000,- until fl. 5000,- 19.7% 15.7% 17.0%fl. 5000,- until fl. 6000,- 5.6% 6.2% 6.0%fl. 6000,- or more 4.7% 5.9% 5.5%
Breadwinner: Yes (%) 3105 67% 79% 76%
Marital Status: 3125Married/cohabitating without children living at home 25.9% 25.0% 25.3%Married/cohabitating with children living at home 53.5% 59.9% 58.0%Single parent 6.0% 2.2% 3.4%Single 14.6% 12.8% 13.4%
Number of children living at homeMean 3125 1.2 1.2 1.2Standard Deviation 1.2 1.1 1.2
(Continued on the next page)
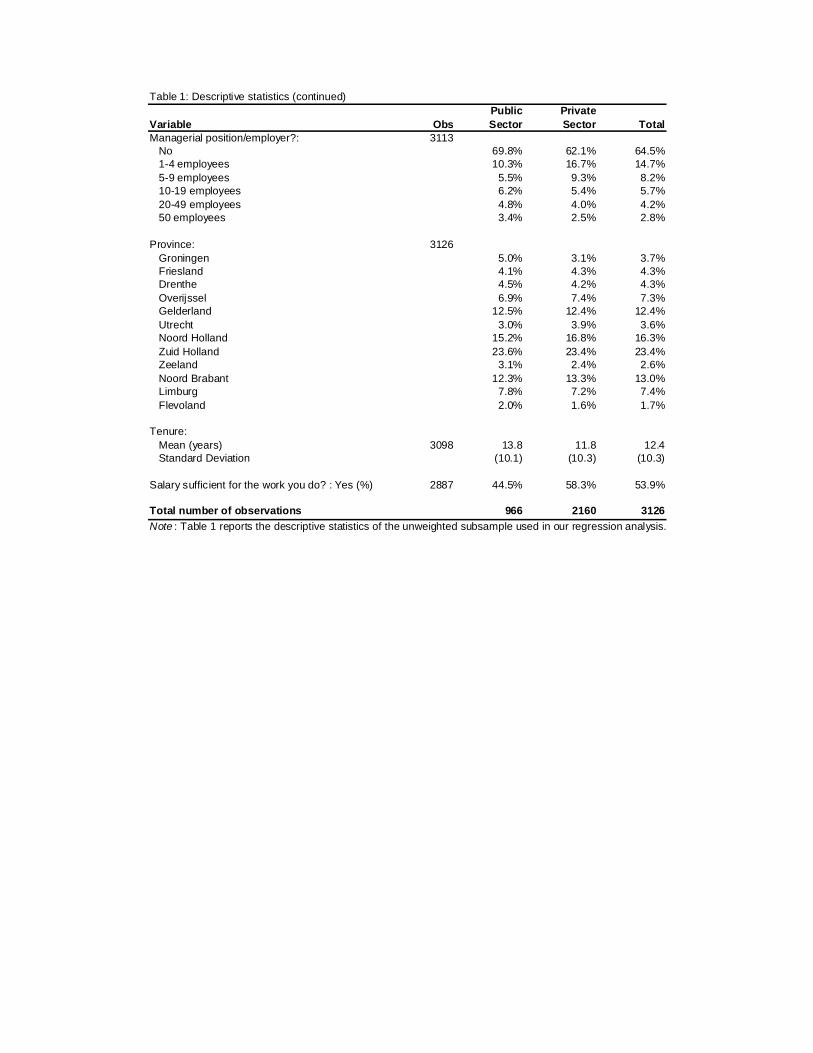
Table 1: Descriptive statistics (continued)
Variable ObsPublic Sector
Private Sector Total
Managerial position/employer?: 3113No 69.8% 62.1% 64.5%1-4 employees 10.3% 16.7% 14.7%5-9 employees 5.5% 9.3% 8.2%10-19 employees 6.2% 5.4% 5.7%20-49 employees 4.8% 4.0% 4.2%50 employees 3.4% 2.5% 2.8%
Province: 3126Groningen 5.0% 3.1% 3.7%Friesland 4.1% 4.3% 4.3%Drenthe 4.5% 4.2% 4.3%Overijssel 6.9% 7.4% 7.3%Gelderland 12.5% 12.4% 12.4%Utrecht 3.0% 3.9% 3.6%Noord Holland 15.2% 16.8% 16.3%Zuid Holland 23.6% 23.4% 23.4%Zeeland 3.1% 2.4% 2.6%Noord Brabant 12.3% 13.3% 13.0%Limburg 7.8% 7.2% 7.4%Flevoland 2.0% 1.6% 1.7%
Tenure:Mean (years) 3098 13.8 11.8 12.4Standard Deviation (10.1) (10.3) (10.3)
Salary sufficient for the work you do? : Yes (%) 2887 44.5% 58.3% 53.9%
Total number of observations 966 2160 3126
Note : Table 1 reports the descriptive statistics of the unweighted subsample used in our regression analysis.
T
ab
le 2
: R
esu
lts o
f m
ulti
no
mia
l lo
gis
tic r
egr
ess
ion
Lo
tte
ry t
ick
et #
B
ex
p B
B
exp
BB
e
xp B
B
exp
BP
ublic
Sec
tor
-.5
68**
*0
.56
7-.
37
9***
.684
-.5
07*
*.6
02
-.4
31*
.6
50
(.08
9)
(.1
02)
(.2
09)
(.2
44)
Fe
ma
le
-.5
43*
**0
.581
-.5
46
***
.58
0-.
57
0**
*.5
66
(.1
38)
(.1
39)
(.1
45)
Age
(ye
ars
).0
081
.008
.01
3**
1.0
13
.016
**1
.01
6(.
005
)(.
00
6)(.
00
6)E
duca
tion
-.1
29**
.879
-.1
47
***
.86
3-.
14
4**
.86
5(.
055
)(.
05
7)(.
05
9)In
com
e.0
251
.025
.03
01
.03
00
.02
61
.02
6(.
030
)(.
03
1)(.
03
3)B
rea
dw
inne
r (1
=N
o)
.116
1.1
23.1
16
1.1
23
.17
31
.18
9(.
132
)(.
13
3)(.
13
9)M
ari
tal S
tatu
s:-
Mar
rie
d/co
ha
bita
ting
with
ou
t ch
ildre
n li
ving
at
hom
e.2
571
.293
0.2
621
.29
9.2
53
1.2
88
(.1
67)
(.1
68)
(.1
76)
- M
arri
ed/
coh
ab
itatin
g w
ith c
hild
ren
livi
ng
at
ho
me
.49
7**
1.6
44.5
15**
*1
.67
3.4
57**
1.5
80
(.1
94)
(.1
95)
(.2
03)
- S
ing
le p
are
nt-.
04
4.9
57-.
06
4.9
38
-.15
8.8
54
(.2
99)
(.3
03)
(.3
13)
- S
ing
le
0a
.0
a.
0a
.
Chi
ldre
n liv
ing
at h
om
e (
nu
mb
er)
-.2
15*
**.8
07-2
16
***
.80
6-.
20
4**
*.8
15
(.0
65)
(.0
66)
( .0
68
)M
an
age
rial
po
sitio
n.0
531
.055
.05
31
.05
5.0
49
1.0
50
(.0
37)
(.0
37)
(.0
39)
Reg
ion
al D
um
mie
sN
oY
es
Ye
sY
es
Te
nur
e-.
01
6.9
84
-.01
4.9
86
(.0
17)
(.0
18)
Te
nur
e_
Sq
uar
ed
.00
01
.00
0.0
00
1.0
00
(.0
01)
(.0
01)
Te
nur
e*P
ublic
Sec
tor
.02
01
.02
0.0
02
1.0
02
(.0
31)
(.0
32)
Te
nur
e_
Sq
uar
ed
*Pu
blic
Se
cto
r.0
00
1.0
00
.00
01
.00
0(.
00
1)(.
00
1)S
ala
ry s
uffic
ien
t fo
r w
ork
you
do
? (1
=N
o)
-.05
7.9
44
(.1
16
)P
ublic
Sec
tor*
Sal
ary
su
ffic
ien
t fo
r w
ork
yo
u d
o? (
1=
No
).0
29
1.0
30
(.1
99)
Inte
rcep
t.4
30
***
.248
.19
3-.
041
(.04
9)
(.4
68)
(.4
82)
(.5
11)
% C
orr
ect
Pre
dict
ed
Lot
tery
75.1
%76
.0%
76.
2%
74
.0%
(Co
ntin
ue
d o
n t
he
ne
xt p
age
)
Mo
de
l 1
Mo
de
l 2
Mo
de
l 3
Mo
de
l 4
Ta
ble
2:
Re
sults
of
mu
ltin
om
ial l
og
istic
re
gre
ssio
n (
con
tinue
d)
Ch
ari
ty#
Pub
lic S
ecto
r -.
15
3.8
58-.
297
**.7
43.2
30
1.2
58
.568
**1
.76
4(.
103
)(.
121
)(.
23
6)(.
26
8)F
em
ale
-.1
78
.837
-.1
75
.83
9-.
248
.78
0(.
160
)(.
16
2)(.
17
0)A
ge (
yea
rs)
.026
***
1.0
26.0
29**
*1
.02
9.0
31*
**1
.03
1(.
006
)(.
00
7)(.
00
8)E
duca
tion
.13
8**
1.1
48.1
46
**1
.15
7.1
43
*1
.15
3(.
070
)(.
07
1)(.
07
4)In
com
e.1
78**
*1
.195
.187
***
1.2
06
.14
9***
1.1
61
(.0
37)
(.0
38)
( .0
40
)B
rea
dw
inne
r (1
=N
o)
.431
***
1.5
39.4
32**
*1
.54
1.4
73*
**1
.60
4(.
156
)(1
57)
(.1
64)
Ma
rita
l Sta
tus:
- M
arri
ed/
coh
ab
itatin
g w
itho
ut
child
ren
livi
ng a
t ho
me
-.0
70
.932
-.0
63
.93
9-.
031
.96
9(.
192
)(.
19
3)(.
20
3)-
Mar
rie
d/co
ha
bita
ting
with
ch
ildre
n li
vin
g a
t h
om
e-.
405
*.6
67-.
37
1.6
90
-.36
0.6
98
(-.2
29
)(.
23
1)(.
23
9)-
Sin
gle
pa
rent
-.1
92
.825
-.1
88
.82
9-.
340
.71
2(.
338
)(.
34
1)(.
36
1)-
Sin
gle
0
a.
0a
.0
a.
Chi
ldre
n liv
ing
at h
om
e (
nu
mb
er)
-.0
66
.936
-.0
70
.93
3-.
060
.94
2(.
076
)(.
07
7)(.
07
9)M
an
age
rial
po
sitio
n.0
95
**1
.099
.09
1**
1.0
95
.101
**1
.10
6(.
042
)(.
04
2)(.
04
4)R
egio
nal
Du
mm
ies
No
Ye
sY
es
Ye
s
Te
nur
e-.
00
1.9
99
.00
21
.00
2(.
02
1)(.
02
2)T
en
ure
_S
qu
are
d.0
00
1.0
00
.00
01
.00
0(0
01)
(.0
01)
Te
nur
e*P
ublic
Sec
tor
-.0
75*
*.9
28
-.0
87*
*.9
17
(.0
36)
(.0
37)
Te
nur
e_
Sq
uar
ed
*Pu
blic
Se
cto
r.0
02
1.0
02
.00
2*
1.0
02
(.0
01)
(.0
01)
Sal
ary
suf
ficie
nt
for
wo
rk y
ou d
o?
(1=
No
)-.
39
2**
*.6
76
(.1
48)
Pub
lic S
ecto
r*S
ala
ry s
uff
icie
nt
for
wo
rk y
ou
do?
(1
=N
o)
-.4
97*
*.6
09
(.2
37)
Inte
rcep
t-.
412
***
-2.9
16
-3.1
58*
**-2
.79
9**
*(.
061
)(.
544
).5
60
(.5
87)
% C
orr
ect
Pre
dict
ed
Ch
arit
y0
18.1
%1
9.7
%2
5.2
%
Nag
elk
erk
e R
2.0
16
.116
.12
3.1
40
McF
add
en
R2
.00
7.0
51.0
54
.06
2L
ike
liho
od
Ra
tio T
est
Fin
al M
od
el,
Ch
i-S
qu
are
(df
)4
3.9
(2)*
**3
12
.3(4
4)*
**32
8.5
(52
)***
349
.7(5
6)*
**P
ears
on
Chi
-Sq
ua
re (
df)
0(0
)***
569
2(5
66
4)
573
7(5
68
6))
53
25(5
262
)D
evia
nce
Chi
-Squ
are
(d
f)0
(0)*
**5
739
(56
64
)5
747
(568
6)
53
02(5
262
)%
Co
rre
ct P
redi
cte
d w
itho
ut
mo
del
44.2
%44
.6%
44.
6%
44
.0%
% C
orr
ect
Pre
dict
ed
with
mo
de
l45
.9%
49.3
%4
9.7
%4
9.7
%
To
tal
nu
mb
er
of
ob
se
rva
tio
ns
312
62
898
28
73
26
62
Not
e:
cell
ent
rie
s a
re t
he
un
sta
nda
rdiz
ed
par
am
ete
r e
stim
ate
s (B
) an
d o
dds
ratio
s (e
xp B
). S
tan
da
rde
rro
rs a
re in
par
en
the
ses.
Re
gre
ssio
n r
esu
lts b
ased
on
the
unw
eig
hte
d s
ub
sam
ple
.# B
ase
Ou
tcom
e =
Gift
Ce
rtifi
cat
e
*=si
gn
ican
t a
t 10
%-le
vel,
**=
sig
nific
ant
at 5
%-le
vel,
***=
sig
nifi
can
t at
1%
-le
vel.
a=
Ba
se C
ate
go
ry
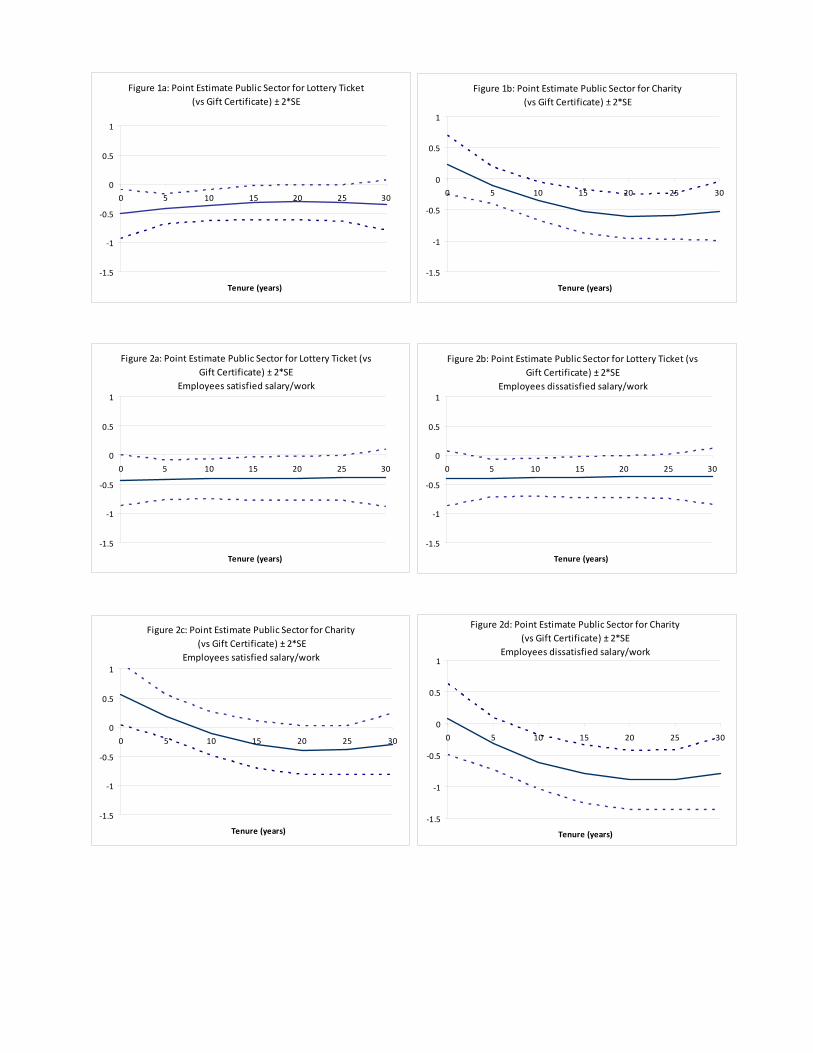
Figure 1a: Point Estimate Public Sector for Lottery Ticket
(vs Gift Certificate) ± 2*SE
‐1.5
‐1
‐0.5
0
0.5
1
0 5 10 15 20 25 30
Tenure (years)
Figure 1b: Point Estimate Public Sector for Charity
(vs Gift Certificate) ± 2*SE
‐1.5
‐1
‐0.5
0
0.5
1
0 5 10 15 20 25 30
Tenure (years)
Figure 2a: Point Estimate Public Sector for Lottery Ticket (vs
Gift Certificate) ± 2*SE
Employees satisfied salary/work
‐1.5
‐1
‐0.5
0
0.5
1
0 5 10 15 20 25 30
Tenure (years)
Figure 2b: Point Estimate Public Sector for Lottery Ticket (vs
Gift Certificate) ± 2*SE
Employees dissatisfied salary/work
‐1.5
‐1
‐0.5
0
0.5
1
0 5 10 15 20 25 30
Tenure (years)
Figure 2c: Point Estimate Public Sector for Charity
(vs Gift Certificate) ± 2*SE
Employees satisfied salary/work
‐1.5
‐1
‐0.5
0
0.5
1
0 5 10 15 20 25 30
Tenure (years)
Figure 2d: Point Estimate Public Sector for Charity
(vs Gift Certificate) ± 2*SE
Employees dissatisfied salary/work
‐1.5
‐1
‐0.5
0
0.5
1
0 5 10 15 20 25 30
Tenure (years)


