
Q3 2014 U.S. Solar Market Insight Report Overview
Cory Honeyman, Solar Analyst, GTM Research Shawn Rumery, Research Manager, SEIA
Shawn Rumery December 16th, 2014

About SEIA • Founded in 1974
• U.S. National Trade Association for Solar Energy • 1,000 member companies from around the world • Members from across 50 states • Largest companies in the world as well as small
installers • Our Mission: Build a strong solar industry to power
America
• Our Goal: 10 gigawatts (GW) of annual installed solar capacity in the U.S. by 2015
December 16, 2014 © 2014 Solar Energy Industries Association® 3

About Solar Market Insight • Detailed data on markets in
top 31 states plus DC available in full report.
• Free executive summary provides national aggregate data on installations, pricing, manufacturing and demand forecasts.
• Full report for sale (50% discount to SEIA members) includes quarterly forecasts as well as detailed market segment and state data.
December 16, 2014 © 2014 Solar Energy Industries Association® 4

Putting the Findings in Context • Nearly 143,000 American workers in solar – more than
double the number in 2009 – at 6,100 companies across the country
December 16, 2014 © 2014 Solar Energy Industries Association® 5

Context, Continued
• Solid Q2 2014 with 3rd consecutive quarter over 1 GW; 1,260 MW representing 34% growth y/y
December 16, 2014 © 2014 Solar Energy Industries Association® 6

2014 Q3 SMI Key Findings
• 1,354 MW of Solar PV Installed in Q3 2014, up 41% y/y
• Cumulative PV Capacity increases to over 16 GW • Utility market again leads the way with 825 MW installed
• Residential installations expected to overtake non-residential in 2014
• 36% of all new electric capacity through Q3 2014 from solar
• Prices continue to fall: residential down 4% q/q • Forecast 6.5 GW of PV to come online in 2014
• 767 MW of CSP forecasted in 2014
December 16, 2014 © 2014 Solar Energy Industries Association® 7
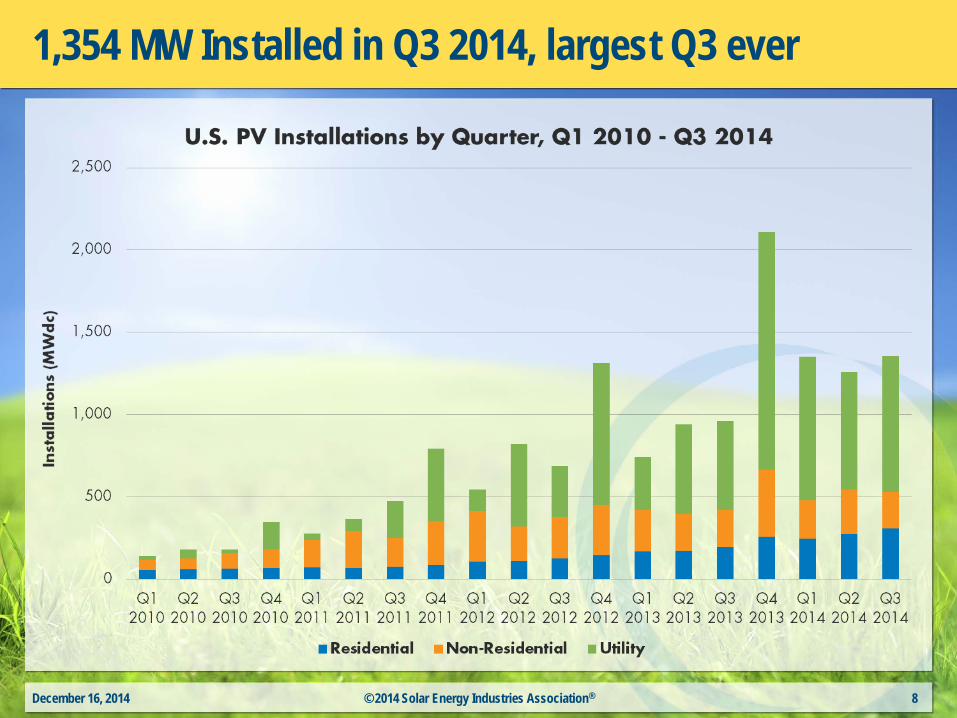
1,354 MW Installed in Q3 2014, largest Q3 ever
December 16, 2014 © 2014 Solar Energy Industries Association® 8
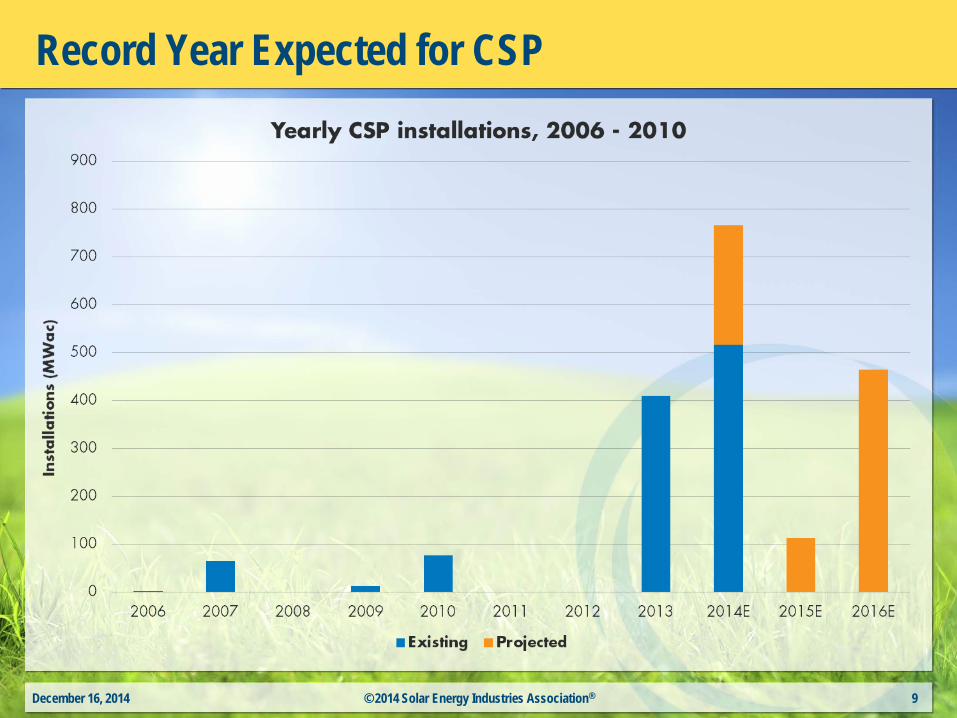
Record Year Expected for CSP
December 16, 2014 © 2014 Solar Energy Industries Association® 9

36% of all new 2014 electric capacity from solar
December 16, 2014 © 2014 Solar Energy Industries Association® 10

Over 3.5 million homes powered by solar
December 16, 2014 © 2014 Solar Energy Industries Association® 11
0
2,000
4,000
6,000
8,000
10,000
12,000
14,000
16,000
2006 2007 2008 2009 2010 2011 2012 2013 2014(through Q3)
Inst
alla
tions
(MW
ac)
Cumulative U.S. Solar Installations by Market Segment
Residential (PV) Non-residential (PV) Utility (PV) Concentrating Solar Power (CSP)
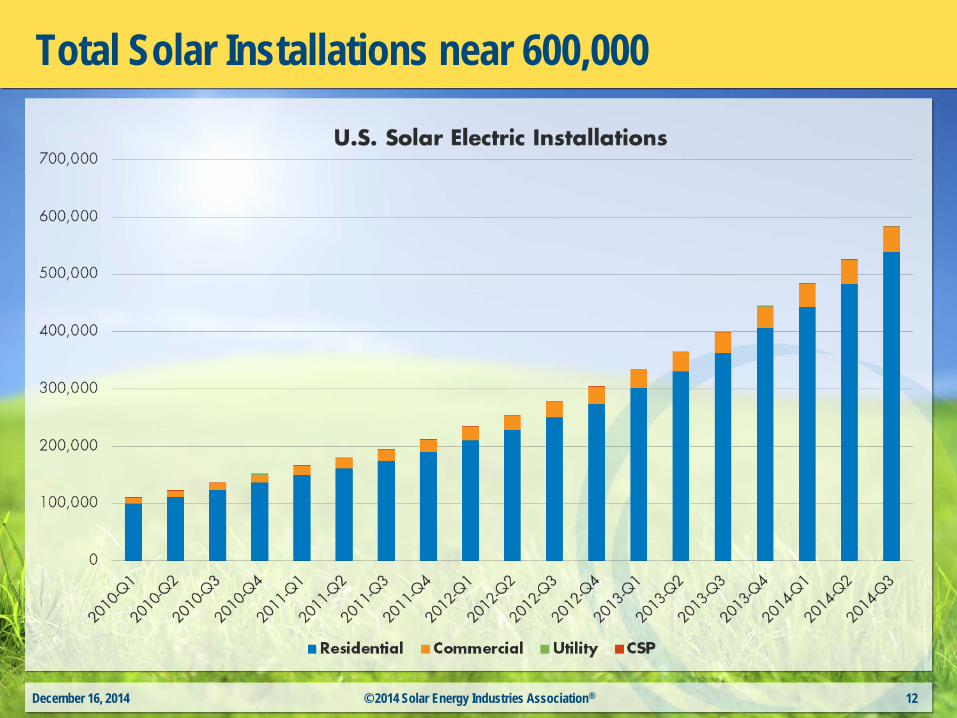
Total Solar Installations near 600,000
December 16, 2014 © 2014 Solar Energy Industries Association® 12
December 16, 2014 © 2014 Solar Energy Industries Association® 13
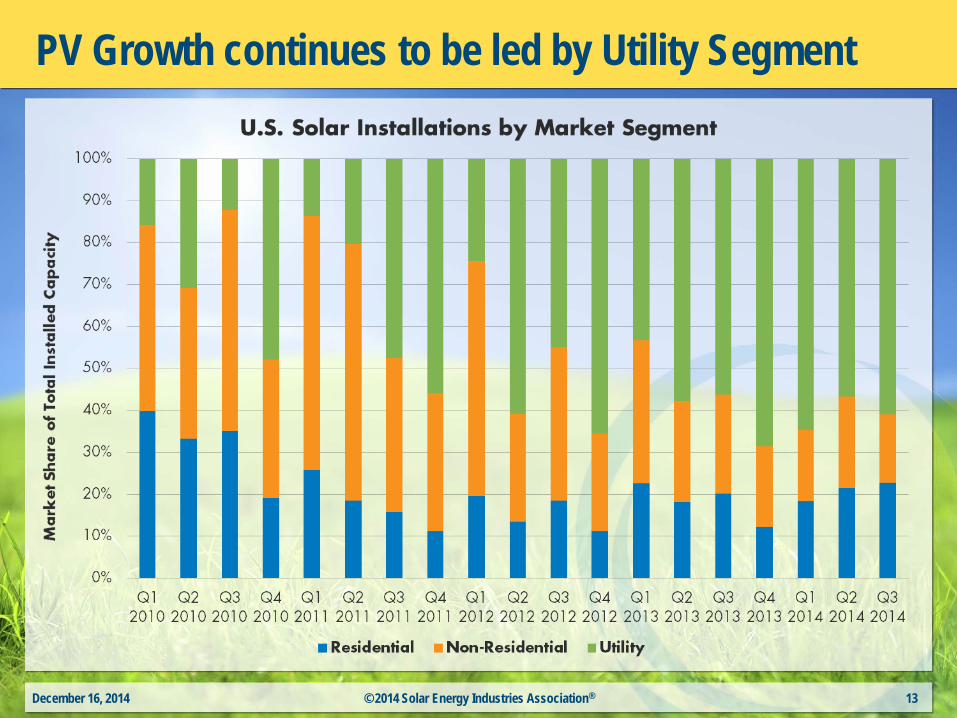
PV Growth continues to be led by Utility Segment

Res over Non-Res again; Another big utility quarter
December 16, 2014 © 2014 Solar Energy Industries Association® 14

2014 Q3 State Performance
December 16, 2014 © 2014 Solar Energy Industries Association® 15
21.2
85.2
29.2
30
38.6
39.3
81.5
95.4
176.6
642.1
Missouri
Hawaii
Arizona
New Jersey
New York
Texas
Massachusetts
North Carolina
Nevada
California
State Rankings by Q3 2014 PV Installations
Residential Non-Residential Utility
California
Nevada
North Carolina
Massachusetts
Texas
New York
New Jersey
Arizona
All Others

U.S. Market Update Part II
Cory Honeyman
Solar Analyst
www.gtmresearch.com
Key Topics Covered
DG Market Rundown in Q3 2014 1
2 Utility PV Market in Q3 2014
3 U.S. PV Installation Forecast
National System Pricing Trends 4

US Distributed Generation Market Rundown
Q3 2014

Residential Solar’s Emergence in Distributed PV
Residential: Steady, incremental growth since 2011 • California continues to drive majority of demand • Innovation in consumer and project financing solutions
Non-Residential: Lumpier development cycles • Higher sensitivity to state incentive reductions • Continued need to standardize financing/customer origination
Residential exceeded non-residential solar installations for the first time ever
Source: GTM Research/SEIA U.S. Solar Market Insight, Q3 2014
0
100
200
300
400
500
Q12011
Q22011
Q32011
Q42011
Q12012
Q22012
Q32012
Q42012
Q12013
Q22013
Q32013
Q42013
Q12014
Q22014
Q32014
Inst
alla
tions
(MW
dc)
Residential vs. Non-Residential PV Installations, Q1 2011-Q3 2014
Residential Non-Residential
Residential exceeded non-residential solar installations for the first time ever

Trends in Residential Solar

Scale Through Geographic Consolidation
• With attractive retail rate structures for solar, 130 MW of residential PV came online in Q3 2014 without a state rebate in CA
• For every quarter since 2010, the top five state markets have accounted for at least 75% of residential installations
Source: GTM Research/SEIA U.S. Solar Market Insight, Q3 2014
0
50
100
150
200
250
300
350
Q12010
Q22010
Q32010
Q42010
Q12011
Q22011
Q32011
Q42011
Q12012
Q22012
Q32012
Q42012
Q12013
Q22013
Q32013
Q42013
Q12014
Q22014
Q32014R
esid
entia
l PV
Inst
alla
tions
(MW
dc)
Residential PV Installations, California vs. the Rest of the U.S.
California Rest of U.S.
California: 52% of National Market
California: 43% of National Market

Rate Reform and NEM Battles: Only 4 Losses to Date
NE
OK CA
ID
AZ
CO
GA LA
VA
VT
MA
HI
MN
NC UT
FL
IA
KS
NV
OR RI
WA
NY
Legislative Regulatory Both
WI
SC
Source: Vote Solar, GTM Research

Consumer Financing Solutions Are Diversifying
• Third party ownership continues to be the primary driver of new installations – Q3 2014: TPO market shares varied from 67% in NY to 92% in NJ
• But the national TPO market share is beginning to flat line as installers ramp up
partnerships with national/regional banks to provide competitive loan products
Source: GTM Research/SEIA U.S. Solar Market Insight, Q3 2014
0%10%20%30%40%50%60%70%80%90%
100%
Q12011
Q22011
Q32011
Q42011
Q12012
Q22012
Q32012
Q42012
Q12013
Q22013
Q32013
Q42013
Q12014
Q22014
Q32014TP
O R
esid
entia
l Mar
ket S
hare
Percentage of New Residential Installations Owned by Third Party, Q1 2011 - Q3 2014
California Arizona Colorado Massachusetts New Jersey New York
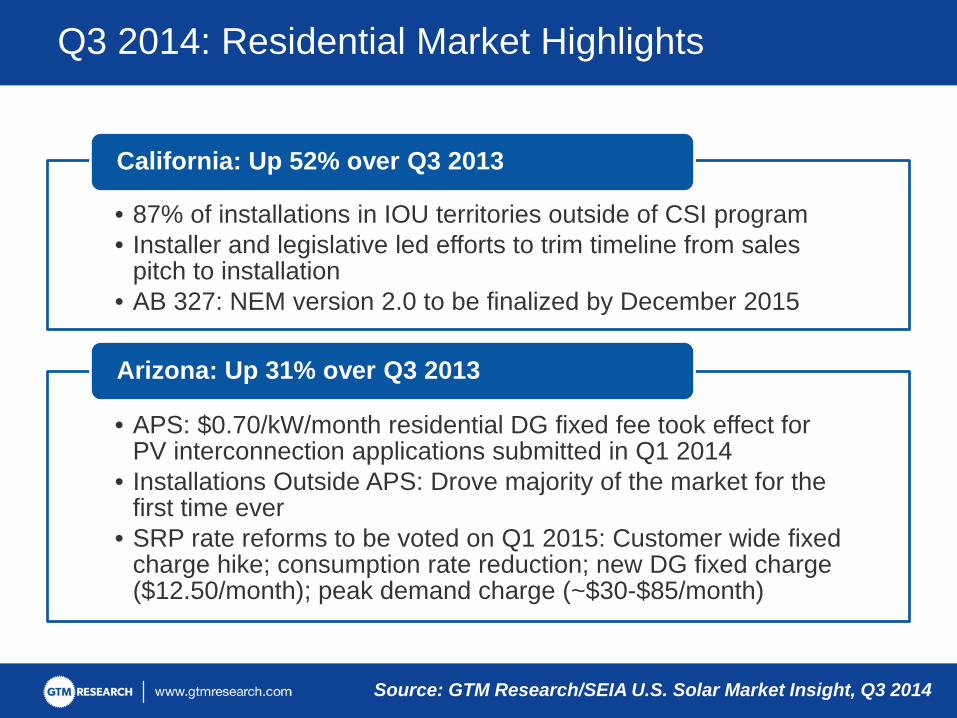
Q3 2014: Residential Market Highlights
• 87% of installations in IOU territories outside of CSI program • Installer and legislative led efforts to trim timeline from sales
pitch to installation • AB 327: NEM version 2.0 to be finalized by December 2015
California: Up 52% over Q3 2013
• APS: $0.70/kW/month residential DG fixed fee took effect for PV interconnection applications submitted in Q1 2014
• Installations Outside APS: Drove majority of the market for the first time ever
• SRP rate reforms to be voted on Q1 2015: Customer wide fixed charge hike; consumption rate reduction; new DG fixed charge ($12.50/month); peak demand charge (~$30-$85/month)
Arizona: Up 31% over Q3 2013
Source: GTM Research/SEIA U.S. Solar Market Insight, Q3 2014

Q3 2014: Residential Market Highlights
• PV grid saturation challenges continue to hamper market growth
• HECO plans to approve the 6,000+ customers awaiting interconnection approval no later than April 2015
• New DG Interconnection Plan: Proposes customer wide and DG fixed charges; replace NEM at the full retail rate with feed-in-tariffs ranging from $0.12/kWh to $0.16/kWh depending on the utility
Hawaii: Down 29% over Q3 2013
• NYSERDA’s MW Block Incentive program took effect in August 2014 for systems up to 200 kW
• As of November 2014, more than 120 MW of residential solar had already been subscribed
New York: Up 273% over Q3 2013
Source: GTM Research/SEIA U.S. Solar Market Insight, Q3 2014

Trends in Non-Residential Solar

Lumpy & Incentive Driven Development
• AZ: Incentives for commercial customers were abruptly eliminated in AZ in early 2013
• CA: Significantly higher performance based incentives for government/nonprofit installations than commercial
• MA: Beginning in 2H 2014, second SREC program favors development of systems less than or equal to 650 kW
-
20
40
60
80
100
120
Massachusetts California New Jersey New York
Inst
alla
tions
(MW
dc)
Non-Residential PV Installations by State, Q3 2012-Q3 2014
Q3 2012 Q4 2012 Q1 2013 Q2 2013 Q3 2013 Q4 2013 Q1 2014 Q2 2014 Q3 2014
Source: GTM Research/SEIA U.S. Solar Market Insight, Q3 2014

Largest Driver of Demand: 1 MW+ Ground Mount
• Government and nonprofit segments: Accounted for a growing share of demand in 2014 year-to-date (45% of non-residential installations from Q1 2014 to Q3 2014)
• Small scale non-residential (< 1 MW): Continued to see limited development
opportunities due to higher transactional costs when the customer is non-investment-grade
29.8% 36.8% 37.2% 42.7% 51.3%
22.4% 20.3% 20.1% 16.7%
18.3% 31.2% 29.5% 32.0% 32.0%
22.7%
15.6% 12.7% 10.2% 8.2% 7.4% 1.0% 0.7% 0.5% 0.4% 0.3%
0%
20%
40%
60%
80%
100%
2010 2011 2012 2013 Q1 2014 to…
Sha
re o
f Non
-Res
iden
tial P
V
IInst
alle
d C
apac
ity (%
)
Non-Residential PV Installed Capacity by System Size: AZ, CA, MA, NJ and NY
1 MW+ 500-1000 kW 100-500 kW 10-100 kW <10 kW
Source: GTM Research/SEIA U.S. Solar Market Insight, Q3 2014

Non-Residential Market Highlights: Q3 2014
$0
$100
$200
$300
$400
$500
0
20
40
60
80
100
SR
EC
Prices (S
pot) In
stal
latio
ns (M
Wdc
)
Massachusetts Non-Residential PV Installations vs. Monthly SREC Spot Price
Non-Residential Spot SREC Price
• Majority of non-residential installations in Q3 2014: Projects eligible under SREC I
• To qualify for SREC I in 2H 2014: Project must have been ready for interconnection by June 2014, simply awaiting utility approval to proceed
• Systems < 650 kW in SREC II: Eligible for an SREC factor of 0.8 (for every SREC generated) if they account for less than 67% of on-site load
Massachusetts: Up 78% over Q3 2013
Source: GTM Research/SEIA U.S. Solar Market Insight, Q3 2014

Non-Residential Market Highlights: Q3 2014
• CSI incentive funding (that remains): Growing share has been reserved by commercial projects despite a low PBI rate of $0.025/kWh
• Rate Reform: Small and medium sized customers are transitioning away from flat rate structures to time-of-use tariffs that increase the attractiveness of rooftop solar
California: Down 39% over Q3 2013
• MW Block Incentive program for systems 200 kW or above will be rolled out in early 2015
• Initial Incentive Rates for MW Block: 3 year PBI starting at $0.105/kWh for Con Edison territory and $0.09/kWh for the rest of NY
New York: Up 60% over Q3 2013
• Recent Rebound in SREC pricing: Contract pricing has ranged between $180-$200 for three year strips
• SREC market will remain oversupplied through 2016: But incremental SREC price rebound has unfrozen development for projects with higher priced PPAs ranging between $0.08/kWh and $0.10/kWh
New Jersey: Down 47% in Q3 2013
Source: GTM Research/SEIA U.S. Solar Market Insight, Q3 2014

Utility PV Market: Bedrock of US Demand

Utility PV: Top Driver of U.S. Market Growth
• Q3 2014: 825 MW of utility PV from 67 individual projects and project phases (third largest quarter ever for the market segment)
• Majority of capacity (528 MW) came from the four largest projects, three of which were developed in California by First Solar
0
200
400
600
800
1000
1200
1400
1600
Q32011
Q42011
Q12012
Q22012
Q32012
Q42012
Q12013
Q22013
Q32013
Q42013
Q12014
Q22014
Q32014
Inst
alla
tions
(MW
dc)
Utility PV Installations: California vs. Rest of the U.S.
California Rest of U.S.
Source: U.S. Utility PV Market Tracker

www.gtmresearch.com
Utility PV Procurement is Diversifying…Quickly
5,905
2,950
6,886
3,696
7,363
3,600
7,858
4,223
8,272
6,979
0
1,000
2,000
3,000
4,000
5,000
6,000
7,000
8,000
9,000
CA Rest of US
Con
tract
ed P
ipel
ine
(MW
dc)
Utility PV Contracted Pipeline, CA vs. Rest of U.S.
2010 2011 2012 2013 2014
Source: U.S. Utility PV Market Tracker

US PV Installation Forecast

Residential: 1,216 MW in 2014 • CA will continue to account for majority of
growth, but will be outpaced by the expansion of other states where retail rate parity is close to being or already reached (i.e. AZ)
Non-Residential: 1,122 MW in 2014 • Revised our non-residential forecast to just
1.4% growth, primarily due to incentive depletion hampering growth in AZ and CA and SREC oversupply in New Jersey resulting in rock-bottom build rates
Utility PV: 4,138 MW in 2014 • Growth will come from the usual cast of state
market leaders – CA and NC – followed by NV, GA and AZ
U.S. PV Installation Forecast: 2014 Outlook
Source: GTM Research/SEIA U.S. Solar Market Insight, Q3 2014
0%
10%
20%
30%
40%
50%
60%
70%
80%
90%
100%
2011 2012 2013 2014E 2015E 2016EIn
stal
latio
ns (M
Wdc
)
U.S. PV Installations by Market Segment, 2011-2016E
Residential Non-Residential Utility

Bullish Outlook for 2014-2016 • The next three years will see continued,
strong growth across all market segments Market Forecast 2017-2018 • We expect a drop off in installations, partially
due to pull-in of demand in 2016 ahead of the Federal ITC’s expiration
Forecast details by state (31 states) and market segment through 2018 are available in the Full Report
U.S. PV Installation Forecast Through 2016
0
2,000
4,000
6,000
8,000
10,000
12,000
2010 2011 2012 2013 2014E 2015E 2016E
Inst
alle
d C
apac
ity (
MW
dc)
US PV Installation Forecast, 2010-2016
Residential Non-Residential Utility

National System Pricing Trends
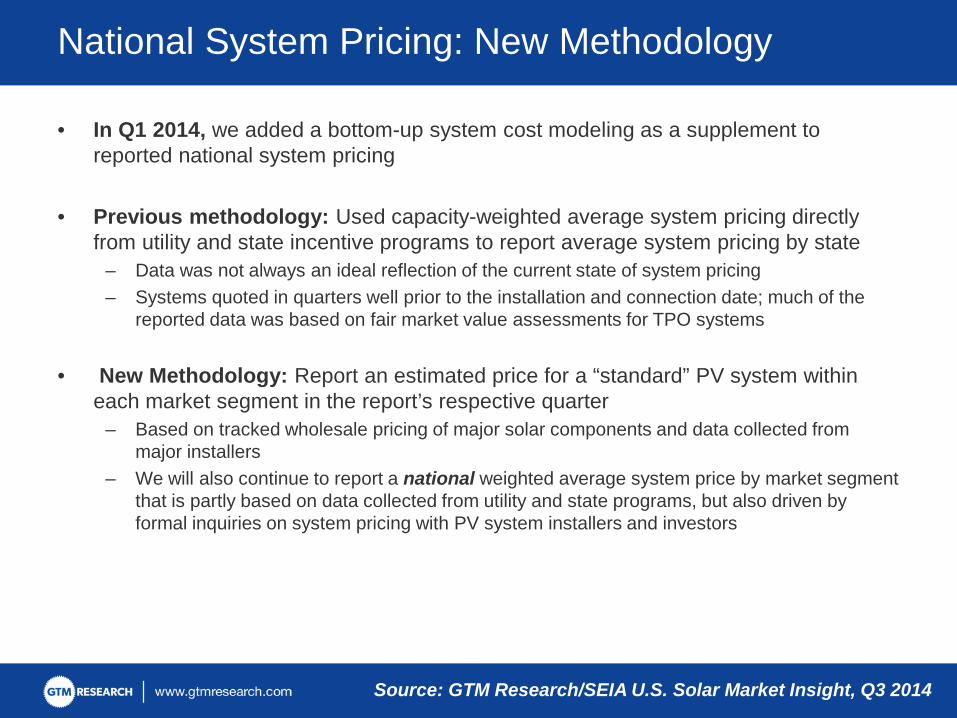
• In Q1 2014, we added a bottom-up system cost modeling as a supplement to reported national system pricing
• Previous methodology: Used capacity-weighted average system pricing directly from utility and state incentive programs to report average system pricing by state
– Data was not always an ideal reflection of the current state of system pricing – Systems quoted in quarters well prior to the installation and connection date; much of the
reported data was based on fair market value assessments for TPO systems
• New Methodology: Report an estimated price for a “standard” PV system within each market segment in the report’s respective quarter
– Based on tracked wholesale pricing of major solar components and data collected from major installers
– We will also continue to report a national weighted average system price by market segment that is partly based on data collected from utility and state programs, but also driven by formal inquiries on system pricing with PV system installers and investors
National System Pricing: New Methodology
Source: GTM Research/SEIA U.S. Solar Market Insight, Q3 2014

• Standard Residential PV System: $3.60/Wdc; down 3.6% quarter-over-quarter – Assumes a 6 kWdc system with standard crystalline silicon modules, blend of inverters, and
composite shingle roof – Best-in-class installers are achieving lower costs by leaning on high installation volumes that
allow the purchase of hardware directly from manufacturers and by amortizing overhead costs over a larger installation base.
Average Installed Price: “Standard” Residential PV System
$3.83 $3.74$3.60
$0.00
$0.50
$1.00
$1.50
$2.00
$2.50
$3.00
$3.50
$4.00
Q1 2014 Q2 2014 Q3 2014
Cost
($/W
dc)
Modules InverterElectrical BOS Structural BOSDirect Labor Engineering and PIISupply Chain, Overhead, Margin
Source: GTM Research/SEIA U.S. Solar Market Insight, Q3 2014

• Standard Commercial PV System: $2.27/Wdc; down 5% quarter-over-quarter – Assumes a 200 kW to 300 kW rooftop system, standard crystalline silicon modules, string
inverter, flat roof without obstructions – Major cost declines come from inverter and structural BOS pricing – both challenged
industries as commoditization continues to compress margins. The potential for module pricing increases as the result of tariffs on Chinese and Taiwanese module products has also led to system developers and EPCs aggressively pushing inverter and racking manufacturers to adopt lower prices.
Average Installed Price: “Standard” Commercial PV System
$2.52$2.39
$2.27
$0.00
$0.50
$1.00
$1.50
$2.00
$2.50
$3.00
Q1 2014 Q2 2014 Q3 2014
Cost
($/W
dc)
Modules InverterElectrical BOS Structural BOSDirect Labor Engineering and PIISupply Chain, Overhead, Margin
Source: GTM Research/SEIA U.S. Solar Market Insight, Q3 2014

• Standard Utility Scale PV System: $1.68/Wdc; down 0.6% over Q2 2014
– Assumes a 10 MWdc fixed tilt ground mount system with standard crystalline silicon
– Modeled costs of a fixed-tilt utility system lands at $1.68/Wdc reflecting basically steady costs
– Q3 2014 Addition: Bottom-up modeled costs for single-axis tracking systems, which come in at $1.88/Wdc
– While there are additional structural, electrical, labor and site-related costs for one-axis tracking systems, the premiums are often offset by larger gains in system performance, as well as by peak pricing mechanics. Increased competition among utility racking manufacturers entering the single-axis tracking space has driven pricing reductions of nearly 20% from the previous year.
Average Installed Price: “Standard” Utility Scale PV System
$1.77$1.69 $1.68
$0.00
$0.20
$0.40
$0.60
$0.80
$1.00
$1.20
$1.40
$1.60
$1.80
$2.00
Q1 2014 Q2 2014 Q3 2014
Cost
($/W
dc)
Modules Inverters and AC SubsystemDC Electrical BOS Structural BOSDirect Labor Engineering and PIISupply Chain, Overhead, Margin
Source: GTM Research/SEIA U.S. Solar Market Insight, Q3 2014

Thank You and Contact Info
Justin Baca, Director of Research Shawn Rumery, Research Manager
Contact: [email protected]
Cory Honeyman, Solar Analyst Contact: [email protected] Twitter: @Cory_Honeyman
For more information about purchasing the full SEIA/GTM Research U.S. Solar Market Insight: Q3 2014™ report, please visit www.gtmresearch.com/ussmi or email Justin Freedman ([email protected])

Questions
Please type your questions into the lower left corner of the window.
Click the “send” button to submit.
December 16, 2014 © 2014 Solar Energy Industries Association® 43


